Article

A Genetic Linkage Map of BC2 Population Reveals QTL Associated with Plant Architecture Traits in Lagerstroemia

1
Beijing Key Laboratory of Ornamental Plants Germplasm Innovation & Molecular Breeding, National Engineering Research Center for Floriculture, Beijing Laboratory of Urban and Rural Ecological Environment of Beijing Municipal Education Commission, College of Landscape Architecture, Beijing Forestry University, Beijing 100083, China
2
Guangdong Provincial Key Lab of Ornamental Plant Germplasm Innovation and Utilization, Environmental Horticulture Research Institute, Guangdong Academy of Agricultural Sciences, Guangzhou 510640, China
*
Author to whom correspondence should be addressed.
Forests 2021, 12(3), 322; https://doi.org/10.3390/f12030322
Submission received: 20 January 2021 / Revised: 4 March 2021 / Accepted: 5 March 2021 / Published: 10 March 2021
(This article belongs to the Section Genetics and Molecular Biology)

Abstract

:
Plant architecture improvement is of great significance in influencing crop yield, harvesting efficiency and ornamental value, by changing the spatial structure of the canopy. However, the mechanism on plant architecture in woody plants is still unclear. In order to study the genetic control of plant architecture traits and promote marker-assisted selection (MAS), a genetic linkage map was constructed, and QTL mapping was performed. In this study, using 188 BC2 progenies as materials, a genetic map of Lagerstroemia was constructed using amplification fragment length polymorphisms (AFLP) and simple sequence repeats (SSR) markers, and the QTLs of four key plant architecture traits (plant height, crown width, primary lateral branch height and internode length) were analyzed. The genetic map contains 22 linkage groups, including 198 AFLP markers and 36 SSR markers. The total length of the genome covered by the map is 1272 cM, and the average distance between markers is 6.8 cM. Three QTLs related to plant height were located in LG1, LG4 and LG17 linkage groups, and the phenotypic variation rates were 32.36, 16.18 and 12.73%, respectively. A QTL related to crown width was located in LG1 linkage group, and the phenotypic variation rate was 18.07%. Two QTLs related to primary lateral branch height were located in the LG1 and LG7 linkage groups, and the phenotypic variation rates were 20.59 and 15.34%, respectively. Two QTLs related to internode length were located in the LG1 and LG20 linkage groups, and the phenotypic variation rates were 14.86 and 9.87%. The results provide a scientific basis for finely mapping genes of plant architecture traits and marker-assisted breeding in Lagerstroemia.

1. Introduction

Plant architecture refers to the morphological characteristics of various tissues and organs of the above-ground part of the plant and their arrangement, including plant height, crown width, primary lateral branch height, internode length, etc. The formation of plant architecture is mainly determined by the layout and activities of the shoot apical meristem, axillary meristems, intercalary meristems, lateral or secondary meristem and the subsequent development of stems, leaves, branches and inflorescences [1]. Plant architecture plays an important role in crops, horticultural crops, and ornamental plants. Plant architecture is not only important for improving yield, environmental adaptability, and competitiveness, but also for enriching ornamental horticulture [2,3].
Humans have never stopped in their research and improvement of plant architecture, and the Green Revolution gene is one of the milestone discoveries. The successful application of the rice semi-dwarf gene sd1 has effectively solved the contradiction of “high yield and lodging” [4]. In addition to the sd1 gene regulating plant height by participating in gibberellin synthesis, D2 and DLT are also another important pathway for regulating plant height by participating in brassinolide synthesis [5]. Tiller is a unique research trait in rice, and its number and angle affect rice plant architecture. MOC1 is an important gene controlling rice tillers. Mutations in this gene cause rice to produce no tillers and only one main stem [6]. The up-regulated expression of TAC1 leads to an increase in tiller angle [7]. LAZY1 regulates the tiller angle of rice by regulating the polar transport of auxin [8]. The wheat green revolution gene rht leads to suppression of wheat cell elongation and shortening of the stems, inducing lodging resistance and increased yield, but it also leads to the production of a large number of ineffective tillers and light blocking and competition among the leaves [9]. Thus, people have turned to genetic improvement of ideal plant architecture varieties. The TB1 gene in maize has extremely reduced the number of branches, resulting in a species with only one main stem at present, which has become an important cultivated crop for humans [10]. With in-depth study of the ideal plant architecture of maize, it was found that too high a plant height will reduce the cultivation density and cause lodging. Only a reasonable plant height and ear height ratio can effectively increase the yield [11].
In woody plants, researchers have focused more on dwarfing, branching, and weeping. Dwarfing can improve harvesting efficiency, and the main genes controlling apple dwarfing are Co, Dw and Md [12,13,14]. Through an Agrobacterium-mediated method, researchers have successfully introduced ipt, rolA, rolB and rolC genes into apples and leading to exhibition of dwarfing traits [15,16,17]. The dwarf gene Dw from peach was accurately located within a distance of 277 kb. The results of this study will help the cloning of dwarf genes and molecular-assisted breeding of peach dwarf traits [18]. In terms of branching, MdCCD7 and MdCCD8 genes in apple can restore the multi-branched phenotype of Arabidopsis max3 and max4 to wild type [19]. The TAC1 gene, which controls the branching angle of peach, was located within 2 Mb of physical distance. The gene was successfully cloned and its function was verified in Arabidopsis [20]. The discovery of these branching genes can help increase yield and enhance ornamental effects. The weeping trait is a unique ornamental trait in woody plants, and is considered to be a completely recessive quality trait controlled by a single gene in Prunus mume Sieb. et Zucc. [21,22]. However, these studies are far from enough to study the plant architecture of woody plants.
Lagerstroemia is an important woody ornamental plant in the world, which has beautiful tree postures, bright flowers and extremely long flowering periods [23]. In addition, there are various plant architectures in Lagerstroemia. The predecessors first carried out molecular marker development [24,25,26,27,28] and genetic diversity analyses [29]. He et al. (2014) used 192 F1 progenies of L. caudate Chun et How ex S. Lee et L. Lau × L. indica Linn. “Xiang Xue Yun” to construct the first genetic map of Lagerstroemia using amplification fragment length polymorphisms (AFLP) and simple sequence repeats (SSR) markers. The map focuses on flower traits, contains 20 linkage groups and covers 1162.1 cm with a mean distance of 10.69 cm between adjacent markers.
Ye et al. (2017) [30] investigated the inheritance of plant height, internode length, and primary lateral branch height traits of Lagerstroemia by using a mixed major gene plus polygene inheritance model, internode length is a one additive-dominance major gene plus additive-dominance epistasis polygene genetic model. Plant height and primary lateral branch height are two additive-dominance-epistasis major genes plus additive-dominance-epistasis polygene genetic models. Internode length was mainly controlled by genetic factors with a low effect of environmental factors. Plant height and primary lateral branch height are mainly controlled by environmental factors. Through the development of SNP molecular markers, two markers highly related to internode length and one marker highly related to primary lateral branch height were found, which can be applied to marker-assisted selection [26]. Plant height is highly correlated with internode length, internode length was explained mainly by cell number, and secondarily by cell length and reveals the key role of auxin in cell division in the shoot apical meristem, implying that the interaction between auxin and GA4 regulates the internode length of Lagerstroemia [31]. In terms of branching, the LfiDAD2 gene may be related to the branching pattern of Lagerstroemia [3]. GA synthesis and signal transduction pathways play a role in weeping traits. When virus-induced gene silencing (VIGS) reduces the expression level of LfiGRAS1, a negative element of the GA signal, new branches grow in the infected plant in a negatively geotropic manner [8].
The variable plant architecture of Lagerstroemia is an ideal material for studying plant architecture traits of woody plants, however, there are few reports on QTL mapping of plant architecture traits, which makes it difficult to carry out more systematic and complete research. In this study, a population of 188 BC2 progenies with obvious strain segregation were selected as the mapping population and three molecular markers of AFLP, g-SSR, and EST-SSR were used to construct a genetic linkage map. In addition, QTL mapping of the plant architecture traits of Lagerstroemia, including plant height, crown width, primary lateral branch height and internode length, aims to provide a basis for the directional cultivation of Lagerstroemia.

2. Materials and Methods

2.1. Plant Materials

The F1 progenies came from a L. fauriei × L. indica “Pocomoke” cross in 2011. L. fauriei was an arbor (>3 m) with long internodes (internode length of new branches > 4 cm), and “Pocomoke” was a dwarf shrub (0.3–0.6 m) with short internodes (internode length of new branches < 1.8 cm). One progeny in F1 population was selected to backcross with “Pocomoke” to produce the BC1 population in 2013. One non-dwarf progeny in the BC1 population was used to cross with “Pocomoke” and produced 188 BC2 progenies in 2015. All the BC2 progenies were cultivated at China National Engineering Research Center for Floriculture (CNERCF) in Beijing (40°020′ N, 115°500′ E).

2.2. Phenotypic Data Collection

At the end of the vegetative stage, four traits, including plant height, crown width, primary lateral branch height, internode length were measured in 2017. Three traits (plant height, crown width and primary lateral branch height) were measured once for each individual, the methods refer to Ye et al. [26]. Plant height refers to the vertical distance between the highest point of the plant and the ground level. Primary lateral branch height refers to the vertical distance between the first branch point of the plant and the ground level. We evaluated internode length for each individual from three different orientations and selected annual branches. The crown width was measured twice and the average value of the east–west and north–south directions was taken. Data were processed using software SPSS 20.0 (SPSS, Chicago, IL, USA), and histograms of frequency were drawn.

2.3. DNA Extraction and Molecular Marker Development

The FastDNA kit (Tiangen Biotech, Beijing, China) was used to extract total genomic DNA for AFLP and SSR analysis from fresh young leaves in accordance with the manufacturer’s protocol. DNA quality and concentration were measured by 1% agarose gel electrophoresis (Gel red with 0.1 mg/mL 1× TAE buffer), and the bands were observed under ultraviolet light [32].
AFLP was performed according to the method described by He et al. (2014) [33]. A total of 921 SSR primers were synthesized based on published papers [24,25,27,34,35,36]. SSR was performed according to the method described by Ye et al. [28].

2.4. Data Analysis and Map Construction

The ABI 3730 DNA automatic sequencer was used to detect the amplified products of AFLP and SSR. GeneMarker Version1.71 (Applied Biosystems) software was used for data collection and processing. AFLP data were scored as “1” or “0” in Excel format, while SSR data were exported in fragment sizes.
The genetic map was constructed according to the operation guide of Joinmap 4.1. After importing the encoded data, the model of the drawing group was selected as the cross pollinator group, and the group command was used in the toolbar to divide all the obtained marks into different linkage groups. Linkage between two markers was declared significant in two-point linkage analyses with an LOD threshold of 2.0. The map distance was calculated using the Kosambi mapping function [37], and MapDraw was used to draw the map [38].

2.5. QTL Analysis

QTL analysis was performed using composite interval mapping (CIM) using Windows QTL Cartographer 2.5. The LOD threshold significant value was obtained using 1000 permutations of the phenotyping data. The QTL naming rules in this study are: “q” + “target traits” + “−” + “chromosome number or linkage group code” + “QTL number”. The full name of the QTL is usually presented in italics, such as qPH-4-1, indicating the first in the fourth linkage group related to plant height QTL.

3. Results

3.1. Phenotype Data Analysis

The phenotypic data statistics of 188 mapping progenies are shown in Table 1. The average plant height is 31.1 cm, the maximum is 72.0 cm, the minimum is 8.1 cm, the SD is 11.4, the variance is 130.8, the kurtosis is 0.7, the skewness is 0.39, and the CV is 36.7%. The average crown width is 44.1 cm, the maximum is 86.0 cm, the minimum is 10.3 cm, the SD is 16.6, the variance is 274.1, the kurtosis is 0.1, the skewness is −0.4, and the CV is 37.6%. The average primary lateral branch height is 6.5 cm, the maximum is 22.0 cm, the minimum is 0.2 cm, the SD is 4.6, the variance is 21.2, the kurtosis is 1.47, the skewness is 1.74, and the CV is 70.8%. The average internode length is 22.5 mm, the maximum is 34.6 mm, the minimum is 8.0 mm, the SD is 5.1, the variance is 26.0, the kurtosis is −0.24, the skewness is 0.41, and the CV is 22.7%.
Combining the frequency distribution of the four traits (Figure 1), it can be seen that the distributions of plant height, crown width, and primary lateral branch height are all left skewed, and only the distribution area of internode length tilts to the right. Therefore, the skewness of the internode length is negative, and the skewness of the other three traits is positive. From the perspective of the skewness value, the height of the primary lateral branch height is the largest, and the distribution curve is severely inclined to the left, indicating that there is a certain degree of skewness segregation for this trait in the population. The more symmetrical the distribution, the more evenly distributed the trait is in the population.
Comprehensive phenotypic trait data statistics and frequency histogram, the differences among the four trait traits are significant, the degree of separation is high, and they show continuous changes, which are in line with the characteristics of normal distribution, suitable for QTL positioning research.

3.2. Polymorphisms Revealed by Molecular Markers

Of the 384 AFLP primer combinations tested, 46 AFLP primer combinations showed highly repeatable polymorphisms, which were subsequently used to evaluate 188 F1 progenies. In AFLP analysis, the size of the AFLP fragment is between 48 and 496 bp. These 46 primer combinations produced 958 amplification products that were polymorphic, accounting for 23% of the total. Chi-square (χ2test, d.f. = 1) was used to detect the segregation of each locus. Among all loci, there were 708 that met Mendel’s 1:1 segregation ratio and 3:1 segregation ratio, accounting for 74%. The rest of the sites did not meet the chi-square test, these represent partial segregation markers and were no longer used in subsequent map construction.
SSR polymorphisms were screened for the parents and four progenies, and 118 primers were obtained with good polymorphisms. The chi-square test found that 100 pairs of primers met Mendel’s expected segregation ratio (χ2 < 0.01), and 18 primers had a partial segregation, the ratio was 15%. A total of 330 polymorphic sites were amplified by 118 SSR primers, with an average of 2.8 per primer.

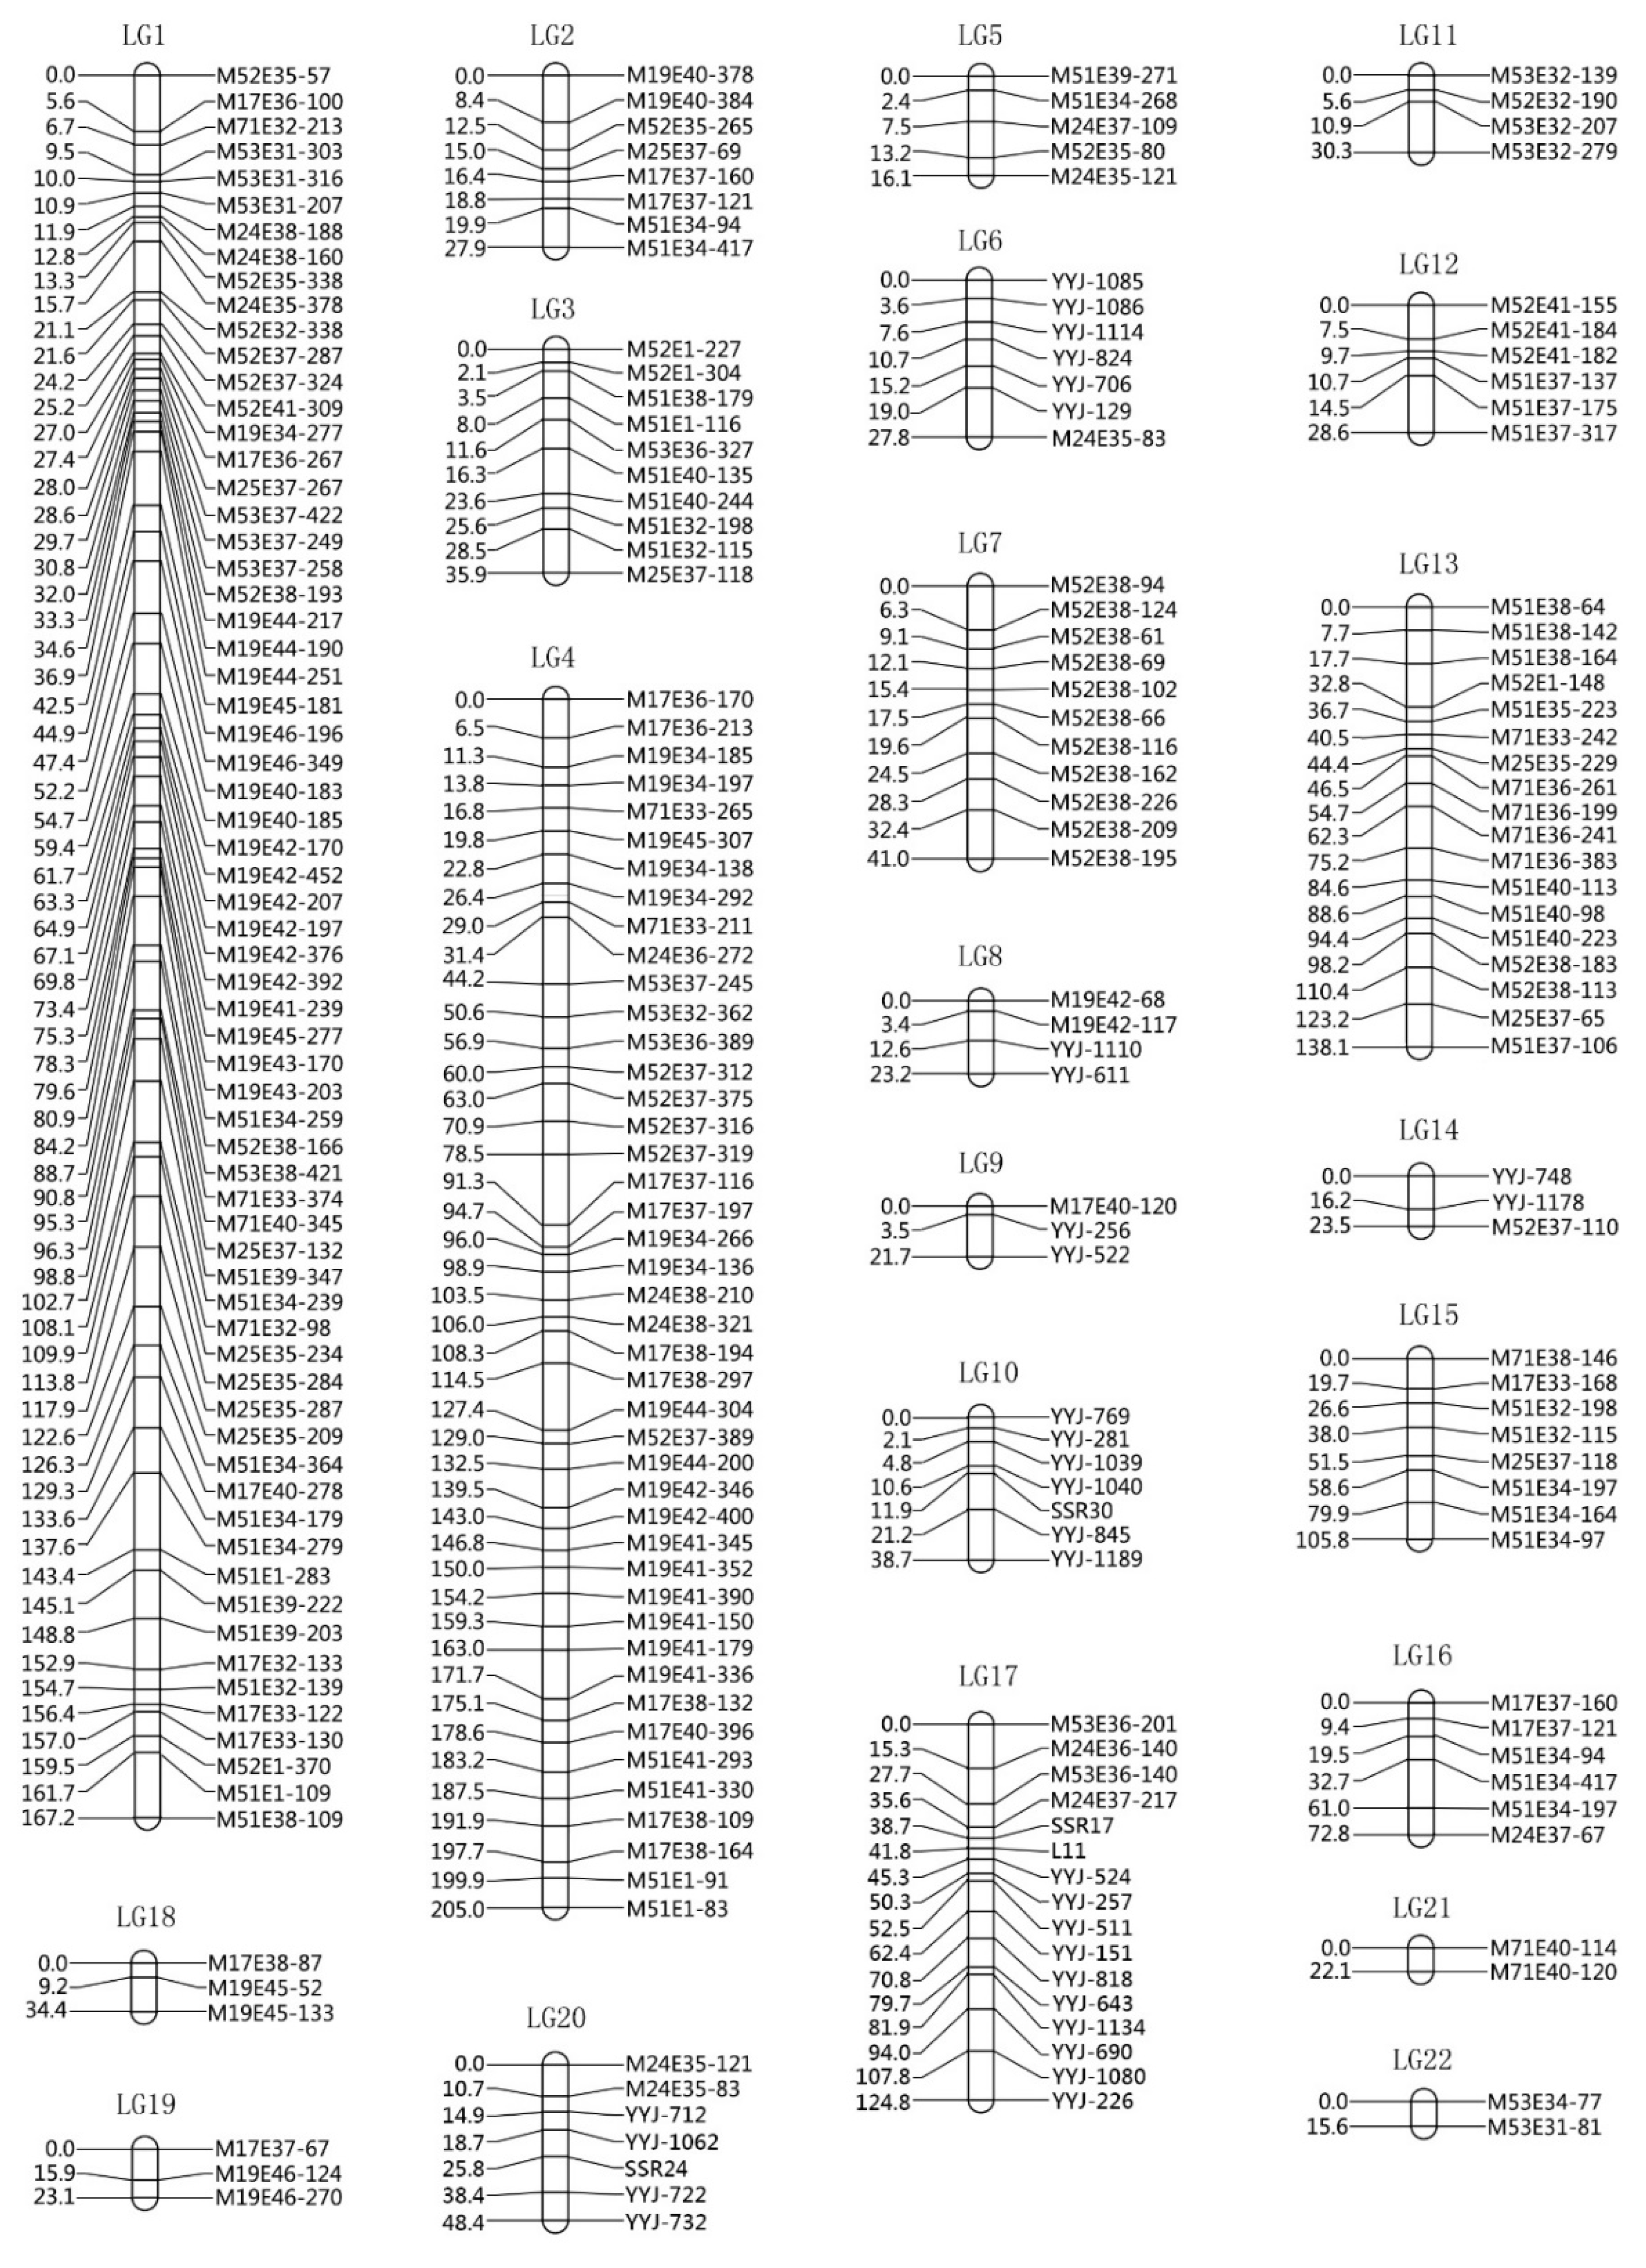
3.3. Linkage Analysis and Map Construction
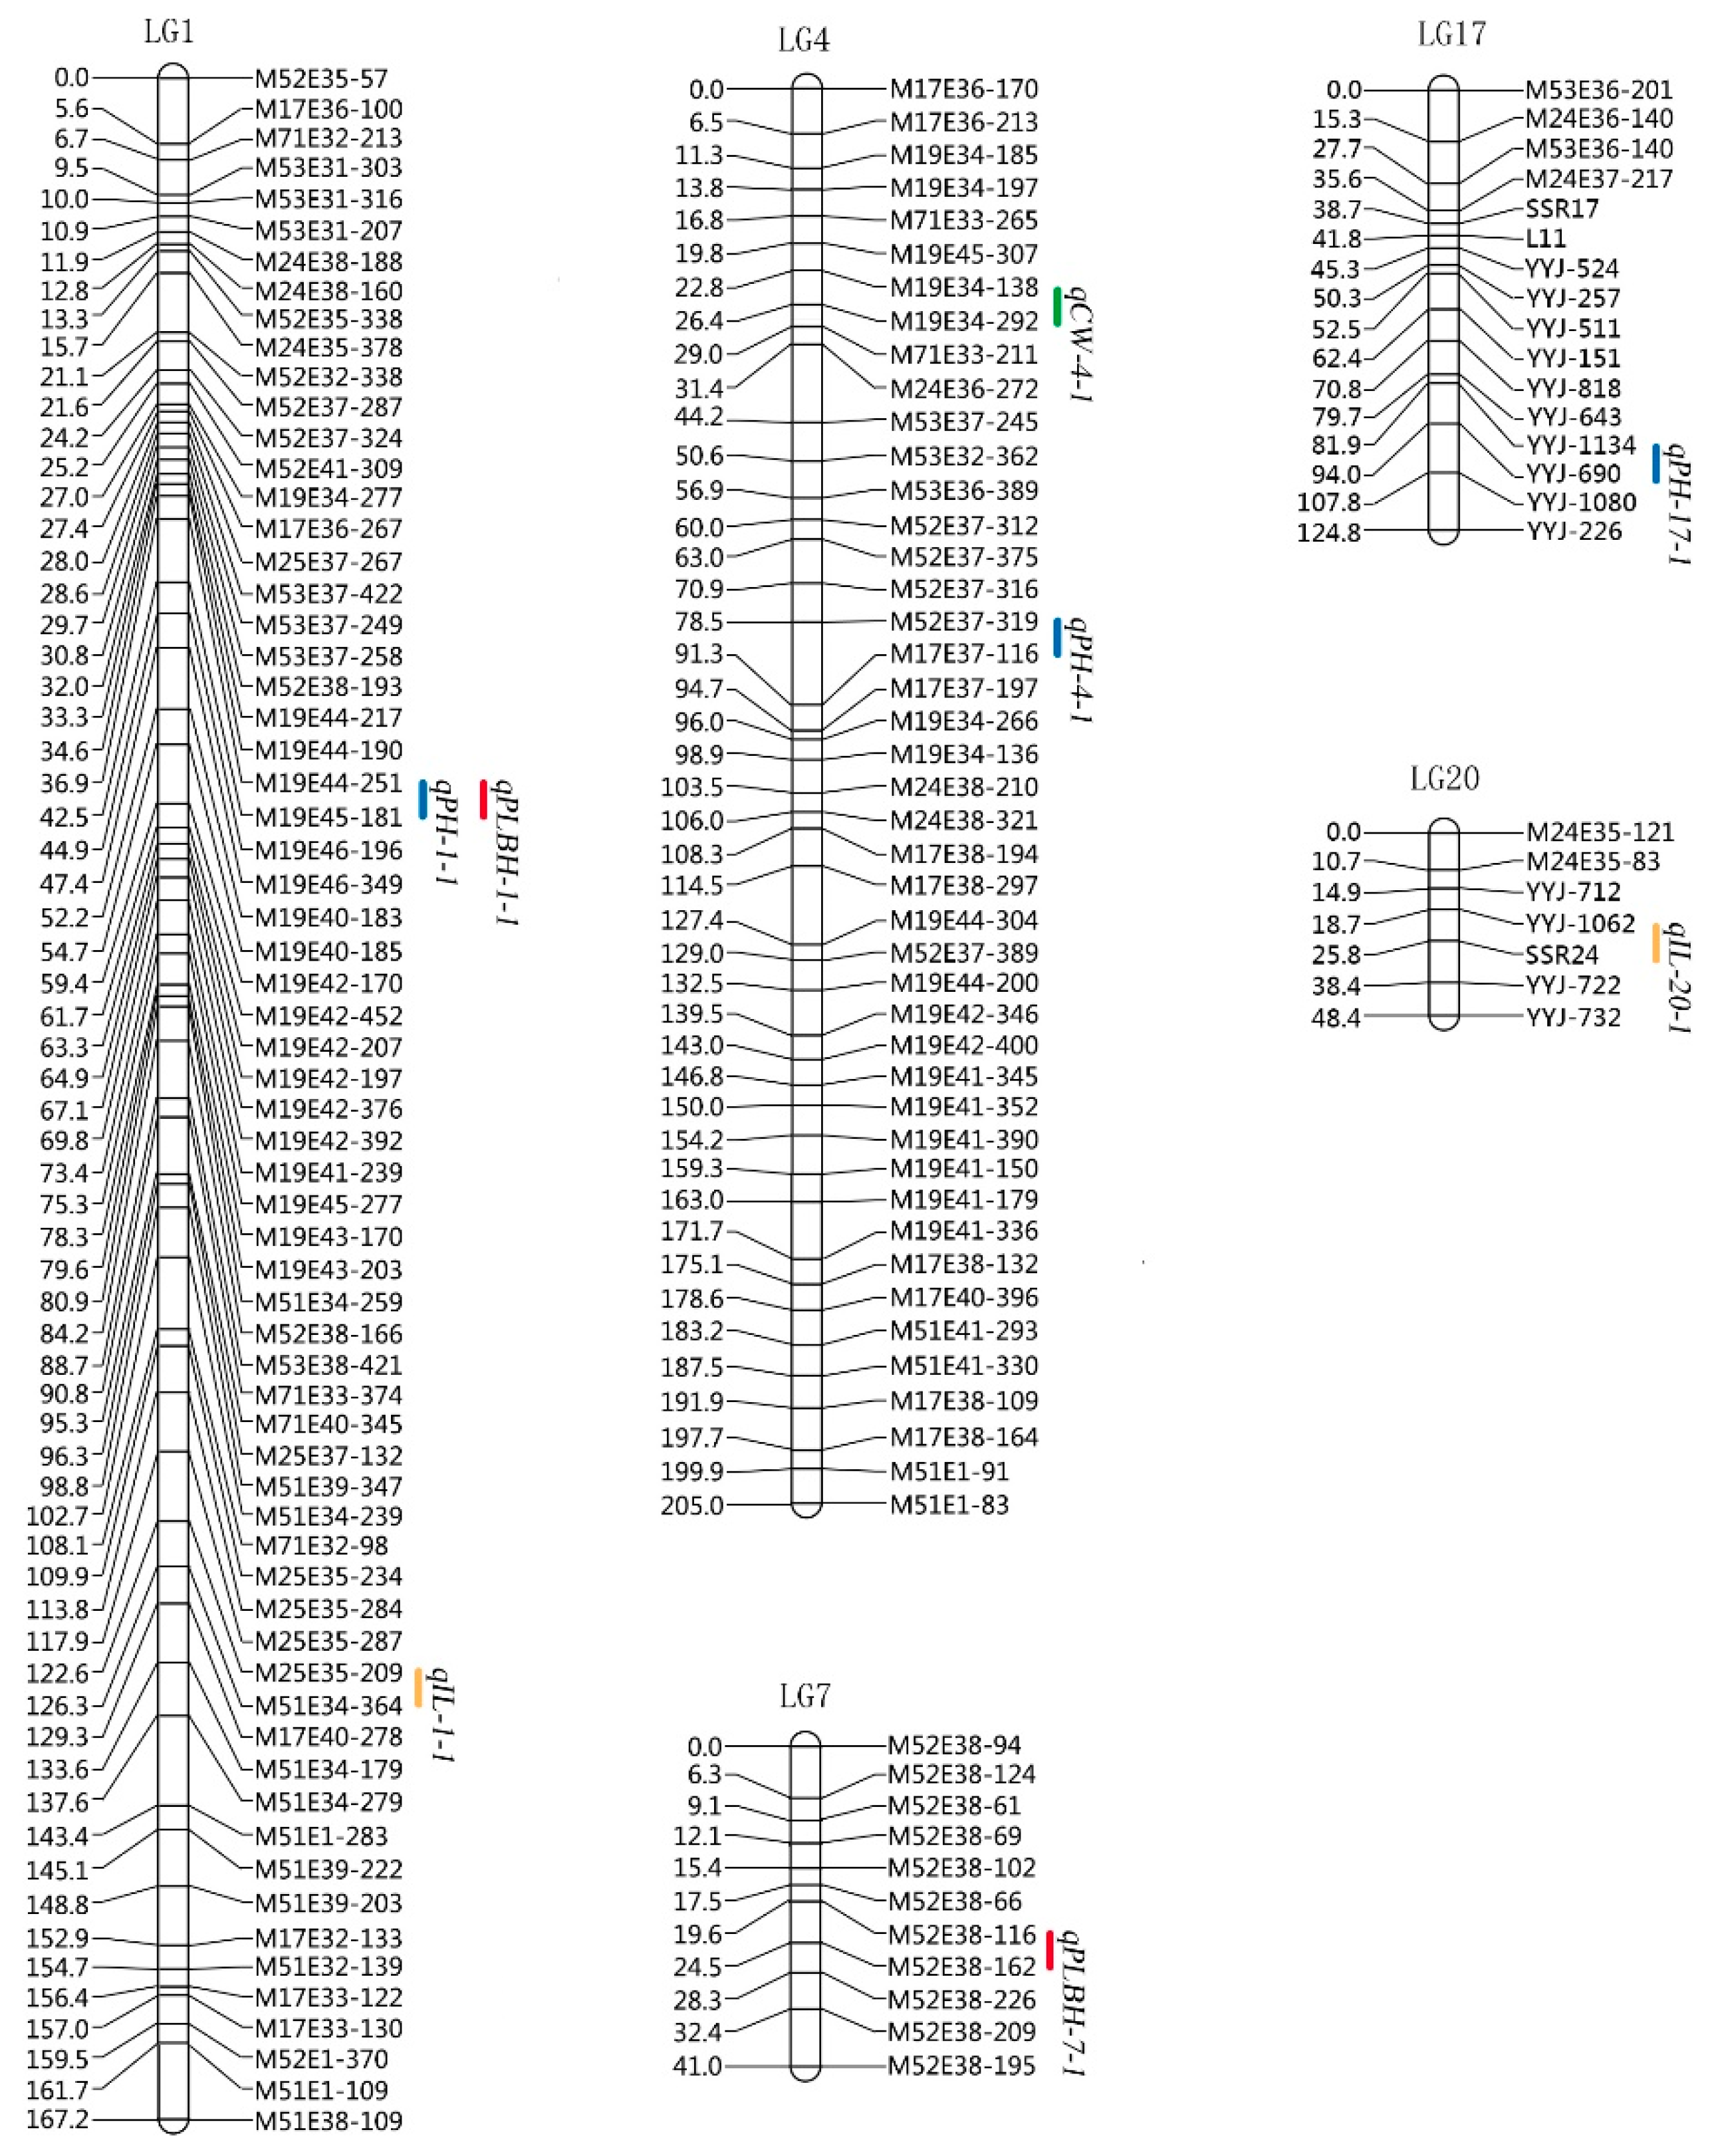
A total of 808 markers (708 AFLP and 100 SSR) were used to construct linkage maps. A total of 234 loci (198 AFLP and 36 SSR) were mapped into 22 genetic linkage groups, and the remaining 574 markers were not mapped to the link map (Figure 2, Table 2). The map covers a total genome length of 1272 cm, the longest linkage group reaches 167.2 cm, the smallest is 15.6 cm, the average linkage group length is 57.8 cm, the maximum spacing between each marker is 28.30 cm, and the minimum spacing is 0.40 cm. The average distance between them is 6.8 cm. Among all the linkage groups, four linkage groups are larger, 12 linkage groups are smaller, and there are four triplets and two diads. There are 66 markers on the largest linkage group, and only two markers on the smallest linkage group. The average number of markers in each linkage group is 11.

3.4. QTL Mapping

Using the composition interval mapping method and setting the LOD value to 2.0, a total of eight QTL sites were detected (Table 3, Figure 3).
Three QTLs related to plant height were located, namely qPH-1-1, qPH-4-1 and qPH-17-1. Among them, qPH-1-1 was located between the LG1 linkage group M19E44-251-M19E45-181 markers, the marker spacing is 38.2 cm, the LOD value is 4.2, and the phenotypic variation rate is 32.36%; qPH-4-1 was located between the LG4 linkage group M52E37-319-M17E37-116 markers, the marker spacing is 84.6 cm, the LOD value is 3.2, and the phenotypic variation rate is 16.18%; qPH-17-1 was located in the LG17 linkage group between YYJ -1134-YYJ-690 markers, the marker spacing is 83.2 cm, the LOD value is 2.9, and the interpretable phenotypic variation rate is 12.73%.
The qCW-4-1 related to crown width was located, which was located between the LG1 linkage group M19E34-138-M19E34-292 markers, the marker spacing was 23.1 cm, the LOD value was 3.6, and the phenotypic variability was explained 18.07%.
Two QTLs related to the primary lateral branch height were located, namely qPLBH-1-1 and qPLBH-7-1. Among them, qPLBH-1-1 was located between the LG1 linkage group M19E44-251-M19E45-181 markers, the marker spacing is 40.9 cm, the LOD value is 3.4, and the interpretable phenotypic variation rate is 20.59%; qPLBH-7-1 was located between LG52 linkage group M52E38-116-M52E38-162 markers, with a marker spacing of 20.7 cm, an LOD value of 2.9, and an interpretable phenotypic variation rate of 15.34%.
Two QTLs related to internode length were located, namely qIL-1-1 and qIL-20-1. Among them, qIL-1-1 is located between LG1 linkage group M25E35-209-M51E34-364 markers, the marker spacing is 123.8 cm, the LOD value is 3.1, and the phenotypic variation rate is 14.86%; qIL-20- 1 was located between the LG20 linkage group YYJ-1062-SSR24, the marker spacing is 22.6 cm, the LOD value is 2.5, and the interpretable phenotypic variation rate is 9.87%.

4. Discussion

4.1. Genetic Mapping Is an Effective Way of Gene Mapping

With the continuous development of gene sequencing technology, biological research has entered the whole genome era, but genetic linkage maps and QTL mapping are still important bridges between genes and phenotypes, and they have irreplaceable application value. A genetic linkage map is different from GWAS in that it needs to construct a mapping population. Although it takes a long time, it is more targeted for the study of traits and is an important research method for precise positioning.
In rice, the QTL controlling rice grain length and grain weight was preliminarily located through genetic maps [39], and it was located within the 7.9 Kb range of the third chromosome, and finally, the GS3 gene was located [40]. In peach, by constructing a genetic map, the candidate gene PpeMYB25 was found to control the hair of the fruit [41]. Since Peltier et al. [42] first constructed a genetic map of petunia hybrida using RAPD molecular markers and morphological markers in 1994, various ornamental plants have successively been used for research on genetic linkage maps. Abe et al. [43] used RAPD and ISSR to construct the first Asiatic hybrid lily genetic map; Sun et al. [44] constructed a genetic map of plum, with 129 SSRs and 1484 SNP markers; Yu et al. [45] constructed a genetic linkage map of tetraploid rose with the largest population so far; Fu et al. [46] developed a large number of SNPs and constructed a genetic map of Gerbera hybrida, with 20 QTLs being detected.
It can be seen that both genetic linkage and QTL mapping are effective methods for gene mapping. However, it is difficult to build populations of woody plants due to their large size, slow growth, and difficulties associated with asexual reproduction. Asexual reproduction in woody plants takes a long time, and therefore, the application of this in woody plant research is limited. Lagerstroemia is easy to hybridize, grows quickly, and has a high survival rate of asexual reproduction. It is an ideal material for genetic research on woody plant populations.

4.2. Mapping Population and Molecular Markers

The construction of a genetic linkage map must consider the genetic background of the parent material, the size of the segregating population and the characteristics of the selected molecular markers. The selection of parents of the mapping group and the size of the group play a decisive role in the mapping results. It is difficult for woody plants to construct RIL groups, such as crops and vegetables in the short term, and they are heterozygous, so the double pseudo-testcross mapping strategy is adopted for group construction. F1 [34] was constructed using L. fauriei and L. indica “Pocomoke”. After SSR molecular marker evaluation, the parents were found to be highly polymorphic at the molecular level. On this basis, high type progenies were selected as the female parent and backcrossed with L. indica “Pocomoke” to obtain the BC1 population, and then high type BC1 progenies were selected as the female parent and backcrossed with L. indica “Pocomoke” to obtain 188 BC2 progenies.
SSR markers are considered to be extremely reliable molecular markers and can be integrated with information anchor points from previously generated genetic linkage maps. Most of these markers exist in non-coding regions. AFLPs can generate more polymorphic markers without any prior knowledge of DNA sequence, and restriction sites are often distributed in the expression region of genes. Two effective polymorphic markers—due to the different mutation rates and uneven linkage disequilibrium (LD)—can capture the distribution of different genome characteristics between chromosomes, resulting in the map markers being more evenly distributed [45,47].
However, the repeatability of AFLP technology is not good, and this can easily result in partial segregation [48,49]. The emergence of this phenomenon has been widely reported, and the reasons behind it are mainly due to biological factors (population size, marker type, DNA quality, selection effect of gametes or sporophytes, free-riding effect, environmental factors, etc.) and statistical bias or errors in genotyping and scoring [45,50,51]. In this study, the segregation ratio of AFLP markers reached 26%, and the markers in the final figure of the genetic map filtered out the segregation markers, in line with the Mendelian segregation ratio.

4.3. Genetic Linkage Map

This map is the second genetic linkage map of Lagerstroemia, and the first time QTL mapping has been used to produce a genetic map for Lagerstroemia. He et al. (2014) constructed an F1 population with L. caudata and L. indica “Xiang Xue Yun”, which have large differences in floral traits, and used AFLP and SSR as markers to construct a genetic linkage with 173 markers and a distance of 1162.1 cm.
The difference with the first genetic map of Lagerstroemia is that our map focuses on the characteristics of plant architecture. Lagerstroemia covers most of the plant architecture characteristics of woody plants, including low shrubs of 0.3 m and large shrubs of more than 3 m. Therefore, we used it as a research material for studying the architecture characteristics of woody plants. Finally, a genetic linkage map with 234 markers and a length of 1272 cm was obtained. QTL mapping for plant height, primary lateral branch height, crown width and internode length was carried out, laying the foundation for the study of plant architecture traits.

4.4. QTL Mapping for Plant Architecture Traits

Research on plant architecture varies according to the characteristics of the plant itself, and these often determine its economic value. For example, tiller in rice can increase its yield [5], a reasonable ratio of plant height to ear height in corn can increase its yield [52], apple branch number and plant height affect its yield and harvest [53], plant height and the weeping trait of plum can increase its ornamental value [54]. Plant architecture research has different directions in different plants.
The progenies of the population have great differences in phenotype. The coefficient of variation of plant height, crown width, primary lateral branch height and internode length all exceed 20%, which is a trait with a high degree of variation. In addition, the frequency distributions of the four traits all show continuous changes, and there is a certain skewness on the histogram, which is approximately in line with the characteristics of the normal distribution. We believe that the reason for the skewness is that the traits of the BC2 population are more similar to those of the backcross parents.
The qPH-1-1 and qPLBH-1-1 are located in the same interval, which is consistent with the mechanism of plant height traits, that is, plant height is positively correlated with internode length [31]. This indicates that in the interval between M19E44-251 and ME19E45-181, there may be a regulatory factor that can regulate plant height by regulating the length of internodes.
Plant architecture traits are gradually formed during plant development, so they cannot be viewed from a static perspective alone. In particular, in plant height research, dynamic QTL can locate regulatory genes at different developmental stages of plants, aiding understanding the development process of plants [55]. This research will continue in this regard, and guide plant cultivation by understanding the QTL regulation of plant height dynamics.
In this study, a preliminary QTL location was carried out. In future studies, the gene location can be further accurately located by combining GWAS, BSA or encrypting the target gene interval.

5. Conclusions

Plant architecture is an important woody plant trait, but related research is still insufficient. In this study, using 188 BC2 progenies as materials, a genetic map of Lagerstroemia was constructed using AFLP and SSR markers, and the QTLs of four key plant architecture traits (plant height, crown width, primary lateral branch height and internode length) were analyzed. The genetic map contains 22 linkage groups, including 198 AFLP markers and 36 SSR markers. The total length of genome covered by the map is 1272 cM, and the average distance between markers is 6.8 cM. On this basis, further gene function verification and analysis of its molecular mechanisms are necessary.

Author Contributions

H.P. conceived the idea and supervised the project. Y.Z. (Yang Zhou), Y.Y., L.F., Y.Z. (Ye Zhang), Q.L. and J.L. performed the experiments, data analysis and wrote the manuscript. H.P., Q.Z., M.C., J.W. and T.C. participated in data analysis and assisted in writing the manuscript. All authors have read and agreed to the published version of the manuscript.

Funding

This work was supported by National Key R and D Program of China (2019YFD1001004, 2019YFD1000402), Beijing Municipal Science and Technology Project (Z181100002418006), the World-Class Discipline Construction and Characteristic Development Guidance Funds for Beijing Forestry University (2019XKJS0323). Forestry Science and Technology Innovation Special Fund Project of Jiangxi Forestry Bureau (Innovation Project [2019] No. 13).

Institutional Review Board Statement

Not applicable.

Informed Consent Statement

Not applicable.

Data Availability Statement

All data included in this study are available upon request by contact with the corresponding author.

Conflicts of Interest

The authors declare no conflict of interest.

References

  1. Wang, B.; Smith, S.M.; Li, J. Genetic regulation of shoot architecture. Annu. Rev. Plant Biol. 2018, 69, 437–468. [Google Scholar] [CrossRef]
  2. Mencuccini, M. Dwarf trees, super-sized shrubs and scaling: Why is plant stature so important? Plant Cell Environ. 2015, 38, 1–3. [Google Scholar] [CrossRef]
  3. Li, S.; Zheng, T.; Zhuo, X.; Li, Z.; Wang, J.; Cheng, T.; Zhang, Q. Isolation of the crape myrtle decreased apical dominance gene lfidad2 and characterization of its function in the control of axillary branching. Sci. Hortic. 2020, 262, 109055. [Google Scholar] [CrossRef]
  4. Peng, J.; Richards, D.E.; Hartley, N.M.; Murphy, G.P.; Devos, K.M.; Flintham, J.E.; Beales, J.; Fish, L.J.; Worland, A.J.; Pelica, F.; et al. ‘Green revolution’ genes encode mutant gibberellin response modulators. Nature 1999, 400, 256–261. [Google Scholar] [CrossRef] [PubMed]
  5. Tong, H.; Jin, Y.; Liu, W.; Li, F.; Fang, J.; Yin, Y.; Qian, Q.; Zhu, L.; Chu, C. Dwarf and low-tillering, a new member of the gras family, plays positive roles in brassinosteroid signaling in rice. Plant J. 2009, 58, 803–816. [Google Scholar] [CrossRef]
  6. Lu, F.; Ammiraju, J.S.; Sanyal, A.; Zhang, S.; Song, R.; Chen, J.; Li, G.; Sui, Y.; Song, X.; Cheng, Z.; et al. Comparative sequence analysis of monoculm1-orthologous regions in 14 oryza genomes. Proc. Natl. Acad. Sci. USA 2009, 106, 2071–2076. [Google Scholar] [CrossRef] [PubMed] [Green Version]
  7. Yu, B.; Lin, Z.; Li, H.; Li, X.; Li, J.; Wang, Y.; Zhang, X.; Zhu, Z.; Zhai, W.; Wang, X.; et al. Tac1, a major quantitative trait locus controlling tiller angle in rice. Plant J. 2007, 52, 891–898. [Google Scholar] [CrossRef]
  8. Li, S.; Zheng, T.; Zhuo, X.; Li, Z.; Li, L.; Li, P.; Qiu, L.; Pan, H.; Wang, J.; Cheng, T.; et al. Transcriptome profiles reveal that gibberellin-related genes regulate weeping traits in crape myrtle. Hortic. Res. 2020, 7, 54. [Google Scholar] [CrossRef] [Green Version]
  9. Virk, P.S.; Khush, G.S.; Peng, S. Breeding to enhance yield potential of rice at irri: The ideotype approach. Int. Rice Res. Notes 2004, 29, 5–9. [Google Scholar]
  10. Clark, R.M.; Wagler, T.N.; Quijada, P.; Doebley, J. A distant upstream enhancer at the maize domestication gene tb1 has pleiotropic effects on plant and inflorescent architecture. Nat. Genet. 2006, 38, 594–597. [Google Scholar] [CrossRef]
  11. Begna, S.; Ri, H.; Dwyer, L.; Dw, S.; Smith, D. Variability among maize hybrids differing in canopy architecture for above-ground dry matter and grain yield. Maydica 2000, 45, 135–141. [Google Scholar]
  12. Baldi, P.; Wolters, P.J.; Komjanc, M.; Viola, R.; Velasco, R.; Salvi, S. Genetic and physical characterisation of the locus controlling columnar habit in apple (malus × domestica borkh.). Mol. Breed. 2012, 31, 429–440. [Google Scholar] [CrossRef]
  13. Harrison, N.; Harrison, R.J.; Barber-Perez, N.; Cascant-Lopez, E.; Cobo-Medina, M.; Lipska, M.; Conde-Ruiz, R.; Brain, P.; Gregory, P.J.; Fernandez-Fernandez, F. A new three-locus model for rootstock-induced dwarfing in apple revealed by genetic mapping of root bark percentage. J. Exp. Bot. 2016, 67, 1871–1881. [Google Scholar] [CrossRef] [PubMed] [Green Version]
  14. Song, C.; Zhang, D.; Ma, J.; Mao, J.; Zhang, B.; Han, M. Isolation and expression analysis of mdabcb19 gene and its promoter from dwarfing apple rootstock. Acta Hortic. 2017, 44, 409–421. [Google Scholar]
  15. Trifonova, A.; Savova, D.; Ivanova, K. Agrobacterium-mediated transformation of the apple cultivar granny smith. In Progress in Temperate Fruit Breeding; Springer: Dordrecht, The Netherlands, 1994; Volume 1, pp. 343–347. [Google Scholar]
  16. Holefors, A.; Xue, Z.-T.; Welander, M. Transformation of the apple rootstock m26 with the rola gene and its influence on growth. Plant Sci. 1998, 136, 69–78. [Google Scholar] [CrossRef]
  17. Xue, Z.-T.; Holefors, A.; Welander, M. Intron splicing in 5′ untranslated region of the rola transcript in transgenic apple. J. Plant Physiol. 2008, 165, 544–552. [Google Scholar] [CrossRef] [PubMed]
  18. Lu, Z.; Niu, L.; Chagné, D.; Cui, G.; Pan, L.; Foster, T.; Zhang, R.; Zeng, W.; Wang, Z. Fine mapping of the temperature-sensitive semi-dwarf (tssd) locus regulating the internode length in peach (prunus persica). Mol. Breed. 2016, 36, 20. [Google Scholar] [CrossRef]
  19. Foster, T.M.; Ledger, S.E.; Janssen, B.J.; Luo, Z.; Drummond, R.S.M.; Tomes, S.; Karunairetnam, S.; Waite, C.N.; Funnell, K.A.; van Hooijdonk, B.M.; et al. Expression of mdccd7 in the scion determines the extent of sylleptic branching and the primary shoot growth rate of apple trees. J. Exp. Bot. 2018, 69, 2379–2390. [Google Scholar] [CrossRef] [Green Version]
  20. Dardick, C.; Callahan, A.; Horn, R.; Ruiz, K.B.; Zhebentyayeva, T.; Hollender, C.; Whitaker, M.; Abbott, A.; Scorza, R. Ppetac1 promotes the horizontal growth of branches in peach trees and is a member of a functionally conserved gene family found in diverse plants species. Plant J. 2013, 75, 618–630. [Google Scholar] [CrossRef]
  21. Sun, L.; Wang, Y.; Yan, X.; Cheng, T.; Ma, K.; Yang, W.; Pan, H.; Zheng, C.; Zhu, X.; Wang, J.; et al. Genetic control of juvenile growth and botanical architecture in an ornamental woody plant, prunus mume sieb. Et zucc. As revealed by a high-density linkage map. BMC Genet. 2014, 15 (Suppl. 1), S1. [Google Scholar] [CrossRef] [PubMed] [Green Version]
  22. Zhang, J.; Zhao, K.; Hou, D.; Cai, J.; Zhang, Q.; Cheng, T.; Pan, H.; Yang, W. Genome-wide discovery of DNA polymorphisms in mei (prunus mume sieb. Et zucc.), an ornamental woody plant, with contrasting tree architecture and their functional relevance for weeping trait. Plant Mol. Biol. Rep. 2017, 35, 37–46. [Google Scholar] [CrossRef] [PubMed] [Green Version]
  23. Cheng, F.; Sun, R.; Hou, X.; Zheng, H.; Zhang, F.; Zhang, Y.; Liu, B.; Liang, J.; Zhuang, M.; Liu, Y.; et al. Subgenome parallel selection is associated with morphotype diversification and convergent crop domestication in brassica rapa and brassica oleracea. Nat. Genet. 2016, 48, 1218–1224. [Google Scholar] [CrossRef] [PubMed]
  24. Cai, M.; Meng, R.; Pan, H.-T.; Gao, Y.-K.; Sun, M.; Song, P.; Wang, X.-F.; Zhang, Q.-X. Isolation and characterization of microsatellite markers from lagerstroemia caudata (lythraceae) and cross-amplification in other related species. Conserv. Genet. Resour. 2010, 2, 89–91. [Google Scholar] [CrossRef]
  25. Wang, J.; Dai, X.; Chen, Y.; Yang, Y.; Zhang, X.; Li, S.; Yin, T. Genomic sequencing using 454 pyrosequencing and development of an ssr primer database for lagerstroemia indica l. Plant Omics 2015, 8, 17–23. [Google Scholar]
  26. Ye, Y.; Cai, M.; Ju, Y.; Jiao, Y.; Feng, L.; Pan, H.; Cheng, T.; Zhang, Q. Identification and validation of snp markers linked to dwarf traits using slaf-seq technology in lagerstroemia. PLoS ONE 2016, 11, e0158970. [Google Scholar] [CrossRef] [PubMed] [Green Version]
  27. Ye, Y.; Feng, L.; Liang, X.; Liu, T.; Cai, M.; Cheng, T.; Wang, J.; Zhang, Q.; Pan, H. Characterization, validation, and cross-species transferability of newly developed est-ssr markers and their application for genetic evaluation in crape myrtle (Lagerstroemia spp.). Mol. Breed. 2019, 39, 26. [Google Scholar] [CrossRef]
  28. Ye, Y.J.; Liu, Y.; Cai, M.; He, D.; Shen, J.S.; Ju, Y.Q.; Bian, X.M.; Pan, H.T.; Zhang, Q.X. Screening of molecular markers linked to dwarf trait in crape myrtle by bulked segregant analysis. Genet. Mol. Res. 2015, 14, 4369–4380. [Google Scholar] [CrossRef]
  29. He, D.; Liu, Y.; Cai, M.; Pan, H.T.; Zhang, Q.X.; Wang, X.Y.; Wang, X.J. Genetic diversity of lagerstroemia (lythraceae) species assessed by simple sequence repeat markers. Genet. Mol. Res. 2012, 11, 3522–3533. [Google Scholar] [CrossRef] [PubMed]
  30. Ye, Y.-J.; Wu, J.-Y.; Feng, L.; Ju, Y.-Q.; Cai, M.; Cheng, T.-R.; Pan, H.-T.; Zhang, Q.-X. Heritability and gene effects for plant architecture traits of crape myrtle using major gene plus polygene inheritance analysis. Sci. Hortic. 2017, 225, 335–342. [Google Scholar] [CrossRef]
  31. Ju, Y.; Feng, L.; Wu, J.; Ye, Y.; Zheng, T.; Cai, M.; Cheng, T.; Wang, J.; Zhang, Q.; Pan, H. Transcriptome analysis of the genes regulating phytohormone and cellular patterning in lagerstroemia plant architecture. Sci. Rep. 2018, 8, 15162. [Google Scholar] [CrossRef] [PubMed] [Green Version]
  32. Zhu, R.R.; Gao, Y.K.; Xu, L.J.; Zhang, Q.X. Genetic diversity of aquilegia (ranunculaceae) species and cultivars assessed by aflps. Genet. Mol. Res. 2011, 10, 817–827. [Google Scholar] [CrossRef]
  33. He, D.; Liu, Y.; Cai, M.; Pan, H.; Zhang, Q.; Debener, T. The first genetic linkage map of crape myrtle (lagerstroemia) based on amplification fragment length polymorphisms and simple sequence repeats markers. Plant Breed. 2014, 133, 138–144. [Google Scholar] [CrossRef]
  34. Liu, Y.; He, D.; Cai, M.; Tang, W.; Li, X.Y.; Pan, H.T.; Zhang, Q.X. Development of microsatellite markers for lagerstroemia indica (lythraceae) and related species. Appl. Plant Sci. 2013, 1, 1200203. [Google Scholar] [CrossRef]
  35. Zhang, E.; Wang, P.; Li, Y.; Wang, S.; Li, L.; Yang, R. Development and utility of est-ssr markers in lagerstroemia indica. North. Hortic. 2016, 40, 107–111. [Google Scholar]
  36. Wang, X.; Dean, D.; Wadl, P.; Hadziabdic, D.; Scheffler, B.; Rinehart, T.; Cabrera, R.; Trigiano, R. Development of microsatellite markers from crape myrtle (Lagerstroemia L.). HortScience 2010, 45, 842–844. [Google Scholar] [CrossRef] [Green Version]
  37. Kosambi, D.D. The estimation of map distances from recombination values. Ann. Eugen. 1944, 12, 172–175. [Google Scholar] [CrossRef]
  38. Liu, R.-H.; Meng, J.-L. MapDraw: A microsoft excel macro for drawing genetic linkage maps based on given genetic linkage data. Yi Chuan Hered. 2003, 25, 317–321. [Google Scholar]
  39. Xing, Z.; Tan, F.; Hua, P.; Sun, L.; Xu, G.; Zhang, Q. Characterization of the main effects, epistatic effects and their environmental interactions of qtls on the genetic basis of yield traits in rice. Theor. Appl. Genet. 2002, 105, 248–257. [Google Scholar] [CrossRef] [PubMed]
  40. Fan, C.; Xing, Y.; Mao, H.; Lu, T.; Han, B.; Xu, C.; Li, X.; Zhang, Q. Gs3, a major qtl for grain length and weight and minor qtl for grain width and thickness in rice, encodes a putative transmembrane protein. Theor. Appl. Genet. 2006, 112, 1164–1171. [Google Scholar] [CrossRef] [PubMed]
  41. Vendramin, E.; Pea, G.; Dondini, L.; Pacheco, I.; Dettori, M.T.; Gazza, L.; Scalabrin, S.; Strozzi, F.; Tartarini, S.; Bassi, D.; et al. A unique mutation in a myb gene cosegregates with the nectarine phenotype in peach. PLoS ONE 2014, 9, e90574. [Google Scholar] [CrossRef] [PubMed] [Green Version]
  42. Peltier, D.; Farcy, E.; Dulieu, H.; Berville, A. Origin, distribution and mapping of rapd markers from wildpetunia species inpetunia hybrida hort lines. Theor. Appl. Genet. 1994, 88, 637–645. [Google Scholar] [CrossRef]
  43. Abe, H.; Nakano, M.; Nakatsuka, A.; Nakayama, M.; Koshioka, M.; Yamagishi, M. Genetic analysis of floral anthocyanin pigmentation traits in asiatic hybrid lily using molecular linkage maps. Theor. Appl. Genet. 2002, 105, 1175–1182. [Google Scholar] [CrossRef]
  44. Sun, L.; Yang, W.; Zhang, Q.; Cheng, T.; Pan, H.; Xu, Z.; Zhang, J.; Chen, C. Genome-wide characterization and linkage mapping of simple sequence repeats in mei (prunus mume sieb. Et zucc.). PLoS ONE 2013, 8, e59562. [Google Scholar] [CrossRef] [PubMed] [Green Version]
  45. Yu, C.; Luo, L.; Pan, H.; Guo, X.; Wan, H.; Zhang, Q. Filling gaps with construction of a genetic linkage map in tetraploid roses. Front. Plant Sci. 2014, 5, 796. [Google Scholar] [CrossRef] [PubMed] [Green Version]
  46. Fu, Y.; van Silfhout, A.; Shahin, A.; Egberts, R.; Beers, M.; van der Velde, A.; van Houten, A.; van Tuyl, J.M.; Visser, R.G.F.; Arens, P. Genetic mapping and qtl analysis of botrytis resistance in gerbera hybrida. Mol. Breed. 2017, 37, 13. [Google Scholar] [CrossRef] [Green Version]
  47. Du, Q.; Pan, W.; Xu, B.; Li, B.; Zhang, D. Polymorphic simple sequence repeat (ssr) loci within cellulose synthase (ptocesa) genes are associated with growth and wood properties in populus tomentosa. New Phytol. 2013, 197, 763–776. [Google Scholar] [CrossRef]
  48. Behrend, A.; Borchert, T.; Spiller, M.; Hohe, A. Aflp-based genetic mapping of the “bud-flowering” trait in heather (calluna vulgaris). BMC Genet. 2013, 14, 64. [Google Scholar] [CrossRef] [PubMed] [Green Version]
  49. Chen, M.M.; Feng, F.; Sui, X.; Han, S. Genetic linkage maps of pinus koraiensis sieb. Et zucc. Based on aflp markers. Afr. J. Biotechnol. 2010, 9, 5659–5664. [Google Scholar]
  50. Haanstra, J.P.W.; Wye, C.; Verbakel, H.; Meijer-Dekens, F.; van den Berg, P.; Odinot, P.; van Heusden, A.W.; Tanksley, S.; Lindhout, P.; Peleman, J. An integrated high-density rflp-aflp map of tomato based on two lycopersicon esculentum×l. Pennellii f2 populations. Theor. Appl. Genet. 1999, 99, 254–271. [Google Scholar] [CrossRef]
  51. Lu, J.-J.; Zhao, H.-Y.; Suo, N.-N.; Wang, S.; Shen, B.; Wang, H.-Z.; Liu, J.-J. Genetic linkage maps of dendrobium moniliforme and d. Officinale based on est-ssr, srap, issr and rapd markers. Sci. Hortic. 2012, 137, 1–10. [Google Scholar] [CrossRef]
  52. Khush, G.S. Green revolution: Preparing for the 21st century. Genome 1999, 42, 646–655. [Google Scholar] [CrossRef]
  53. Kenis, K.; Keulemans, J. Study of tree architecture of apple (malus × domestica borkh.) by qtl analysis of growth traits. Mol. Breed. 2007, 19, 193–208. [Google Scholar] [CrossRef]
  54. Zhang, J.; Zhang, Q.; Cheng, T.; Yang, W.; Pan, H.; Zhong, J.; Huang, L.; Liu, E. High-density genetic map construction and identification of a locus controlling weeping trait in an ornamental woody plant (prunus mume sieb. Et zucc). DNA Res. 2015, 22, 183–191. [Google Scholar] [CrossRef] [Green Version]
  55. Du, Q.; Yang, X.; Xie, J.; Quan, M.; Xiao, L.; Lu, W.; Tian, J.; Gong, C.; Chen, J.; Li, B.; et al. Time-specific and pleiotropic quantitative trait loci coordinately modulate stem growth in populus. Plant Biotechnol. J. 2019, 17, 608–624. [Google Scholar] [CrossRef] [PubMed] [Green Version]
Figure 1. Frequency distribution of plant height, crown width, primary lateral branch height and internode length.
Forests 12 00322 g001
Figure 2. The genetic linkage map of Lagerstroemia derived from the BC2 populations. Map distances are shown in cm on the left of each linkage group and molecular markers are on the right side of each linkage group.
Forests 12 00322 g002
Figure 3. The results of the QTL test for the plant architecture traits. The right side shows the QTL name.
Forests 12 00322 g003
Table 1. Descriptive statistics of the four traits in the mapping population.
TraitMeanMaxMinSDVarianceSkewnessKurtosisCV
Plant height/cm31.172.08.111.4130.80.390.736.70%
Crown width/cm44.186.010.316.6274.1−0.40.137.6%
Primary lateral branch height/cm6.522.00.24.621.21.741.4770.80%
Internode length/mm22.534.68.05.126.00.41−0.2422.70%
Table 2. Markers on the different linkage of the genetic maps in Largerstroemia.
Linkage GroupMarkers NumberNumber of Gaps Greater than 20 cmTotal (cm)Max (cm)Min (cm)Average (cm)
LG1660167.25.80.42.53
LG28027.98.41.13.49
LG310035.97.41.43.59
LG4440205.012.91.34.66
LG55016.15.72.43.22
LG67027.88.83.13.97
LG711041.08.62.13.73
LG84023.210.63.45.80
LG93021.718.23.57.23
LG107038.717.51.35.53
LG114030.319.45.37.58
LG126028.614.11.04.77
LG13180138.115.12.17.67
LG143023.516.26.97.83
LG1581105.825.97.3813.23
LG166172.828.39.412.13
LG17160124.817.02.27.80
LG183134.425.29.211.47
LG193023.115.97.27.70
LG207048.412.63.96.91
LG212122.122.122.111.05
LG222015.615.615.67.80
Average110.7557.815.15.16.80
Table 3. QTLs controlling the four traits examined by composite interval mapping.
TraitQTL LociLinkage GroupMarker IntervalPositionLOD ThresholdVariation Explained
Plant heightqPH-1-1LG1M19E44-251-M19E45-18138.24.232.36
qPH-4-1LG4M52E37-319-M17E37-11684.63.216.18
qPH-17-1LG17YYJ-1134-YYJ-69083.22.912.73
Crown widthqCW-4-1LG4M19E34-138-M19E34-29223.13.618.07
Primary lateral branch heightqPLBH-1-1LG1M19E44-251-M19E45-18140.93.420.59
qPLBH-7-1LG7M52E38-116-M52E38-16220.72.915.34
Internode lengthqIL-1-1LG1M25E35-209-M51E34-364123.83.114.86
qIL-20-1LG20YYJ-1062-SSR2422.62.59.87
Publisher’s Note: MDPI stays neutral with regard to jurisdictional claims in published maps and institutional affiliations.

