Article

Transcriptome Analysis of Ginkgo biloba L. Leaves across Late Developmental Stages Based on RNA-Seq and Co-Expression Network

1
Guangdong Laboratory for Lingnan Modern Agriculture, Genome Analysis Laboratory of the Ministry of Agriculture and Rural Area, Agricultural Genomics Institute at Shenzhen, Chinese Academy of Agricultural Sciences, Shenzhen 518120, China
2
Co-Innovation Center for Sustainable Forestry in Southern China, Nanjing Forestry University, Nanjing 210037, China
*
Author to whom correspondence should be addressed.
Forests 2021, 12(3), 315; https://doi.org/10.3390/f12030315
Submission received: 5 January 2021 / Revised: 28 February 2021 / Accepted: 4 March 2021 / Published: 8 March 2021
(This article belongs to the Special Issue Current Applications of Genetics to Forestry)

Abstract

:
The final size of plant leaves is strictly controlled by environmental and genetic factors, which coordinate cell expansion and cell cycle activity in space and time; however, the regulatory mechanisms of leaf growth are still poorly understood. Ginkgo biloba is a dioecious species native to China with medicinally and phylogenetically important characteristics, and its fan-shaped leaves are unique in gymnosperms, while the mechanism of G. biloba leaf development remains unclear. In this study we studied the transcriptome of G. biloba leaves at three developmental stages using high-throughput RNA-seq technology. Approximately 4167 differentially expressed genes (DEGs) were obtained, and a total of 12,137 genes were structure optimized together with 732 new genes identified. More than 50 growth-related factors and gene modules were identified based on DEG and Weighted Gene Co-expression Network Analysis. These results could remarkably expand the existing transcriptome resources of G. biloba, and provide references for subsequent analysis of ginkgo leaf development.

1. Introduction

Ginkgo biloba is the only surviving species of the Ginkgopsida, and is widely regarded as a ‘living fossil’, which could date back 280 million years ago [1]. In addition to its special evolutionary status, Ginkgo biloba Extract (GBE), sourced from its leaves, is also one of the best-selling traditional Chinese medicine reagents worldwide with huge economic benefits due to its rich secondary metabolites, including significant flavonoids and terpenoids [2]. GBE is mainly used for the improvement of blood circulation, cardiovascular conditions, and is efficient for the treatment of Alzheimer’s disease [3,4,5]. At present, GBE is still obtained entirely from the extraction of active components from G. biloba leaves; however, the growth mechanism of ginkgo leaves has not yet been studied. Some studies have shown that leaf growth-related expression modules are relatively similar in monocotyledons and dicotyledons; few relevant results have been found in gymnosperms [6].
Leaf growth is a complex process with many similarities among different plant species, showing a certain degree of conservatism. There are two successive stages of leaf growth: the cell proliferation stage, during which cells divide, and the stage of cell expansion when cell volume increases. The interaction between cell division and cell expansion determines the final leaf size [7]. All the primordial cells begin to divide when the leaf emerges from the meristem of the stem tip. After a few days, the cells at the tip of the leaf stopped dividing and began to elongate, marking the start of cell expansion. In Arabidopsis thaliana, the cell growth pattern is dispersed, and the mature leaves are round with reticulate veins [8]. Despite being gymnosperms, the unique fan-shaped leaves of G. biloba are significantly different from those of other plants, especially coniferous species with needle leaves.
Although several studies have been conducted on angiosperms, including maize, rice, and Arabidopsis [9,10,11]; and the development of kernels and rooted chichi in G. biloba have been studied as well [12,13], there has been no relevant research on the molecular mechanism of G. biloba leaf growth. In this study, transcriptome sequencing was performed on several continuously developed leaves of G. biloba to address the changes in gene expression in order to determine the molecular processes active in leaf development, which could lay a foundation for the developmental biology research in G. biloba leaves.

2. Materials and Methods

2.1. Plant Materials, RNA Extraction, and Library Construction

Ginkgo trees generally grow new leaf buds in May; the leaves turn yellow in October and start to fall in November. Mature fresh leaves were collected from three Ginkgo trees, including one female and two male samples, across three successive developmental stages (18 June, 15 August, and 15 October, respectively) on the Nanjing Forestry University campus (Figure 1). After the collection of 9 samples, these tissues were immediately frozen in liquid nitrogen and stored at −80 °C until RNA extraction. Total RNA was extracted with Trizol method. This method was based on anhydrous ethanol, chloroform, 1.5 mL Eppendorf tube (RNASE-free), together with an ultra-high speed centrifuge. RNA concentration was measured using NanoDrop 2000 (Thermo Scientific, Waltham, MA, United States). RNA integrity was assessed using the RNA Nano 6000 Assay Kit of the Agilent Bioanalyzer 2100 system (Agilent Technologies, Santa Clara, CA, USA). RNA integrity was confirmed by 1% agarose gel electrophoresis (Figure S1). The total amount of RNA in each sample was 1 ug, which was used as the input material to prepare RNA samples. According to the manufacturer’s suggestion, the Illumina (NEB, MA, Ipswich, USA) NEBNext Ultra™ RNA Library preparation kit was used to generate the sequencing library and an index code was added to the property sequence of each sample.
In brief, mRNA was purified from total RNA using poly-T oligo-attached magnetic beads. In the NEBNext First Strand Synthesis Reaction Buffer (5X), divalent cations were used for fragmentation at elevated temperatures. The first strand cDNA was synthesized by random hexamer primers and M-MuLV reverse transcriptase. Then, DNA polymerase I and RNase H were used to synthesize the second strand of cDNA. After the 3 ‘end of the DNA fragment was adenized, the NEBNext connector with hairpin ring structure was ligated for hybridization. Library fragments were purified using the AMPure XP system (Beckman Coulter, Beverly, USA) to preferentially select cDNA fragments of 240 bp length as the insertion size. Then, 3 ug USER enzyme (NEB, USA) and the cDNA connected with the connector were used for 15 min at 37 °C and 5 min at 95 °C, followed by PCR. High-fidelity DNA polymerase, general PCR primers, and index(X) primers were used for PCR. Finally, PCR products were purified (AMPure XP system), and library quality evaluation was conducted on Agilent Bioanalyzer2100 system.

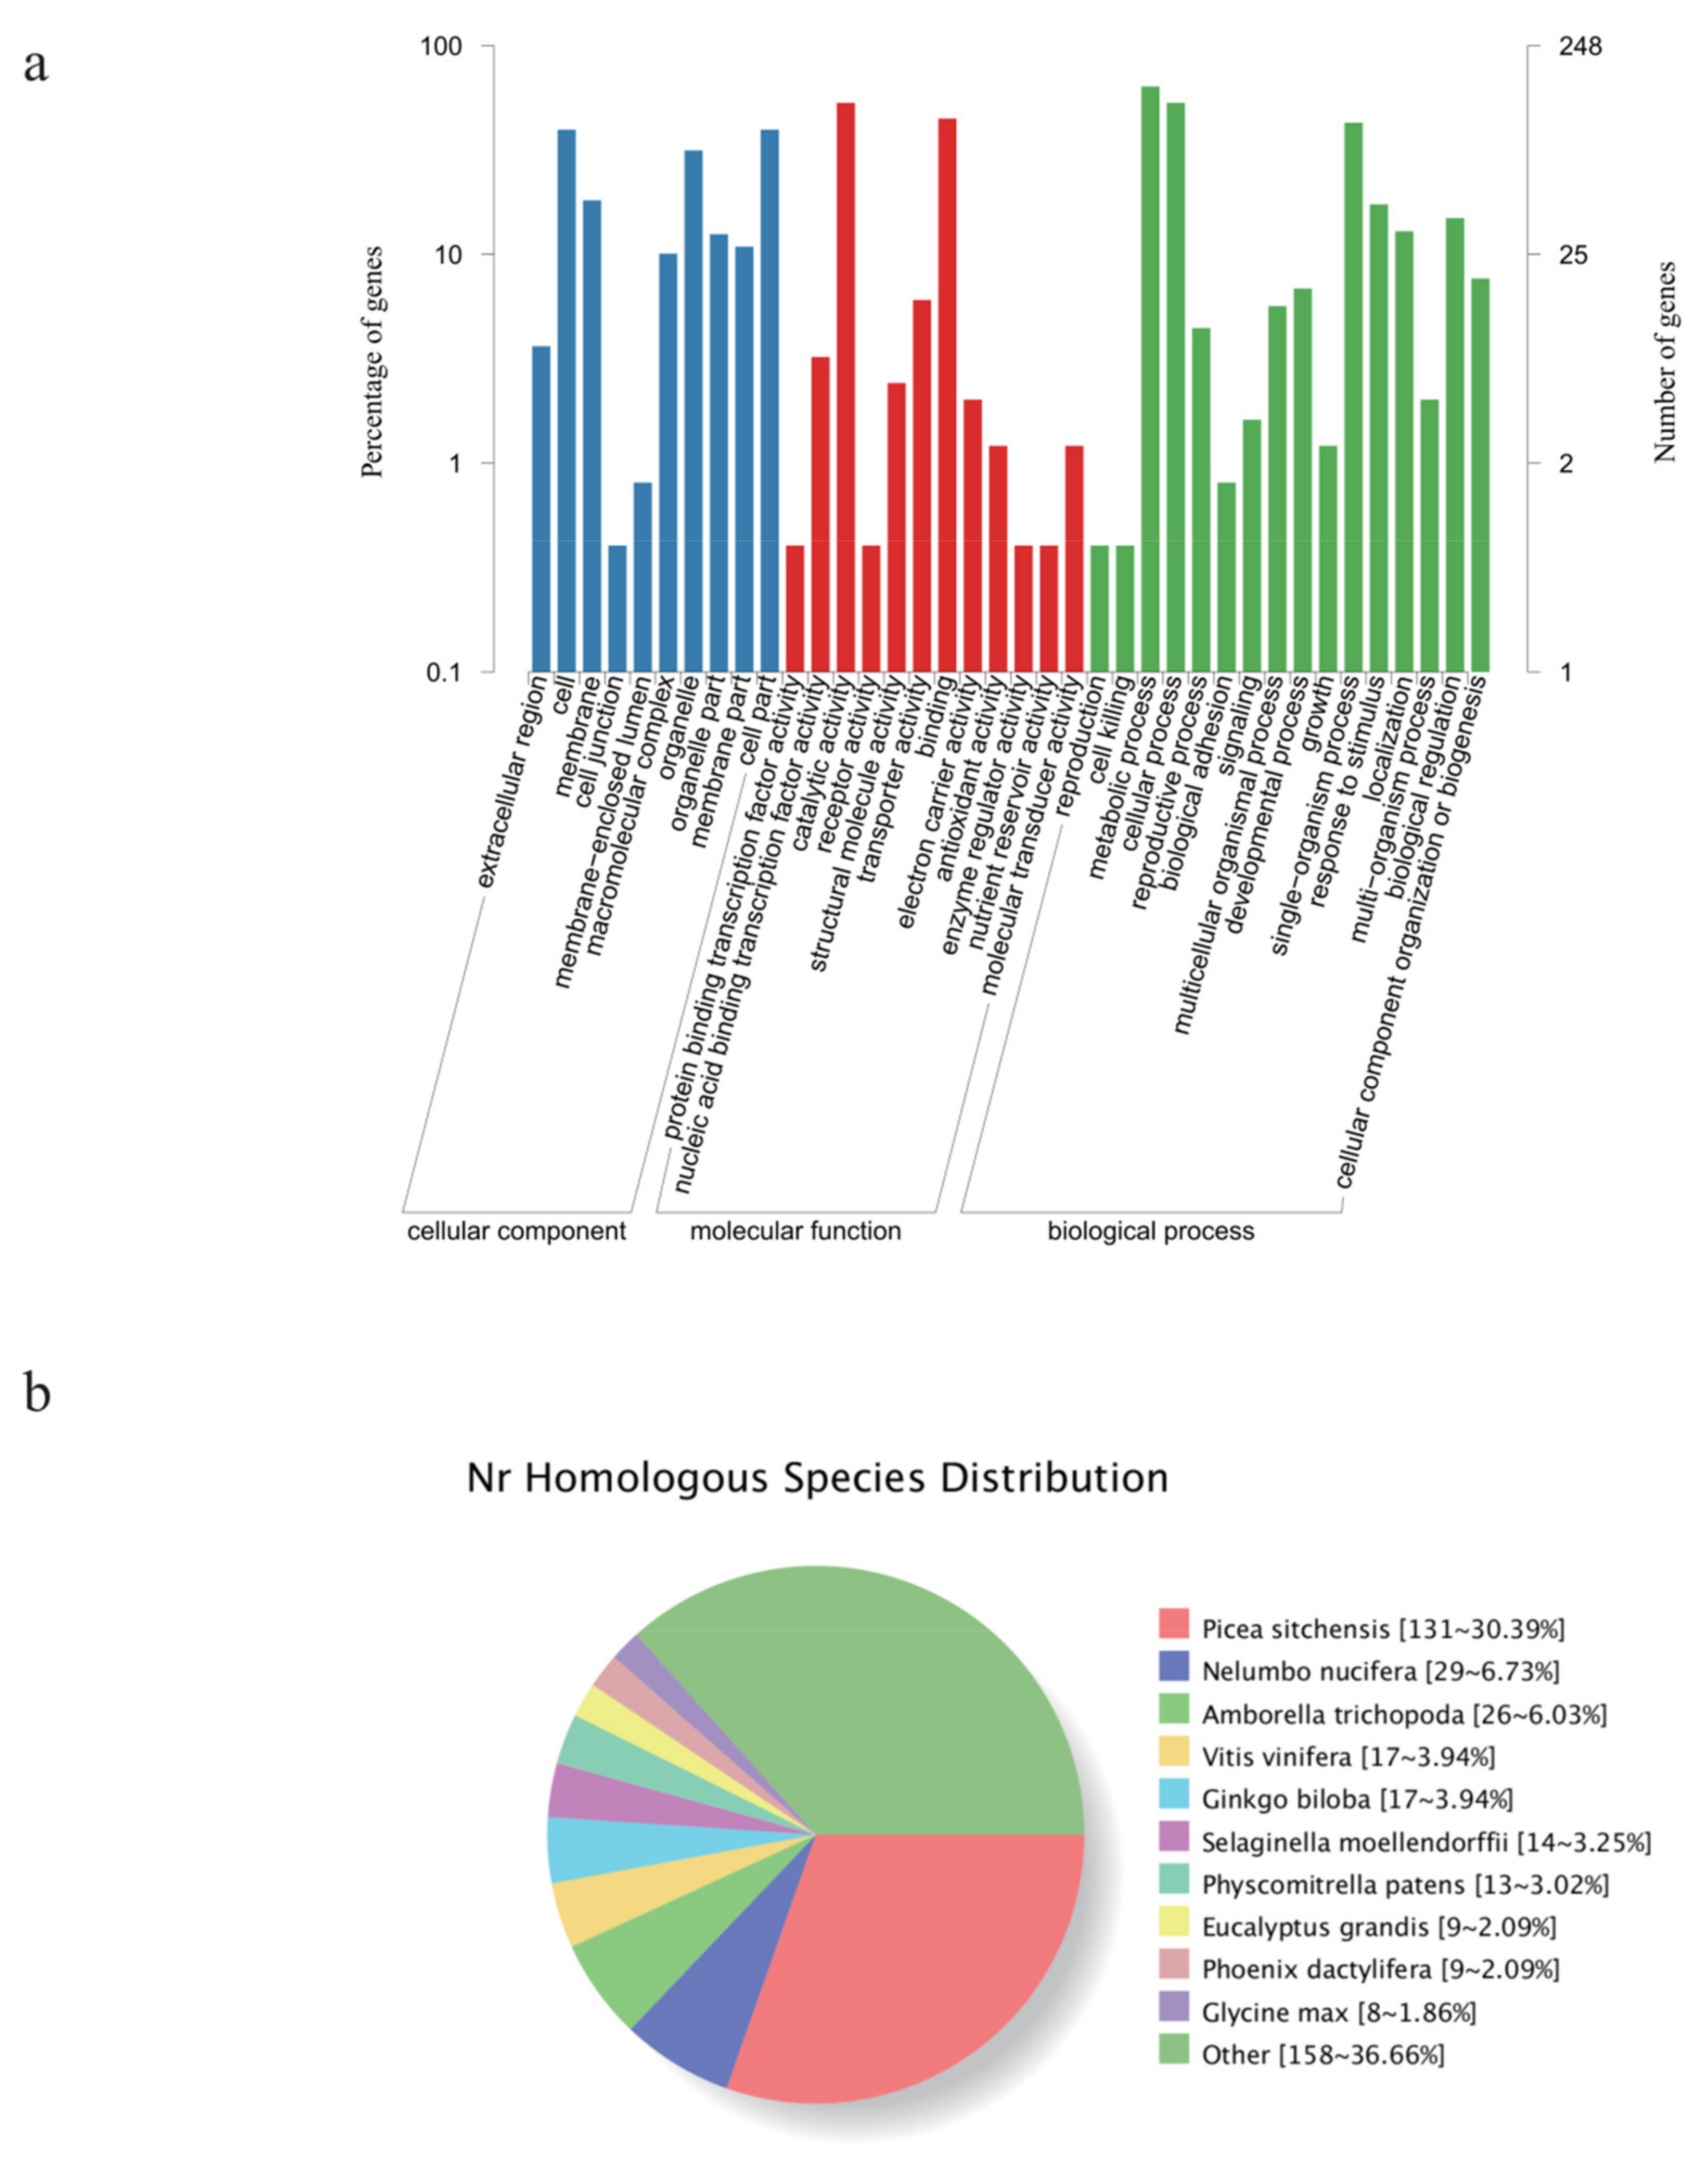
2.2. Sequencing, Assembly, and Annotation

The clustering of the index-coded samples was performed on a cBot Cluster Generation System using TruSeq PE Cluster Kit v4-cBot-HS (Illumina) according to the manufacturer’s instructions. After cluster generation, the library preparations were sequenced on the Illumina HiSeq X Ten platform and paired-end reads were generated. Clean reads were obtained by removing adapter-containing, poly-N, and low-quality reads from the raw data. Furthermore, the Q20, Q30, and GC content of the clean data was calculated. All downstream analyses were based on high-quality clean data and be aligned to the reference genome (PRJNA307642) with Tophat2 (parameters: -N 5 -p 30 -i 20) [14]. The reference genome is 10.61 Gb in length, with N50 values of 48.2 Kb for contigs and 1.36 Mb for scaffolds, respectively [15].
The transcripts of each gene with the longest length were selected as unigenes. All assembled unigenes were searched against the Nr (NCBI-non-redundant protein sequences) database using the BLAST algorithm to study the functions of mRNA and identified homologs of genes with known functions [16]. The best gene ontology (GO) terms acquired were searched against the Nr database using Blast2GO [17]. The assembled unigenes were also searched against the NT (NCBI nucleotide sequences), Pfam (Protein family), KOG (euKaryotic Ortholog Groups)/COG (Clusters of Orthologous Groups of proteins), Swiss-Prot (a manually annotated and reviewed protein sequence database), and KEGG (Kyoto Encyclopedia of Genes and Genomes) Orthology databases to find and predict functional classifications and molecular pathways.

2.3. SNP Calling and Differential Analysis

Before sorting and removing duplicates, SAMtools fixmate was first used to fix and fill in mate information. Then, Picard-tools v1.41 and SAMtools v0.1.18 were used to sort, remove duplicated reads, and merge the bam alignment results for each sample. GATK2 software was used to perform SNP calling [18]. The original vcf files were filtered with GATK standard filtering method (clusterWindowSize: 10) and only SNPs with a distance greater than 5 were retained. The exclusion standards of variants were set as follows: MQ0 > 4 and (MQ0/(1.0 × DP) > 0.1; QUAL < 10.0; QUAL < 30.0 and QD < 5.0 or HRun > 5).
Gene expression is temporally and spatially specific. Under two different conditions, genes or transcripts with significantly different expression levels are regarded as differentially expressed genes (DEGs) or differentially expressed transcripts (DETs). Transcript re-construction and quantification of gene expression levels were estimated by fragments per kilobase of transcript per million fragments mapped (FPKM) based on StringTie [19]. StringTie was utilized without -e parameter at first in each sample in order to obtain the annotation information of novel transcripts. Afterwards, all gene transfer format (gtf) files generated from each sample were merged into a total gtf file, and then -e parameter was used when calculating the normalized expression values across different samples.
DEseq2 software package (v1.10.1) was then applied for differential expression analysis [20]. DEseq2 provides statistical routines to determine differentially expressed digital gene expression data using a negative binomial distribution model. In a comparison group, the three replicates in the former group were set as control, and the later samples were regarded as a treat group. DESeq2 is designed to solve two major problems in differential analysis, one is adjusting for differences in library sizes, and the other is to maintain the difference caused by library compensation effect. In DESeq2, genes with FPKM values of 0 were first removed during the calculation of scaling factor in each sample, and they were re-calculated by the comparison between FPKM values and scaling factors in order to obtain DEGs. During the detection of DEGs, abs (log2 (Fold Change)) > 1 and False Discovery Rate (FDR) < 0.01 as the screening standard. The Fold Change represents the ratio of the expressions between two samples/groups. FDR was obtained by correcting the p-value of difference significance. The differential expression analysis of transcriptome sequencing is an independent statistical hypothesis test for a large number of gene expression values, so there will be false positives. The Benjamini-Hochberg correction method is utilized to correct the p-value significance obtained from the original hypothesis test.

2.4. WGCNA Analysis and Quantitative Real-Time PCR

In order to better identify the leaf growth-related factors, current public time-series raw data in G. biloba were downloaded from NCBI, which included 36 samples (SRP278694). After the processes of data filtering, alignment, removal of the batch effect, and expression normalization, genes were clustered into gene modules with Weighted Gene Co-expression Network Analysis (WGCNA) [21]. This analysis aims to find gene modules that are co-expressed and explore the association between gene networks and phenotypes of interest, as well as the core genes in the network. It mainly includes four steps: calculation of correlation coefficient (Person Coefficient) between genes, determination of gene modules, construction of co-expression network, and association between modules and traits. New plant materials from the individuals were used for the RNA extraction for the qRT-PCR, and primers were designed using the online primer-design software (http://www.genscript.com.cn/technology-support/online-tools (accessed on 20 September 2020). A HiScript™ Q-RT SuperMix for qRT-PCR (Vazyme, Nanjing, China) was used to synthesize the cDNAs, and real-time quantification was performed using an ABI Viia7 Real-Time PCR system and the EvaGreen 2X qPCR Master Mix (Vazyme, Nanjing, China). The 18S gene was selected as the housekeeping gene. The PCR cycling was performed using a program of 95 °C for 10 min, and 40 cycles of 95 °C for 15 s and 60 °C for 60 s. The relative expression level was calculated using the 2−ΔΔCt method.

3. Results and Discussion

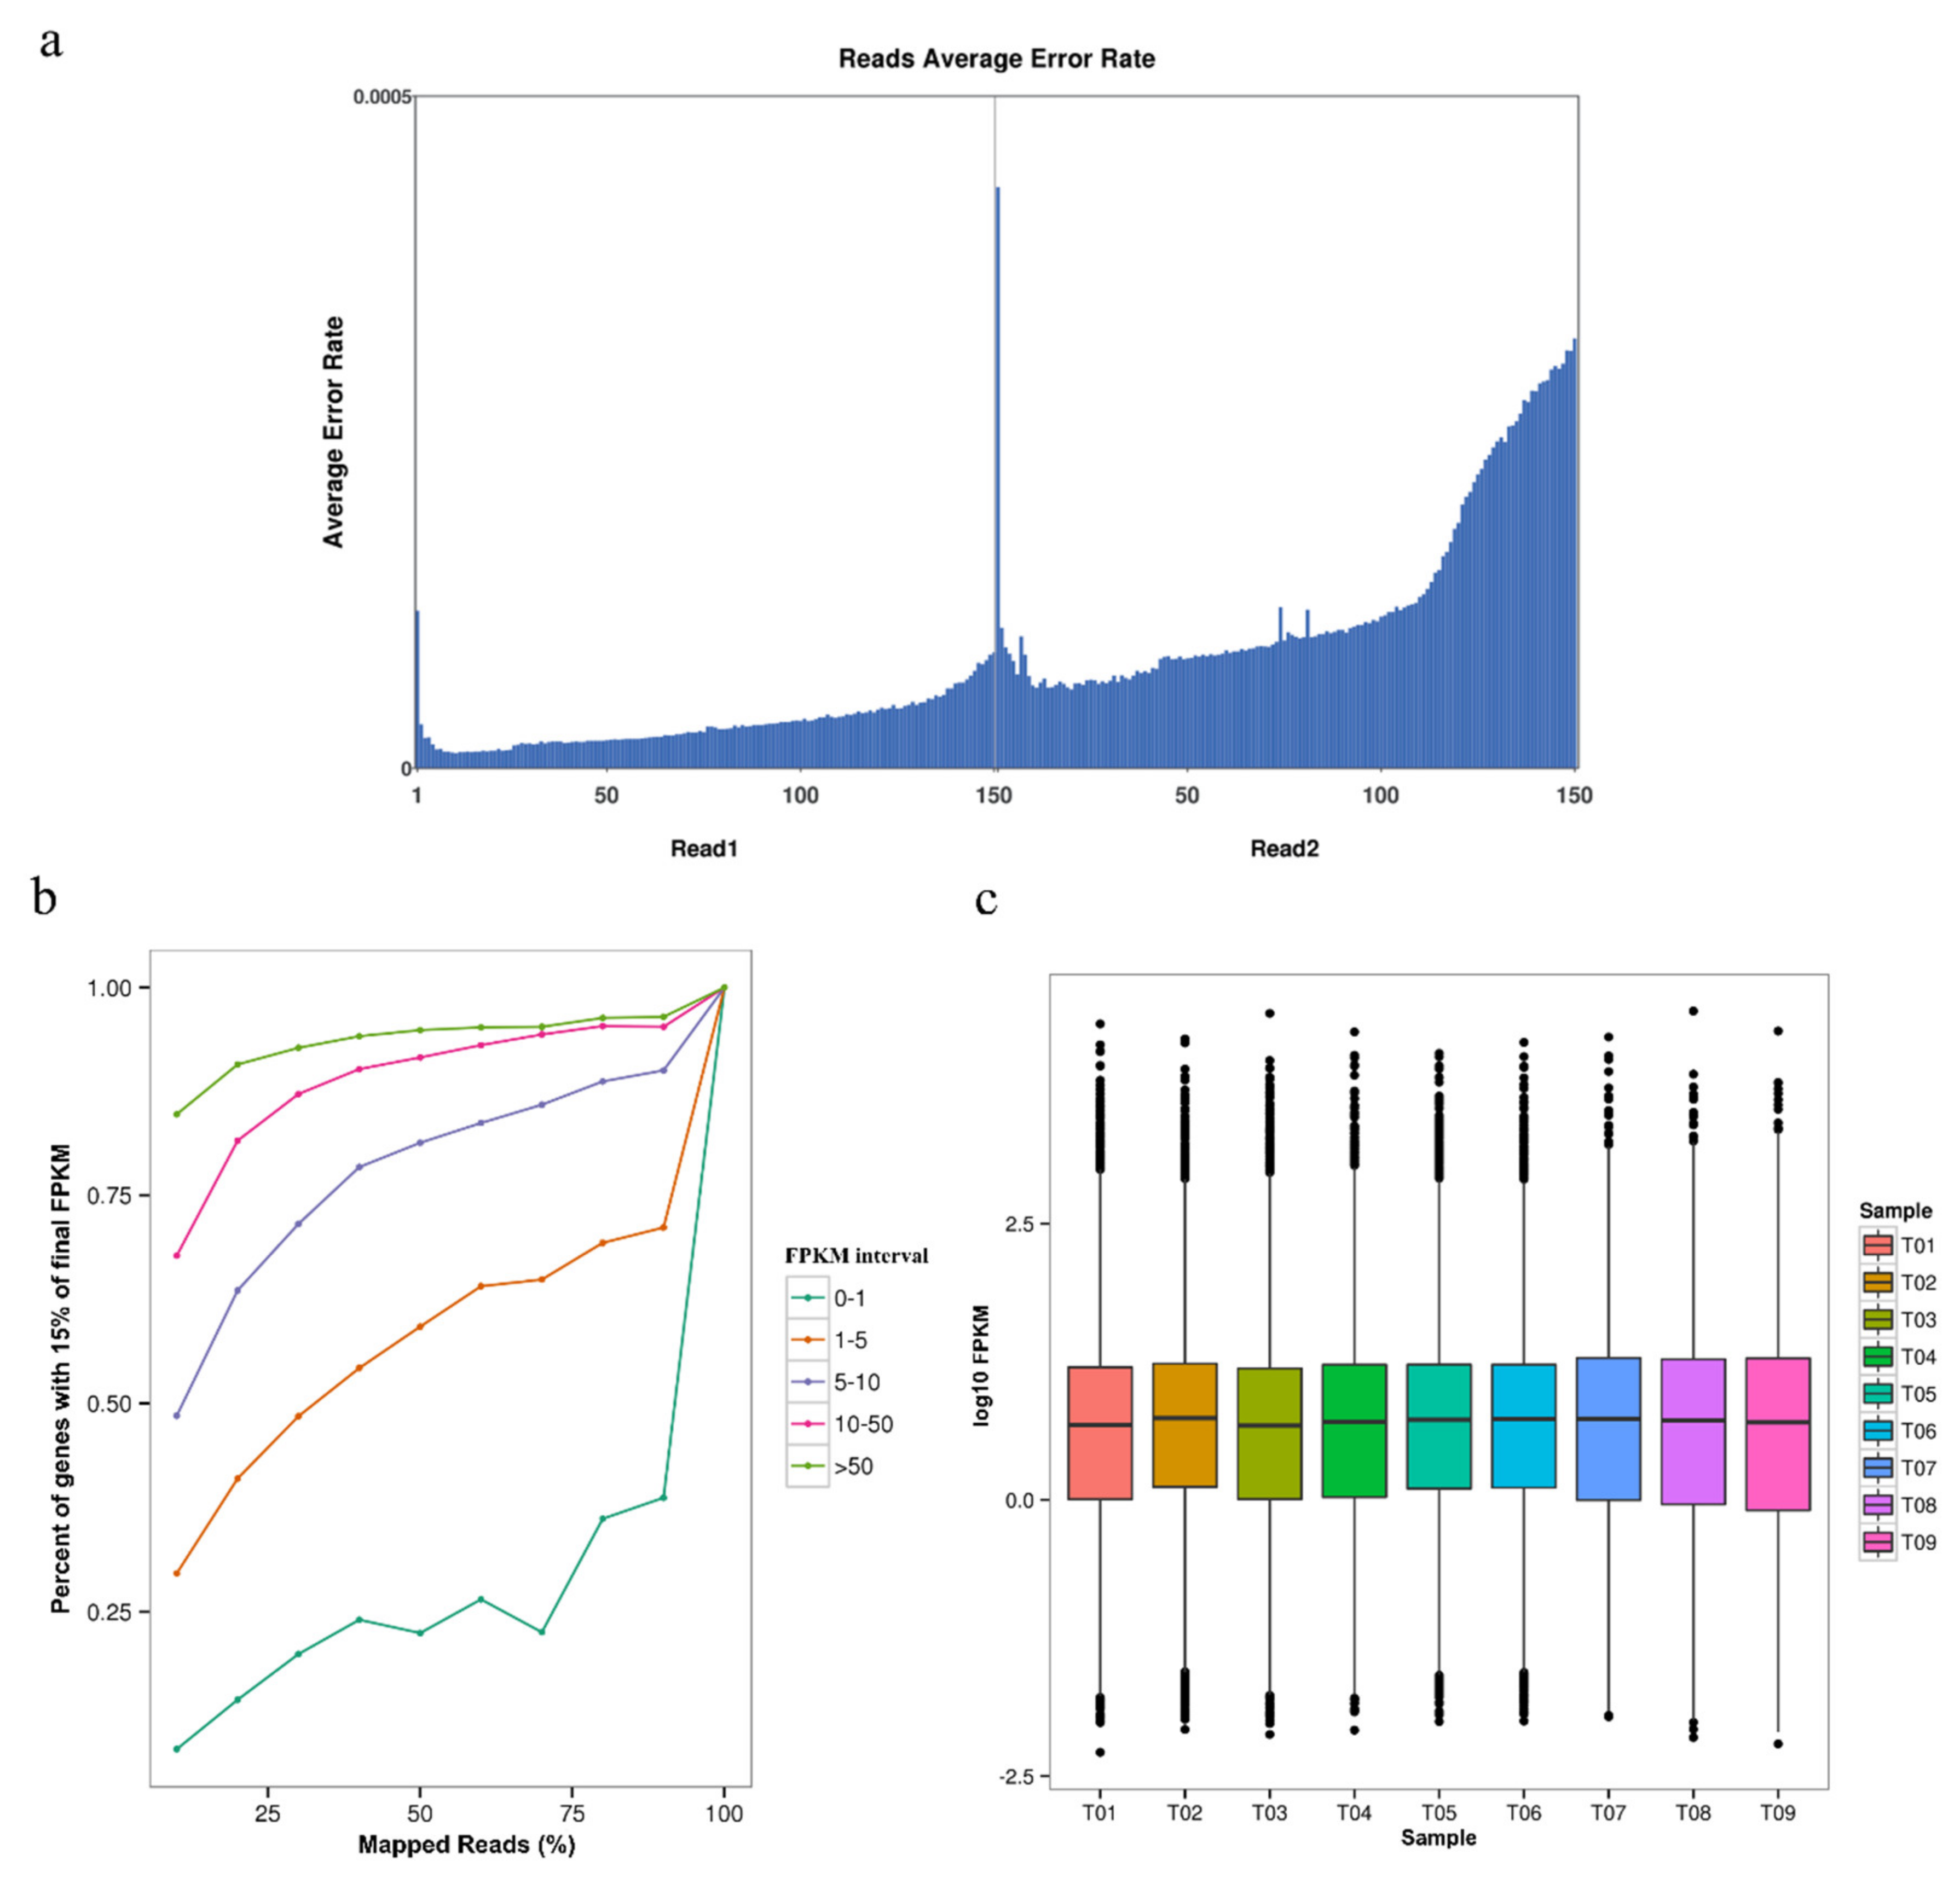
3.1. Overall Characteristics and Quality Evaluation in G. biloba Transcriptome

The raw data have been submitted to NCBI database with the accession number: SRP303061. The sequenced data were checked with a sequencing error rate and saturation test to assess the adequacy of the data and to satisfy subsequent analysis. The results showed that the sequencing error rates of read 5′/3′ ends were slightly higher (still less than 0.05%), which was also typical of the Illumina platform, and the overall sequencing quality was qualified (Figure 2a). Since the number of genes in a species is limited, and the transcription process is time/space-specific, the number of detected genes tends to become saturated with the increase in sequencing depth; the higher the expression level of the gene, the easier it is to be quantified. Therefore, a larger amount of data is usually needed to accurately quantify the gene with lower expression levels.
According to the saturation test result shown in Figure 2b, the number of genes with different expression levels detected, especially those with low expression, had already been saturated as the sequencing depth increased. These results indicated that the sequencing depth of RNA-seq in our study is reliable, and the low-expression genes were fully detected. The expression distribution of different samples based on the FPKM value was calculated as well, and that the expression level of protein-coding genes ranged from 10−2 to 104. Although there were several differences in the extreme values of expression in different samples, their distribution was nearly identical between male and female individuals (Figure 2c).
In this study, a total of 64.89 Gb of clean data were generated, comprising more than 216 million paired end reads. The average Q20 and Q30 values were 95.50% and 89.77%, respectively. The average GC content was 45.19% (Table 1). Then, TopHat2 was used to align clean reads with the reference genome to obtain the location information on the reference genome together with the sequence characteristics. According to the alignment results, the mapping ratio of each sample was between 78.94% and 83.32%.

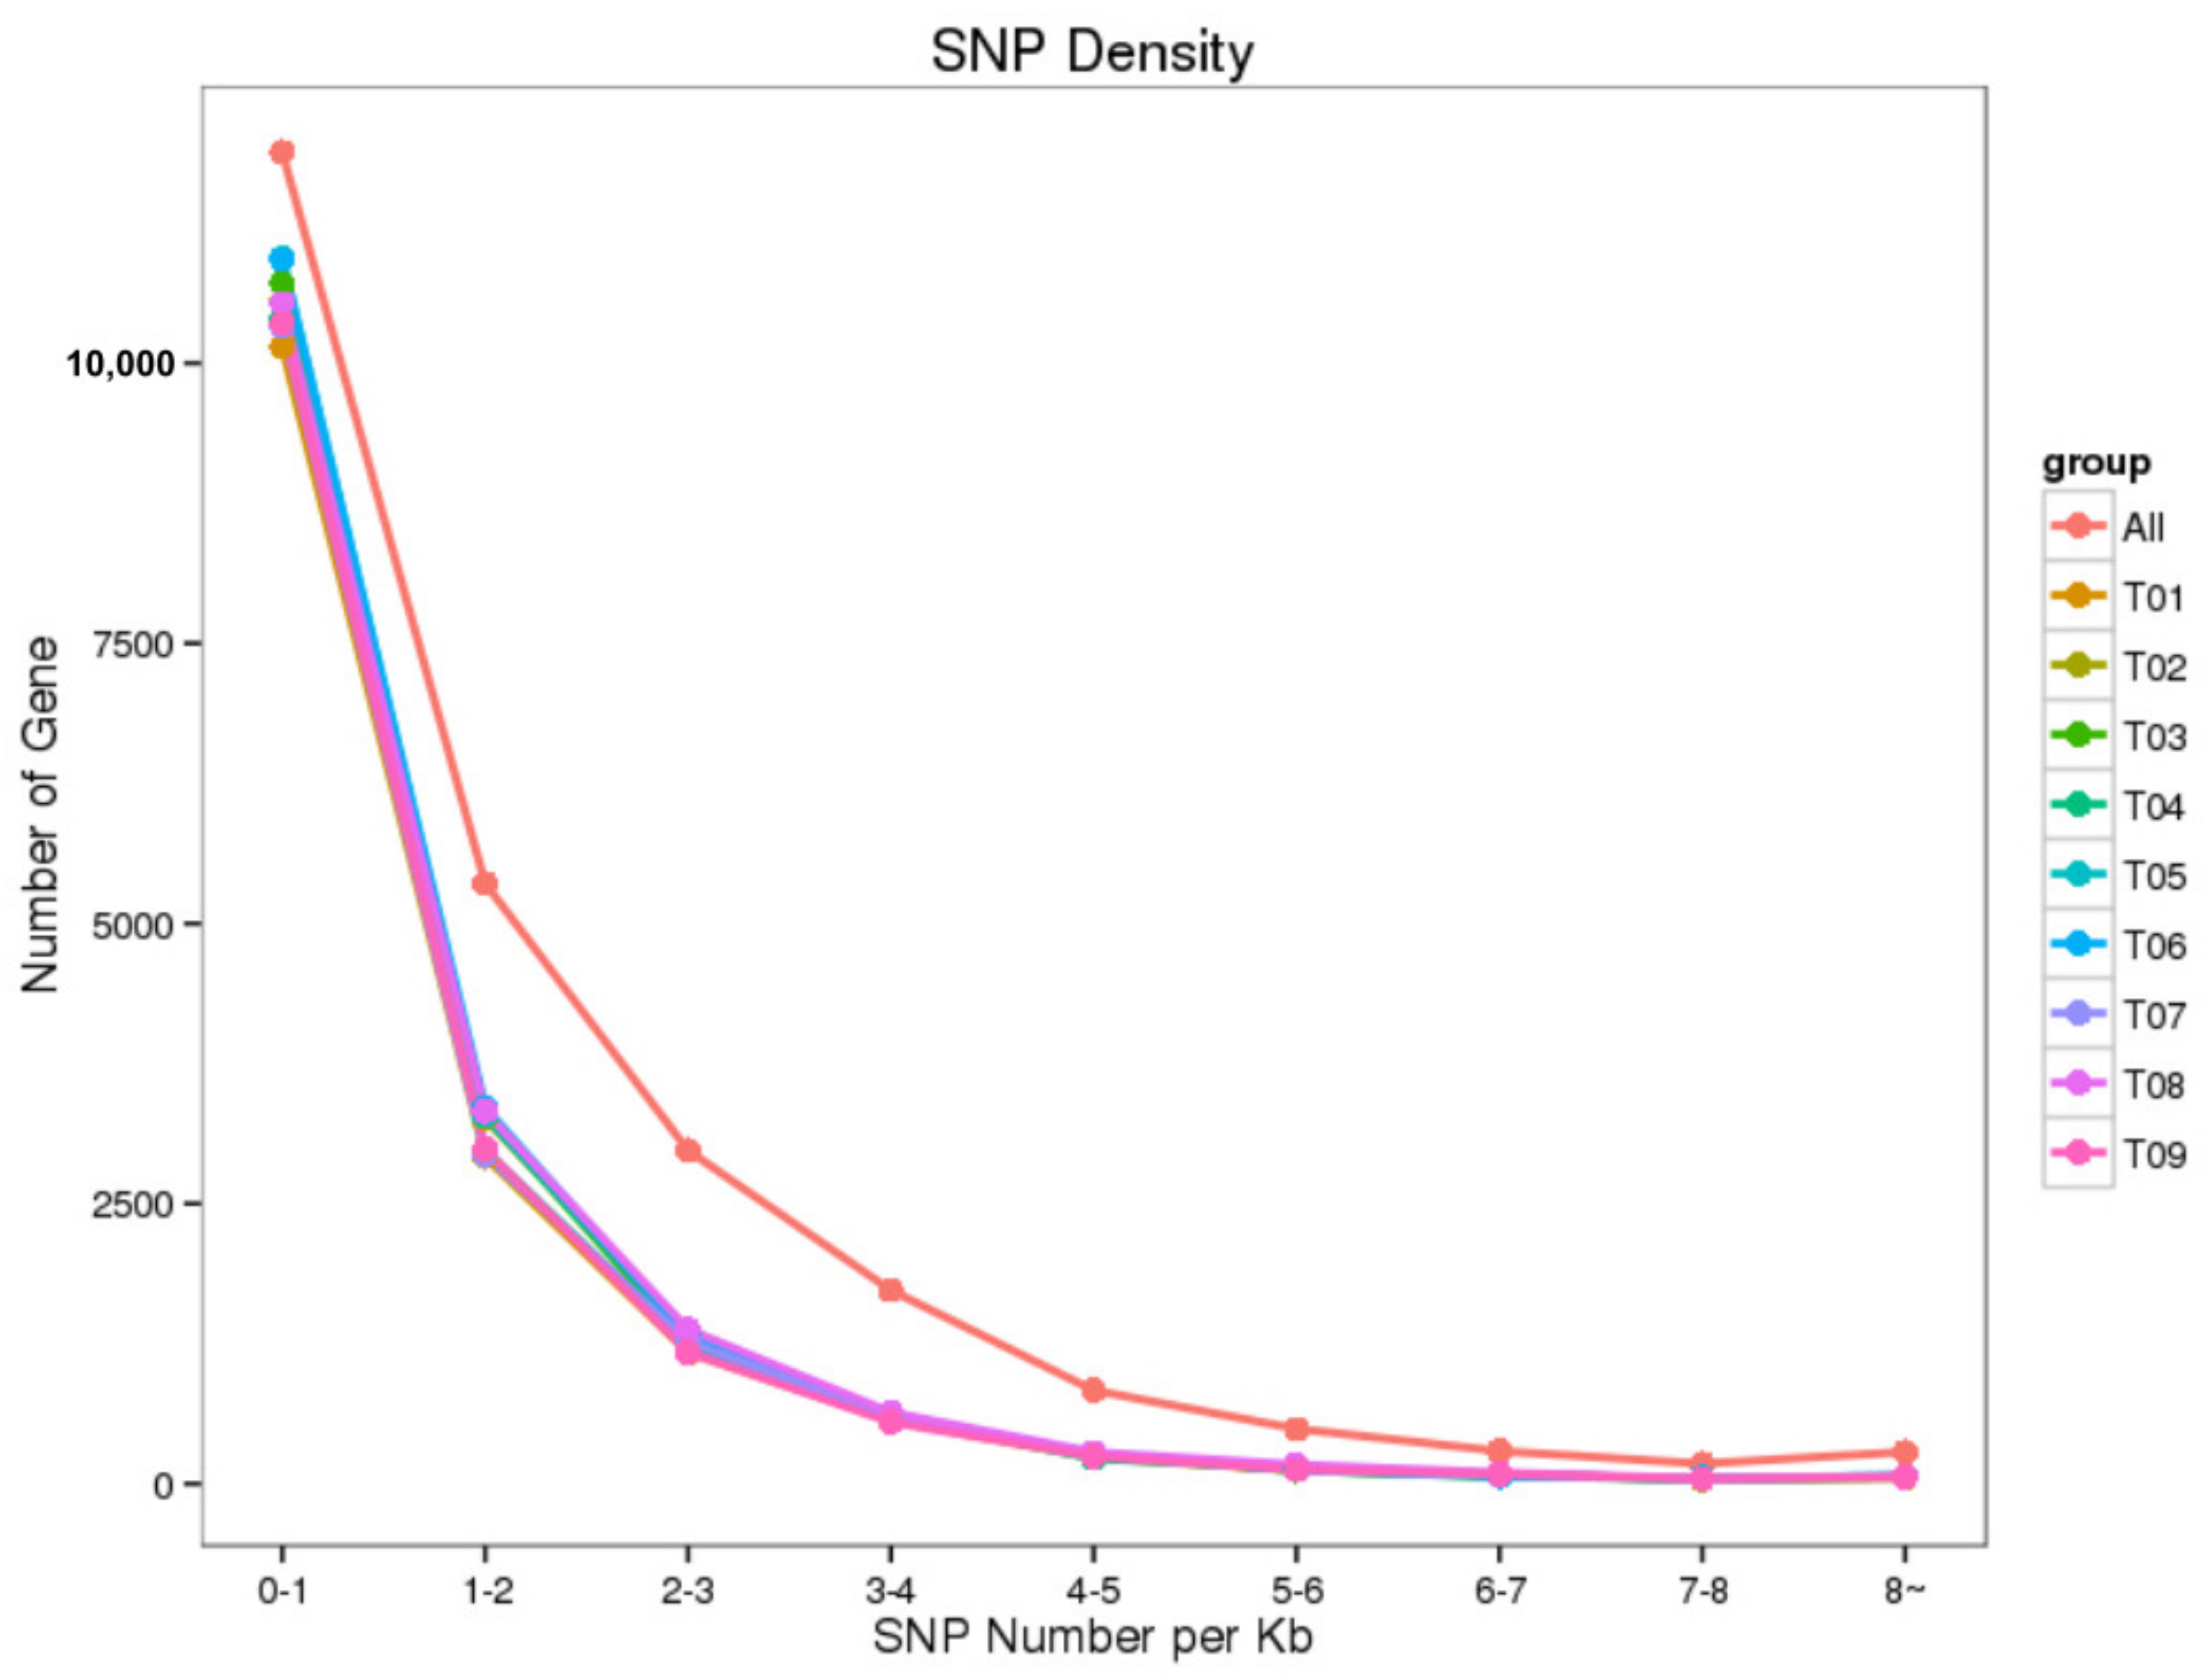
3.2. Identification of New Genes and Potential SNPs

The large size of G. biloba genome and the considerable amount of tandem repeated sequences increase the difficulty of the assembly process, as is the case for most gymnosperms. As a result, the annotation of the selected reference genome is often not accurate enough, making it necessary to optimize the gene structure of the original annotation. RNA-seq is suitable for correcting gene structure due to its high accuracy of transcriptional boundary determination during the mapping process. In our research, a total of 12,137 genes were structure optimized with RNA-seq mapping data, and 732 new genes were successfully identified based on the annotation result, through filtering out sequences that had coding sequences that were too short (less than 50 amino acid residues).
These new genes were then annotated based on several databases with BLAST, and 436 were functionally annotated (Figure 3a). From the eggNOG database results (Table S1) [22], most of the new genes were functionally annotated within generic or non-explicit pathways, and the comparison based on the Nr database also revealed that more than 30% of the new genes were highly homologous to other gymnosperm sequences (Picea sitchensis) (Figure 3b). These genes have not been fully annotated at present, which may be related to the regulation of secondary metabolism unique to gymnosperms. Through the GO annotation results, some genes related to development were found, which could be beneficial to our subsequent differential gene analysis.
In addition, based on the mapping results of each sample, GATK was used to identify the single base mismatch between samples in order to identify potential SNP sites. According to the detection results, a total of 666,742 putative SNPs among all samples were predicted in G. biloba, which were evenly distributed. Among 42,572 unigenes, most unigenes had 1–2 SNPs per kbp, indicating that the SNP frequency of these three genotypes in G. biloba may be relatively lower compared with rice within two major subspecies (1 SNP: 154 bp) [23] and Arabidopsis of more than six accessions (1 SNP: ~ 350 bp) [24] (Figure 4). The mutation of A -> G and C -> T were the top two types in all SNP types, and the overall proportion of transition was higher than that of transversion, on average 58.62% vs. 41.38% (Table S2). The related bioinformatic scripts in our research were uploaded in Table S3 as well.
According to the SNP annotation results, more than 80% of SNPs were located in traditionally regarded ‘non-functional areas’, including the intergenic and intron regions which may arise from alternative splicing or inaccurate mapping in each sample. After the completion of transcription, in addition to the need for mRNA capping, ploy-A appendage, and alternative splicing, part of them will undergo RNA editing, resulting in the replacement, insertion, and deletion of single bases. The identification of SNPs based on transcriptome sequencing data would inevitably contain the products of RNA editing. Although RNA editing has been reported mostly for plant organelles [25], the high proportion of non-synonymous mutations described in this work suggested RNA edition could also occur for G. biloba nuclear coded genes, and our results may contribute to a much better annotation of the G. biloba genome as well.

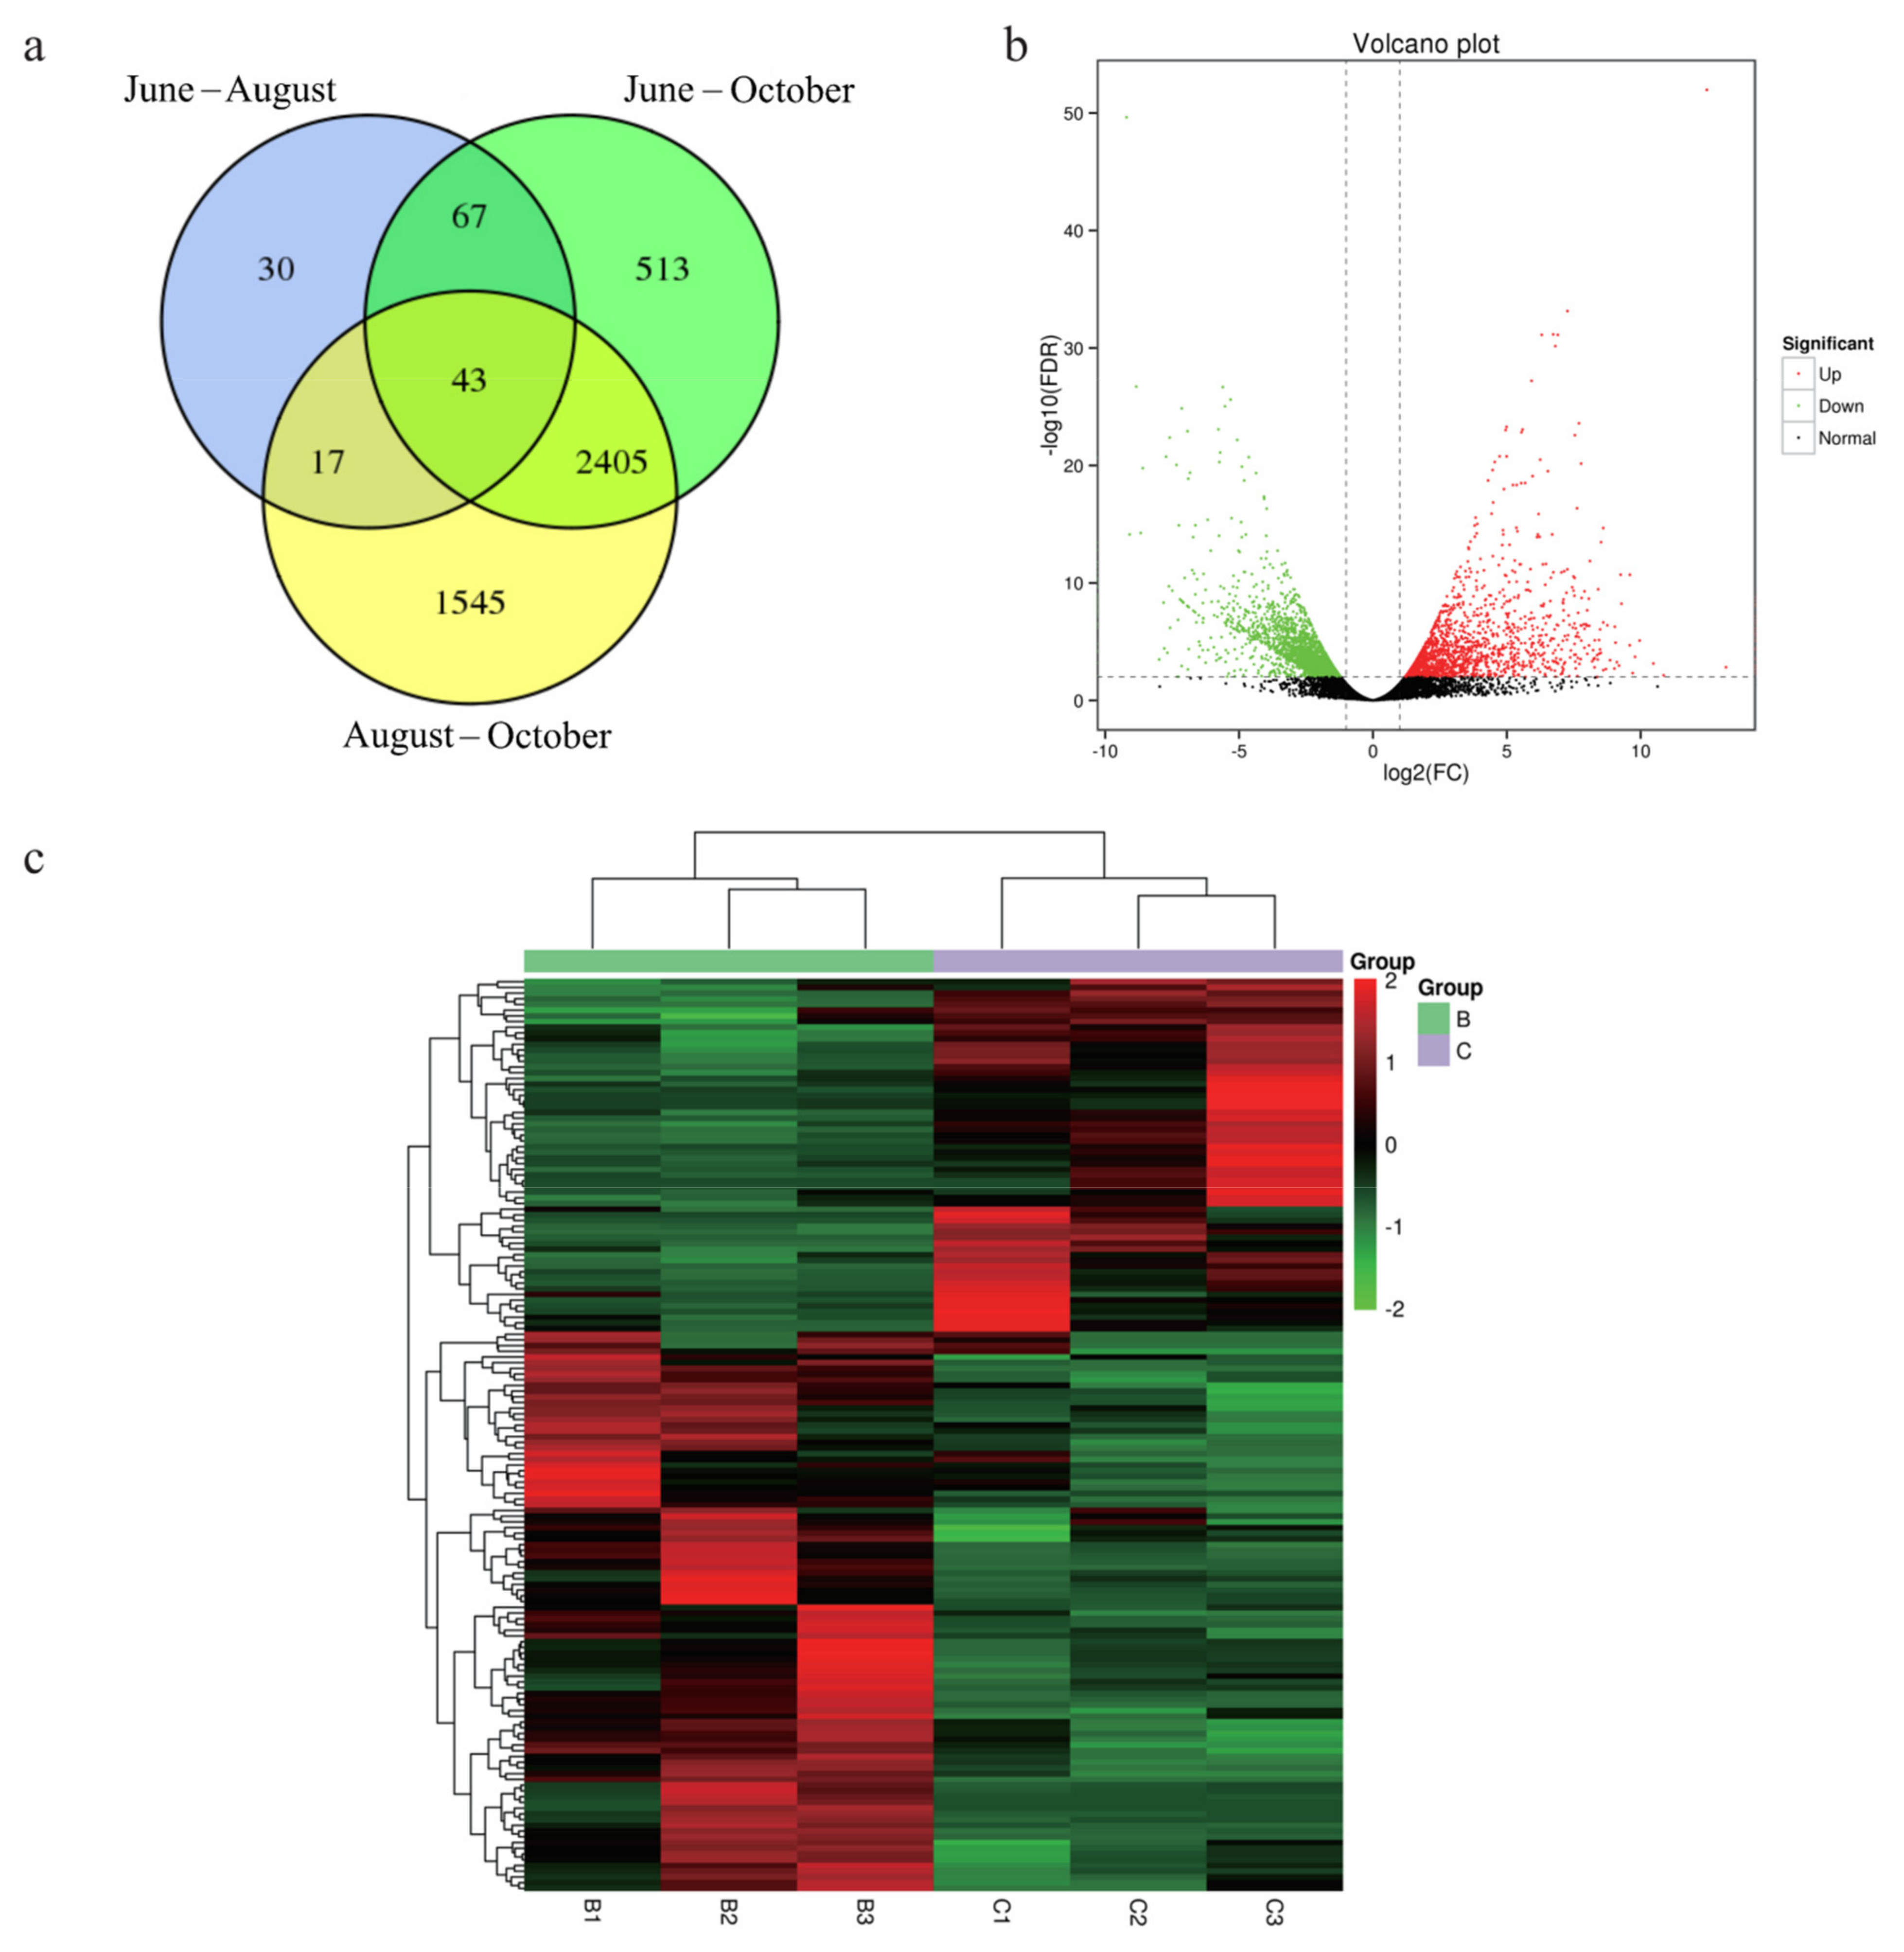
3.3. Differential Expression Analysis

Among two groups, including period 1 (18 June) vs. period 2 (15 August) and period 2 vs. period 3 (15 October), a total of 4167 differentially expressed genes (DEGs) were identified, and 43 of them were significantly expressed across each stage (Figure 5a). Surprisingly, although the growth cycles between the two groups were similar, the number of differentially expressed genes was quite different. In the first group (June vs. August), only 157 DEGs were identified, whereas, in the second group (August vs. October), the number of DEGs was 4010. This indicated that, during the growth process of G. biloba leaves, there seemed to be a significant increase in developmental activity at one specific period, leading to a large number of related genes up- or down-regulated (Figure 5b). The number of down-regulated genes was higher than that of up-regulated genes in both groups. The number of down-regulated genes in June was 135, which was much higher than that of up-regulated genes in 22. However, in the second stage, the number of up-regulated and down-regulated genes were 1727 and 2283, respectively (Figure 5c). Fewer differences between June and August than between August and October may arise from the reason that leaves were already fully developed in June. Additionally, since our study majorly focused on the late developmental stages of the leaves when terpenoids and flavonoids are mainly synthesized. It seems a earlier sampling time in April or May, and an intermediate sampling point in September would also have been interesting.
Enrichment analysis, including GO and KEGG enrichment on all DEGs were performed, and most DEGs could be functionally annotated (97.93%). Between June and August, the most significantly enriched pathways were ‘Stilbenoid, diarylheptanoid, and gingerol biosynthesis’ (q-value = 0.004), ‘Cutin, suberine, and wax biosynthesis’ (q-value = 0.007), and ‘Phenylpropanoid biosynthesis’ (q-value = 0.047) (Figure 6a). Both of the two pathways belonged to the category of phenylalanine metabolism, which indicated that in the initial developmental stage of G. biloba leaves, genes tended to become more active in the synthesis of important secondary metabolism, such as flavonoids, which are also the most abundant secondary metabolites in G. biloba leaves. The most significant up-regulated gene was annotated in energy production and conversion pathway, which encoded malate dehydrogenase with an important role in the TCA cycle, and its expression level was nearly 30-fold change increase. The expression of a gene that encoded the signal transduction pathway decreased the most and the fold change was up to 40 times. It is worth mentioning that we found that a new previously annotated gene, also showed a significant decrease in expression, with function annotation as MADS transcription factor and a fold change of up to 32 times. This suggested that these newly identified genes also play an important role in the growth and development of G. biloba leaves.
Moreover, between August and October, many more DEGs were found, and the most significant enriched pathways were ‘Biosynthesis of amino acids’ (q-value = 0.18), ‘Phenylalanine metabolism’ (q-value = 0.16), and ‘Stilbenoid, diarylheptanoid, and gingerol biosynthesis’ (q-value = 0.006), respectively. Compared with the first stage, the expression of phenylalanine metabolism pathway related genes involved in flavonoid synthesis still remained active (Figure 6b). In addition, genes related to the synthesis of another major class of secondary metabolites-terpene lactones also began to be significantly differentially expressed, as did genes related to plant disease resistance. During this stage, the most significantly up-regulated genes were all directly associated with the synthesis of G. biloba important secondary metabolites. The gene with the highest up-regulated expression was involved in diterpenoid biosynthesis, which encoded ent-kaurene oxidase with more than 170 times fold change. The other one was related to phenylalanine metabolism with a 155 times fold change, encoding caffeoyl-CoA-methyltransferase. Genes with significantly down-regulated expression seem to have no obvious classification trend, and the gene encoding glucan endo-1, 3-beta-glucosidase was the most significant down-regulated with an 81 times fold change.

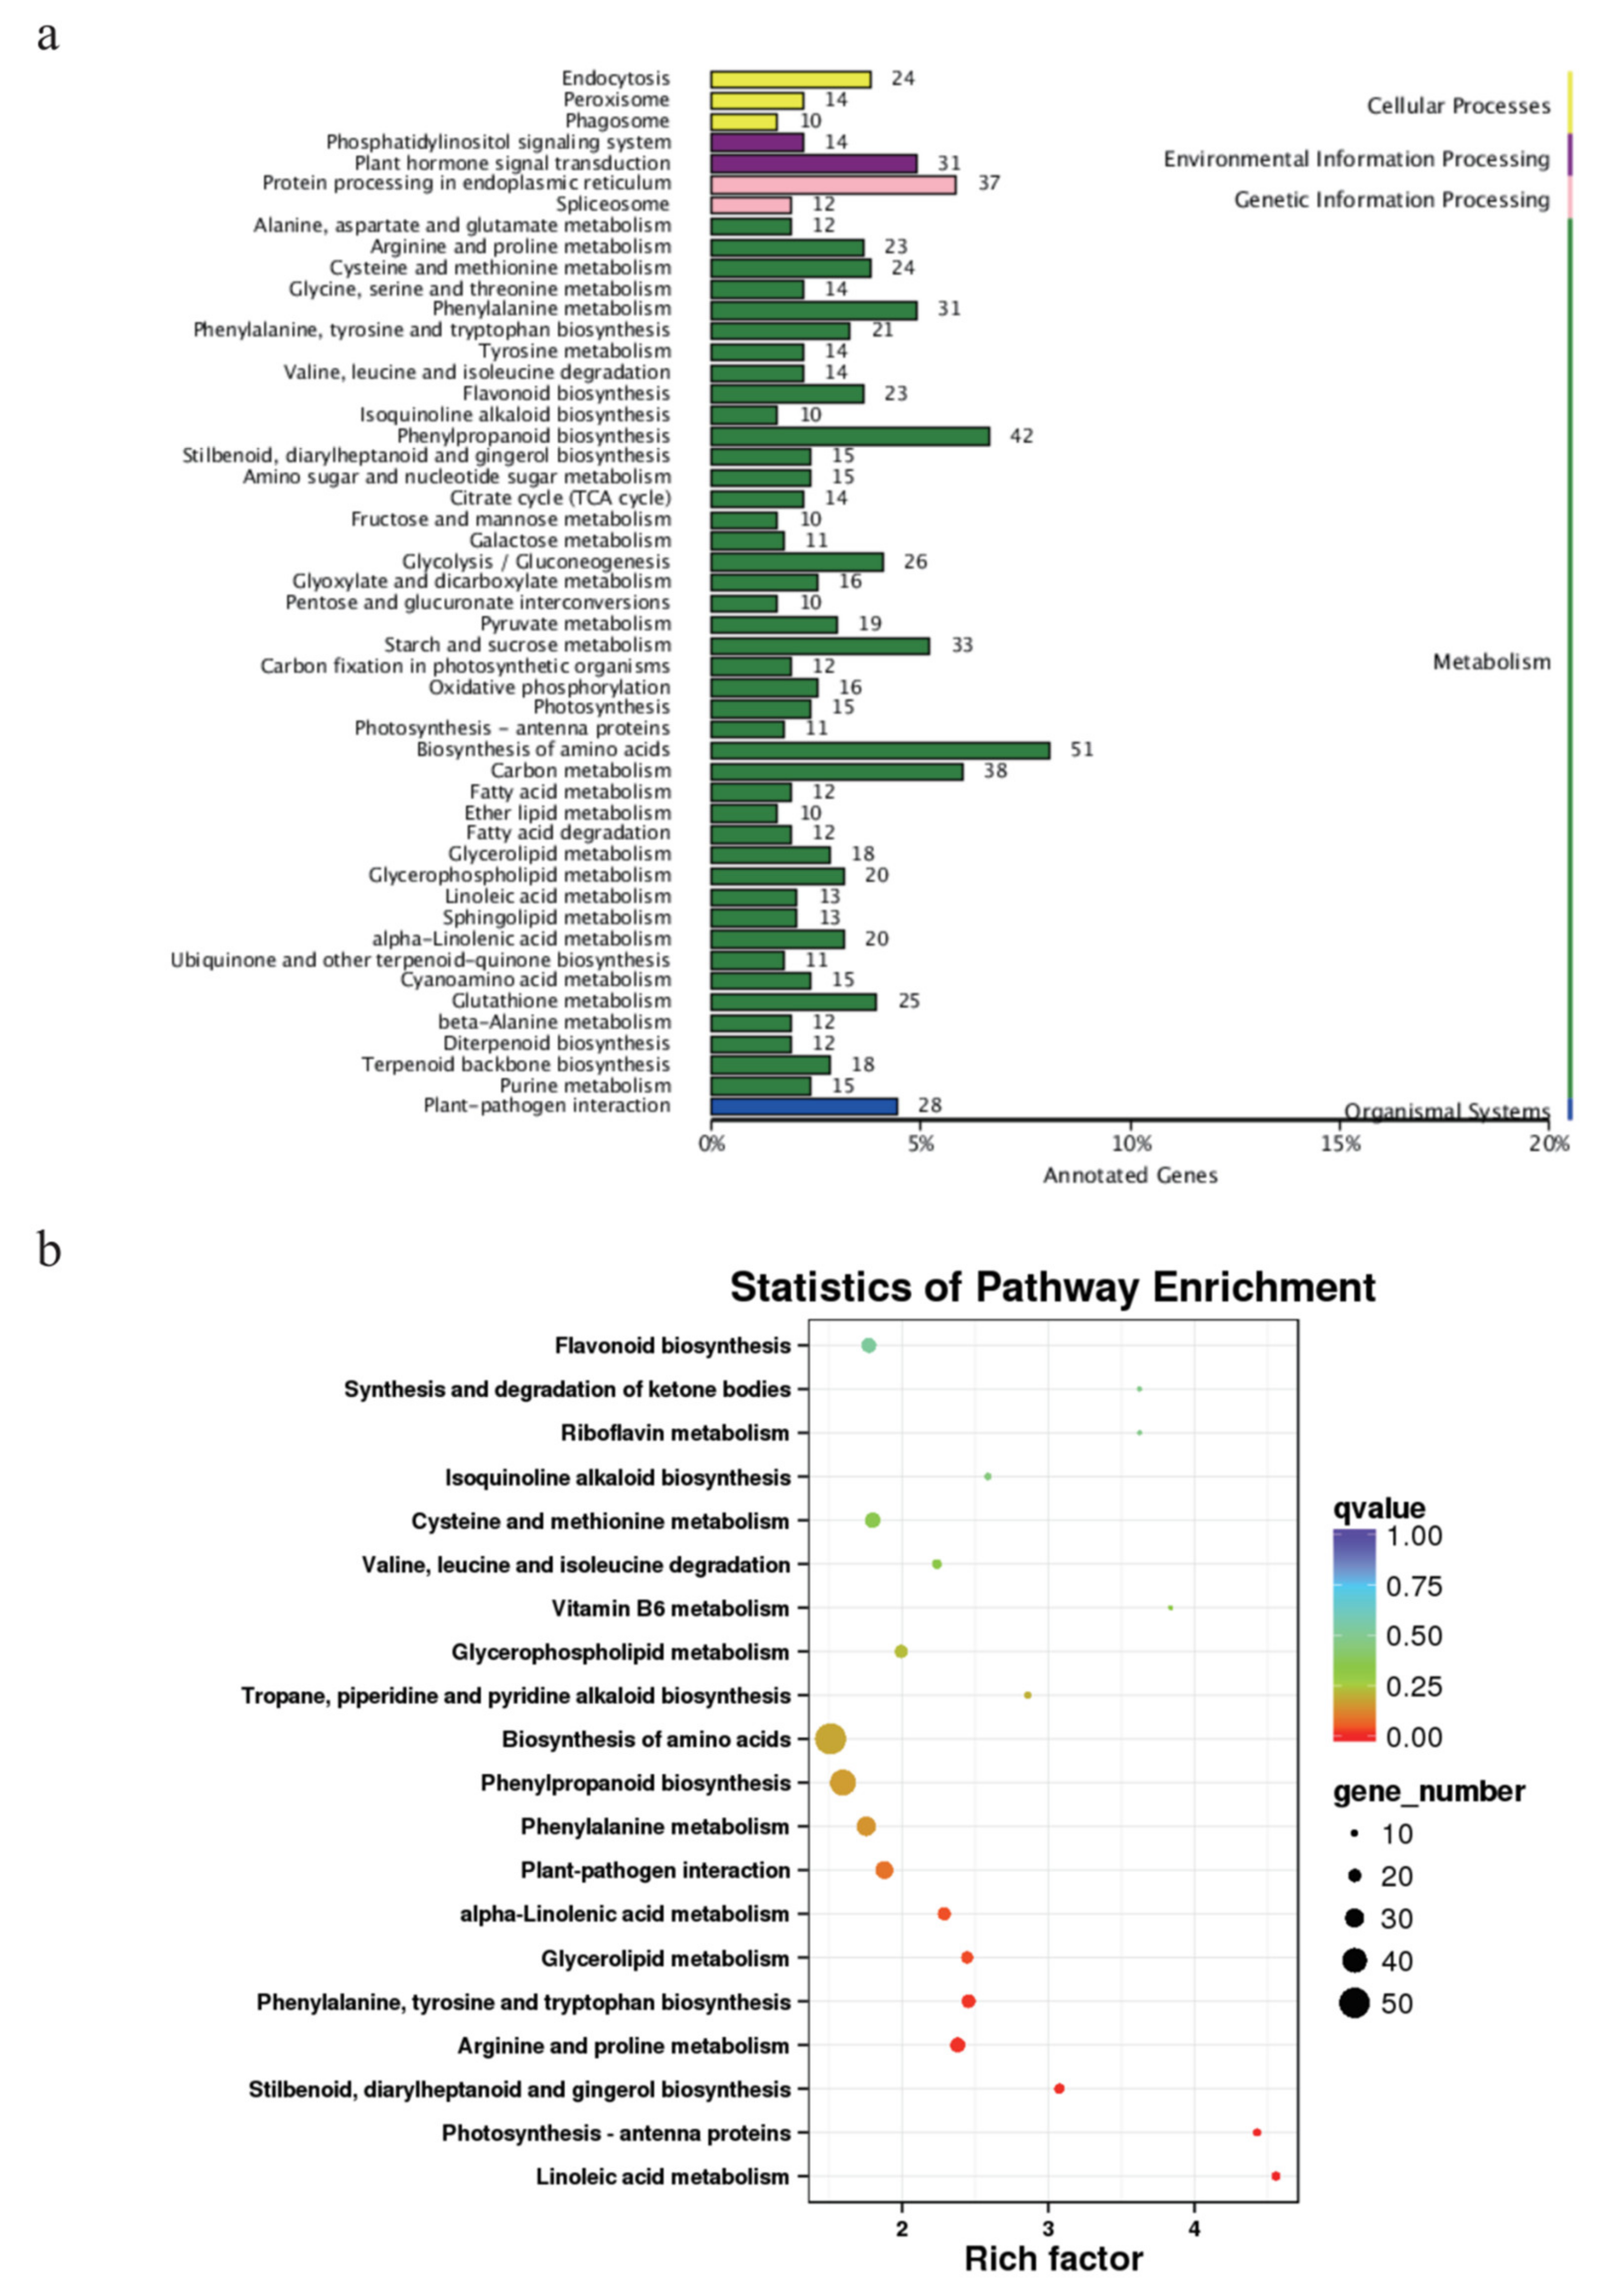
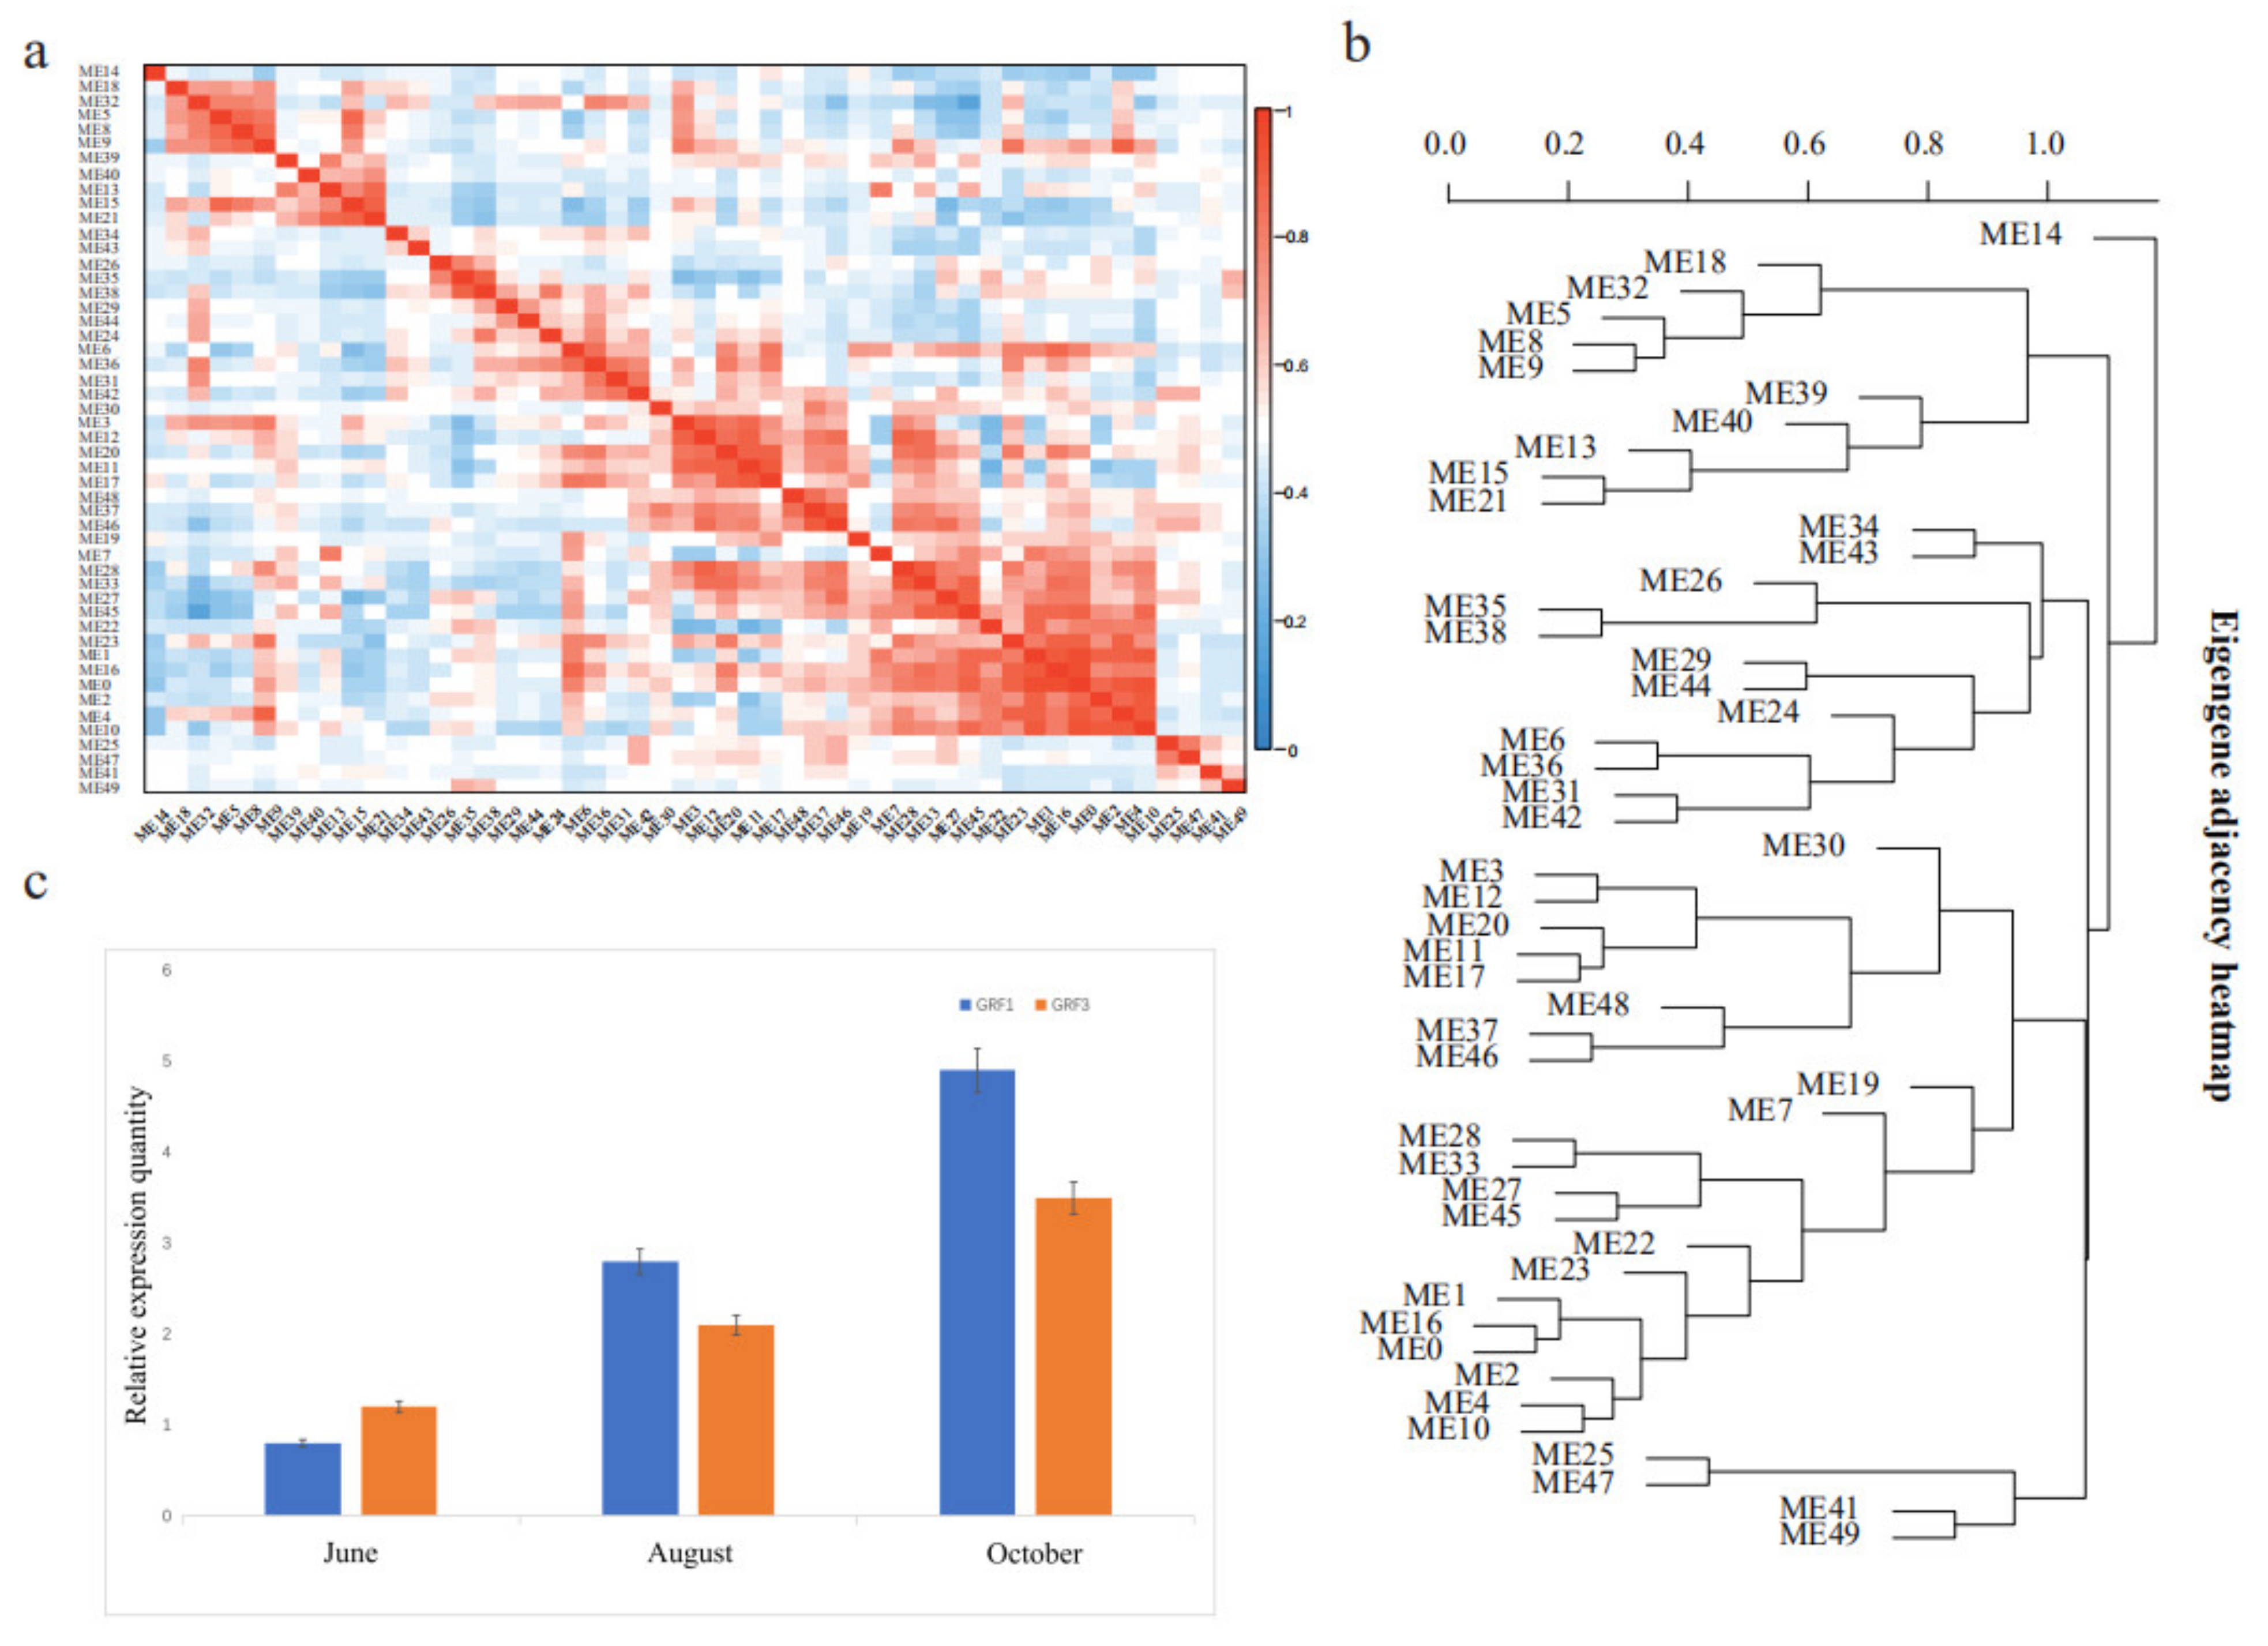
3.4. Growth-Related DEGs in G. biloba Leaves Based on Enrichment and WGCNA Results

Based on functional annotation results, 56 genes, together with three new genes, were identified as growth-related genes, including transcription, developmental growth, and regulation of growth categories, and 12 of them were identified as DEGs. Recent research has revealed that the plant-specific transcription factor family GROWTH-REGULATING FACTOR (GRF) plays an important role in leaf size regulation [26,27], and in our results, two DEGs were annotated as GRF genes with significant up-expression between period 2 and period 3 (GRF1 and GRF3). Across three periods, the average normalized FPKM values of GRF1 were 0.85–4.23–20.62, respectively. Additionally, the changes of GRF3 average expression values were from 1.32 to 13.67. However, among these DEGs involved in growth and development, the most significantly differentially expressed gene encodes the CLAVATA protein instead of GRF, which belongs to the signal transduction pathway. The CLAVATA/Embryo Surrounding Region-related family genes, their receptors, and related pathways play an important role in regulating the vascular phylogeny. They are embodied in inhibiting the proliferation and division of stem cells in stem tip meristem and root tip meristem and maintaining the homeostasis of them. The CLAVATA genes are expressed in various tissues of plants. The CLAVATA family genes are secreted small proteins with 50–200 AA in length, and have N-terminal signaling peptides, intermediate variable regions, together with the C-terminal conservative motif. Continuous organ initiation and growth in plants depend on the proliferation and differentiation of stem cells, which are mainly maintained by the CLAVATA-WUSCHEL negative feedback circuit. In our results, three DEG proteins were annotated as CLAVATA proteins with the most significant up-regulated expression.
In addition to these four up-regulated genes, two other DEGs were also involved in the signal transduction mechanism. One DEG was functionally annotated as a microtubule-associated protein (AIR9) with a significant decrease. According to previous studies, this protein decorates cortical microtubules and the preprophase band but is down-regulated during mitosis [28]; therefore, this result is consistent with the differential expression pattern on this protein. Another growth-related DEG in the signal transduction pathway was annotated as an unknown function with significantly up-regulated expression. In addition to the signal transduction pathway, other significant growth-related DEGs were annotated as glucan endo-1, 3-beta-glucosidase, fasciclin-like arabinogalactan protein, and pentatricopeptide repeat-containing protein, respectively.
Similar results were found in co-expression analysis, with all genes involved in expression divided into 49 major expression modules (Figure 7a). Although most growth-related genes were not successfully clustered, the two mentioned above GRF genes with significant up-expression were classified as two highly correlated gene modules, ME34 and ME43 (Figure 7b), and then these two gene modules were analyzed in detail. Through functional annotation of these two gene sets, two transcription factors (TF) of the MYB family, namely MYB102 and MYB106 were found, and RNA-seq results also revealed that these genes were significantly up-regulated. MYB factors are one of the largest TF families in plants, composing more than 120 members (majorly R2R3-type) in A. thaliana [29]. After homology comparison, MYB102 was highly homologous with MYB41 and MYB74, and MYB106 in G. biloba was clustered with MYB16 and MYB17 in Arabidopsis, respectively. In Punica granatum, Raccuia et al. found that a combination of MYB5-like and bHLH type TFs could influence flavonoid composition in flowers and in unripe fruits [30]. In the gene cluster of ME34 and ME43, apart from GRF1 and GRF3, the related genes involved in the flavonoid metabolism pathway were also found, including Phenylalanine Ammonia-lyase and Anthocyanidin-3-O-glucoside rhamnosyltransferase. These results revealed the complex functions of MYB family and more validation work would be conducted. Although GRF1 and GRF3 belong to different gene modules, they were strongly correlated with expression patterns consistent with the WGCNA results (Figure 7c).
Besides, among these two gene modules, the pentatricopeptide repeat-containing protein which was identified in the previous DEG analysis, was the most abundant, and the total number reached 23 (19.17%). We hypothesized that this protein should be also significantly associated with G. biloba leaf growth, such as the signal transduction pathway, and further studies would be carried out in the subsequent analysis. Some genes that promote leaf growth are involved in hormone synthesis or signal transduction, confirming the important role of plant hormones in plant growth. Ectopic expression of the rate-limiting enzyme GA20-oxidase, which catalyzes important steps in the gibberellin biosynthesis pathway, leads to larger leaf formation in maize and rice [6,11]. According to the results, five genes were annotated as GA20-oxidase, including GA20-oxidase1 and GA20-oxidase2 isoforms, and one gene was annotated as GA20-oxidase1 with significantly up-regulation expression. Brassinosteroids (BRs) are essential plant steroid hormones that regulate many aspects of growth and development, including cell elongation and cell division [31]. It is known that BRs are combined with BRASSINOSTEROID-INSENSITIVE1(BRI1), which functions in hormone perception and signal transduction with BRASSINOSTEROID-ASSOCIATED KINASE1(BAK1) [32]. One significantly up-expressed gene was identified among all five genes encoding GA20-oxidase.
In addition to these growth-related genes involved in the transcription and hormonal regulation process, 27 genes encoding EXPANSIN proteins were also filtered out, including five DEGs. In maize, the decreased expression of EXPANSIN6 is correlated with leaf growth reduction [33]. In A. thaliana, EXPANSIN10, a gene coding for enzymes that promote cell wall loosening, has been reported to help leaf expansion as a result of cell size increase [34]. Recent researches have revealed that EXPANSINs were associated with signal transduction of ethylene as well [35]. In wild cardoon, EXPANSINs expression were influenced by different temperatures which could affect ethylene metabolism [36]. According to the DEG analysis results, three DEGs annotated as EXPANSIN protein, including EXPANSIN1, EXPANSIN4, and EXPANSIN8, were all significantly up-regulated.
Based on RNA-Seq and co-expression network analysis, many types of leaf growth-related factors were successfully identified, and further experimental validation would be conducted. Meanwhile, it should be noted that due to the limitation of short read sequencing on Illumina platform and the quality of the reference genome, the quality of transcripts obtained could vary a lot in our research, which may hinder subsequent gene annotation. The hybrid transcriptome sequencing approach could further improve the assembly and gene annotation, which combines short read sequencing (SR-seq) and long read sequencing (LR-seq) [37]. In addition to using weighted correlation coefficient to construct scale-free network for gene module clustering in WGCNA, Markov Clustering algorithm (MCL) could also be considered for the construction of gene co-expression network [38]. These methods and strategies will provide inspiration for our future research.

4. Conclusions

Based on the transcriptome information of the late development stage of G. biloba leaves, the original gene structures of 12,137 genes from the previous ginkgo genome version were accurately optimized, and 732 novel genes in the new transcription regions were successfully annotated. Additionally, more than 600,000 SNP were discovered for the first time in G. biloba genome. In addition to these, the transcriptomic atlas of G. biloba leaf growth was preliminarily constructed, including more than 50 functionally annotated genes and DEGs. Apart from those common growth-related factors in angiosperms, including GRF factors, GA-20 oxidase, BRs, and EXPANSIN proteins, we also found the significant promotion effect of the CLAVATA family on the leaf growth in G. biloba, which could provide a reference for subsequent studies on the leaf growth and development in gymnosperms.

Supplementary Materials

The following are available online at https://www.mdpi.com/1999-4907/12/3/315/s1, Figure S1: The integrity gel of all 9 samples in G. biloba, Table S1: The EggNOG annotation of G. biloba new genes, Table S2: The summary of G. biloba SNPs, Table S3: Related bioinformatic scripts in our research.

Author Contributions

L.X. and J.R. conceived and designed the experiments. B.H. and H.L. analyzed the data and wrote the paper, X.H. performed the experimental validation. All authors have read and agreed to the published version of the manuscript.

Funding

This research was funded by Guangdong Basic and Applied Basic Research Foundation (2019A1515111150) and China Postdoctoral Science Foundation (2019M663196).

Data Availability Statement

The raw data have been submitted to NCBI database with the accession number SRP303061.

Conflicts of Interest

The authors declare no conflict of interest.

References

  1. Zhou, Z.; Zheng, S. The missing link in Ginkgo evolution. Nature 2003, 423, 821–822. [Google Scholar] [CrossRef] [PubMed]
  2. Van Beek, T.A.; Montoro, P. Chemical analysis and quality control of Ginkgo biloba leaves, extracts, and phytopharmaceuticals. J. Chromatogr. A 2009, 1216, 2002–2032. [Google Scholar] [CrossRef]
  3. Bastianetto, S.; Zheng, W.H.; Quirion, R. The Ginkgo biloba extract (EGb 761) protects and rescues hippocampal cells against nitric oxide-induced toxicity: Involvement of its flavonoid constituents and protein kinase C. J. Neurochem. 2000, 74, 2268–2277. [Google Scholar] [CrossRef]
  4. Ihl, R.; Bachinskaya, N.; Korczyn, A.D.; Vakhapova, V.; Tribanek, M.; Hoerr, R.; Napryeyenko, O.; Group, G.S. Efficacy and safety of a once-daily formulation of Ginkgo biloba extract EGb 761 in dementia with neuropsychiatric features: A randomized controlled trial. Int. J. Geriatr. Psychiatry 2011, 26, 1186–1194. [Google Scholar] [CrossRef] [PubMed]
  5. Liu, X.; Hao, W.; Qin, Y.; Decker, Y.; Wang, X.; Burkart, M.; Schotz, K.; Menger, M.D.; Fassbender, K.; Liu, Y. Long-term treatment with Ginkgo biloba extract EGb 761 improves symptoms and pathology in a transgenic mouse model of Alzheimer’s disease. Brain Behav. Immun. 2015, 46, 121–131. [Google Scholar] [CrossRef]
  6. Nelissen, H.; Gonzalez, N.; Inze, D. Leaf growth in dicots and monocots: So different yet so alike. Curr. Opin. Plant Biol. 2016, 33, 72–76. [Google Scholar] [CrossRef] [PubMed] [Green Version]
  7. Hepworth, J.; Lenhard, M. Regulation of plant lateral-organ growth by modulating cell number and size. Curr. Opin. Plant Biol. 2014, 17, 36–42. [Google Scholar] [CrossRef] [PubMed]
  8. Nelson, T.; Dengler, N. Leaf Vascular Pattern Formation. Plant Cell 1997, 9, 1121–1135. [Google Scholar] [CrossRef] [Green Version]
  9. Baute, J.; Herman, D.; Coppens, F.; De Block, J.; Slabbinck, B.; Dell’Acqua, M.; Pe, M.E.; Maere, S.; Nelissen, H.; Inze, D. Combined Large-Scale Phenotyping and Transcriptomics in Maize Reveals a Robust Growth Regulatory Network. Plant Physiol. 2016, 170, 1848–1867. [Google Scholar] [CrossRef] [PubMed] [Green Version]
  10. Oh, M.H.; Sun, J.; Oh, D.H.; Zielinski, R.E.; Clouse, S.D.; Huber, S.C. Enhancing Arabidopsis leaf growth by engineering the BRASSINOSTEROID INSENSITIVE1 receptor kinase. Plant Physiol. 2011, 157, 120–131. [Google Scholar] [CrossRef] [Green Version]
  11. Qin, X.; Liu, J.H.; Zhao, W.S.; Chen, X.J.; Guo, Z.J.; Peng, Y.L. Gibberellin 20-oxidase gene OsGA20ox3 regulates plant stature and disease development in rice. Mol. Plant Microbe Interact. 2013, 26, 227–239. [Google Scholar] [CrossRef] [Green Version]
  12. He, B.; Gu, Y.; Xu, M.; Wang, J.; Cao, F.; Xu, L.A. Transcriptome analysis of Ginkgo biloba kernels. Front. Plant Sci. 2015, 6, 819. [Google Scholar] [CrossRef] [PubMed]
  13. Liu, X.; Sun, L.; Wu, Q.; Men, X.; Yao, L.; Xing, S. Transcriptome profile analysis reveals the ontogenesis of rooted chichi in Ginkgo biloba L. Gene 2018, 669, 8–14. [Google Scholar] [CrossRef]
  14. Kim, D.; Pertea, G.; Trapnell, C.; Pimentel, H.; Kelley, R.; Salzberg, S.L. TopHat2, accurate alignment of transcriptomes in the presence of insertions, deletions and gene fusions. Genome Biol. 2013, 14, 1–13. [Google Scholar] [CrossRef] [PubMed] [Green Version]
  15. Guan, R.; Zhao, Y.; Zhang, H.; Fan, G.; Liu, X.; Zhou, W.; Shi, C.; Wang, J.; Liu, W.; Liang, X.; et al. Draft genome of the living fossil Ginkgo biloba. Gigascience 2016, 5, 49. [Google Scholar] [CrossRef] [Green Version]
  16. Altschul, S.F.; Madden, T.L.; Schaffer, A.A.; Zhang, J.; Zhang, Z.; Miller, W.; Lipman, D.J. Gapped BLAST and PSI-BLAST: A new generation of protein database search programs. Nucleic Acids Res. 1997, 25, 3389–3402. [Google Scholar] [CrossRef] [PubMed] [Green Version]
  17. Gotz, S.; Garcia-Gomez, J.M.; Terol, J.; Williams, T.D.; Nagaraj, S.H.; Nueda, M.J.; Robles, M.; Talon, M.; Dopazo, J.; Conesa, A. High-throughput functional annotation and data mining with the Blast2GO suite. Nucleic Acids Res. 2008, 36, 3420–3435. [Google Scholar] [CrossRef] [PubMed]
  18. McKenna, A.; Hanna, M.; Banks, E.; Sivachenko, A.; Cibulskis, K.; Kernytsky, A.; Garimella, K.; Altshuler, D.; Gabriel, S.; Daly, M.; et al. The Genome Analysis Toolkit: A MapReduce framework for analyzing next-generation DNA sequencing data. Genome Res. 2010, 20, 1297–1303. [Google Scholar] [CrossRef] [Green Version]
  19. Pertea, M.; Pertea, G.M.; Antonescu, C.M.; Chang, T.C.; Mendell, J.T.; Salzberg, S.L. StringTie enables improved reconstruction of a transcriptome from RNA-seq reads. Nat. Biotechnol. 2015, 33, 290–295. [Google Scholar] [CrossRef] [PubMed] [Green Version]
  20. Love, M.I.; Huber, W.; Anders, S. Moderated estimation of fold change and dispersion for RNA-seq data with DESeq2. Genome Biol. 2014, 15, 550. [Google Scholar] [CrossRef] [Green Version]
  21. Langfelder, P.; Horvath, S. WGCNA: An R package for weighted correlation network analysis. BMC Bioinform. 2008, 9, 559. [Google Scholar] [CrossRef] [Green Version]
  22. Huerta-Cepas, J.; Szklarczyk, D.; Heller, D.; Hernandez-Plaza, A.; Forslund, S.K.; Cook, H.; Mende, D.R.; Letunic, I.; Rattei, T.; Jensen, L.J.; et al. eggNOG 5.0: A hierarchical, functionally and phylogenetically annotated orthology resource based on 5090 organisms and 2502 viruses. Nucleic Acids Res. 2019, 47, D309–D314. [Google Scholar] [CrossRef] [Green Version]
  23. Liu, C.G.; Zhang, G.Q. Single nucleotide polymorphism (SNP) and its application in rice. Yi Chuan 2006, 28, 737–744. [Google Scholar]
  24. Schmid, K.J.; Sorensen, T.R.; Stracke, R.; Torjek, O.; Altmann, T.; Mitchell-Olds, T.; Weisshaar, B. Large-scale identification and analysis of genome-wide single-nucleotide polymorphisms for mapping in Arabidopsis thaliana. Genome Res. 2003, 13, 1250–1257. [Google Scholar] [CrossRef] [Green Version]
  25. He, P.; Huang, S.; Xiao, G.; Zhang, Y.; Yu, J. Abundant RNA editing sites of chloroplast protein-coding genes in Ginkgo biloba and an evolutionary pattern analysis. BMC Plant Biol. 2016, 16, 257. [Google Scholar] [CrossRef] [Green Version]
  26. Kim, J.H.; Choi, D.; Kende, H. The AtGRF family of putative transcription factors is involved in leaf and cotyledon growth in Arabidopsis. Plant J. 2003, 36, 94–104. [Google Scholar] [CrossRef] [PubMed]
  27. Kuijt, S.J.; Greco, R.; Agalou, A.; Shao, J.; t Hoen, C.C.; Overnas, E.; Osnato, M.; Curiale, S.; Meynard, D.; van Gulik, R.; et al. Interaction between the growth-regulating factor and knotted1-like homeobox families of transcription factors. Plant Physiol. 2014, 164, 1952–1966. [Google Scholar] [CrossRef] [PubMed] [Green Version]
  28. Buschmann, H.; Chan, J.; Sanchez-Pulido, L.; Andrade-Navarro, M.A.; Doonan, J.H.; Lloyd, C.W. Microtubule-associated AIR9 recognizes the cortical division site at preprophase and cell-plate insertion. Curr. Biol. 2006, 16, 1938–1943. [Google Scholar] [CrossRef] [Green Version]
  29. Stracke, R.; Werber, M.; Weisshaar, B. The R2R3-MYB gene family in Arabidopsis thaliana. Curr. Opin. Plant Biol. 2001, 4, 447–456. [Google Scholar] [CrossRef]
  30. Arlotta, C.; Puglia, G.D.; Genovese, C.; Toscano, V.; Karlova, R.; Beekwilder, J.; De Vos, R.C.H.; Raccuia, S.A. MYB5-like and bHLH influence flavonoid composition in pomegranate. Plant Sci. 2020, 298, 110563. [Google Scholar] [CrossRef] [PubMed]
  31. Clouse, S.D.; Sasse, J.M. Brassinosteroids: Essential Regulators of Plant Growth and Development. Annu. Rev. Plant Physiol. Plant Mol. Biol. 1998, 49, 427–451. [Google Scholar] [CrossRef] [PubMed] [Green Version]
  32. Nam, K.H.; Li, J. BRI1/BAK1, a receptor kinase pair mediating brassinosteroid signaling. Cell 2002, 110, 203–212. [Google Scholar] [CrossRef] [Green Version]
  33. Geilfus, C.M.; Ober, D.; Eichacker, L.A.; Muhling, K.H.; Zorb, C. Down-regulation of ZmEXPB6 (Zea mays beta-expansin 6) protein is correlated with salt-mediated growth reduction in the leaves of Z. mays L. J. Biol. Chem. 2015, 290, 11235–11245. [Google Scholar] [CrossRef] [PubMed] [Green Version]
  34. Cho, H.T.; Cosgrove, D.J. Altered expression of expansin modulates leaf growth and pedicel abscission in Arabidopsis thaliana. Proc. Natl. Acad. Sci. USA 2000, 97, 9783–9788. [Google Scholar] [CrossRef] [PubMed] [Green Version]
  35. Wang, Z.; Cao, H.; Sun, Y.; Li, X.; Chen, F.; Carles, A.; Li, Y.; Ding, M.; Zhang, C.; Deng, X.; et al. Arabidopsis paired amphipathic helix proteins SNL1 and SNL2 redundantly regulate primary seed dormancy via abscisic acid-ethylene antagonism mediated by histone deacetylation. Plant Cell 2013, 25, 149–166. [Google Scholar] [CrossRef] [Green Version]
  36. Huarte, H.R.; Puglia, G.D.; Prjibelski, A.D.; Raccuia, S.A. Seed Transcriptome Annotation Reveals Enhanced Expression of Genes Related to ROS Homeostasis and Ethylene Metabolism at Alternating Temperatures in Wild Cardoon. Plants 2020, 9, 1225. [Google Scholar] [CrossRef]
  37. Puglia, G.D.; Prjibelski, A.D.; Vitale, D.; Bushmanova, E.; Schmid, K.J.; Raccuia, S.A. Hybrid transcriptome sequencing approach improved assembly and gene annotation in Cynara cardunculus (L.). BMC Genom. 2020, 21, 317. [Google Scholar] [CrossRef]
  38. Smita, S.; Katiyar, A.; Chinnusamy, V.; Pandey, D.M.; Bansal, K.C. Transcriptional Regulatory Network Analysis of MYB Transcription Factor Family Genes in Rice. Front. Plant Sci. 2015, 6, 1157. [Google Scholar] [CrossRef] [PubMed] [Green Version]
Figure 1. Sampled tissues in the female G. biloba tree across three periods.
Forests 12 00315 g001
Figure 2. Evaluation of sequencing quality and expression. (a): Distribution of sequencing error rate. Read 1 and read 2 are paired-end sequencing reads generated from Illumina platform. (b): Saturation diagram of transcriptome data. The abscissa represents the percentage of reads located on the genome from sampling data to the total mapping rate, and the ordinate represents the percentage of genes in each fragment per kilobase of transcript per million fragments mapped (FPKM) range whose expression difference is less than 15% in all sampling results. (c): Box plot of FPKM values in each sample. The black solid line in the boxplot represented the average FPKM values. T01, T02, and T03, respectively, represent one female and two male trees at period 1 (18 June), and T04-T06/T07-T09 represent these three trees at period 2 (15 August) and period 3 (15 October) accordingly.
Forests 12 00315 g002
Figure 3. Annotation results of new genes. (a): Gene ontology (GO) annotation results of newly identified genes, including cellular component, molecular function, and biological process categories. (b): Homology comparisons between G. biloba new genes and the existing gene sets in multispecies. These new genes are mostly homologous with the existing genes of Picea sitchensis.
Forests 12 00315 g003
Figure 4. SNP density distribution in G. biloba genes. The abscissa axis represents the number of SNPs per kbp, and the ordinate axis represents the number of genes with the according SNP density.
Forests 12 00315 g004
Figure 5. Results of differentially expressed genes in G. biloba. (a): The Venn diagram of differential expressed genes (DEGs) across different periods. The overlap represents the same DEGs among different comparison groups. (b): Volcanic map of the differential genes between the second and third periods. Green dots represent down-regulated differentially expressed genes, red dots represent up-regulated differentially expressed genes, and black dots represent non-differentially expressed genes. (c): Heat map of gene expression between the second and third periods. B group represent the three samples at period 2 (August), and C group are those at period 3 (October) with red represents up-regulated expression.
Forests 12 00315 g005
Figure 6. Summary of DEGs annotation during G. biloba leaf growth. (a): Functional annotation results of the DEGs between the first and second periods. The ordinate is the name of KEGG metabolic pathway, and the abscissa is the number of genes annotated to this pathway and the proportion of the number of genes annotated to the total. (b): KEGG bubble map of DEGs between the second and third stages. The abscissa axis is the enrichment factor, indicating the ratio between the proportion of genes annotated to a certain pathway in the differentially expressed genes and the proportion of genes annotated to that pathway in all genes. The higher the enrichment factor, the more significant the enrichment level of differentially expressed genes in the pathway was. The color of the circle represents the q-value, which is the p-value after multiple hypothesis testing and correction. KEGG—Kyoto Encyclopedia of Genes and Genomes.
Forests 12 00315 g006
Figure 7. Results of WGCNA analysis and experimental validation. (a): Heat map of expression correlation coefficient among different gene modules based on WGCNA analysis. ME represents gene modules clustered after WGCNA analysis, and the genes in each module have similar expression patterns. (b): The cluster tree of expression patterns among gene modules. Euclidean distance is utilized to calculate the distance between different gene modules. (c): Real-time PCR validation of two GROWTH-REGULATING FACTOR (GRF) factors involved in G. biloba leaf growth. The vertical bars represent the standard error.
Forests 12 00315 g007
Table 1. Summary of sequencing quality.
Sample IDClean ReadsMapped ReadsGC (%)N (%)Q20 (%)Q30 (%)
T0140,843,50232,241,189 (78.94%)45.830.0195.6890.09
T0245,536,70236,635,846 (80.45%)45.360.0195.2789.37
T0343,261,36034,735,785 (80.29%)46.000.0195.6189.94
T0441,269,61433,568,286 (81.34%)45.330.0195.5289.77
T0548,103,98239,385,780 (81.88%)45.920.0195.6389.96
T0646,977,09238,531,630 (82.02%)44.700.0195.2189.27
T0754,312,46044,998,707 (82.85%)44.460.0195.3489.46
T0855,105,38045,855,776 (83.21%)44.570.0195.5889.92
T0958,075,76048,387,657 (83.32%)44.570.0195.6890.11
Note: T01, T04, and T07, respectively, represent the same tree across three developmental stages. clean reads: number of reads after quality control; mapped reads: number of clean reads mapped to the reference genome; GC: the ratio of bases G&C; N: sequencing error rate; Q20: the ratio of the bases with quality higher than 99%; Q30: the ratio of the bases with quality higher than 99.9%.
Publisher’s Note: MDPI stays neutral with regard to jurisdictional claims in published maps and institutional affiliations.

