Article

Characterizing Ectomycorrhizal Fungal Community Structure and Function of Two Varieties of Pinus clausa That Differ in Disturbance History

1
Department of Biological Sciences, Wright State University, Dayton, OH 45435, USA
2
Department of Biology, University of Mississippi, University, MS 38677, USA
Forests 2021, 12(2), 219; https://doi.org/10.3390/f12020219
Submission received: 22 October 2020 / Revised: 5 February 2021 / Accepted: 11 February 2021 / Published: 13 February 2021
(This article belongs to the Special Issue The Role of Mycorrhizas in Forest Structure and Dynamics)

Abstract

:
Despite the immense amount of diversity present in the soil biota, the ecological and evolutionary processes that regulate species diversity and abundance of ectomycorrhizal (ECM) fungi across space and time remain elusive. In forest ecosystems, ECM fungal diversity may be maintained by periodic disturbances which operate at different time scales due to their effects on host genetic and phenotypic characteristics and the associated environment. To investigate the degree to which these factors shape ECM fungal community composition and function, I sampled 10 independent sites for a pine species indicative of an endangered ecosystem, the Florida scrub, where disturbance history has driven the divergence of a single species into two genetically distinct varieties (Pinus clausa var. immuginata and var. clausa). A total of 300 ECM fungal species were identified based on rDNA ITS sequences, but each variety harbors different ECM species composition and function. A follow-up greenhouse experiment, in which the seed from each variety was grown in its own soil (“home”) and in the soil of the other variety (“away”), suggests these communities differentially impact the growth of their host seedlings. While var. clausa seedlings had the same total biomass regardless of soil origin, var. immuginata had higher biomass in their own soil compared to var. clausa. This is likely due to an increased number of ECM colonized tips in the home soil compared to in away soil. Taken together, these results may suggest different evolutionary histories where structure host genetic and phenotypic characteristics may be important for structuring their dynamics with ECM fungi.

1. Introduction

The soil biota contains an enormous amount of global biodiversity; however, our ecological understanding of the processes that regulate the abundance and species diversity of soil microorganisms across space and time is limited [1,2]. It has been suggested that microbial communities represent complex adaptive systems in which exogenous factors (such as disturbance) modulate endogenous dynamics (such as the relative abundance of community members) [3], but the degree and nature to which this framework applies to ectomycorrhizal (ECM) fungal community remains elusive. In this study, the extent to which host varieties dictated by a history of disturbance shape the composition and function of the ECM fungal community is investigated.
ECM fungi and their plant hosts have a long ecological and evolutionary history important for understanding forest ecosystems. It is estimated that 8000 species of plants and between 7000 and 10,000 species of fungi are capable of forming ECM relationships [4] and trees have coevolved with ECM fungi for at least 90 million years [5]. ECM fungi chiefly associate with woody species in boreal, temperate, and tropical forests where they affect host growth and water/nutrient absorption [6]. These relationships are particularly important for conifer hosts, as they form obligate associations and play a pivotal role in both the survival and regeneration of their hosts [6,7].
Forest ecosystems are greatly influenced by both human-induced and natural disturbances, altering their composition, structure, and functional processes [8]; however, the role disturbance plays in altering ECM fungi associated with forests is an area of developing research. Exposure to disturbance agents that operate at different temporal and spatial scales may impose differences in the age structure and regeneration dynamics of populations, increasing their population-level phenotypic and genetic diversity [9,10,11,12]. Since ECM fungal communities respond differently to variation in phenotypic and genetic diversity of hosts across populations [13,14], this may lead to differences in ecological and evolutionary feedbacks which vary among disturbance types. As disturbance frequency and intensity increase with climate change, understanding these feedbacks is vital for understanding vegetation dynamics in frequently disturbed ecosystems.
In obligate ECM systems which require association with ECM fungi for survival, one of the most important feedbacks to tease apart may be the effect these fungi have on the regeneration and growth of seedlings. Genetic and phenotypic differences of the host have long been known to alter seedling performance independent of ECM fungi [15]. However, the relationship of seedling performance and host genetics to ECM fungi is less well described. While some studies suggest seedling performance is more reflective of seedling genetic and life history effects than ECM networks [16], other works suggest specific ECM host genotype combinations are important for dictating seedling performance [13]. Despite these mixed results, seedling performance can provide another important dimension for understanding ECM responses to phenotypic and genetic differences in the host.
To fully understand these feedbacks, it’s important to not only understand changes in species composition, but changes in ECM fungal function. Capturing fungal function has been an area of much debate, but exploration traits provide one avenue by which ECM fungal functions can be illustrated [17,18]. These traits are based on the extramatrical mycelium of the fungus which extends from ECM root tips into the soil to facilitate nutrient uptake and transport, so the ECM fungi can acquire nutrients [17,18]. Variation in exploration types allows fungi to acquire nutrients across a wide range of environmental conditions and reflects differences among taxa in these strategies [17,18,19]. For example, long-distance and medium-distance fringe exploration types potentially thrive in forest soils with recalcitrant nutrient pools such as those from forests which regularly experience fire, while ECM fungal species with contact-, short-, and medium-distance smooth exploration types are more likely to be present in labile nutrient pools characteristic of soils disturbed by hurricanes [18,20,21,22]. Understanding the effect of ECM fungi on ecosystem processes such as nitrogen and carbon cycling has greatly benefited from a trait-based approach [23,24]. More recently, this approach has been important for understanding the role of biotic and abiotic factors for shaping fungal communities [25,26]. Thus, fungal exploration types, in conjunction with species richness patterns, may be important for understanding ECM community responses to host differences.
Sand pine (Pinus clausa (Chapm. ex Engelm.) Vasey ex Sarg.) is an ideal species to tease apart the effects of host differences on ECM fungi, as there are two distinct varieties of sand pine differentiated primarily by their geographic distribution and dependence on disturbance. The two varieties include both inland and coastal strand populations and are separated by about 100 km; var. clausa (Ocala sand pine) occupies peninsular Florida and var. immuginata D.B. Ward (Choctawhatchee sand pine) occurs primarily in the Florida panhandle (Figure 1). Populations of var. clausa are characterized by a high proportion of individuals with serotinous cones and depend on fire for stand regeneration [11,27,28]. In contrast, var. immuginata is distinguished by open cones and is subject to smaller but more frequent disturbances in the form of hurricanes and extra-tropical cyclones with occasional spot fires [11,27,28]. In addition to these phenotypic differences, the two varieties differ in their genetic backgrounds, such that differences in mean genetic distances and allele frequencies between populations of each variety are greater than for those of the same variety [12]. Despite their ecological importance, few studies have considered the relationship between ECM fungi and either variety of Pinus clausa (P. clausa) in natural settings (but see [29] for nursery inoculations). Consequently, there is little baseline data to draw from for inferring the relationship how these important fungi potentially play in mediating host responses to disturbance, even though disturbance is important for structuring the phenotypic and genetic background of the host populations.
Most natural environments are subject to fluctuations over time, potentially increasing environmental heterogeneity and altering ECM community structure and diversity. To investigate the degree to which these historic dynamics shape the ECM community, the ECM fungal community from both varieties of sand pine was sampled directly from their roots. Via the sequencing of the ITS rDNA gene cluster, ECM fungal communities for adult trees of P. clausa from 10 sampling sites in Florida were identified (five from each variety; Figure 1). The extent to which sand pine variety shaped the structure and diversity of the ECM fungal communities, whether these patterns were consistent, and when the community was evaluated as a function of exploration type instead of species identity were then assessed using multivariate modeling methods. Additionally, the potential for differences in the ECM fungal community to influence seedling regeneration was assessed in a reciprocal transplant greenhouse experiment where seedlings were grown in soil from both their own variety (“Home”) and from the other variety (“Away”). Both seedling and fungal responses were measured to better understand the role ECM fungi play in structuring seedling regeneration after disturbance.

2. Materials and Methods

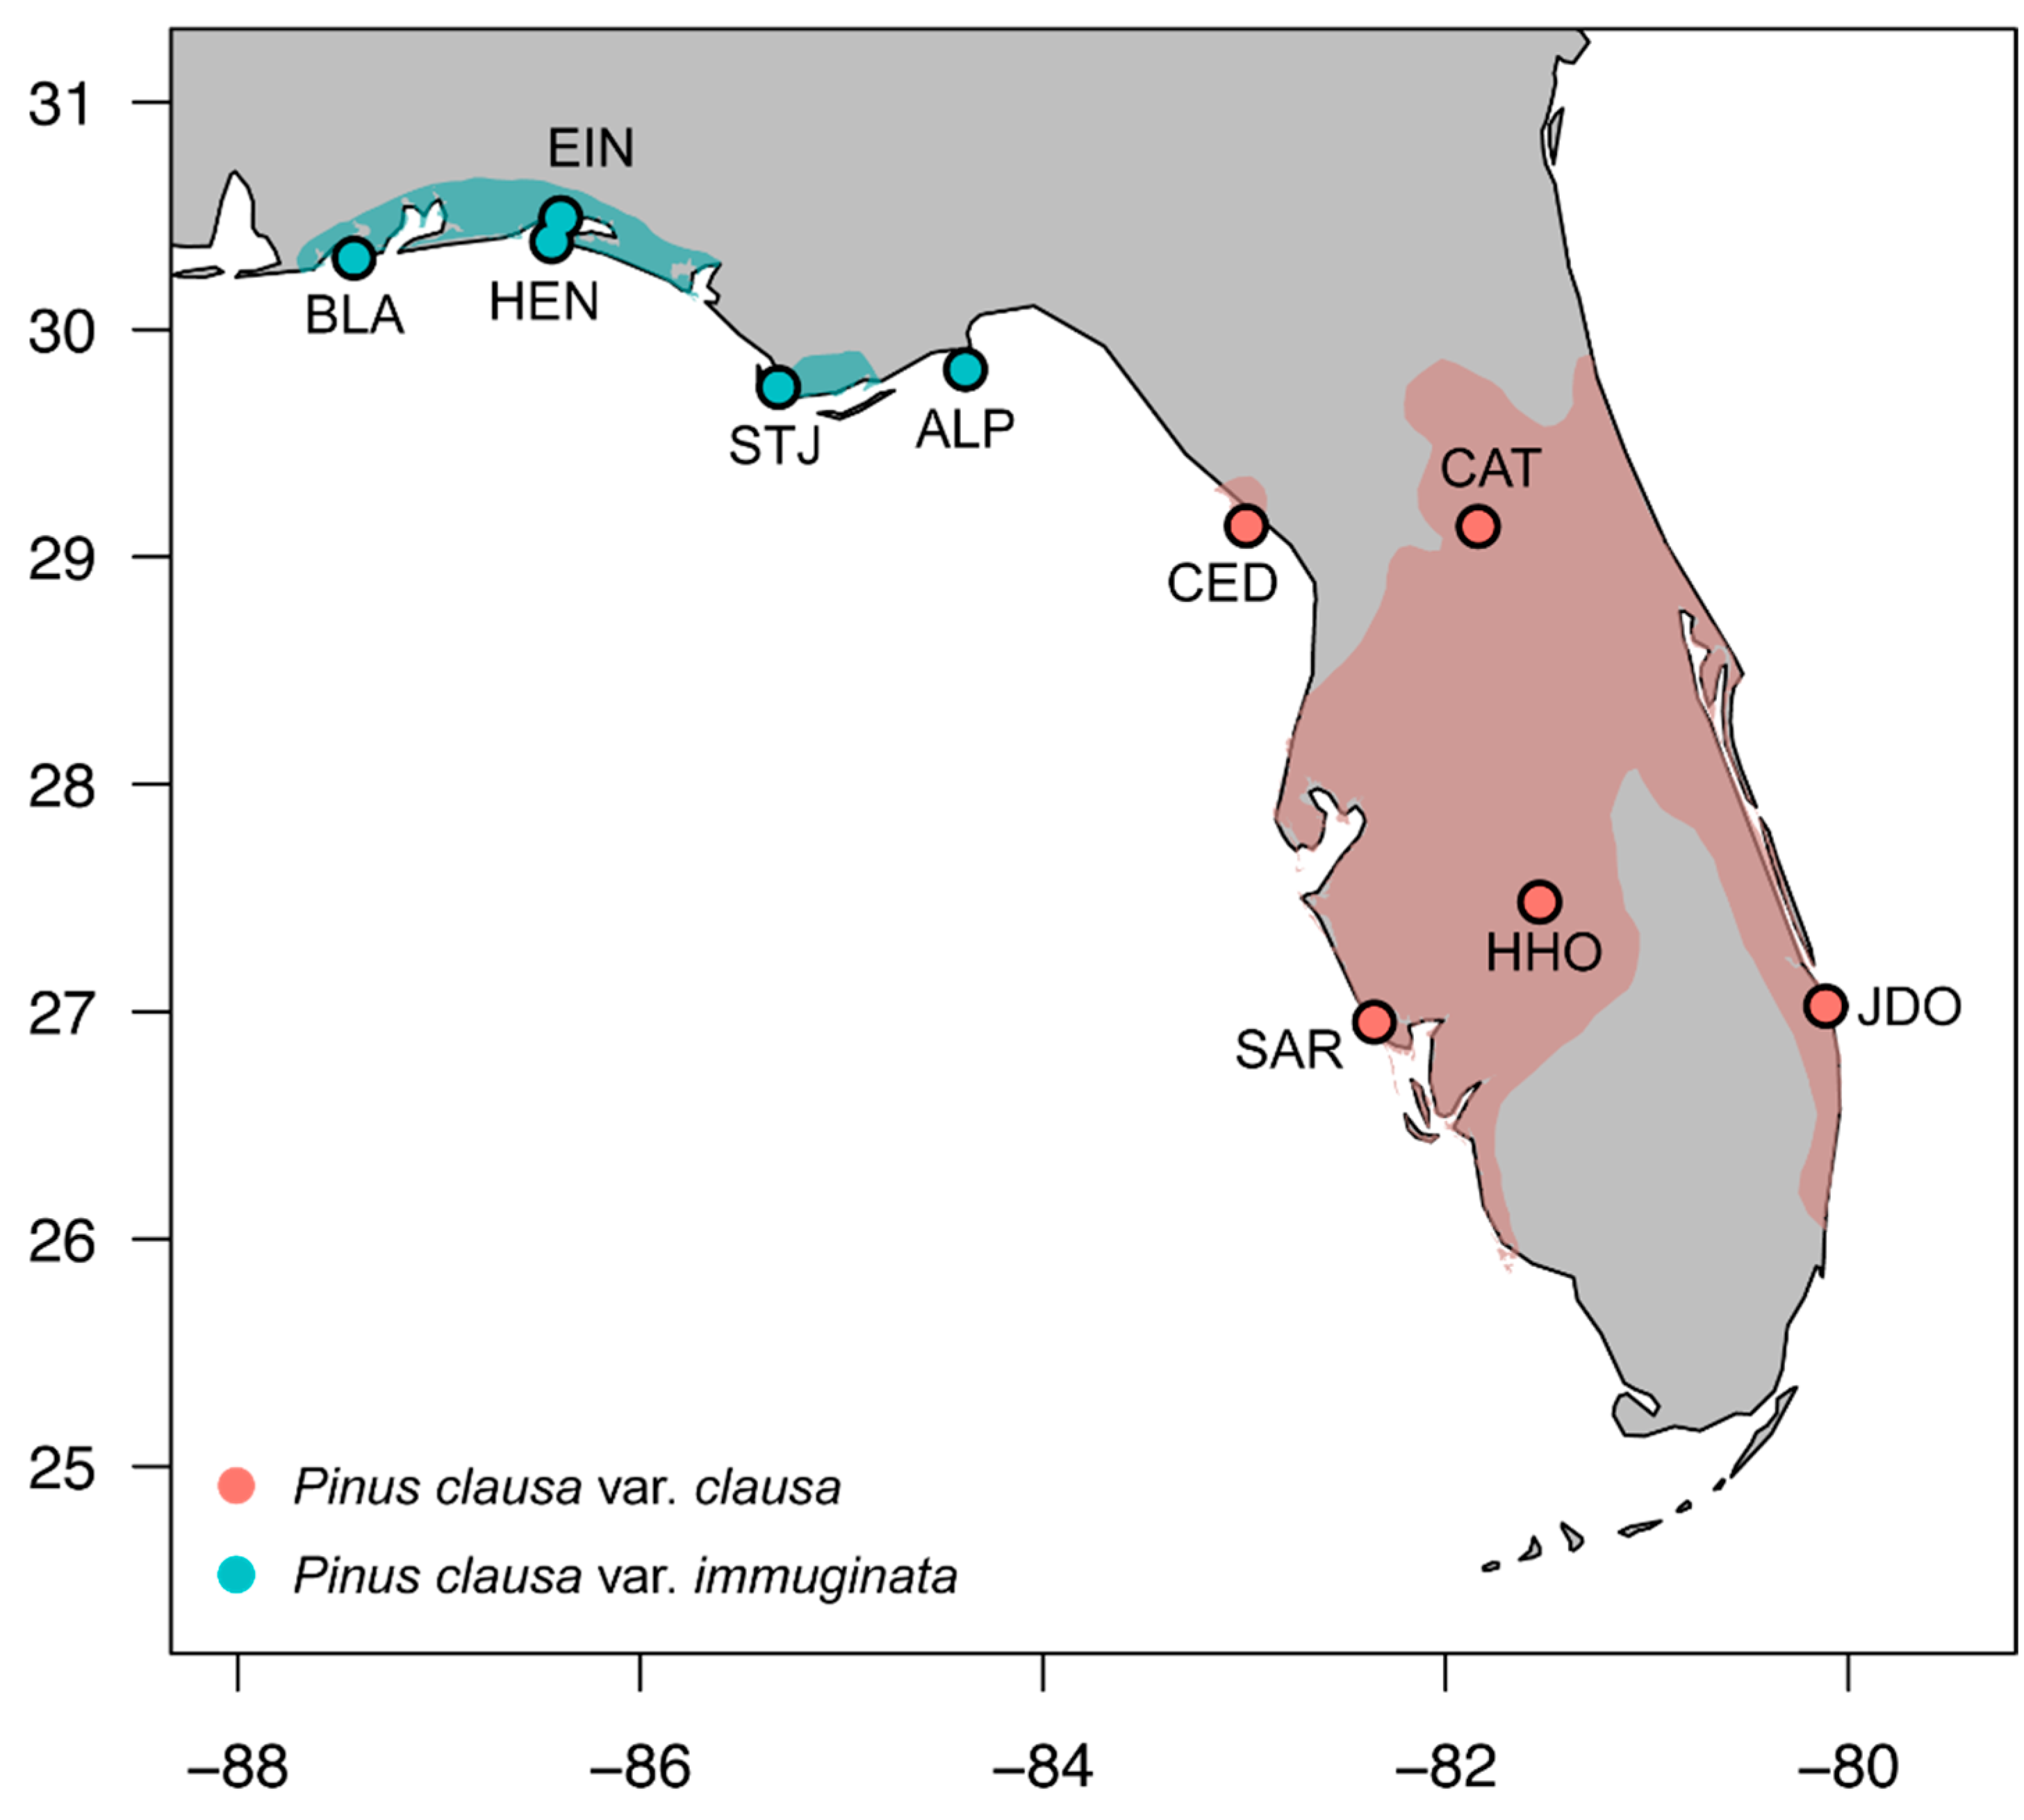
2.1. Field Sampling Methods

Five sites of P. clausa var. clausa and five sites of P. clausa var. immuginata were surveyed based on their distributions within the identified species range, accessibility, and previous record of research [11,12,27,30] (Figure 1, Table 1). P. clausa was the dominant ECM species at all sampling sites, but occasional turkey oaks (Quercus laevis), Myrtle oak (Quercus myrtifolia), Sand live oak (Quercus germinata), and Chapman’s oak (Quercus chapmanii) were observed throughout the range. None were present near the sampled trees, ensuring that the only roots colonized by the ECM fungi present in the system were from P. clausa trees. Samples were collected under Permit Number 03041410 from the Florida Department of Environmental Protection.
Between 27 May and 3 June 2014, I haphazardly sampled five trees at each site that were similar in size as determined by diameter at breast height (DBH; Table 1). The distance between the two farthest spaced trees was approximately 5 m except for in Ocala National Forest (Table 1: CAT), in which the furthest distance was 138 m. To obtain a representative sample of each tree, four soil cores (one from each cardinal direction underneath the dripline around a focal tree) were collected per tree per site (total 20 cores per site). Each core was 10 cm in diameter and 20 cm deep (excluding litter). The samples were transported to the laboratory at the University of Mississippi in insulated coolers. Once at the lab, the samples were stored at 4 °C until processed (approximately 21 days), during which time the surrounding soil and root samples were kept intact.

2.2. Field Characterization of the ECM Fungal Community

2.2.1. Fungal Sequencing and OTU Generation

Laboratory Processing of Root Samples and Morphotyping

For each sample, rhizosphere soil was removed from roots by handwashing cores over a 2 mm sieve, and all roots within a sample were pooled and examined using a dissecting microscope. All root tips present in the sample were counted using a hand tally counter, and tips colonized by ECM fungi as evidenced by the presence of the fungal mantle were recorded. For root tips with ECM fungal colonization, morphological distinctions such as color, texture, branching patterns, and emanating hyphae or rhizomorphs were used to classify each colonized root tip into a morphotype (sensu [17,18,26]). Two root tips per morphotype per core were then subject to DNA extraction for molecular identification with Sanger sequencing. All root sample processing and morphotyping occurred within 21 days of collection.

DNA Extraction and Sequencing

DNA was immediately extracted from root tips after morphotyping using components of a Sigma Extract-N-Amp extraction kit (Sigma-Aldrich, St. Louis, MO, USA). Ten microliters of the Sigma Extraction Buffer were added to each root tip, heated to 65 °C for 10 min and 95 °C for 10 min and then neutralized with 30 µL of the Sigma Neutralization Solution and 60 µL PCR-grade water. After extraction, the samples were stored at −20 °C.
The fungal-specific forward and reverse primers, ITS1F and ITS4 [31], were used to amplify the ITS1-5.8S-ITS2 region using the protocol outlined in [32]. Successful amplification was checked on a 1% agarose gel with SYBR® Safe DNA gel stain (Molecular Probes, Eugene, OR, USA). Roughly 20% of the samples did not amplify with the default settings; therefore, amplification reactions were repeated using the default methods, but the number of cycles for denaturation, annealing, and extension was increased to 40 cycles. A further 10% of these samples failed to amplify, so the DNA for these samples was diluted to 1% DNA (1 µL DNA + 99 µL sterile PCR-grade water) and amplification reactions were repeated using the same methods as the default, with 40 cycles for denaturation, annealing, and extension. Approximately 5% of dilutions did not amplify with these settings, so amplification was repeated with a lower annealing temperature (51 °C) and 35 cycles for denaturation, annealing, and extension. A small portion of the samples that did not amplify with the above modifications were re-run with an annealing temperature of 54 °C for 30 cycles or 33 cycles. Empty wells which were treated the same but did not include root tips were run with each set of amplification parameters as negative controls; no amplification was identified in these wells. Overall, DNA from at least one root tip per morphotype observed in each sample was successfully amplified. In total, of the 1198 root tips collected (from 376 morphotypes), 1106 were successfully amplified.
The enzymes Exonuclease I (ExoI) and Antarctic Phosphotase (AP; New England BioLabs, Inc., Ipswich, MA, USA) were used to remove excess primer and unincorporated nucleotides. Five microliters of the PCR product were added to 0.5 µL ExoI, 0.5 µL AP, and 4.5 µL sterile PCR-grade water and incubated at 37 °C for 45 min, 80 °C for 20 min, and 4 °C for 5 min.
Sequencing was completed with the forward primer ITS5 [31] and the Big Dye Terminator Sequencing Kit (v3.1, Invitrogen Corp., Carlsbad, CA, USA). Each reaction consisted of 1 µL of the cleaned PCR product, 0.4 µL Big Dye Reaction Premix, 1.8 µL Big Dye 5 X sequencing buffer, 0.5 µL of 10 µM concentration forward primer, and 6.3 µL PCR-grade water. Amplification conditions were 96 °C for 1 min, followed by 35 cycles of 95 °C for 30 s, 50 °C for 20 s, and 60 °C for 4 min. Reactions were shipped overnight after drying to the DNA Lab at Arizona State University in Tempe, Arizona. Big Dye reactions were purified and read on an Applied Bioscience 3730 capillary genetic analyzer.

Sequence Assignment

When possible, fungal DNA sequences were corrected for ambiguous bases associated with dye blobs manually in Geneious software (Biomatter Ltd., Auckland, New Zealand). Sequences with >3% ambiguous bases or <200 base pairs long were removed. The rest of the sequences were assembled into OTUs with 97% similarity using CAP3 software [33] on the University of Alaska, Fairbanks (UAF) Life Science Informatics server as described previously in [26,32]. Default settings were used except the following: maximum overhang percent length = 60; match score factor = 6; overlap percent identity cut-off = 97; clipping range = 6. This conservative approach has been successfully employed previously [34,35,36]. It assumes a 0.2–1.2% PCR error rate, unidirectional sequencing, and ~1.5% divergence of the ITS region consistent within some species found at small spatial scales [37].
Best matches for the taxonomic affiliation of OTUs were determined using BLAST [38] (nucleotide) searches with consensus fungal sequences from each OTU against the International Nucleotide Sequence Database (INSD) and the User-Friendly Nordic ITS Ectomycorrhizal (UNITE) database [39]. Best matches were determined based on both similarity and length of the match with preferences given to matches with named, cultured fungi and greater than 97% similarity (hereafter, “species”). Matches between 94% and 97% similarity to a database sequence with an assigned species epithet or matching a sequence identified only to genus were assigned into the respective genus and assigned a number (e.g., Russula1). Similarly, matches with <94%, but >90%, were assigned to an appropriate taxonomic family. Sequences of which the matches were <90% were removed from analyses. If sequence matches among the two sequence repositories showed equal affinity or similarity to multiple genera within a family, priority was given to the vouchered specimens residing on the UNITE. ECM fungal status was assigned based on [40,41] using taxonomic assignment. Strictly pathogenic species were eliminated from the data set. Morphotypes within a site all matched the same species.
For fungal OTUs that were identified to species, fungal traits associated with foraging strategy and foraging distance (exploration type) and ability to absorb water in less than 15 s (hydrophobicity) [17,42] were assigned using the Determination of EctoMYcorrhiza database (DEEMY, http://www.deemy.de (accessed on 22 October 2020)). When no species-level matches were available in the DEEMY, entries for congeners associated with Pinus were surveyed since foraging-related functional traits are generally conserved at the genus level [43]. If 90% of entries at the genus level agreed, consensus trait values were assigned (sensu [25,26]). Trait assignment was matched against the morphological traits collected during tip colonization measurements. For assignments which differed significantly, exploration type was assigned the status “unknown”. Exploration types were then used to classify the extent of rhizomorph biomass accumulation. Long, medium-mat, and medium-fringe distance exploration types were classified as high biomass, while the remaining exploration types (medium-smooth, short, and contact) were classified as low biomass [18].

2.2.2. Statistical Analyses

All analyses were done with R statistical software, version 4.0.3 [44]. The abundance of colonized tips was pooled by tree within a site (across all four soil cores) before analyses. For multivariate analyses, in order to place all species abundances on the same relative scale, the abundance of each ECM fungal species was relativized by the total abundance observed in the data set [45].
To assess the sources of variation in the ECM community due to the variety and fungal foraging strategy, dissimilarity indices using the Bray–Curtis method and permutational manova based on 1000 permutations were calculated with the adonis function from the vegan package [46]. Analyses were repeated to account for the variation in a site, such that adonis permutations were restricted using the “strata” argument with the site as the grouping variable. This analysis was visualized using NMDS plots with the Bray–Curtis method implemented with the metaMDS function in the vegan package and the ggplot2 package [46,47]. To identify fungal species or foraging strategies which associate significantly with either variety, correlation indices were calculated with the multipatt function from the indicspecies package [48].
Alpha diversity (ECM fungal diversity recovered from a single tree) was estimated using both the Chao1 index and the Shannon diversity index with functions in the vegan package—estimateR to determine the Chao1 index and diversity to determine the Shannon index [46]. Variation in richness and diversity between variety was determined using linear models with the lme function and variety or environmental variables as the predictor variable(s) and site as a random effect. Analyses were repeated using the DBH as a covariate, but results were not qualitatively different from when it was excluded; therefore, results without the covariate are presented here.
The frequencies of different ECM fungal foraging strategies were calculated by variety (across sites) and by site (across trees) as the proportion of total identified tips for a particular fungal trait belonging to each variety or site. It was then analyzed with Pearson’s chi-squared tests from the xtabs function in the stats package to determine differences driven by variety and/or site [44].

2.3. Greenhouse Experiment

2.3.1. Experiment Description

To assess the degree to which plant-soil feedback structures the relationship between P. clausa varieties and their soil, a factorial greenhouse experiment in which seedlings were reciprocally grown in soil harvested from the stands of their own variety (“Home”) and the other variety (“Away”) was conducted. Each treatment combination (var. clausa Home vs. Away, var. immuginata Home vs. Away) was replicated three times within five blocks for a total of 60 seedlings. The seeds were manually extracted from approximately 20 pine cones directly collected from three sites of each variety (var. clausa: Highlands Hammock State Park, Jonathan Dickinson State Park, and Cedar Key Scrub State Reserve; var. immuginata: Henderson Beach State Park, Alligator Point, and Big Lagoon State Park). To ensure enough viable seeds per variety were available, the seeds were then pooled by variety. Soil was collected from the same sites as where the seeds were located during the previously described sampling trip, stored in cold storage at 20 °C for 12 months and then pooled by variety to be consistent with seed source.
This study was conducted in a greenhouse at Wright State University. Prior to planting, the seeds were stratified at 4 °C for four weeks and then germinated in a potting medium (Metro Mix 360; Sun Gro Horticulture Inc., Agawam, MA, USA) and grown for 6–8 weeks. The seedlings were carefully removed from the germinating flats, checked for ECM colonization to ensure they were nonmycorrhizal prior to the experiment and then planted into D16 Deepots (Stuewe and Sons, Inc., Tangent, OR, USA) with approximately 900 g of field collected soil. The seedlings were planted into pots in December 2016 and allowed to grow until May 2017, at which time they were destructively harvested. During this time, the temperature in the greenhouse was kept between 22 °C and 25 °C. The seedlings were grown in full sunlight and were watered every other day.
Over the course of the experiment, survival and relative growth rate (RGR) were assessed. To estimate the RGR, the length of the longest needle-bearing stem was measured on each plant. RGR was estimated as (ln(h2) – ln(h1))/(number of days), where h1 is the length of needle-bearing stem at planting and h2 is the length of needle-bearing stem at harvest. Total biomass, root:shoot biomass allocation, and specific root length (meters per gram of root) on all surviving seedlings were measured at harvest. Plant root and shoot were separated at harvest and roots were further separated from the soil, dried at 60 °C for 72 h and weighed to determine final biomass. Plant root length was estimated using a grid-intersect method [49], and the number of root tips colonized by fungus was noted (“Number of colonized tips”). Colonization density (“colonization”) was calculated by dividing the total number of colonized tips by the root length for that sample.

2.3.2. Statistical Analyses

Variation in biomass, height, and RGR between variety and soil source was assessed using linear models with the lme function with block as a random effect and variety, soil source, and their interaction as fixed effects. Variation in the number of colonized tips was assessed using generalized linear models with the glmer function from the lme4 package [50] and Poisson error distribution with block as a random effect and variety, soil source, and their interaction as fixed effects. Variation in colonization was assessed using linear models with the lme function with block as a random effect and variety, soil source, and their interaction as fixed effects. The relationship between number of tips colonized and plant biomass as a function of plant variety and soil source was assessed using the lme function with plant biomass as a response variable, block as a random effect, and the number of colonized tips, variety, soil source, and their interaction as fixed effects. Significant interactions were subject to Tukey’s HSD post-hoc tests using the glht function from the multcomp package [51]. All analyses were done with R statistical software, version 4.0.3 [44].

3. Results

3.1. Field Characterization of the ECM Fungal Community

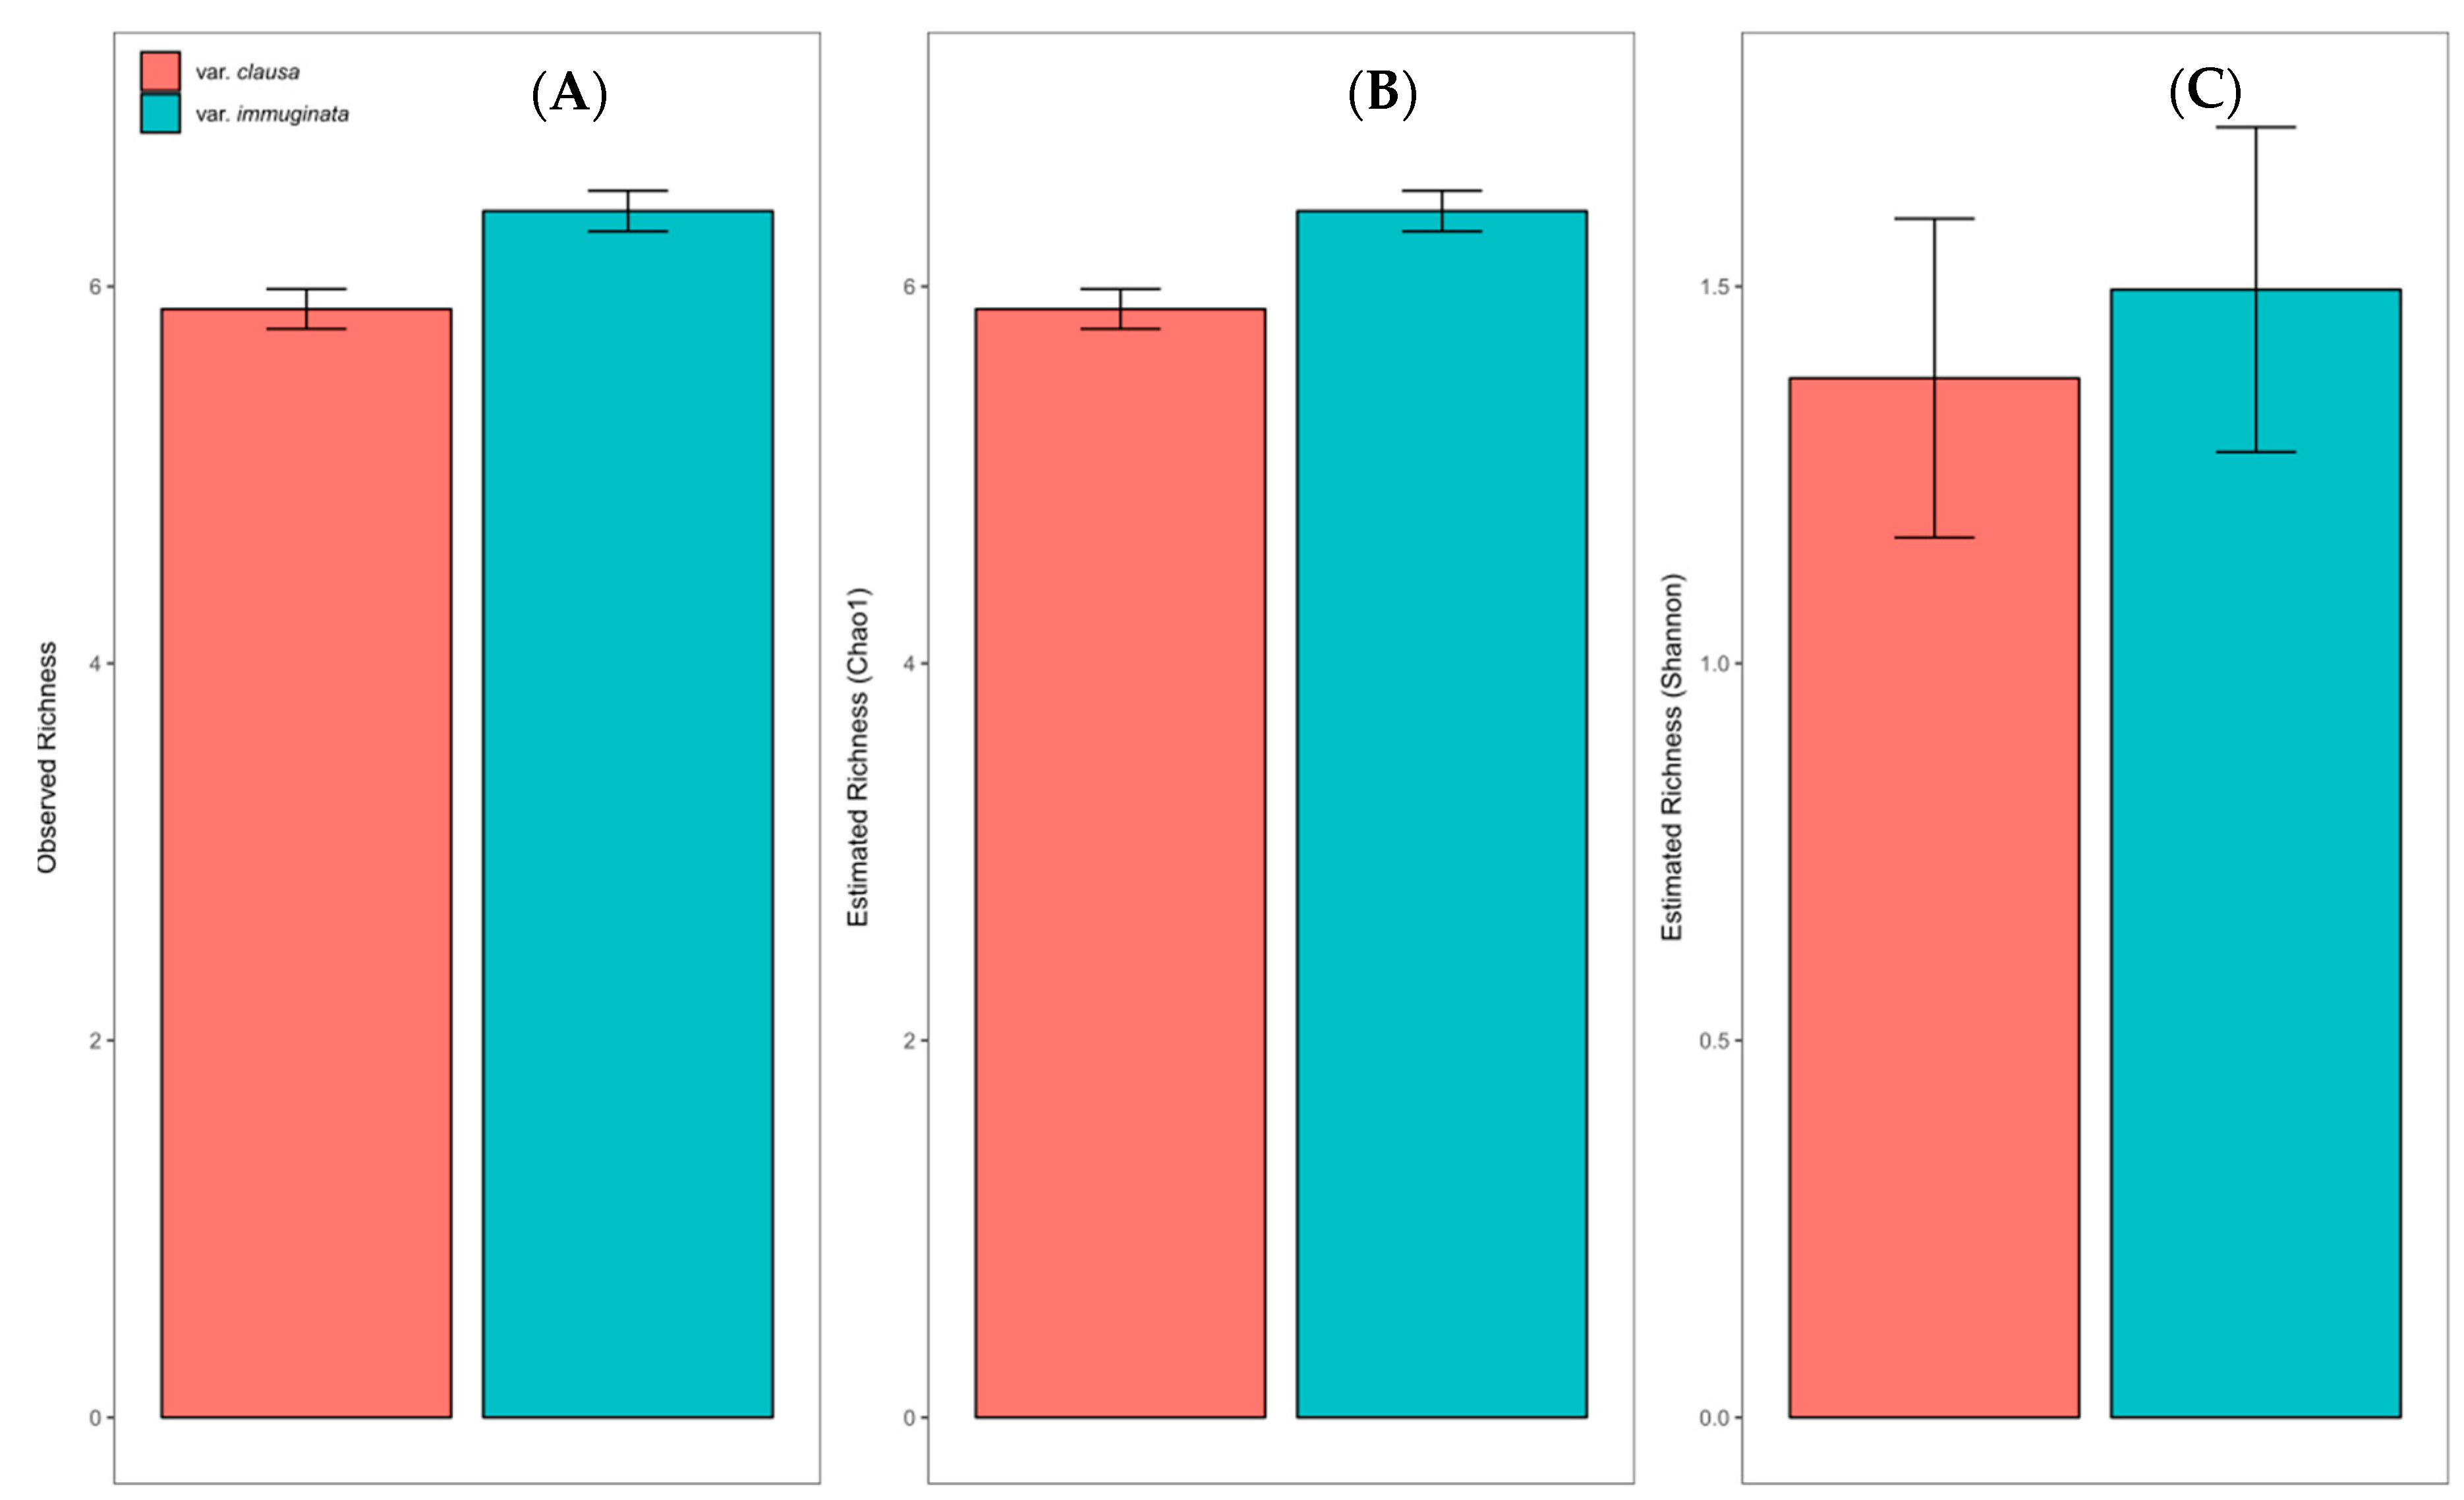
3.1.1. Overall ECM Fungal Community Description

The ECM fungal community was identified from a total of 39,094 ECM colonized root tips (var. clausa: 17,888 and var. immuginata: 21,206) and consisted of 300 OTUs from 44 families from 376 originally identified morphotypes. Analyses were restricted to the top 100 OTUs from 30 families. This resulted in 35,185 ECM colonized tips, 90% of the total identified colonized tips (Figure 2A). The three most common families were Russulaceae (48% of total tips), Gloniaceae (25% of total tips), and Cortinariaceae (8% of total tips; Figure 2B). The fungal sequence data for this project have been submitted to the GenBank databases under the accession numbers KX898986–KX899904.

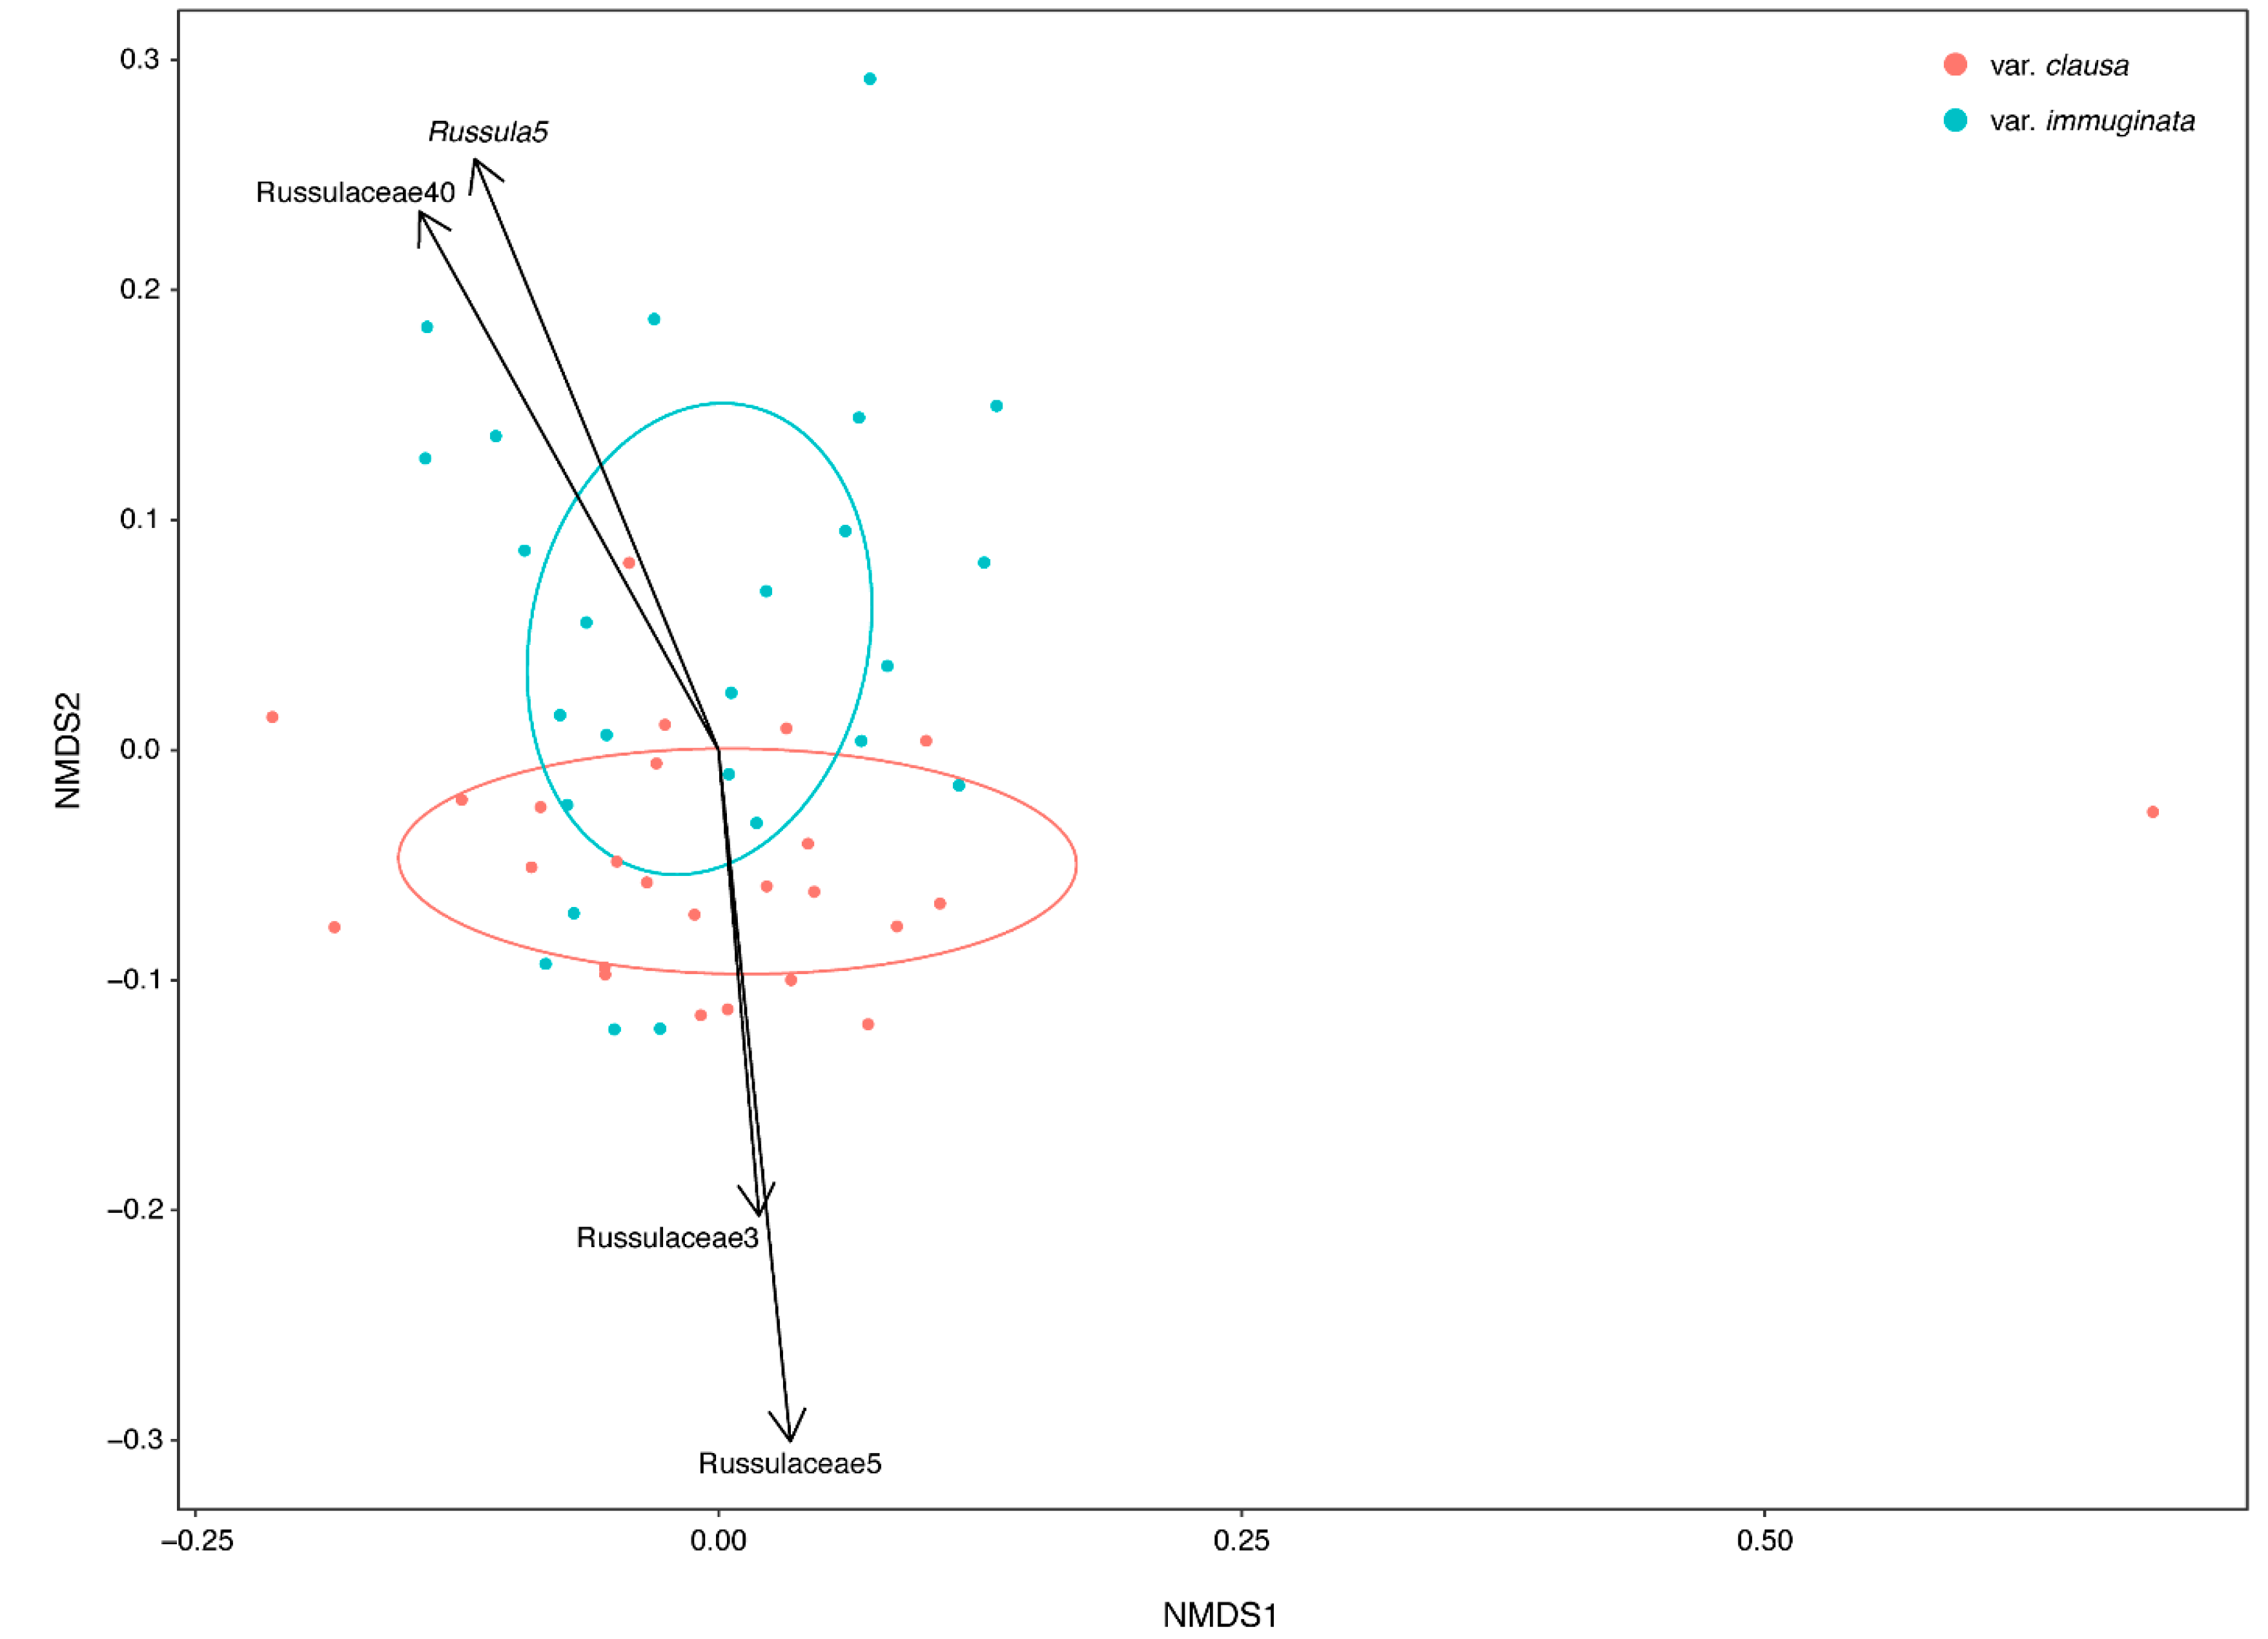
3.1.2. Community Structure as a Function of Variety

Alpha diversity was similar for var. immuginata and var. clausa for both the Chao1 index (Figure A1; F1,8 = 1.0535; p = 0.3347) and the Shannon index (Figure A1; F1,8 = 1.0989; p = 0.3251).
Mycorrhizal community similarity was visualized in ordination plots (Figure 3), and community composition showed significant structuring by variety (R2 = 0.04, p = 0.005). Russulaceae5 (p = 0.007) and Russulaceae3 (p = 0.039) were strongly and significantly associated with var. clausa, while Russulaceae40 (p = 0.026) and Russula5 (p = 0.034) were significantly associated with var. immuginata.

3.1.3. Distribution of Fungal Traits Involved with the Foraging Strategy

Of the 39,094 colonized root tips, 38,969 were successfully assigned exploration types. While it was not possible to resolve some of the OTUs beyond the family level, the fungal traits identified here, particularly rhizomorph biomass and hydrophobicity, are also conserved at the family level. This is particularly true for the dominant family Russulaceae. The distribution of fungal traits associated with the foraging strategy was dependent upon host variety for exploration type (χ2 = 1463.5, p < 0.0001). Specifically, ECM fungi with short distance (p = 0.002), medium distance fringe (p < 0.0001), or contact (p < 0.0001) exploration types were most common for var. immuginata sites, while ECM fungi with the medium distance smooth (p < 0.0001) of long distance exploration type (p = 0.0004) were more prominent for var. clausa sites (Figure 4A).
Both var. immuginata and var. clausa had a higher portion of ECM fungi with low biomass compared to those with high biomass (χ2 = 281.7, p < 0.0001; Figure 4B) and higher-portion hydrophilic fungi compared to hydrophobic (χ2 = 281.4, p < 0.0001, Figure 4C).

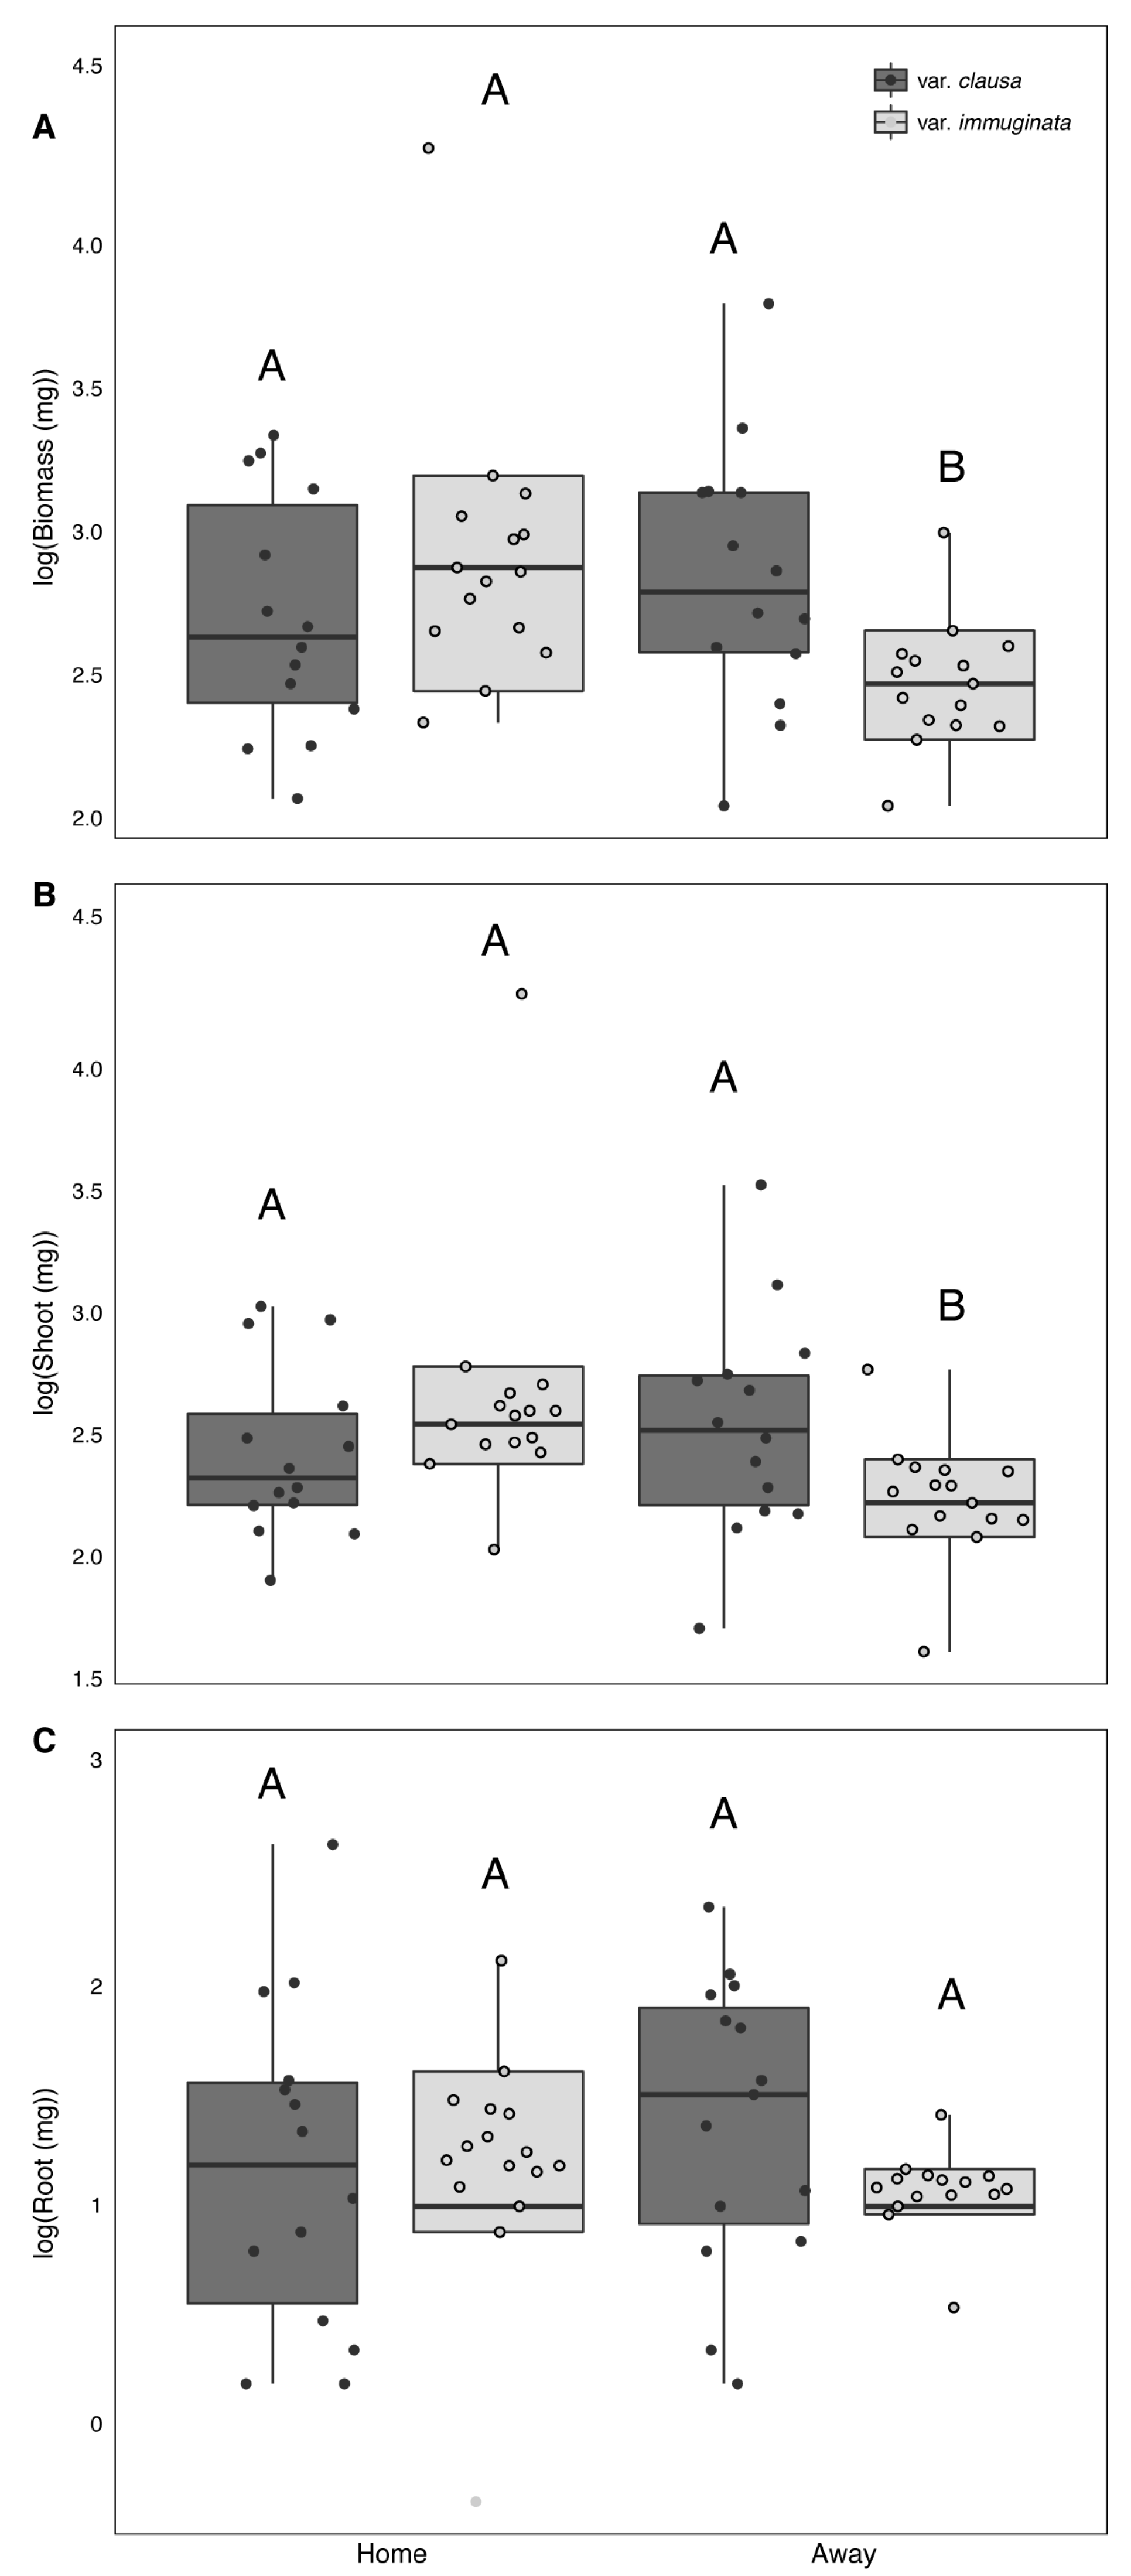
3.2. Greenhouse Experiment

Both total biomass (F1,30 = 4.2659, p = 0.0476) and shoot biomass (F1,30 = 4.5431, p = 0.0414) were significantly altered when the seedlings were grown in home versus away soil, but this effect depended upon host variety (variety × soil source). While total and shoot biomass for var. clausa were not different in home vs. away soils, var. immuginata was smaller in away compared to in home soils (Figure 5). Root biomass did not statistically significantly differ between home and away soils independently or as a function of variety (p > 0.05).
Soil source did not statistically significantly alter final height at harvest or relative growth rate either as main effects (height: p = 0.2745; RGR: p = 0.7419) or interacting with host variety (height: p = 0.3896; RGR: p = 0.3989). However, final height at harvest (variety: F1,30 = 5.911, p = 0.0212) and RGR (variety: p = 0.0031) were greater for var. clausa compared to for var. immuginata, regardless of soil source.
The P. clausa var. clausa seedlings had more ECM colonized tips (variety: p = 0.0119) and greater colonization (variety: F1,31 = 7.6056, p = 0.0097) than the var. immuginata seedlings, but soil origin did not affect these results (soil source: p > 0.05). However, soil origin mediated the total biomass response of the seedlings to ECM colonization (number colonized tips × variety × soil source: F1,26 = 4.005, p = 0.0505). While the var. clausa seedlings with more ECM colonized tips grew larger regardless of soil origin, the var immuginata seedlings grown in home soils grew larger with more ECM colonized tips but the seedlings grown in away soils grew smaller with more ECM colonized tips (Figure 6).

4. Discussion

While the soil biota is comprised of an enormous amount of global biodiversity, our understanding regarding the processes that determine species diversity and abundance of soil microorganisms across space and time remains unclear [1]. The research presented here indicates the ECM community of P. clausa was unique to variety (Figure 3 and Figure A1), and this extended to differences in seedling performance (Figure 5 and Figure 6). These results suggest that periodic disturbances which operate at different time scales in forest ecosystems to create differences in the age structure and regeneration dynamics of tree populations, as well as increasing phenotypic and genetic diversity across populations of the same tree species, are also important for shaping the mycorrhizal community [9,10,11,12].
Host variety was particularly important for describing differences in the ECM fungal community structure and diversity. The ECM fungal community was clearly grouped into two distinct communities based on host variety (Figure 3). A more diverse ECM fungal community was identified from var. immuginata than from var. clausa (Figure A1). Selection by the environment is one process suggested to be important for shaping soil microbial community composition [52,53]. Although not directly measured here, soils throughout the entire range of P. clausa are characterized as sandy dune soils with low water holding capacity and low nutrient status [12,28]. The similarities in sampling environments across this range suggest alternative mechanisms such as those related to traits of the host are responsible for shaping these patterns. Host range size also potentially structures EM fungal communities [54], but a more diverse ECM fungal community was identified from var. immuginata than from var. clausa despite var. immuginata’s smaller range size (Figure 1 and Figure A1). Taken together, these results could suggest that the pronounced differences in ECM fungal community structure and composition between the two varieties reflect their genetic differentiation due to variation in disturbance history. This further suggests that periodic disturbances not only structure host species [11,12,27,28] but may also be important for ECM fungal community structure and diversity.
Not only was variety a significant structuring factor of mycorrhizal assemblages (Figure 3), there were three OTUs significantly associated with var. clausa and two OTUs significantly associated with var. immuginata. Specifically, the OTUs Mycena1, Russulaceae5, and Russulaceae3 were strongly and significantly associated with var. clausa, while Russulaceae40 and Russula5 were significantly associated with var. immuginata. It is perhaps unsurprising that members of the Russulaceae were most likely to exhibit signatures of host specificity, as such, ECM fungi are generally classified as late successional fungi. Late successional fungi are considered to be highly competitive species with a narrow host range, whereas ECM fungi regarded as early colonizers employ a nonspecific strategy in regard to host plant colonization [55,56]. This indicates that ECM fungal communities in this study have likely evolved a degree of host specificity, despite experiencing episodes of periodic disturbance.
Unfortunately, there were a large number of OTUs that could not be resolved past the family level (Figure 2). The vast majority of these arise from the family Russulaceae, one of the most species-diverse ECM lineages, which encompasses the ECM genera Lactarius, Lactifluus, and Russula [57]. While species of Russulaceae are common in forest ecosystems, they are underrepresented in molecular databases. This is likely due to the fact that they are difficult to grow in culture which limits the ability to extract DNA of high molecular weight used for such databases [58]. When such specimens are present in molecular databases, they often arise from economically important temperate coniferous or deciduous forests which may not fully reflect the fungi found in the study presented here, which focuses on a rare and threatened subtropical forest. The same can be said for fungi from the Thelephoraceae, which were also prominent in this study. The limitations of databases in these ways is increasingly recognized [58,59]. As these limitations are resolved, assignment of fungi beyond the family level for these and other important ECM families are likely to improve.
Using a trait-based approach to studying ECM fungal ecology may provide important insights beyond those using species identity to understand the effect of periodic disturbances on the fungal community. This study revealed important differences in the ECM fungal traits as a function of host variety. Specifically, ECM fungi with the long distance exploration type were more common for var. clausa sites while ECM fungi with the medium distance fringe or contact exploration types were most common for var. immuginata sites (Figure 4), but there was no differences in the frequency of ECM fungi with the medium distance smooth or short distance exploration type between the two varieties. Since ECM fungi belonging to the short, contact, and some medium distance exploration types form rhizomorphs that do not require as much carbon to construct as those from long distance exploration types, conditions that favor increased carbon allocation belowground are likely to favor long distance exploration types. In contrast, conditions which favor low allocation to belowground carbon are likely to favor other exploration types. Such conditions are likely for var. clausa, which has historically been regulated by stand clearing fires thought to increase soil carbon content [20,56,60] and may be less likely for var. immuginata, which has historically been regulated by hurricanes that are likely to increase soil nitrogen availability [61,62], although neither phenomena have been fully tested in the P. clausa system. This suggests that differences in ECM fungal exploration types for host variety may be attributed to disturbance history, but future research is needed.
The seedling responses to soil origin revealed further differences in host variety. Specifically, larger var. clausa plants always have more ECM fungi, regardless of soil origin, but the same is not true for var. immuginata plants which only exhibit this relationship when grown in home soil (Figure 6). When the var. immuginata seedlings are grown in soil from the var. clausa sites, larger plants have less colonized tips, suggesting an adaptive relationship for var. immuginata to the ECM fungi from their home sites, which does not extend to the ECM fungi from var. clausa sites (Figure 6). This pattern in plant–soil feedbacks suggests seedling responses to the ECM fungal community may have arisen through a variety of mechanisms including variation in succession for either the plant or fungal community due to differences in stand age or local adaptation to variation in the environment [63]. Differing disturbances such as those that structure the phenotypic and genetic background of P. clausa present the opportunity for locally adaptive relationships to develop, but more work in this system is needed to solidify this mechanism.
Despite the promising results presented here, the ability to interpret mechanisms driving these results is limited for both the greenhouse and field study. Ideally, experiments which control for abiotic factors like precipitation or temperature and biotic factors (e.g., pathogen presence) are needed to fully determine the extent to which phenotypic and/or genetic differences in the host also describe differences in microorganism communities. While the greenhouse study presented here fulfills these two qualifications, it is lacking a proper control to better understand whether host genotype is driving the interactions presented here [63]. Such a control would include a factorial manipulation growing both genotypes in a common sterilized soil with the ECM community from either their own variety (“Home”) or that of the other variety (“Away”). Perhaps the ultimate test for determining the mechanisms driving the patterns presented here would involve a field study in which P. clausa seedlings from both varieties are grown in the same location and monitored for an extended period of time. To date, no such study exists with P. clausa. Therefore, future studies seeking to understand the degree to which differences in host traits reflective of the two varieties of P. clausa drive differences in ECM community composition and its subsequent effects on seedling growth are needed.

5. Conclusions

The frequency and intensity of disturbances are likely to increase due to changing climatic conditions [8], so understanding how fungal communities respond to periodic disturbances is increasing in importance. Bridging this knowledge gap may be particularly important for pine species which form obligate relationships with their ECM fungi. The research presented here indicates that mycorrhizal assemblages of P. clausa vary with host variety, suggesting periodic disturbances which are important for structuring host dynamics can also lead to differences in the microbial community structure. Future research which teases apart the contributions such disturbances make to host genetics and/or phenotypic characteristics from the environment for structuring mycorrhizal communities is needed to elucidate potential mechanisms important for understanding the full implications of these results.

Funding

This research was funded by a National Science Foundation Postdoctoral Research Fellowship in Biology to M.A.R [DBI-12-02676] and Wright State University start-up funds.

Institutional Review Board Statement

Not applicable.

Informed Consent Statement

Not applicable.

Data Availability Statement

The fungal sequence data for this project are available via GenBank under the accession numbers KX898986–KX899904. Other data presented in this study are available on request from the corresponding author.

Acknowledgments

I thank Luke Walker for help with figures and Jason Hoeksema for molecular advice. Alexis Knicks, Michaela Woods, and John Culbertson provided assistance in the laboratory and greenhouse. I also thank William Pizzolato at Eglin Air Force Base and the Division of Recreation and Parks at the Florida Department of Environmental Protection for help with field collections.

Conflicts of Interest

The authors declare no conflict of interest. The funders had no role in the design of the study; in the collection, analyses, or interpretation of data; in the writing of the manuscript, or in the decision to publish the results.

Appendix A

Figure A1. Average alpha diversity per tree by variety (n = 25 per variety) ± SE. Alpha diversity was assessed as observed values (A), Chao1 (B), and the Shannon index (C).
Forests 12 00219 g0a1

References

  1. Christian, N.; Whitaker, B.K.; Clay, K. Microbiomes: Unifying animal and plant systems through the lens of community ecology theory. Front. Microbiol. 2015, 6, 869. [Google Scholar] [CrossRef] [Green Version]
  2. Nemergut, D.R.; Schmidt, S.K.; Fukami, T.; O’Neill, S.P.; Bilinski, T.M.; Stanish, L.F.; Knelman, J.E.; Darcy, J.L.; Lynch, R.C.; Wickey, P.; et al. Patterns and Processes of Microbial Community Assembly. Microbiol. Mol. Biol. Rev. 2013, 77, 342–356. [Google Scholar] [CrossRef] [Green Version]
  3. Konopka, A.; Lindemann, S.; Fredrickson, J. Dynamics in microbial communities: Unraveling mechanisms to identify principles. ISME J. 2015, 9, 1488–1495. [Google Scholar] [CrossRef]
  4. Taylor, A.F.S.; Alexander, I.A.N. The ectomycorrhizal symbiosis: Life in the real world. Mycologist 2005, 19, 102–112. [Google Scholar] [CrossRef]
  5. Sánchez-Ramírez, S.; Wilson, A.W.; Ryberg, M. Overview of Phylogenetic Approaches to Mycorrhizal Biogeography, Diversity and Evolution. In Biogeography of Mycorrhizal Symbiosis; Tedersoo, L., Ed.; Ecological Studies (Analysis and Synthesis); Springer: Cham, Switzerland, 2017; pp. 1–37. ISBN 978-3-319-56362-6. [Google Scholar]
  6. Smith, S.E.; Read, D. Mycorrhizal Symbiosis, 3rd ed.; Elsevier: London, UK, 2008. [Google Scholar]
  7. Hasselquist, N.; Germino, M.J.; McGonigle, T.; Smith, W.K. Variability of Cenococcum colonization and it ecophysiological significance to young conifers. New Phytol. 2005, 165, 867–873. [Google Scholar]
  8. Dale, V.H.; Joyce, L.A.; McNulty, S.; Neilson, R.P.; Ayres, M.P.; Flannigan, M.D.; Hanson, P.J.; Irland, L.C.; Lugo, A.E.; Peterson, C.J.; et al. Climate Change and Forest Disturbances: Climate change can affect forests by altering the frequency, intensity, duration, and timing of fire, drought, introduced species, insect and pathogen outbreaks, hurricanes, windstorms, ice storms, or landslides. BioScience 2001, 51, 723–734. [Google Scholar] [CrossRef] [Green Version]
  9. Briand, C.H.; Schwilk, D.W.; Gauthier, S.; Bergeron, Y. Does fire regime influence life history traits of jack pine in the southern boreal forest of Québec, Canada? Plant Ecol. 2015, 216, 157–164. [Google Scholar] [CrossRef]
  10. Leclerc, T.; Vimal, R.; Troispoux, V.; Périgon, S.; Scotti, I. Life after disturbance (I): Changes in the spatial genetic structure of Jacaranda copaia (Aubl.) D. Don (Bignonianceae) after logging in an intensively studied plot in French Guiana. Ann. For. Sci. 2015, 72, 509–516. [Google Scholar] [CrossRef] [Green Version]
  11. Parker, K.C.; Hamrick, J.L.; Parker, A.J.; Nason, J.D. Fine-scale genetic structure in Pinus clausa (Pinaceae) populations: Effects of disturbance history. Heredity 2001, 87, 99–113. [Google Scholar]
  12. Parker, K.C.; Hamrick, J.L. Genetic variation in sand pine (Pinus clausa). Can. J. For. Res. 2013, 26, 244–254. [Google Scholar] [CrossRef]
  13. Gehring, C.A.; Sthultz, C.M.; Flores-Rentería, L.; Whipple, A.V.; Whitham, T.G. Tree genetics defines fungal partner communities that may confer drought tolerance. Proc. Natl. Acad. Sci. USA 2017. [Google Scholar] [CrossRef] [Green Version]
  14. Lamit, L.J.; Holeski, L.M.; Flores-Rentería, L.; Whitham, T.G.; Gehring, C.A. Tree genotype influences ectomycorrhizal fungal community structure: Ecological and evolutionary implications. Fungal Ecol. 2016, 24, 124–134. [Google Scholar] [CrossRef]
  15. Mousseau, T.A.; Fox, C.W. The adaptive significance of maternal effects. Trends Ecol. Evol. 1998, 13, 403–407. [Google Scholar] [CrossRef]
  16. Bingham, M.A.; Simard, S.W. Seedling genetics and life history outweigh mycorrhizal network potential to improve conifer regeneration under drought. For. Ecol. Manag. 2013, 287, 132–139. [Google Scholar] [CrossRef]
  17. Agerer, R. Exploration types of ectomycorrhizae. Mycorrhiza 2001, 11, 107–114. [Google Scholar] [CrossRef]
  18. Hobbie, E.A.; Agerer, R. Nitrogen isotopes in ectomycorrhizal sporocarps correspond to belowground exploration types. Plant Soil 2010, 327, 71–83. [Google Scholar] [CrossRef]
  19. Lilleskov, E.A.; Hobbie, E.A.; Horton, T.R. Conservation of ectomycorrhizal fungi: Exploring the linkages between functional and taxonomic responses to anthropogenic N deposition. Fungal Ecol. 2011, 4, 174–183. [Google Scholar] [CrossRef]
  20. Knicker, H. How does fire affect the nature and stability of soil organic nitrogen and carbon? A review. Biogeochemistry 2007, 85, 91–118. [Google Scholar] [CrossRef]
  21. Lilleskov, E.A.; Fahey, T.J.; Horton, T.R.; Lovett, G.M. Belowground ectomycorrhizal fungal community change over a nitrogen deposition gradient in Alaska. Ecology 2002, 83, 104–115. [Google Scholar] [CrossRef]
  22. Lodge, D.J.; McDowell, W.H. Summary of Ecosystem-Level Effects of Caribbean Hurricanes. Biotropica 1991, 23, 373–378. [Google Scholar] [CrossRef]
  23. Aguilar-Trigueros, C.A.; Hempel, S.; Powell, J.R.; Anderson, I.C.; Antonovics, J.; Bergmann, J.; Cavagnaro, T.R.; Chen, B.; Hart, M.M.; Klironomos, J.; et al. Branching out: Towards a trait-based understanding of fungal ecology. Fungal Biol. Rev. 2015, 29, 34–41. [Google Scholar] [CrossRef]
  24. Krause, S.; Le Roux, X.; Niklaus, P.A.; Van Bodegom, P.M.; Lennon, J.T.; Bertilsson, S.; Grossart, H.-P.; Philippot, L.; Bodelier, P.L.E. Trait-based approaches for understanding microbial biodiversity and ecosystem functioning. Front. Microbiol. 2014, 5, 251. [Google Scholar] [CrossRef]
  25. Moeller, H.V.; Peay, K.G.; Fukami, T. Ectomycorrhizal fungal traits reflect environmental conditions along a coastal California edaphic gradient. FEMS Microbiol. Ecol. 2014, 87, 797–806. [Google Scholar] [CrossRef]
  26. Rúa, M.; Moore, B.; Hergott, N.; Van, L.; Jackson, C.; Hoeksema, J. Ectomycorrhizal Fungal Communities and Enzymatic Activities Vary across an Ecotone between a Forest and Field. J. Fungi 2015, 1, 185–210. [Google Scholar] [CrossRef] [Green Version]
  27. Parker, K.C.; Parker, A.J.; Beaty, R.M.; Fuller, M.M.; Faust, T.D. Population Structure and Spatial Pattern of Two Coastal Populations of Ocala Sand Pine (Pinus Clausa (Chapm. Ex Engelm.) Vasey Ex Sarg. Var. Clausa D. B. Ward). J. Torrey Bot. Soc. 1997, 124, 22–33. [Google Scholar] [CrossRef]
  28. Myers, R.L. Scrub and High Pine. In Ecosystems of Florida; Myers, R.L., Ewel, J.J., Eds.; University of Central Florida Press: Orlando, FL, USA, 1990; pp. 150–193. [Google Scholar]
  29. Ruehle, J.L.; Brendemuehl, R.H. Performance of Choctawhatchee Sand Pine Seedlings Inoculated with Ectomycorrhizal Fungi and Outplanted in the Sandhills of North Florida; US Department of Agriculture, Forest Service, Southeastern Forest Experiment Station: Asheville, NC, USA, 1981; Volume 301. [Google Scholar]
  30. Parker, A.J.; Parker, K.C.; Faust, T.D.; Fuller, M.M. The effects of climatic variability on radial growth of two varieties of sand pine (Pinus clausa) in Florida, USA. Ann. For. Sci. 2001, 58, 333–350. [Google Scholar] [CrossRef]
  31. Gardes, M.; Bruns, T.D. ITS primers with enhanced specificity for basidiomycetes—Application to the identification of mycorrhizae and rusts. Mol. Ecol. 1993, 2, 113–118. [Google Scholar]
  32. Rúa, M.A.; Wilson, E.C.; Steele, S.; Munters, A.R.; Hoeksema, J.D.; Frank, C. Associations between Ectomycorrhizal Fungi and Bacterial Needle Endophytes in Pinus radiata: Implications for Biotic Selection of Microbial Communities. Front. Microbiol. 2016, 7, 399. [Google Scholar] [CrossRef]
  33. Huang, X.; Madan, A. Cap3: A DNA sequence assembly program. Genome Res. 1999, 9, 868–877. [Google Scholar]
  34. Izzo, A.; Agbowo, J.; Bruns, T.D. Detection of plot-level changes in ectomycorrhizal communities across years in an old-growth mixed-conifer forest. New Phytol. 2005, 166, 619–630. [Google Scholar]
  35. O’Brien, H.E.; Parrent, J.L.; Jackson, J.A.; Moncalvo, J.M.; Vilgalys, R. Fungal Community Analysis by Large-Scale Sequencing of Environmental Samples. Appl. Environ. Microbiol. 2005, 71, 5544–5550. [Google Scholar]
  36. Smith, M.D.; Douhan, G.; Rizzo, D. Ectomycorrhizal community structure in a xeric Quercus woodland based on rDNA sequence analyzsis of sporocarps and pooled roots. New Phytol. 2007, 174, 847–863. [Google Scholar]
  37. Horton, T.R. Molecular approaches to ectomycorrhizal diversity studies: Variation in ITS at a local scale. Plant Soil 2002, 244, 29–39. [Google Scholar]
  38. Altschul, S.F.; Gish, W.; Miller, W.; Myers, E.W.; Lipman, D.J. Basic local alignment search tool. J. Mol. Biol. 1990, 215, 403–410. [Google Scholar] [CrossRef]
  39. Kõljalg, U.; Nilsson, R.H.; Abarenkov, K.; Tedersoo, L.; Taylor, A.F.S.; Bahram, M.; Bates, S.T.; Bruns, T.D.; Bengtsson-Palme, J.; Callaghan, T.M.; et al. Towards a unified paradigm for sequence-based identification of fungi. Mol. Ecol. 2013, 22, 5271–5277. [Google Scholar] [CrossRef] [Green Version]
  40. Tedersoo, L.; Smith, M.E. Ectomycorrhizal Fungal Lineages: Detection of Four New Groups and Notes on Consistent Recognition of Ectomycorrhizal Taxa in High-Throughput Sequencing Studies. In Biogeography of Mycorrhizal Symbiosis; Tedersoo, L., Ed.; Springer International Publishing: Berlin/Heidelberg, Germany, 2017; pp. 125–142. [Google Scholar]
  41. Tedersoo, L.; Smith, M.E. Lineages of ectomycorrhizal fungi revisited: Foraging strategies and novel lineages revealed by sequences from belowground. Fungal Biol. Rev. 2013, 27, 83–99. [Google Scholar] [CrossRef] [Green Version]
  42. Unestam, T. Water repellency, mat formation, and leaf-stimulated growth of some ectomycorrhizal fungi. Mycorrhiza 1991, 1, 13–20. [Google Scholar] [CrossRef]
  43. Agerer, R. Fungal relationships and structural identity of their ectomycorrhizae. Mycol. Prog. 2006, 5, 67–107. [Google Scholar] [CrossRef]
  44. R. Core Team. R: A Language and Environment for Statistical Computing; R Foundation for Statistical Computing: Vienna, Austria, 2020. [Google Scholar]
  45. McCune, B.; Grace, J.B. Analysis of Ecological Communities; MjM Software Design: Gleneden Beach, OR, USA, 2002; Volume 28. [Google Scholar]
  46. Oksanen, J.; Blanchet, F.G.; Kindt, R.; Legendre, P.; Minchin, P.R.; O’Hara, R.B.; Simpson, G.L.; Solymos, P.; Stevens, M.H.H.; Wagner, H.; et al. Vegan: Community Ecology Package R Package Version 2.5-6. 2019. Available online: https://cran.r-project.org/ (accessed on 22 October 2020).
  47. Wickham, H. GGplot2: Elegant Graphics for Data Analysis; Springer: New York, NY, USA, 2009; ISBN 978-0-387-98140-6. [Google Scholar]
  48. De Caceres, M.; Legendre, P. Associations between species and groups of sites: Indices and statistical inference. Ecology 2009, 90, 3566–3574. [Google Scholar]
  49. Newman, E.I. A Method of Estimating the Total Length of Root in a Sample. J. Appl. Ecol. 1966, 3, 139–145. [Google Scholar]
  50. Bates, D.; Maechler, M.; Bolker, B.; Steve, W. Fitting Linear Mixed-Effects Models Using lme4. J. Stat. Softw. 2015, 67, 1–48. [Google Scholar] [CrossRef]
  51. Hothorn, T.; Bretz, F.; Westfall, P. Simultaneous Inference in General Parametric Models. Biometr. J. 2008, 50, 346–363. [Google Scholar]
  52. Chemidlin Prévost-Bouré, N.; Dequiedt, S.; Thioulouse, J.; Lelièvre, M.; Saby, N.P.A.; Jolivet, C.; Arrouays, D.; Plassart, P.; Lemanceau, P.; Ranjard, L. Similar Processes but Different Environmental Filters for Soil Bacterial and Fungal Community Composition Turnover on a Broad Spatial Scale. PLoS ONE 2014, 9, e111667. [Google Scholar] [CrossRef]
  53. Ranjard, L.; Dequiedt, S.; Chemidlin Prévost-Bouré, N.; Thioulouse, J.; Saby, N.P.A.; Lelievre, M.; Maron, P.A.; Morin, F.E.R.; Bispo, A.; Jolivet, C.; et al. Turnover of soil bacterial diversity driven by wide-scale environmental heterogeneity. Nat. Commun. 2013, 4, 1434. [Google Scholar] [CrossRef]
  54. Karst, J.; Burns, C.; Cale, J.; Antunes, P.M.; Woods, M.J.; Lamit, L.J.; Hoeksema, J.; Zabinski, C.; Gehring, C.; La Fleche, M.; et al. Tree species with limited geograbec ranges show extreme responses to ectomycorrhizas. Glob. Ecol. Biogeogr. 2018, 27, 839–848. [Google Scholar] [CrossRef]
  55. Last, F.T.; Dighton, J.; Mason, P.A. Successions of sheathing mycorrhizal fungi. Trends Ecol. Evol. 1987, 2, 157–161. [Google Scholar] [CrossRef]
  56. Visser, S. Ectomycorrhizal fungal succession in jack pine stands following wildfire. New Phytol. 1995, 129, 389–401. [Google Scholar] [CrossRef]
  57. Kirk, P.M. Species Fungorum (Version Oct 2017). 2019. Available online: www.catalogueoflife.org/annual-checklist/2019 (accessed on 22 October 2020).
  58. Looney, B.P.; Meidl, P.; Piatek, M.J.; Miettinen, O.; Francis, M.M.; Matheny, P.B.; Labbe, J.L. Russulaceae: A New Genomic Dataset to Study Ecosystem Function and Evolutionary Diversification of Ectomycorrhizal Fungi with Their Tree Associates. New Phytol. 2018, 218, 54–65. [Google Scholar] [CrossRef] [Green Version]
  59. Tedersoo, L.; Anslan, S.; Bahram, M.; Kõljalg, U.; Abarenkov, K. Identifying the ‘Unidentified’ Fungi: A Global-Scale Long-Read Third-Generation Sequencing Approach. Fungal Divers. 2020, 103, 273–293. [Google Scholar] [CrossRef]
  60. Freeman, J.E.; Kobziar, L.N. Tracking postfire successional trajectories in a plant community adapted to high-severity fire. Ecol. Appl. 2011, 21, 61–74. [Google Scholar] [CrossRef]
  61. McNulty, S.G. Hurricane impacts on US forest carbon sequestration. Environ. Pollut. 2002, 116 (Suppl. 1), S17–S24. [Google Scholar] [CrossRef]
  62. Sanford, R.L.; Parton, W.J.; Ojima, D.S.; Lodge, D.J. Hurricane Effects on Soil Organic Matter Dynamics and Forest Production in the Luquillo Experimental Forest, Puerto Rico: Results of Simulation Modeling. Biotropica 1991, 23, 364–372. [Google Scholar] [CrossRef]
  63. Kawecki, T.J.; Ebert, D. Conceptual issues in local adaptation. Ecol. Lett. 2004, 7, 1225–1241. [Google Scholar] [CrossRef] [Green Version]
Figure 1. Range map of Pinus clausa sourced from [28] with the location of study stands. Site abbreviations and descriptions can be found in Table 1.
Forests 12 00219 g001
Figure 2. Relative abundances of major fungal OTUs (A) and families (B) recovered from Pinus clausa var. clausa and Pinus clausa var. immuginata. Relative abundance of families was calculated as the proportion of sequences belonging to a particular lineage of all ITS (fungi) gene sequences recovered from each site. Only those OTUs which represent >90% of the total tips were identified separately via color, while the remaining OTUs were grouped into an “Other” category for visualization.
Forests 12 00219 g002aForests 12 00219 g002b
Figure 3. Nonmetric multidimensional scaling ordinations for fungal communities as a function of host variety. Points represent communities recovered from individual trees of Pinus clausa var. clausa (salmon) and Pinus clausa var. immuginata (blue). Ellipses indicate 95% confidence intervals, while arrows specify significant indicator species associated with each variety.
Forests 12 00219 g003
Figure 4. Fungal trait distribution for Pinus clausa variety across sites for exploration type (A), rhizomorph biomass (B), and hydrophobicity (C). The frequency of colonized tips was calculated as the proportion of total identified tips for a particular fungal trait belonging to each variety (Pinus clausa var. clausa (salmon) and Pinus clausa var. immuginata (blue)). The dotted line represents a frequency of 50% (equal likelihood the trait occurred in either variety).
Forests 12 00219 g004
Figure 5. Total plant biomass (A), shoot biomass (B), and root biomass (C) for Pinus clausa seedlings grown in soil from their own variety (“Home”) or soil from the other variety (“Away”). Each treatment combination (variety × soil source) consists of 15 seedlings (3 per block). Letters indicate differences based on Tukey’s HSD tests.
Forests 12 00219 g005
Figure 6. Total plant biomass as a function of number of colonized tips for the Pinus clausa seedlings from the var. clausa (salmon) and var. immuginata (teal) varieties grown in their own soil (“Home”; solid line with circle points) or soil from the other variety (“Away”; dashed line with triangular points). Regression statistics are also included.
Forests 12 00219 g006
Table 1. Locations and average diameters at breast height (DBHs; cm) for the sampling of Pinus clausa.
Site AbbreviationLocation NameCountyLatitudeLongitudeAverage DBH
Pinus clausa var. clausa
CATOcala National ForestMarion29°03′ N81°51′ W92
CEDCedar Key Scrub State ReserveLevy29°11′ N83°01′ W89
HHOHighlands Hammock State ParkHighlands27°29′ N81°31′ W88
JDOJonathan Dickinson State ParkMartin27°01′ N80°07′ W94
SAREnglewood Water DistrictSarasota26°57′ N82°21′ W136
Pinus clausa var. immuginata
STJSt. Joseph Peninsula State ParkGulf29°48′ N85°25′ W76
HENHenderson Beach State Recreation AreaOkaloosa30°23′ N86°28′ W66
EINEglin Air Force BaseOkaloosa30°29′ N86°24′ W81
BLABig Lagoon State Recreation AreaSanta Rosa30°18′ N87°24′ W72
ALPAlligator PointFranklin29°56′ N84°22′ W70
Publisher’s Note: MDPI stays neutral with regard to jurisdictional claims in published maps and institutional affiliations.

