
Carbon Life Cycle Assessment on California-Specific Wood Products Industries: Do Data Backup General Default Values for Wood Harvest and Processing?


Abstract
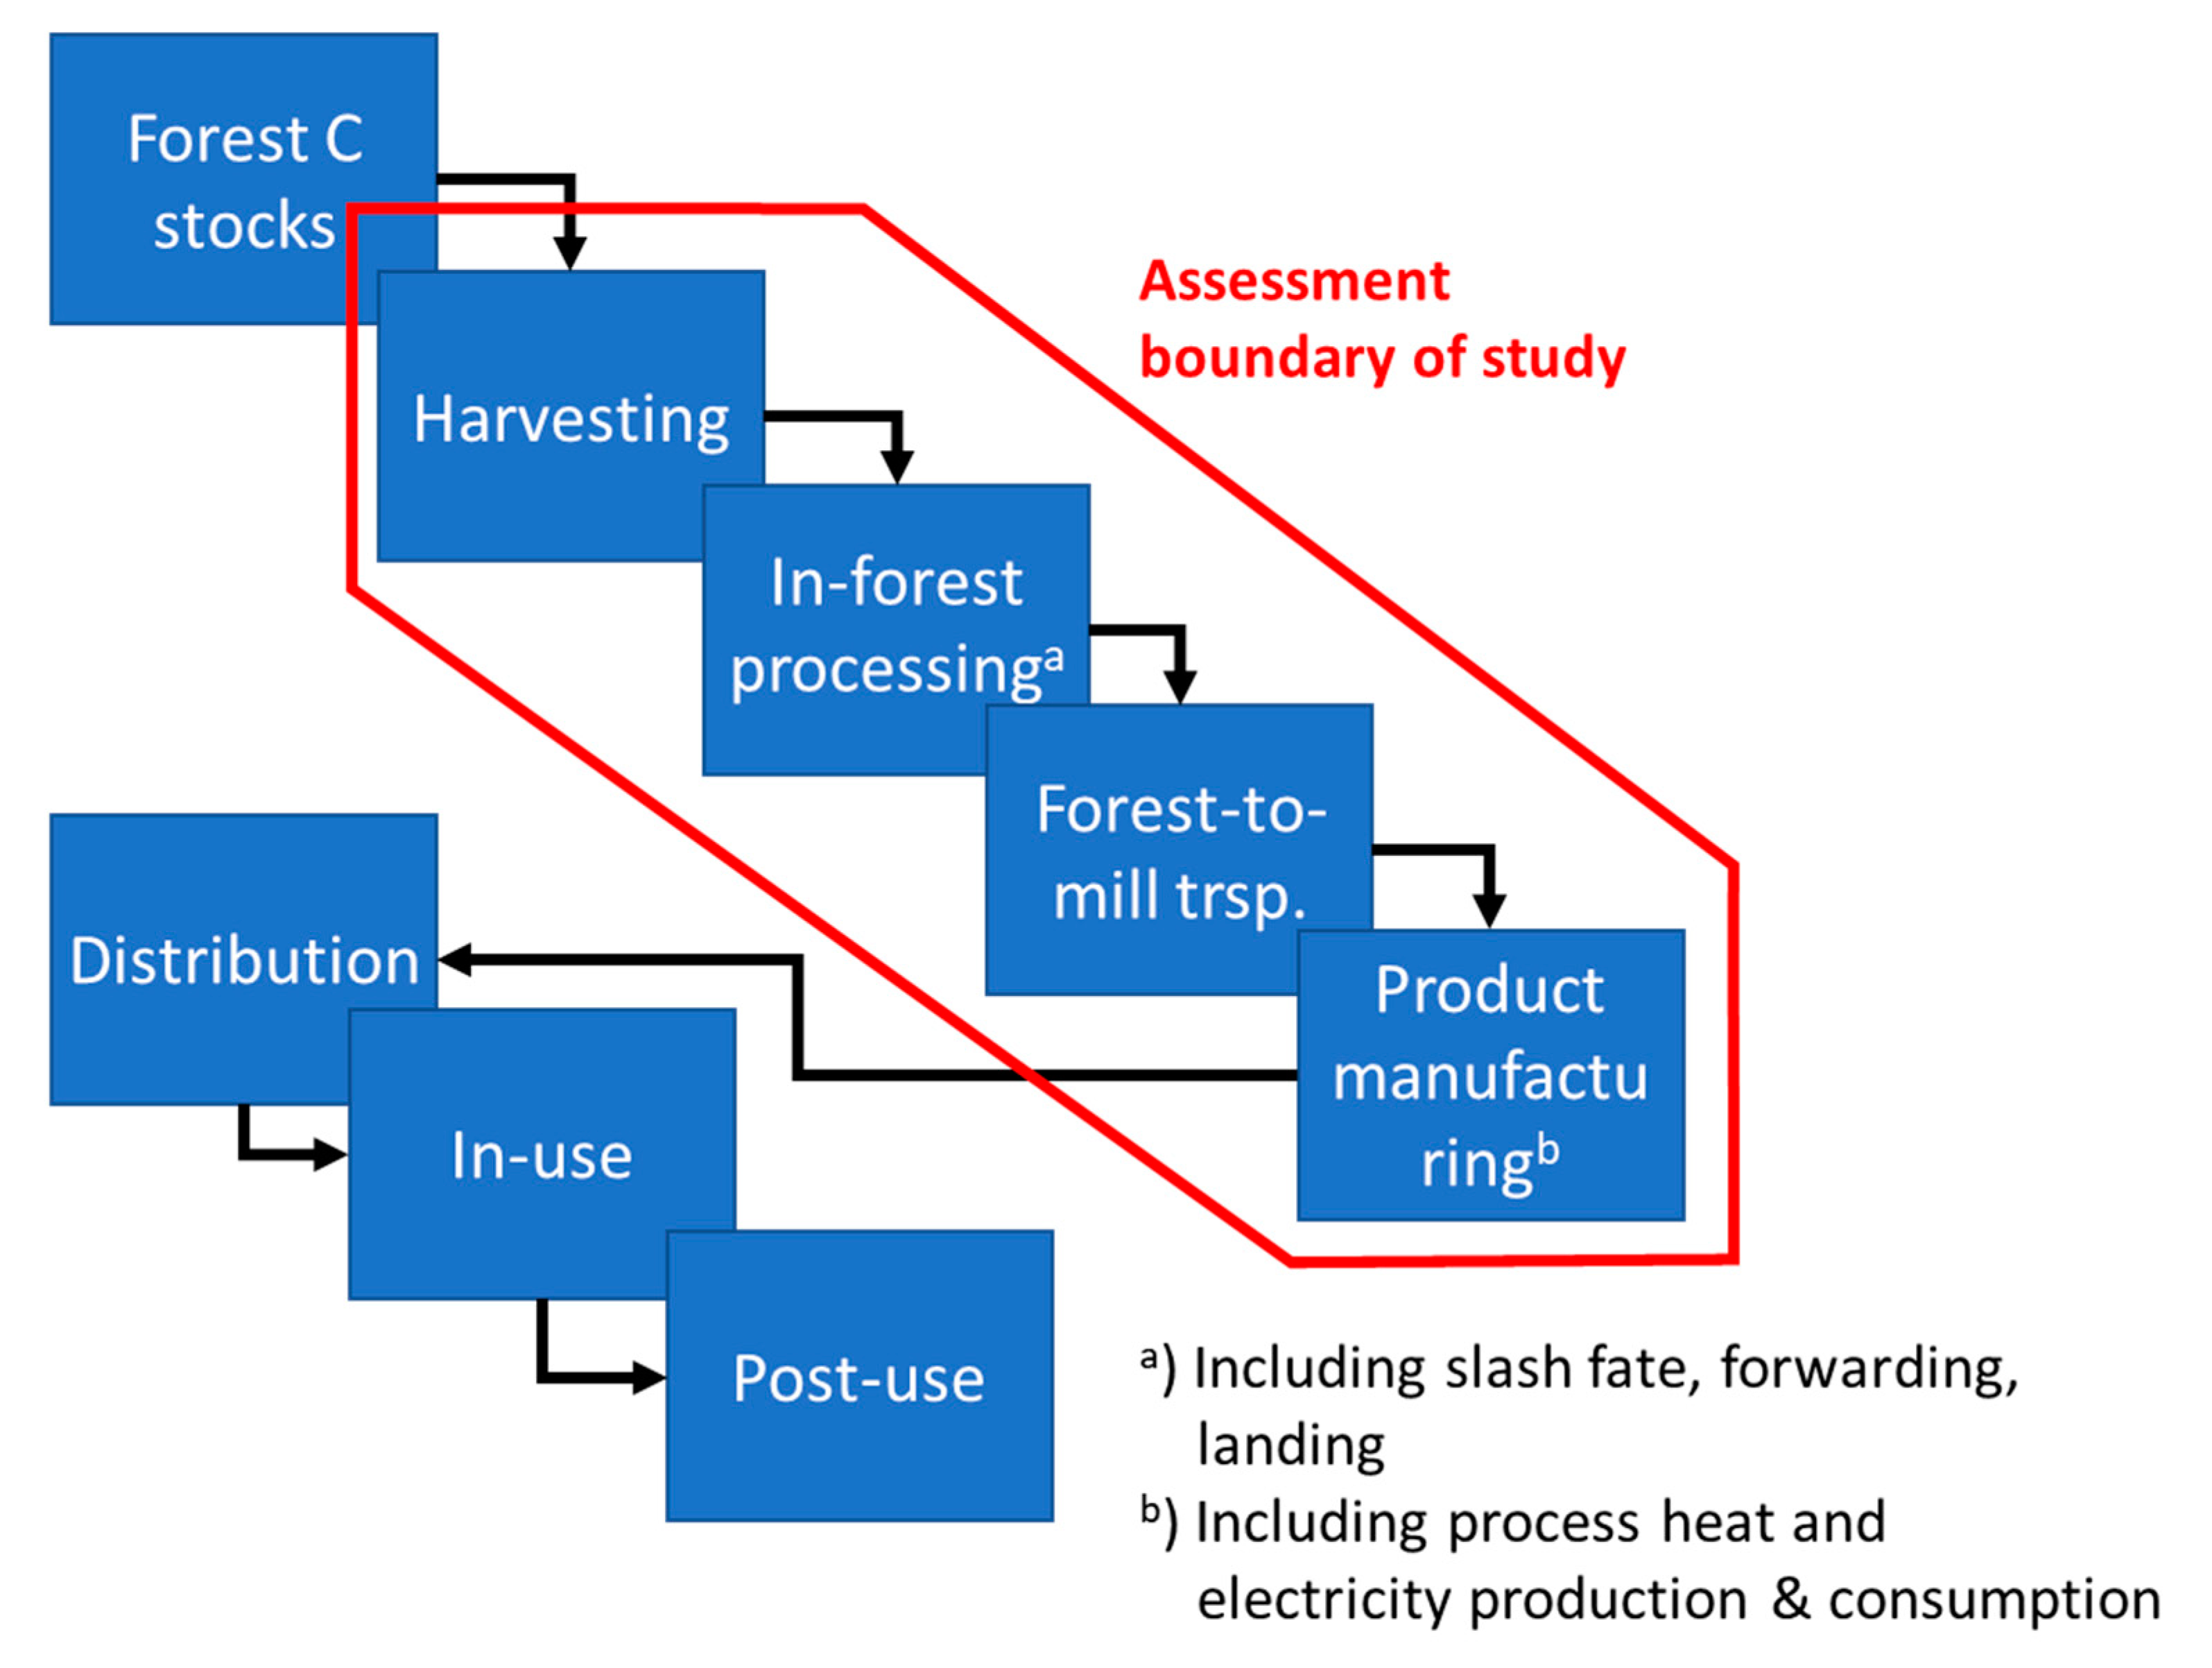
1. Introduction
2. Materials and Methods
- Sawmill operations—Data were provided in Scribner log scale by dominant species for all participating sawmills. Sawmill wood products (lumber tally for lumber; tonnage and moisture content for all other products) and on-site energy production and consumption was also provided. A small fraction of the sawmill data (5% of lumber volume) was derived from 2014 data;
- Harvest and in-forest processing—Data were provided on usage rates for fossil fuel (diesel and gasoline) engines for chainsaws, yarders, loaders, etc., in gallons/mbf and forest-to-mill production (number of loads, total fossil fuel consumption, average distance) was calculated as averages based on averaged metrics provided for 83% of the dataset. Another subset of the harvest data constituting of 15% of total processed sawlogs provided forest stand-level fossil fuel engine consumption for harvest and processing equipment, harvest area (in ha), slash fate if left on site, number of truck loads (forest to mill), and transport distance.
- 90% efficiency when converting natural gas to process heat;
- For electricity generation from mill and forest harvest residues, we assumed a heating value of 18.5 Gigajoule per oven-dried mg (ODT) [11] and an electrical conversion efficiency of 29% as reported by the major participant of the sawmill survey;
- To calculate avoided emissions from biomass-based electricity generation, we assumed each unit of electricity generated would offset one unit of grid based electricity which had an associated emission factor of 0.205 mg CO2e/MWh for California in 2016 [12];
3. Results and Discussion
3.1. Carbon Footprint of Wood Products Manufacturing
3.2. Dataset as a Representative Snapshot of the 2015 Timber Industry in California
3.3. Harvest, Transport and Sawlog Processing Analysis
3.3.1. Harvest Operations
3.3.2. Sawlog Transport
3.3.3. Sawmill Processing
4. Conclusions
Author Contributions
Funding
Data Availability Statement
Acknowledgments
Conflicts of Interest
References
- Aalde, H.; Gonzalez, P.; Gytarsky, M.; Krug, T.; Kurz, W.A.; Ogle, S.; Raison, J.; Schoene, D.; Ravindranath, N.H. 2006 IPCC Guidelines for National Greenhouse Gas Inventories: Chapter 4—Forest Land; International Panel on Climate Change (IPCC): Kyoto, Japan, 2006; p. 83. [Google Scholar]
- FCAT. California Forest Carbon Plan—Managing Our Forest Landscapes in a Changing Climate; Forest Climate Action Team; CAL FIRE: Sacramento, CA, USA, 2018; p. 178.
- Buchholz, T.; Schmidt, D.; Springsteen, B.; Harroun, S.; Moghaddas, J.; Saah, D. Greenhouse Gas Offset Protocol: Avoided Wildfire Emissions; Spatial Informatics Group LLC (SIG): Pleasanton, CA, USA, 2019; p. 75. [Google Scholar]
- Moghaddas, J.; Roller, G.B.; Long, J.; Saah, D.S.; Moritz, M.A.; Stark, D.T.; Schmidt, D.A.; Buchholz, T.; Freed, T.; Alvey, E.C.; et al. Fuel Treatment for Forest Resilience and Climate Mitigation: A Critical Review for Coniferous Forests of California; CCCA4-CNRA-2018–017; California Natural Resources Agency: Sacramento, CA, USA, 2018; p. 74.
- Fargione, J.E.; Bassett, S.; Boucher, T.; Bridgham, S.D.; Conant, R.T.; Cook-Patton, S.C.; Ellis, P.W.; Falcucci, A.; Fourqurean, J.W.; Gopalakrishna, T.; et al. Natural Climate Solutions for the United States. Sci. Adv. 2018, 4, eaat1869. [Google Scholar] [CrossRef] [PubMed]
- Smith, J.E.; Heath, L.S.; Skog, K.E.; Birdsey, R.A. Methods for Calculating Forest Ecosystem and Harvested Carbon with Standard Estimates for Forest Types of the United States; GTR NE-343; USDA Forest Service, Northeastern Research Station: Durham, NH, USA, 2006.
- Marcille, K.C.; Morgan, T.A.; McIver, C.P.; Christensen, G.A. California’s Forest Products Industry and Timber Harvest, 2016; General Technical ReportPNW-GTR-994; Pacific Northwest Research Station, Forest Service, United States Department of Agriculture: Durham, NH, USA, 2020.
- Keegan, C.E.; Morgan, T.A.; Blatner, K.A.; Daniels, J.M. Trends in Lumber Processing in the Western United States. Part II: Overrun and Lumber Recovery Factors. For. Prod. J. 2010, 60, 140–143. [Google Scholar] [CrossRef]
- US EPA. Emission Factors for Greenhouse Gas Inventories; US Environmental Protection Agency: Washington, DC, USA, 2014; p. 5.
- US EPA. Greenhouse Gases Equivalencies Calculator-Calculations and References. Available online: https://www.epa.gov/energy/greenhouse-gases-equivalencies-calculator-calculations-and-references (accessed on 30 April 2020).
- Francescato, V.; Zuccoli Bergomi, L. Wood Fuels Production Handbook; Italian Agriforestry Energy Association (AEIL) and European Biomass Association (AEBIOM): Legnaro, Italy, 2008; p. 83. [Google Scholar]
- US EPA. Emissions & Generation Resource Integrated Database (eGRID). Available online: https://www.epa.gov/energy/emissions-generation-resource-integrated-database-egrid (accessed on 30 April 2020).
- Miles, P.D.; Smith, W.B. Specific Gravity and Other Properties of Wood and Bark for 156 Tree Species Found in North America; NRS-38; USDA Forest Service, Northern Research Station: Durham, NH, USA, 2009; pp. 1–35.
- Springsteen, B.; Christofk, T.; Eubanks, S.; Mason, T.; Clavin, C.; Storey, B. Emission Reductions from Woody Biomass Waste for Energy as an Alternative to Open Burning. J. Air Waste Manag. Assoc. 2011, 61, 63–68. [Google Scholar] [CrossRef] [PubMed]
- Han, H.-S.; Oneil, E.; Bergman, R.D.; Eastin, I.L.; Johnson, L.R. Cradle-to-Gate Life Cycle Impacts of Redwood Forest Resource Harvesting in Northern California. J. Clean. Prod. 2015, 99, 217–229. [Google Scholar] [CrossRef]
- Sahoo, K.; Upadhyay, A.; Runge, T.; Bergman, R.; Puettmann, M.; Bilek, E. Life-Cycle Assessment and Techno-Economic Analysis of Biochar Produced from Forest Residues Using Portable Systems. Int. J. Life Cycle Assess. 2020. [Google Scholar] [CrossRef]
- Nurek, T.; Gendek, A.; Roman, K.; Dąbrowska, M. The Effect of Temperature and Moisture on the Chosen Parameters of Briquettes Made of Shredded Logging Residues. Biomass Bioenergy 2019, 130, 105368. [Google Scholar] [CrossRef]
- University of Montana. California Timber Harvest. Available online: http://www.bber.umt.edu/FIR/HarvestCA.aspx (accessed on 27 April 2020).
- Stewart, W.C.; Nakamura, G.M. Documenting the Full Climate Benefits of Harvested Wood Products in Northern California: Linking Harvests to the Us Greenhouse Gas Inventory. For. Prod. J. 2012, 62, 340–353. [Google Scholar] [CrossRef]
- Oneil, E.; Puettmann, M. A Life Cycle Assessment of Forest Resources of the Pacific Northwest, USA. For. Prod. J. 2017. [Google Scholar] [CrossRef]
- Ince, P.J.; Kramp, A.D.; Skog, K.E.; Spelter, H.N.; Wear, D.N.U.S. Forest Products Module: A Technical Document Supporting the Forest Service 2010 RPA Assessment; FPL-RP-662; U.S. Department of Agriculture, Forest Service, Forest Products Laboratory: Madison, WI, USA, 2011; p. FPL-RP-662. [CrossRef]
- US DoE. Average Fuel Economy by Major Vehicle Category. Available online: https://afdc.energy.gov/files/u/data/data_source/10310/10310_fuel_economy_by_vehicle_type_3-26-20.xlsx (accessed on 6 May 2020).
- CARB. Compliance Offset Protocol U.S. Forest Offset Projects. Available online: https://www.arb.ca.gov/cc/capandtrade/protocols/usforest/usforestprojects_2015.htm (accessed on 14 May 2018).
- McIver, C.; Meek, J.; Scudder, M.; Sorenson, C.; Morgan, T.A.; Christensen, G.A. California’s Forest Products Industry and Timber Harvest, 2012; GTR 908; USDA Forest Service: Portland, OR, USA, 2015; p. 58.
- Loeffler, D.; Anderson, N.; Morgan, T.A.; Sorenson, C.B. Onsite Energy Consumption and Selected Emissions at Softwood Sawmills in the Southwestern United States. For. Prod. J. 2016. [Google Scholar] [CrossRef]


| Category | Production/Processing | CO2e | |
|---|---|---|---|
| Unit | Value | 106 mg | |
| Harvested timber on trucks to mill | 106 m3 | 3.764 | 4.387 |
| Slash | |||
| Scattered on site | 106 ODT | 0.492 | 0.902 |
| Onsite open pile burning | 106 ODT | 0.199 | 0.347 a |
| Used for electricity | 106 ODT | 0.266 (394 GWh) | −0.081 |
| Lumber mill products | |||
| Lumber | 106 m3 | 3.823 | 2.633 |
| Byproducts, durable (pulp, paper, particle board) | 106 ODT | 0.182 b | 0.333 |
| Byproducts, short-lived, non-energy | 106 ODT | 0.393 | 0.720 |
| Byproducts, hog fuel sold offsite for energy c | 106 ODT | 0.191 | 0.321 |
| Byproducts, hog fuel used onsite for energy | 106 ODT | 0.274 | 0.503 |
| Energy use for in-field processing and transport | |||
| Harvest (logging, yarding, in-forest processing, loading) | 106 L (91% diesel, 9% gasoline) | 44.921 | 0.120 |
| Slash processing and transport | 106 L (diesel) | 18.704 | 0.051 |
| Transport to sawmill (log trucks) | 106 L (diesel) | 8.044 | 0.022 |
| Energy use for sawmill operations | |||
| Fuel combustion onsite for heat and electricity | |||
| Natural gas | 106 MWh | 72 | 0.013 |
| Hogfuel-own | 106 ODT | 1906 | 0.503 |
| Hogfuel-purchased | 106 ODT | 525 | 0.139 |
| Electricity (excluding slash) | |||
| Onsite generation used at mill | GWh | 220 | −0.045 |
| Onsite generation sold to grid for use offsite | GWh | 301 | −0.062 |
| Purchased from grid to run mill | GWh | 63 | 0.13 |
| Species | Surveyed Volumes | Total CA Volumes 2016 [7] | ||
|---|---|---|---|---|
| 106 m3 | % of Total | 106 m3 | % of Total | |
| Ponderosa pine (Pinus ponderosa) | 1.011 | 27% | 1.350 | 23% |
| Sugar pine (Pinus lambertiana) | 0.346 | 9% | 0.425 | 7% |
| Douglas fir (Pseudotsuga menziesii) | 0.793 | 21% | 1.394 | 24% |
| Redwood (Sequoia sempervirens) | 0.432 | 11% | 0.821 | 14% |
| Other species | 1.181 | 31% | 1.919 | 32% |
| Total | 3.764 | 100% | 5.358 | 100% |
| Harvest System | Average and Range for Surveyed Entities | Oneil & Puett-Mann [20]; U.S. Pacific Northwest | Han et al. [15]; Even-Aged Redwoods |
|---|---|---|---|
| Ground-based (mechanized) | 8.5 (4.3–8.8) | 3.2 | 4.1 |
| Skyline-based | 4.8 (3.4–5.0) | 3.0 | 3.5 |
| Helicopter | 12.3 (12.1–14.1) | n/a | 17.8 a |
| Weighted average | 6.6 (3.9–6.8) |
Publisher’s Note: MDPI stays neutral with regard to jurisdictional claims in published maps and institutional affiliations. |
© 2021 by the authors. Licensee MDPI, Basel, Switzerland. This article is an open access article distributed under the terms and conditions of the Creative Commons Attribution (CC BY) license (http://creativecommons.org/licenses/by/4.0/).
Share and Cite
Buchholz, T.; Mason, T.; Springsteen, B.; Gunn, J.; Saah, D. Carbon Life Cycle Assessment on California-Specific Wood Products Industries: Do Data Backup General Default Values for Wood Harvest and Processing? Forests 2021, 12, 177. https://doi.org/10.3390/f12020177
Buchholz T, Mason T, Springsteen B, Gunn J, Saah D. Carbon Life Cycle Assessment on California-Specific Wood Products Industries: Do Data Backup General Default Values for Wood Harvest and Processing? Forests. 2021; 12(2):177. https://doi.org/10.3390/f12020177
Chicago/Turabian StyleBuchholz, Thomas, Tad Mason, Bruce Springsteen, John Gunn, and David Saah. 2021. "Carbon Life Cycle Assessment on California-Specific Wood Products Industries: Do Data Backup General Default Values for Wood Harvest and Processing?" Forests 12, no. 2: 177. https://doi.org/10.3390/f12020177
APA StyleBuchholz, T., Mason, T., Springsteen, B., Gunn, J., & Saah, D. (2021). Carbon Life Cycle Assessment on California-Specific Wood Products Industries: Do Data Backup General Default Values for Wood Harvest and Processing? Forests, 12(2), 177. https://doi.org/10.3390/f12020177