Article

Prospects of Using Tree-Ring Earlywood and Latewood Width for Reconstruction of Crops Yield on Example of South Siberia

by
Elena A. Babushkina
1,*,
Dina F. Zhirnova
1,
Liliana V. Belokopytova
1,
Nivedita Mehrotra
2,
Santosh K. Shah
2,
Viktoria V. Keler
3 and
Eugene A. Vaganov
4,5
1
Khakass Technical Institute, Siberian Federal University, 655017 Abakan, Russia
2
Birbal Sahni Institute of Palaeosciences, Lucknow 226 007, India
3
Department of Crop Production, Breeding and Seed Development, Krasnoyarsk State Agrarian University, 660049 Krasnoyarsk, Russia
4
Rectorate, Siberian Federal University, 660036 Krasnoyarsk, Russia
5
Sukachev Institute of Forest, Siberian Branch of the Russian Academy of Science, 660036 Krasnoyarsk, Russia
*
Author to whom correspondence should be addressed.
Forests 2021, 12(2), 174; https://doi.org/10.3390/f12020174
Submission received: 15 December 2020 / Revised: 25 January 2021 / Accepted: 29 January 2021 / Published: 2 February 2021
(This article belongs to the Special Issue Effect of Climate Change on Forest Growth and Phenology)

Abstract

:
Improvement of dendrochronological crops yield reconstruction by separate application of earlywood and latewood width chronologies succeeded in rain-fed semiarid region. (1) Background: Tree-ring width chronologies have been successfully applied for crops yield reconstruction models. We propose application of separated earlywood and latewood width chronologies as possible predictors improving the fitness of reconstruction models. (2) Methods: The generalized yield series of main crops (spring wheat, spring barley, oats) were investigated in rain-fed and irrigated areas in semiarid steppes of South Siberia. Chronologies of earlywood, latewood, and total ring width of Siberian larch (Larix sibirica Ledeb.) growing in forest-steppe in the middle of the study area were tested as predictors of yield reconstruction models. (3) Results: In the rain-fed territory, separation of earlywood and latewood allowed increasing variation of yield explained by reconstruction model from 17.4 to 20.5%, whereas total climatic-driven component of variation was 41.5%. However, both tree-ring based models explained only 7.7% of yield variation in the irrigated territory (climate inclusion increased it to 34.8%). Low temperature sensitivity of larch growth was the main limitation of the model. A 240-year (1780–2019) history of crop failures and yield variation dynamics were estimated from the actual data and the best reconstruction model. (4) Conclusions: Presently in the study region, breeding of the environment-resistant crops varieties compensates the increase of temperature in the yield dynamics, preventing severe harvest losses. Tree-ring based reconstructions may help to understand and forecast response of the crops to the climatic variability, and also the probability of crop failures, particularly in the rain-fed territories.

1. Introduction

Long- and short-term climatic variations affect the growth and productivity of both natural vegetation and agricultural crops in a fundamentally similar way [1,2]. Global warming has led to shifts in productivity maxima and distribution areas towards higher latitudes [3,4]. Studies of long-term crops yield dynamics can provide important information on the vulnerability of agroecosystems to climate change and future risks to food security [2,5,6,7]. However, this field of research is limited by insufficient availability of actual yield data and instrumental climatic series measured at meteorological stations [6,8]. To overcome this limitation, the reconstruction of the missing information based on proxy data from various natural sources is used [9,10]. In particular, tree-ring chronologies are available across a wide range of regions and can record climatic fluctuations over several hundred years with yearly or lesser (monthly, seasonal) temporal resolution [11,12]. In recent decades, several attempts have been made to use chronologies of tree-ring width (TRW) for crops yield reconstruction [5,7,13,14,15]. However, the integral nature of these productivity indicators, as well as ecological, morphological and phenological differences between trees and cereals, limit the quality of the obtained models and force researchers to look for complex methods to improve them.
During the process of growth and development, the plant reflects in its structure the current external conditions. Such information is stored alongside internal relationships (limitations of its organs and tissues united into an integral and functionally balanced system) and legacy effects of the previous conditions on the plant [16,17]. In particular, raw individual series of TRW measurements contain long-term trends including input of the trees’ size-age characteristics [18,19] and autocorrelation component partially connected to usage of previously formed wood as water conduit and (in deciduous trees) as a storage tissue [20,21,22]. When standardizing tree-ring chronologies, these components are suppressed [23] and the obtained residual chronologies are used to highlight the climatic signal and “purify” it of noise. Tree ring can be separated into consequentially developed zones of earlywood and latewood. In the residual chronology of the earlywood width (EWW), the legacy effect is mainly concentrated on the period from the end of the previous ring width formation, including dormancy. In the latewood width (LWW) residual chronology, the legacy effect additionally includes conditions during earlywood cells’ production [24,25]. When analyzing these parameters of tree radial growth, the legacy effect in the LWW can be quantified as linear regression function of its dependence on the EWW [26]. After removal of this component, the adjusted chronology (LWWadj) contains mainly a signal for the current conditions from the beginning of latewood cells’ production to the end of their extension phase. Therefore, application of EWW and LWWadj can allow to split in time climate signal in TRW and to highlight its individual components.
The yield of small grain crops consists of several significant components: the density of productive stems determined by productive tillering and the survival of plants, the kernel number per spike and the mass of 1000 kernels [27,28,29,30]. Comparing these indicators with the development phenology of cereals, we can note that the first component is established mainly from sowing to the end of tillering. The spike size and the possible number of spikelets/florets in it are established on early stages of spike formation. Besides, they are closely related to the whole plant habitus, correlating positively with plant height and total leaf area. As a result, kernel number per spike is mainly determined by growth processes at the stages from tillering until flowering [28,31,32]. All of the aforementioned development stages occur during vegetative growth period. However, kernel number per spike can also decrease after the onset of the generative period, e.g., due to flower infertility, causing occurrence of partially or completely empty spikes [33,34]. The mass of 1000 kernels is established during grain filling. However, this indicator is the most stable and genetically determined of all yield components [32,35,36]. It also has a significant contribution of legacy effect due to transfer of dry matter from vegetative mass of plant to the developing kernels [37]. Thus, most of the yield components are determined during vegetative growth of cereals. It is also supported by the dependence of the harvest index (the ratio of yield to vegetative mass) more on crops variety than on the climatic conditions [38,39]. Amongst all, the most critical period is from tillering to ear emergence.
Possible discrepancy in the intra-seasonal dynamics of climatic response between tree ring width and crops yield is determined by different life forms, phenological sequences, and climatic tolerance or sensitivity at each stage of development. It restricts the relationship between these integral indicators of plant productivity, and hence hinders the quality of dendrochronological yield reconstructions. As a means to reduce this discrepancy, in this study we tested a hypothesis that the use of successively formed earlywood and latewood widths in the yield reconstruction would allow better reflection of the climatically-driven component of yield dynamics by increasing similarity in intra-seasonal patterns of the climatic response. Note also that growth and development of both trees and cereal crops are rather linked to particular environmental triggers and conditions like day length, temperature thresholds and accumulated heat sums, than strictly to calendar dates. If this seasonality has similar long-term trends for investigated tree and crop species, it would increase usefulness of tree ring chronologies as indicators of yield dynamics under conditions of changing climate. Thus, in the present study we test said hypothesis and bring out the overall relationship between tree growth and crops yield in the rain-fed and irrigated conditions, as well as dynamics of their climatic response.

2. Materials and Methods

This study was performed on the example of the Republic of Khakassia, in the semiarid conditions of the steppe and forest-steppe zones. In this region, both grain crops yield, and the radial growth of trees are significantly influenced by temperature and precipitation of May-July, but the quality of dendrochronological yield reconstructions is still limited [14,40]. Earlywood and latewood widths were analyzed for Siberian larch (Larix sibirica Ledeb.), since larch wood has well defined zones of earlywood and latewood, with visibly distinctive and sharp boundary between them. This makes it possible to measure widths of both zones by classical dendrochronological methods with minimum error.

2.1. The Study Area

The Republic of Khakassia is located in South Siberia, on the territories of the Western Sayan and Kuznetsk Alatau mountain systems (south and west of the republic, respectively) and the Khakass-Minusinsk Depression between them (Figure 1). The climate of the study area is sharply continental [41,42]: seasonal and daily temperature fluctuations are of high magnitude (39 °C between average monthly temperatures of July +19.9 °C and January −19.3 °C; 9–14 °C between maximum and minimum daily temperatures depending on the season). Daily data on mean air temperature and precipitation for 1936–2017 were obtained from the Minusinsk station (www.meteo.ru; 53°41′ N 91°40′ E, 250 m a.s.l.; Figure 1b). Precipitation is unevenly distributed throughout the year: very little snow falls during winters (on an average only 14% of the annual precipitation falls during the months from November to March), and maximum precipitation occurs in the month of July (19% of the annual precipitation). In the center of the Khakass-Minusinsk Depression, the average annual temperature is +1.2 °C and the average annual precipitation is 350 mm. The period with temperatures above 10 °C starts from 15 May on average and lasts up to 120 days. In the spatial distribution of temperatures, latitudinal (increasing from north to south) and altitudinal gradients (colder climate in the mountains) were observed. The amount of precipitation also increases with elevation. This leads to the fact that most of the plains of Khakassia are occupied by steppes and agricultural areas with hot and dry vegetative season, while cooler and wetter mountain ranges are mainly covered with mixed and conifer forests. The hydrological network is relatively poorly developed in the north of the Khakass-Minusinsk Depression [43]. In the centre of the republic, the rivers Yenisei, Abakan and their tributaries serve as the source for an irrigation system [44].

2.2. Grain Crops Yield Data

The yield, i.e., the weight of grain obtained from one hectare of sown area (kg/ha), was used as a measure of agricultural productivity [8]. The original data were long-term series (33–54 years; for cover periods see Supplementary Materials in the previous study [40]) of oats, spring wheat, and spring barley yield averaged over the administrative districts of the republic (Federal State Statistics Service unpublished archives) and obtained at the state variety testing stations (unpublished archives). These three crops, widespread in temperate regions, have a habit of spring growth. Their growth and development is sensitive to day length and temperature. Oats, spring wheat, and spring barley together constituted about 95% of the total sown area of small grain crops in the region during the cover period of archive data used in our study. Their local varieties were predominantly used in the region historically [45]. The agricultural territory of Khakassia is located in flatlands and adjacent foothills at elevations of 200–600 m a.s.l. It is divided into three agroclimatic zones: (1) sub-taiga and forest-steppe zone of foothills as a narrow strip in the south and west of the region; (2) dry steppes on kastanozem soils in the central part of the republic, (3) steppes on chernozem soils in the north of the Khakass-Minusinsk Depression. In the foothills, the sown areas are small (about 4% of the total area) and the moisture deficit is less pronounced, which leads to a weakening of the climatic influence on the yield. Therefore, this zone was not considered in this study. The rain-fed agriculture is mainly practiced in the Northern zone, and an irrigated agriculture system prevails in the Central zone [40,42]. For the present study, the original series were grouped according to the similarity of the yield dynamics and its climatic response [40], standardized with classical dendrochronological techniques [23] and generalized by a bi-weighted mean. As a result, two zonal chronologies were obtained for the period 1945–2012.
Standardization of chronologies was carried out in the ARSTAN program [46]. During this procedure, long-term trends (represented by linear functions) and autocorrelation (explained by the use of local harvested grain for next year sowing and a positive relationship between yield and grain quality [47,48]) were removed from the original raw series. The statistical characteristics of the developed chronologies are presented in Table 1. Additionally, to assess the phenology of grain crops, we used average data for 2015–2019 from the Karatuz variety testing station, located in conditions similar to the agricultural areas of Khakassia (Figure 1). In general, small grain crops in the region are usually sown in the first half of May (when temperature rises up to +10 °C), and harvested in September, depending mostly on early or late maturing of particular varieties. From Karatuz data, average dates for 2015–2019 were: sowing, 15 May; germination, 27 May; onset of tillering, 5–10 June; booting, 20–25 June; earing, 12–19 July; dough grain, 30 August–9 September; ripe grain (harvesting), 7–18 September.

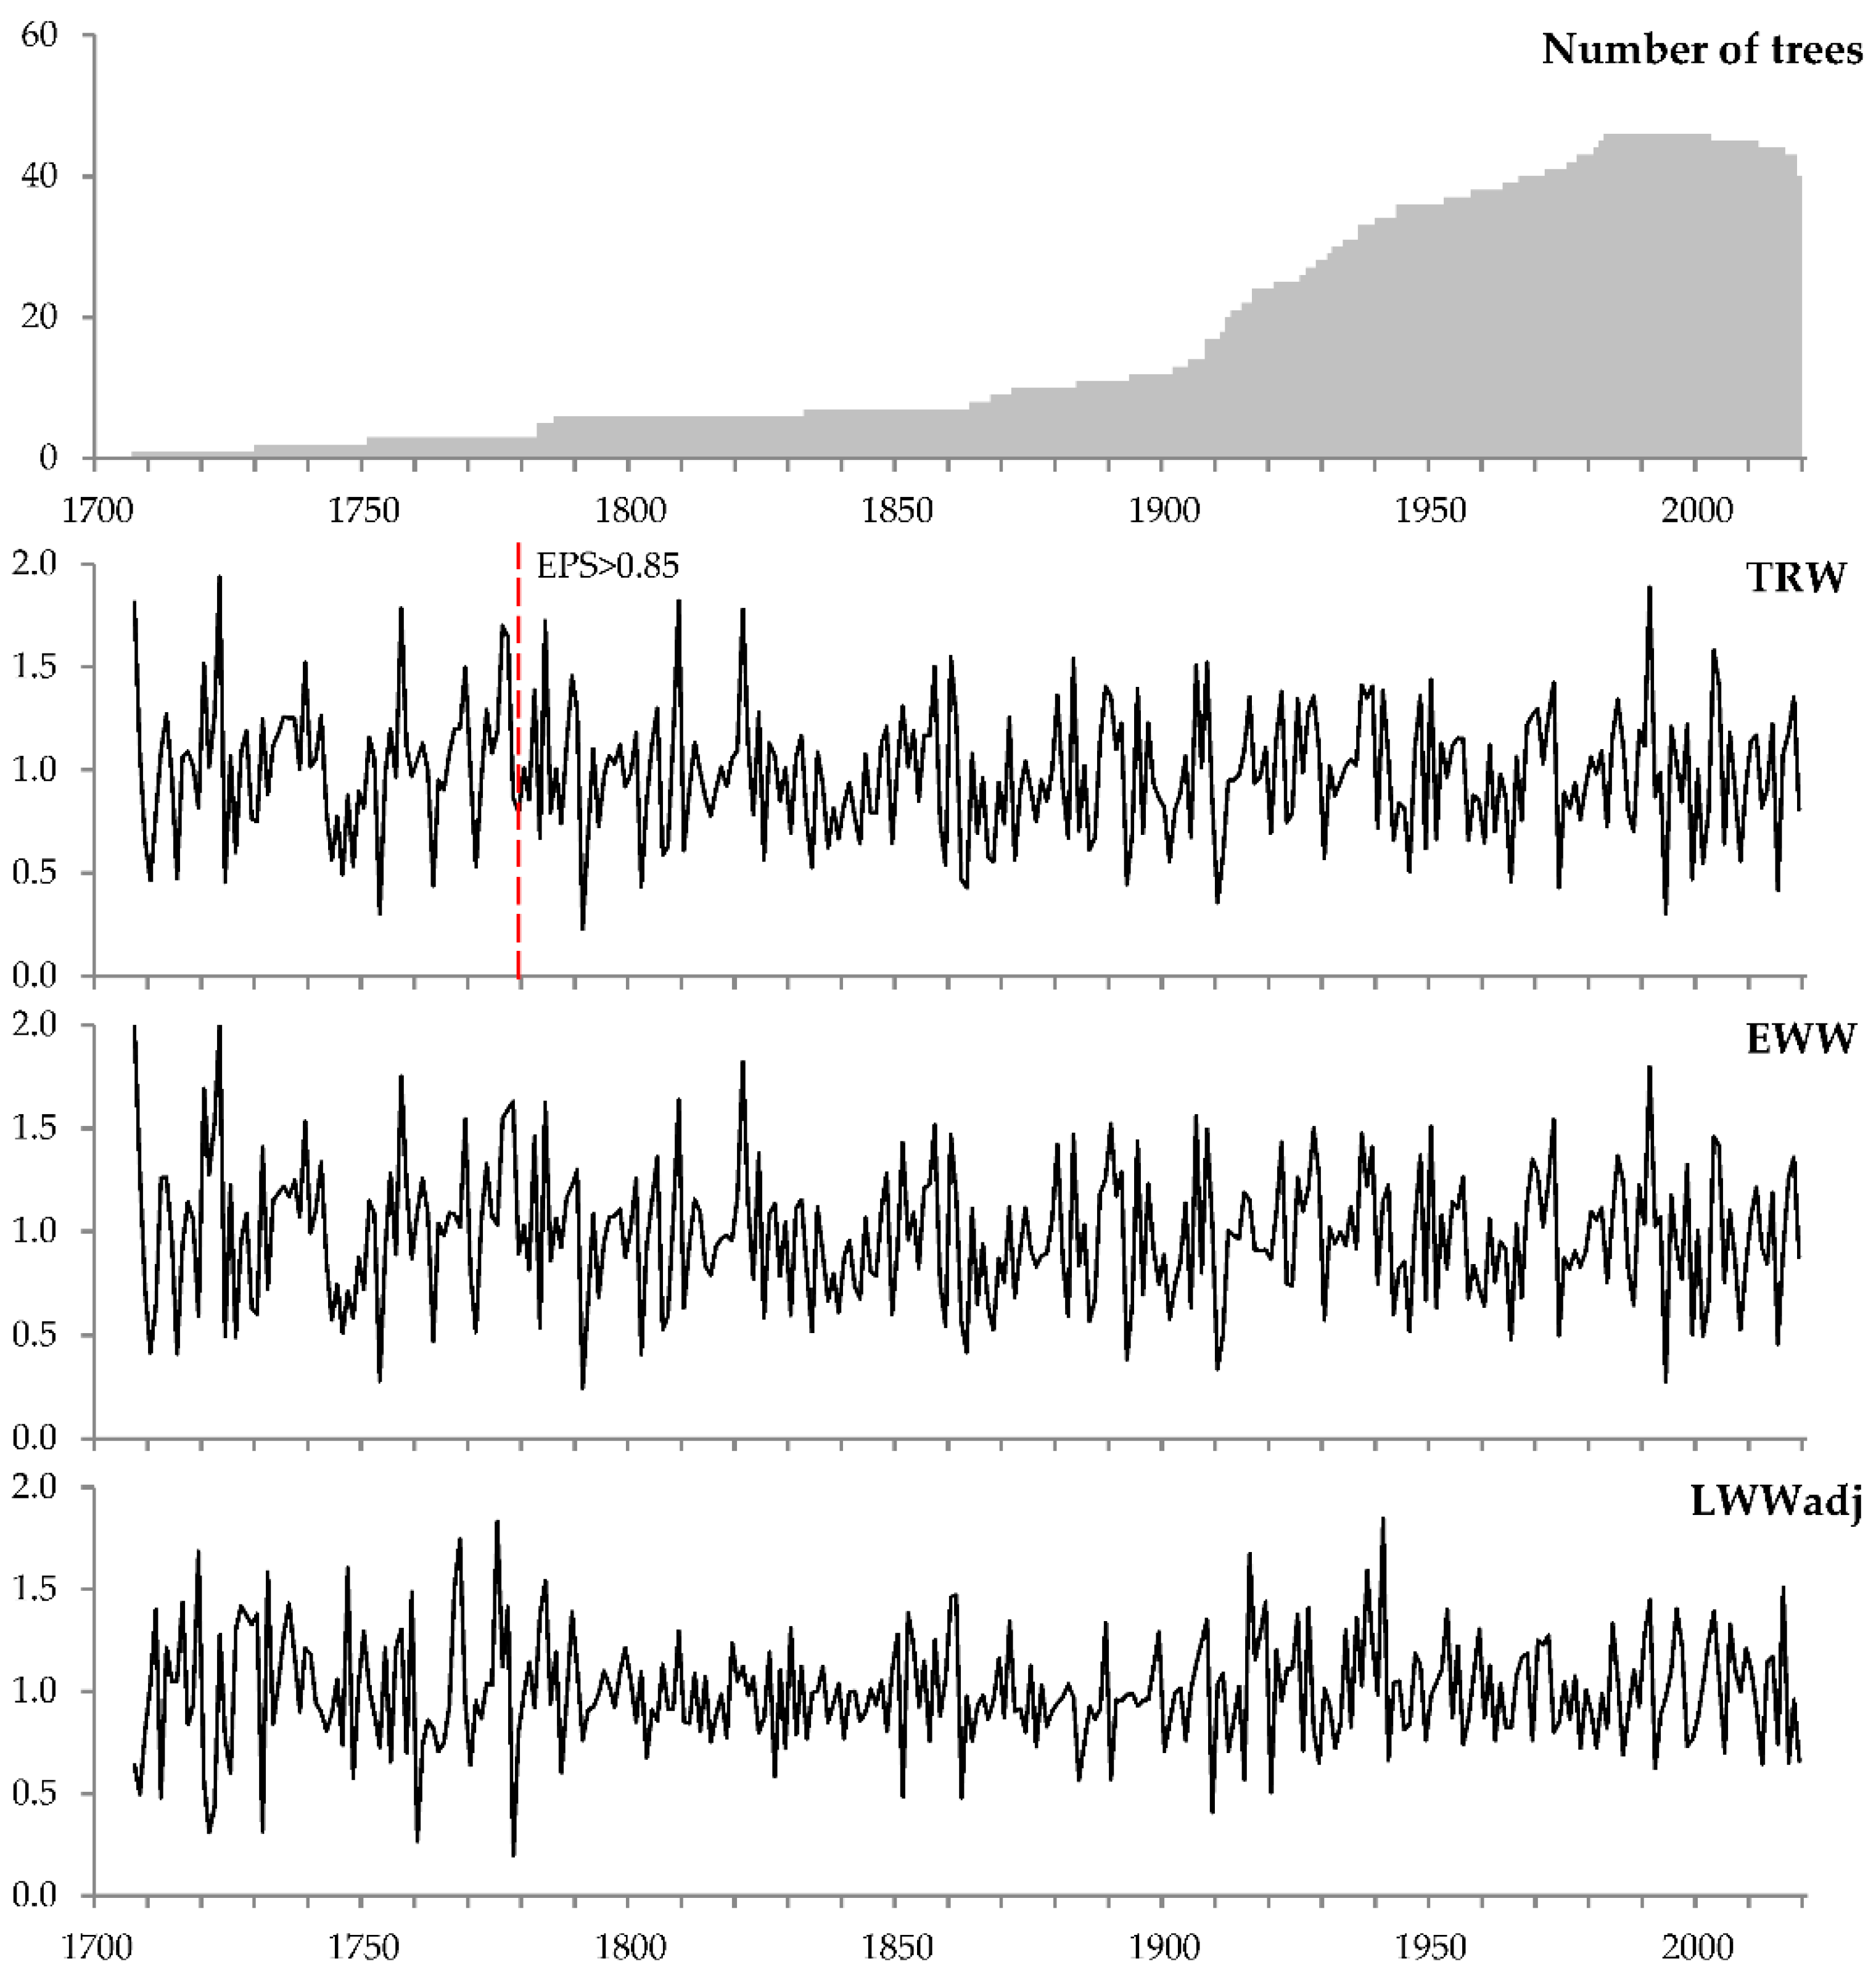
2.3. Tree-Ring Chronologies

Siberian larch (Larix sibirica) was selected as a source of dendrochronological data. This is a deciduous conifer tree, typical for boreal and mountain forests of Middle Siberia. L. sibirica is both frost- and drought-resistant, which makes it well adapted to the moisture-deficit conditions of the lower forest line in the continental climate of Siberia.
Long-term series of radial growth parameters, namely tree ring width (TRW), earlywood width (EWW), and latewood width (LWW) of Siberian larch were measured. Initially, local chronologies were developed at two sites located in the forest-steppe zone in the foothills of the Batenevsky ridge of the Kuznetsk Alatau: Bidzha (BID, 25 trees, 1706–2019, 54°00′ N 91°01′ E, 650–700 m a.s.l.) and Bograd (BGD, 21 tree, 1786–2019, 54°12′ N 90°50′ E, 500–600 m a.s.l.) in the vicinity of the settlements of the same names (Figure 1a). Both these sites are occupied by mixed birch-larch-pine forest. Sampling and processing of wood cores, measurement and cross-dating were carried out using standard dendrochronological methods [23]. Series were standardized removing long-term trends (represented by exponential or linear functions) and the autocorrelation component. Then, individual indexed series were averaged by bi-weighted mean to obtain the residual local TRW chronologies in the ARSTAN program [46]. The dynamics of the radial growth parameters significantly (p < 0.05) correlate between the sites (TRW: r = 0.56; EWW: r = 0.55; LWW: r = 0.35). Thus, the measurements from both sites were combined and, based on the entire sample, generalized chronologies of TRW, EWW and LWW were developed (Table 1, Figure 2). The EWW and LWW chronologies were closely correlated (r = 0.61), this relationship was taken into account by using the corrected chronology LWWadj, which was calculated as the residual of LWW after subtracting linear regression LWW = a0 + a1·EWW [26]. It means that EWW and LWWadj are orthogonal variables (i.e., r = 0), independent from each other and suitable for application as predictors in regression model. To evaluate period when tree-ring chronologies contain mostly common reaction to environmental factors registered by total population (forest stand), expressed population signal (EPS [49]) was calculated for TRW chronology with 50-year window and 1-year step. Only the period when EPS > 0.85 was used for reconstruction (Figure 2).

2.4. Statistical Analysis

The climatic response of productivity indicators was assessed as paired correlation coefficients of their chronologies with 21-day (and longer) series of temperature and precipitation from April to August, and with 21-day series of hydrothermal coefficient (HTC [50]) calculated from temperature and precipitation from May to August. Correlation analysis was carried out for both the entire overlap between cover periods of chronologies and climatic series, and for a 40-year window with a step of 1 year to analyze the temporal stability of the climatic response. To reconstruct the dynamics of yield, linear regression models were used with the parameters of larch radial growth and climatic series used as predictors. To identify the history of crop failures and low-yield periods according to the reconstruction model, it was linearly transformed into Z-scores (mean value = 0, standard deviation = 1) and smoothed with a 5-year moving average. Calculations were performed using STATISTICA and Microsoft Excel software.

3. Results

3.1. Relationships between Chronologies

The chronologies of larch earlywood and latewood width have input to the tree-ring width, proportional to their mean values: r = 0.95 for EWW, r = 0.26 for LWWadj. Both relationships are significant at p < 0.05. Zonal yield chronologies are rather closely correlated among each other: r = 0.61. Correlations between yield and larch growth are significantly lower in the Central zone (r = 0.27, 0.24, 0.16 with TRW, EWW, and LWWadj, respectively) than in the Northern zone (r = 0.43, 0.38, 0.36); however, all correlation coefficients are significant at p < 0.05 except for r (Y_C, LWWadj).

3.2. Climatic Response

During the growing season, all considered chronologies had a similar relationship with climatic factors: a positive response to precipitation and HTC and a negative one to temperature. However, the intensity and seasonality of this response varied (Figure 3). All the considered parameters of the larch radial growth had a more pronounced response to precipitation than to temperature. Earlywood and tree-ring widths correlated with precipitation from late April to late June, with temperature limitation starting from mid-April and ending in early July for EWW and early August for TRW. Adjusted chronology of LWW had a distinctly shifted climatic response. The maximum correlations were observed with precipitation from mid-May to the second half of July and temperatures from mid-June to the end of the season. The yield chronology in the Northern zone responded to precipitation in May-July and temperatures from late May to mid-August. In the Central zone, crops yield response to climatic factors ended earlier (in early July to precipitation, in early August to temperature) and was less intense, especially in terms of precipitation. The response to the HTC both in the larch tree-ring parameters and in the crops yield had a very similar pattern of seasonality and intensity as the response to precipitation; however, it is less uneven, especially in May.
Temporal stability analysis of the climatic response (Figure 4) showed that in the seasonality of the climatic response (i.e., the dates of the beginning, maximum and end of the significant impact of climatic factors), the stability of some dates was combined with systematic shifts of others. The onset of the temperature effect on EWW and TRW (end of April) gradually shifted to earlier dates, while the onset of precipitation influence on them was stable. A less pronounced shift to earlier dates was observed for the end of both the factors’ influence on LWW in the second–third decades of July. Although, the correlations with temperature may reappear later. The transfer of climatic impact from earlywood to latewood was stable and observed in mid-June. For yield, significant correlations with climatic factors began stably around 20 May for temperature, and around 10 May for precipitation. Observed at the beginning of July, maximum intensity of the temperature response during the stem elongation and booting gradually increased without temporal shift. The ending of the pronounced climatic response to temperature, occurring in early August for temperature and in early July for precipitation, in most cases shifted rapidly to earlier dates after 1995–2000. Nevertheless, observed in mid-August for temperature and in mid-July for precipitation, lessening of correlations to zero was more stable.

3.3. Yield Reconstruction Models

For each agroclimatic zone, regression models were developed linking the dynamics of the crop yields with the chronology of tree-ring width Y(TRW) and with the orthogonal chronologies of the earlywood width and adjusted latewood width Y(EWW, LWWadj). The equations and statistical characteristics of the models are presented in Table 2. For the Central zone, both models explain less than 10% of the yield variation, but for the Northern zone, TRW-based model explains 17.4% of the yield variation and the separate use of the earlywood and latewood width increases this value to 20.5%. After removing the component recorded by earlywood and latewood of larch from the yield dynamics, the residuals still contained a climatic signal, albeit less pronounced (Figure 5a). In the Central zone, maximum yield correlations with temperature and precipitation weakened from −0.532 to −0.473 and from 0.383 to 0.347, respectively; in the Northern zone, responses decreased from −0.553 to −0.476 for temperature, and from 0.546 to 0.297 with precipitation. Regression models of yield, taking into account this additional climatic signal, explain up to 39%–42% of its total variation. Plots of yield reconstruction models based on larch earlywood and latewood width and models including climatic predictors (temperature and precipitation) are presented in Figure 5b. As more factors are included in models, the fitness increases visibly; however, tree-ring based model of yield reconstruction for Northern zone already has the same extreme years as actual yield series.

3.4. History of Crop Failures and Low-Yield Periods

In the northern zone the yield model based on EWW and LWWadj has minimums that coincide with the observed crop failures throughout the republic (Figure 6). Therefore, an analysis of crop failures and low-yield periods was carried out for the period of 240 years (1780–2019). During this period, the TRW chronologies have expressed population signal EPS > 0.85 [49]. In this crop yield reconstruction, 79 years (33%) with yield less than threshold value (mean—0.5 standard deviation) were observed in the model. Most of these poor yield events (58 years) occurred after a year with satisfactory or high yield, but 21 events (9% of the total period length or 27% of bad harvest years) came consequentially. During the years 1837–1840 the longest duration of crop failures was recorded in a continuous sequence of the reconstructed poor yield. Smoothed by moving average, reconstructed yield dynamics showed that periods with low 5-year average yield are unevenly distributed over time, most often occurring in 1830–1915 (shaded areas in Figure 6). Despite some crop failures, periods 1795–1830, 1915–1940, and from 2003 to the present can be considered as more favorable for agricultural output. In recent decades, low yield period occurred only during 1997–2002. When the 40-year periods 1940–1979 and 1980–2019 were compared, a significant decrease in yield variation was observed. The standard deviation of the actual yield chronologies decreased from 0.46 to 0.38 in the Northern zone and from 0.36 to 0.32 in the Central zone. The considered model shows the same decreasing trend in yield variation over time, reaching beyond the coverage of actual series. For comparison, the following climatic trends in May-July were observed during these periods. During 1940–1979, stable temperatures were observed against the background of an increase in precipitation by approximately 5 mm per decade. During 1980–2019, there was a rise in temperatures by 0.32 °C and in precipitation by 7 mm per decade.

4. Discussion

4.1. Plant Behavior Under Climatic Extremes

Siberian larch is adapted to the conditions of the forest-steppe zone. It is a drought-resistant species [51] with an anisohydric strategy for regulating the water balance of plants under moisture deficit [52,53]. Under conditions of moderate drought, this plant slows down its metabolism as a consequence of decreasing soil moisture and thus reduced transpiration. But it does not close the stomata and continues its growth process. In extreme cases, evapotranspiration is regulated by partial desiccation of needles and thin roots [54,55]. Subsequently, synthesized nutrients are partially redirected toward restoration of lost parts, further slowing radial growth.
As for historically grown in the region local varieties of small grain crops, they already had some drought resistance due to long-term adaptation to climatic conditions of the South Siberia and unconscious artificial selection. Since the beginning of the 20th century, crop breeding in Siberia has been conducted based on scientific methodologies [27,45]. This breeding process was initially focused on increasing yield per se. However, in the more recent decades, interest shifted to plants’ growth stability in the harsh climatic conditions, i.e., complex resistance to drought, frost, diseases and pests. Selection for drought resistance was aimed not only at the survival of plants, but also at maintaining their productivity despite drought. The prominent Siberian breeder Vedrov N.G. [27], p. 42 stated that drought-resistant varieties of cereals in Siberia should “possess the properties inherent in wild plants of continental and high-mountain climates, such as high and complex static and dynamic resistance. It is expressed in the ability not to suspend growth and accumulation of dry matter under significant deviations of environment conditions from the optimum...”. Thus, we can conclude that similarity of observed responses of investigated plants to precipitation can be resulted from the same anisohydric growth strategy under drought stress of larch trees and local crops varieties after many years of breeding.
For small grain crops, heat stress (suppression of growth and tissue damage) occurs at temperatures above approximately +30 °C [33,56]. These occurrences in the present study are associated with the maximum climatic response of yield to temperature in July as the hottest month. However, a less pronounced peak of yield reaction to heat observed in late May–early June can also be associated with thermal damage. During the germination period, bare soil surface between plants can be overheated by solar radiation up to +60 °C [28] (cf. soil surface temperature ranges in other studies [57,58]), causing burn injuries of root crown and leaves at the soil level [28,59]. In addition, an increase in temperature during the period of vegetative growth leads to an accelerated development. When the temperature optimum is exceeded, it results in the fast formation of a lower plant with proportionally smaller sizes and numbers of stems, leaves and productive spikes, and hence reduced productivity [31,60,61]. Dry and hot extremes during the growing season increase damage by pests and diseases. Such conditions are more favorable for many biotic agents but increase the vulnerability of plants by drought stress [52,62,63]. This is another parallel between the considered productivity indicators.
On the other hand, there are practically no studies of the heat stress effect on Siberian larch despite its successful growth in the most continental conditions, i.e., under high magnitudes of seasonal and daily temperature variation. Such habitat conditions obviously include high maximum diurnal temperatures during summer in forest-steppes on the southern boundary of larch distribution range [64,65]. This lack of scientific interest in heat impact on larch may be an indirect evidence of its resistance to high temperatures. There are observations that larch cambial activity is linearly positively related to the average and maximum daily temperatures during most part of the season, only in July slowing down at maximum temperatures above the optimum of 24–26 °C [66]. However, the cited work considers the natural stand in the semiarid forest-steppe zone of Central Siberia where warm season temperatures are negatively correlated with precipitation similarly to the study area [67]. Thus, the impact of high temperatures here can be partially driven by its indirect drying effect. Additionally, the small size of larch needles detains their overheating [68,69]. Therefore, we can conclude that the observed weaker reaction of larch to temperature in comparison to crops might be explained by the low probability of thermal damage and heat stress for this species. It should be noted that other tree species (both coniferous and deciduous) also have a more pronounced reaction to precipitation than to temperature even in semiarid stands of the South Siberia [14,70]. Moreover, the semi-humid forests of the continental Asia respond positively to climate warming [71]. These patterns indicate a generally higher thermal tolerance of trees in comparison to herbaceous agricultural cereals, at least for local species and varieties.

4.2. Seasonality of Climatic Responses and Its Dynamics

In the radial growth of larch (earlywood and the total ring), the onset of a significant reaction to temperature occurred during the period of temperature transition above 5–7 °C (compare Figure 1b, Figure 3 and Figure 4). It is supported by a gradual shift of this reaction to earlier dates synchronously with warming climate. This temperature threshold can correspond to both the onset of cambial activity (cf. threshold values 8.4 ± 1.7 °C obtained by Rossi et al. [72]), and onset of growth of needles and shoots that begins earlier [73,74]. During this relatively cool period, the amount of precipitation has a weaker effect, which causes a lag in the beginning of the reaction to it. The boundary between pronounced climatic signals in earlywood and latewood occurs in mid-June and is completely stable, which suggests that for transition to latewood of Siberian larch, like other tree species and phenological processes, photoperiod is the main trigger [75,76,77]. The end of cambial activity in the second half of July slightly shifted to earlier dates, possibly due to an increase in heat supply.
For cereals, a shift of the onset of a pronounced response to precipitation to earlier dates is interesting. Unlike the instantaneous effect of temperature, precipitation provides soil moisture for the next days; for example, the moisture reserve in the soil at the time of sowing can be provided by precipitation from about the previous week. Thus, the reaction to them begins earlier. For rain-fed agriculture in the Northern Zone, the end of the influence of precipitation on crops yield is practically stable. This may be due to the input of photoperiod into regulation of the phenophases in cereals observed during most of the vegetative growth period [28,31]. In July, the level and discharge of water in the hydrological objects of the region reach a maximum [78]. This most likely leads to a weakening of the climatic response of cereals in the Central zone. On the other hand, phenological shifts in grain crops under the influence of climate warming were noted in many regions [79,80,81]. However, the influence of moisture availability on phenology is unclear [82,83]. According to the available data of the Karatuz testing station, the time of full grain maturity in our study area varies by 10 days depending on variety. This range significantly exceeds the temperature-driven phenological shifts given in the literature for the particular varieties. Hence the phenological trends caused in any variety by warming are not discernible in long term from the regional dynamics of sowing areas occupied by crops varieties with different rates of maturation.

4.3. Assessment of the Reconstructed Crop Yield in South Siberia

Earlier it was shown that in the study area, the dynamics of yield was driven by May-July climate and first-order autocorrelation component by approximately 30%–63% and has moderate similarity with the growth of larch [14]. Therefore, a low proportion of the explained variability for larch TRW-based model should be expected. Separating the signal by using earlywood and latewood widths made it possible to improve the quality of the model in the Northern zone (where the averaged crops yield has a fairly pronounced response to precipitation) and to explain about half of its climate-related variation (20.5% of 41.6%). In the Central zone, where the prevailing climatic impact on yield is caused by temperature, the higher heat tolerance of larch did not allow obtaining a model with a high proportion of explained variation. The climate signals analyzed in residuals after subtracting the EW-LW-based models indicated that in both zones these models better reflect reaction of yield to precipitation (substantially decreasing it in residuals), as compared to temperature. Thus, the “stumbling block”, limiting the possibilities of using the larch growth parameters in modeling of yield within the studied region, is the inseparability of the response to temperature and precipitation recorded in the tree-rings and the predominance of the response to precipitation in all three considered parameters TRW, EWW, and LWWadj (Figure 5c). We propose several ways to further improve the quality of the reconstruction model in the framework of using various tree-ring parameters. Firstly, the previously tested (Babushkina et al., 2018b) use of multiple chronologies of different species and/or their components of various frequencies. Secondly, providing a more detailed fitting of “temporal profile” of yield climatic response using the anatomical features of xylem cells measured in consequent sectors of tree rings (considering clear spatiotemporal sequence of their development and climatic responses [84]). Lastly, the application of temperature-sensitive tree-ring chronologies from the high elevation mountain ecosystems selected as additional predictors. In our case, the latter approach is valid despite the significant distance of the subalpine areas from the agricultural territories, considering that the spatial field of the air temperature is much more homogeneous in comparison with precipitation. We believe that the combination of these approaches will allow developing appropriate reconstruction models that describe the dynamics of the climate-dependent component of the yield with high accuracy and duration.

4.4. History and Prospects of Crops Failures

The restored long-term dynamics of crop failures over 240 years not only made it possible to evaluate the overall chances of crop failure, but also showed that there is a significant statistical probability of consecutive bad harvests up to four years in a row, as well as periods of long-term yield depressions. These estimates can be used in agricultural management of the region to assess future risks. In the climate of the continental Asia, and in particular southern Siberia, the rate of warming in recent decades is significantly higher than the global one [70,85,86]. However, as recorded in both reconstruction model and actual yield data, this warming did not lead to an increase in the frequency of crop failures, which can be expected under such conditions, or to an increase in the variation of yield. In contrast, the standard deviations of yield series after 1980 have decreased compared to the previous period. This may be due to the development of scientific breeding (including the work of specialized research institutes and breeding centers founded during 1950s–1970s) focused on varieties whose yield is resistant to droughts and other unfavorable conditions [27,45,87]. It should also be noted, that the construction of the Krasnoyarsk and Sayano-Shushenskoe reservoirs and launching respective hydroelectric power plants in 1968 and 1980 had a significant impact on the regional climate, especially in the steppe zone closest to the Yenisei River [88,89,90]. Huge volume of water in reservoirs serves as heat accumulators leading to a delay and a decrease in daily and seasonal temperature fluctuations. This results in a decrease in the climate continentality and lessening of the intensity of droughts and heat waves [70]. The crop yield pattern over the 240-year period in southern Siberia thus depended significantly on climatic parameters in the early part of the record, but towards recent time was indirectly influenced by numerous factors that reduced the inhibition of crop growth.

5. Conclusions

Our investigations confirmed the proposed hypothesis that separate earlywood and latewood widths chronologies can provide better fitting reconstruction than total ring width for crops yield in semiarid conditions. However, this reconstruction was unable to clearly separate the climatic signal in terms of temperature and precipitation impacting the plant growth. The strength of the modeled reconstruction lies in its observed pattern of past crop failures. This model can contribute to further understand the impact of climate fluctuations on the growth pattern of developed crop varieties in the study area. It can further provide evidence of impact of extreme drought events on crop yield and contribute towards planning in case of future occurrence of similar long duration drought events. The local crop varieties have been developed to adjust to the conditions in the region, but the changing temperature and precipitation conditions have minimal impact on the new varieties in the present warming climate, as stability in dynamics of crop failures and variation of yield showed. The same adaptability shall last in longer spatio-temporal scales analogous to plant species surviving through the extreme conditions in the region; however, it needs to be further investigated.

Author Contributions

Conceptualization, E.A.B. and E.A.V.; methodology, L.V.B. and E.A.V.; validation, E.A.B.; formal analysis, L.V.B.; investigation, E.A.B., D.F.Z., L.V.B. and V.V.K.; resources, E.A.B. and V.V.K.; data curation, D.F.Z. and L.V.B.; writing—original draft preparation, all authors; writing—review and editing, D.F.Z., L.V.B., N.M. and S.K.S.; visualization, L.V.B. and S.K.S.; supervision, E.A.V.; project administration, E.A.B. and D.F.Z.; funding acquisition, E.A.B. All authors have read and agreed to the published version of the manuscript.

Funding

This research was funded by the Ministry of Science and Higher Education of the Russian Federation, scientific topic code FSRZ-2020-0010, and the Russian Foundation for Basic Research, grant number 20-016-00049.

Institutional Review Board Statement

Not applicable.

Informed Consent Statement

Not applicable.

Data Availability Statement

The data presented in this study are available on request from the corresponding author.

Acknowledgments

N.M. and S.K.S. are thankful to the Director, Birbal Sahni Institute of Palaeosciences for the kind support given. N.M. also like to thank DST WOS-A for the support given to her.

Conflicts of Interest

The authors declare that there is no conflict of interest. The funders had no role in the design of the study; in the collection, analyses, or interpretation of data; in the writing of the manuscript, or in the decision to publish the results.

References

  1. Vaganov, E.A. Method of crops yield prediction using dendrochronological data. Soviet J. Ecol. 1989, 3, 15–23. (In Russian) [Google Scholar]
  2. Wu, X.; Babst, F.; Ciais, P.; Frank, D.; Reichstein, M.; Wattenbach, M.; Zang, C.; Mahecha, M.D. Climate-mediated spatiotemporal variability in terrestrial productivity across Europe. Biogeosciences 2014, 11, 3057–3068. [Google Scholar] [CrossRef] [Green Version]
  3. Bindi, M.; Olesen, J.E. The responses of agriculture in Europe to climate change. Regi. Environ. Chang. 2011, 11, 151–158. [Google Scholar] [CrossRef]
  4. Peltonen-Sainio, P.; Jauhiainen, L.; Palosuo, T.; Hakala, K.; Ruosteenoja, K. Rainfed crop production challenges under European high latitude conditions. Reg. Environ. Chang. 2016, 16, 1521–1533. [Google Scholar] [CrossRef]
  5. Myglan, V.S.; Ovchinnikov, D.V.; Vaganov, E.A.; Zhirnova, D.F. Influence of climatic changes on the economic activities of the population in Southern Siberia during the Little Ice Age. Geogr. Nat. Resour. 2007, 1, 90–96. (In Russian) [Google Scholar]
  6. Sauchyn, D.; Barrow, E.; Fang, X.; Henderson, N.; Johnston, M.; Pomeroy, J.; Thorpe, J.; Wheaton, E.; Williams, B. Saskatchewan’s Natural Capital in a Changing Climate: An Assessment of Impacts and Adaptation. Report to Saskatchewan Ministry of Environment from the Prairie Adaptation Research Collaborative; PARC: Saskatchewan, Canada, 2009; Available online: https://www.parc.ca/wp-content/uploads/2019/05/Sauchyn_Barrow_Fang-2009-Saskatchewans_natural_capital_in_changing_climate_an_assessment_of_impacts_and_adaptation.pdf (accessed on 1 September 2020).
  7. Huhtamaa, H.; Helama, S.; Holopainen, J.; Rethorn, C.; Rohr, C. Crop yield responses to temperature fluctuations in 19th century Finland: Provincial variation in relation to climate and tree-rings. Boreal Environ. Res. 2015, 20, 707–723. [Google Scholar] [CrossRef]
  8. Therrell, M.D.; Stanle, D.W.; Diaz, J.V.; Cornelo Oviedo, E.H.; Cleaveland, M.K. Tree-ring reconstructed maize yield in central Mexico: 1474-2001. Clim. Chang. 2006, 74, 493–504. [Google Scholar] [CrossRef]
  9. Shi, F.; Yang, B.; Mairesse, A.; von Gunten, L.; Li, J.; Bräuning, A.; Yang, F.; Xiao, X. Northern Hemisphere temperature reconstruction during the last millennium using multiple annual proxies. Clim. Res. 2013, 56, 231–244. [Google Scholar] [CrossRef] [Green Version]
  10. Huhtamaa, H.; Helama, S. Reconstructing crop yield variability in Finland: Long-term perspective of the cultivation history on the agricultural periphery since AD 760. Holocene 2017, 27, 3–11. [Google Scholar] [CrossRef]
  11. Salzer, M.W.; Kipfmueller, K.F. Reconstructed temperature and precipitation on a millennial timescale from tree-rings in the southern Colorado Plateau, USA. Clim. Chang. 2005, 70, 465–487. [Google Scholar] [CrossRef]
  12. Stahle, D.W.; Diaz, J.V.; Burnette, D.J.; Paredes, J.C.; Heim, R.R., Jr.; Fye, F.K.; Soto, R.A.; Therrell, M.D.; Cleaveland, M.K.; Stahle, D.K. Major Mesoamerican droughts of the past millennium. Geophys. Res. Lett. 2011, 38, L05703. [Google Scholar] [CrossRef]
  13. Touchan, R.; Kherchouche, D.; Oudjehih, B.; Touchan, H.; Slimani, S.; Meko, D.M. Dendroclimatology and wheat production in Algeria. J. Arid Environ. 2016, 124, 102–110. [Google Scholar] [CrossRef]
  14. Babushkina, E.A.; Belokopytova, L.V.; Shah, S.K.; Zhirnova, D.F. Past crops yield dynamics reconstruction from tree-ring chronologies in the forest-steppe zone based on low- and high-frequency components. Int. J. Biometeorol. 2018, 62, 861–871. [Google Scholar] [CrossRef] [Green Version]
  15. Rygalova, N.V.; Rygalov, E.V.; Bykov, N.I. Reconstruction of grain yield in the steppe zone of the Altai territory (south of Western Siberia) in the XIX-XX centuries on the basis of tree-ring chronologies of tape burs. In IOP Conference Series: Earth and Environmental Science, Proceedings of the International Conference on Sustainable Development of Cross-Border Regions, Barnaul, Russia, 19–20 April 2019; IOP Publishing: Bristol, England, 2019; Volume 395, p. 012046. [Google Scholar]
  16. Kaisermann, A.; de Vries, F.T.; Griffiths, R.I.; Bardgett, R.D. Legacy effects of drought on plant–soil feedbacks and plant–plant interactions. New Phytol. 2017, 215, 1413–1424. [Google Scholar] [CrossRef] [PubMed] [Green Version]
  17. Zhou, X.; Geng, X.; Yin, G.; Hänninen, H.; Hao, F.; Zhang, X.; Fu, Y.H. Legacy effect of spring phenology on vegetation growth in temperate China. Agric. For. Meteorol. 2020, 281, 107845. [Google Scholar] [CrossRef]
  18. Campelo, F.; Vieira, J.; Nabais, C. Tree-ring growth and intra-annual density fluctuations of Pinus pinaster responses to climate: Does size matter? Trees 2013, 27, 763–772. [Google Scholar] [CrossRef] [Green Version]
  19. Schuster, R.; Oberhuber, W. Age-dependent climate–growth relationships and regeneration of Picea abies in a drought-prone mixed-coniferous forest in the Alps. Can. J. For. Res. 2013, 43, 609–618. [Google Scholar] [CrossRef] [Green Version]
  20. Hoch, G.; Richter, A.; Körner, C. Non-structural carbon compounds in temperate forest trees. Plant Cell Environ. 2003, 26, 1067–1081. [Google Scholar] [CrossRef]
  21. Ogle, K.; Pacala, S.W. A modeling framework for inferring tree growth and allocation from physiological, morphological and allometric traits. Tree Physiol. 2009, 29, 587–605. [Google Scholar] [CrossRef]
  22. Piper, F.I.; Fajardo, A. Foliar habit, tolerance to defoliation and their link to carbon and nitrogen storage. J. Ecol. 2014, 102, 1101–1111. [Google Scholar] [CrossRef]
  23. Cook, E.R.; Kairiukstis, L.A. Methods of Dendrochronology: Application in Environmental Sciences; Kluwer Academic Publishers: Dordrecht, Germany, 1990. [Google Scholar]
  24. Pérez-de-Lis, G.; García-González, I.; Rozas, V.; Olano, J.M. Feedbacks between earlywood anatomy and non-structural carbohydrates affect spring phenology and wood production in ring-porous oaks. Biogeosciences 2016, 13, 5499–5510. [Google Scholar] [CrossRef] [Green Version]
  25. Szejner, P.; Wright, W.E.; Belmecheri, S.; Meko, D.; Leavitt, S.W.; Ehleringer, J.R.; Monson, R.K. Disentangling seasonal and interannual legacies from inferred patterns of forest water and carbon cycling using tree-ring stable isotopes. Glob. Chang. Biol. 2018, 24, 5332–5347. [Google Scholar] [CrossRef] [PubMed]
  26. Meko, D.M.; Baisan, C.H. Pilot study of latewood width of conifers as an indicator of variability of summer rainfall in the North American monsoon region. Int. J. Climatol. J. R. Meteorol. Soc. 2001, 21, 697–708. [Google Scholar] [CrossRef]
  27. Vedrov, N.G. Breeding and Seed Production of Spring Wheat in Extreme Conditions; Krasnoyarsk University: Krasnoyarsk, Russia, 1984. (In Russian) [Google Scholar]
  28. Vedrov, N.G.; Dmitriev, V.E.; Nesterenko, E.M.; Nikitina, V.I.; Sannikova, L.G.; Frolov, I.N.; Halipsky, A.N. Spring Wheat in Eastern Siberia (Biology, Ecology, Breeding and Seed Production, Cultivation Technology); Krasnoyarsk State Agrarian University: Krasnoyarsk, Russia, 1998. (In Russian) [Google Scholar]
  29. Tsybenov, B.B.; Biltuev, A.S. Connection of yielding capacity of spring wheat with elements of productivity in arid conditions of Buryatia. Bull. North. Trans-Ural State Agric. Univers. 2016, 2, 87–93. (In Russian) [Google Scholar]
  30. Brinton, J.; Uauy, C. A reductionist approach to dissecting grain weight and yield in wheat. J. Integr. Plant Biol. 2019, 61, 337–358. [Google Scholar] [CrossRef] [Green Version]
  31. Acevedo, E.; Silva, P.; Silva, H. Wheat growth and physiology. In Bread Wheat, Improvement and Production; Curtis, B.C., Rajaram, S., Gómez Macpherson, H., Eds.; FAO: Rome, Italy, 2002; pp. 39–70. [Google Scholar]
  32. Majumder, D.A.N.; Shamsuddin, A.K.M.; Kabir, M.A.; Hassan, L. Genetic variability, correlated response and path analysis of yield and yield contributing traits of spring wheat. J. Bangladesh Agric. Univ. 2008, 6, 227–234. [Google Scholar] [CrossRef] [Green Version]
  33. Prasad, P.V.; Bheemanahalli, R.; Jagadish, S.K. Field crops and the fear of heat stress–opportunities, challenges and future directions. Field Crop. Res. 2017, 200, 114–121. [Google Scholar] [CrossRef] [Green Version]
  34. Fábián, A.; Sáfrán, E.; Szabó-Eitel, G.; Barnabás, B.; Jäger, K. Stigma functionality and fertility are reduced by heat and drought co-stress in wheat. Front. Plant Sci. 2019, 10, 244. [Google Scholar] [CrossRef]
  35. Zargar, M.; Bodner, G.; Tumanyan, A.; Tyutyuma, N.; Plushikov, V.; Pakina, E.; Shcherbakova, N.; Bayat, M. Productivity of various barley (Hordeum vulgare L.) cultivars under semi-arid conditions in southern Russia. Agron. Res. 2018, 16, 2242–2253. [Google Scholar] [CrossRef]
  36. Ivanova, I.; Ilina, S. Variability of morphological features of spring soft wheat Moskovskaya 35. In IOP Conference Series: Earth and Environmental Science, Proceedings of the International AgroScience Conference (AgroScience-2019), Cheboksary, Russia, 1–2 June 2019; IOP Publishing: Bristol, UK, 2020; Volume 433, p. 012016. [Google Scholar]
  37. Plaut, Z.; Butow, B.J.; Blumenthal, C.S.; Wrigley, C.W. Transport of dry matter into developing wheat kernels and its contribution to grain yield under post-anthesis water deficit and elevated temperature. Field Crop. Res. 2004, 86, 185–198. [Google Scholar] [CrossRef]
  38. Hay, R.K.M. Harvest index: A review of its use in plant breeding and crop physiology. Ann. Appl. Biol. 1995, 126, 197–216. [Google Scholar] [CrossRef]
  39. Carmo-Silva, E.; Andralojc, P.J.; Scales, J.C.; Driever, S.M.; Mead, A.; Lawson, T.; Raines, C.A.; Parry, M.A.J. Phenotyping of field-grown wheat in the UK highlights contribution of light response of photosynthesis and flag leaf longevity to grain yield. J. Exp. Bot. 2017, 68, 3473–3486. [Google Scholar] [CrossRef] [PubMed]
  40. Babushkina, E.A.; Belokopytova, L.V.; Zhirnova, D.F.; Shah, S.K.; Kostyakova, T.V. Climatically driven yield variability of major crops in Khakassia (South Siberia). Int. J. Biometeorol. 2018, 62, 939–948. [Google Scholar] [CrossRef] [PubMed] [Green Version]
  41. Alisov, B.P. Climate of the USSR; Moscow State University: Moscow, Russia, 1956. (In Russian) [Google Scholar]
  42. USSR. Hydrometeorological Service. In Agroclimatic Resources of the Krasnoyarsk Krai and of the Tuva ASSR; Hydrometeoizdat: Leningrad, Russia, 1974. (In Russian) [Google Scholar]
  43. Mistryukov, A.A. Geomorphological Zoning of the Nazarovsko-Minusinsk Intermountain Depression; A.A. Trofimuk Joint Institute of Geology, Geophysics and Mineralogy SB RAS: Novosibirsk, Russia, 1991. (In Russian) [Google Scholar]
  44. Russian Federation. Government of the Republic of Khakassia. Territorial Planning Scheme of the Republic of Khakassia; Approved by Resolution No 763 from 14 November 2011. Available online: http://www.pravo.gov.ru/proxy/ips/?docbody=&nd=167019881 (accessed on 1 September 2020). (In Russian)
  45. Likhenko, I.E.; Artemova, G.V.; Khristov, Y.A. Establishment and development of plant breeding in Siberia. Sib. Bull. Agric. Sci. 2014, 5, 28–35. (In Russian) [Google Scholar]
  46. Cook, E.R.; Krusic, P.J. Program ARSTAN: A Tree-Ring Standardization Program Based on Detrending and Autoregressive Time Series Modeling, with Interactive Graphics; Lamont-Doherty Earth Observatory, Columbia University: New York, NY, USA, 2005. [Google Scholar]
  47. Ozturk, A.; Aydin, F. Effect of water stress at various growth stages on some quality characteristics of winter wheat. J. Agron. Crop Sci. 2004, 190, 93–99. [Google Scholar] [CrossRef]
  48. Meng, Z.; Duan, A.; Dassanayake, K.B.; Chen, D.; Gao, Y.; Wang, X.; Shen, X. Effects of regulated deficit irrigation on grain yield and quality traits in winter wheat. Trans. ASABE 2016, 59, 897–907. [Google Scholar] [CrossRef]
  49. Wigley, T.; Briffa, K.; Jones, P. On the average value of correlated time series, with applications in dendroclimatology and hydrometeorology. J. Appl. Meteorol. Climatol. 1984, 23, 201–213. [Google Scholar] [CrossRef]
  50. Selyaninov, G.T. Principles of agroclimatic regional planning in USSR. In Questions of Agroclimatic Zoning of the USSR; Davitaya, F.F., Shulgina, A.I., Eds.; Ministry of Agriculture of the USSR: Moscow, Russia, 1958; pp. 18–26. (In Russian) [Google Scholar]
  51. Kharuk, V.I.; Petrov, I.A.; Dvinskaya, M.L.; Im, S.T.; Shushpanov, A.S. Comparative reaction of larch (Larix sibirica Ledeb.) radial increment on climate change in the forest steppe and highlands of Southern Siberia. Contemp. Probl. Ecol. 2018, 11, 388–395. [Google Scholar] [CrossRef]
  52. McDowell, N.; Pockman, W.T.; Allen, C.D.; Breshears, D.D.; Cobb, N.; Kolb, T.; Plaut, J.; Sperry, J.; West, A.; Williams, D.G.; et al. Mechanisms of plant survival and mortality during drought: Why do some plants survive while others succumb to drought? New Phytol. 2008, 178, 719–739. [Google Scholar] [CrossRef]
  53. Martínez-Vilalta, J.; Poyatos, R.; Aguadé, D.; Retana, J.; Mencuccini, M. A new look at water transport regulation in plants. New Phytol. 2014, 204, 105–115. [Google Scholar] [CrossRef] [Green Version]
  54. Chenlemuge, T.; Schuldt, B.; Dulamsuren, C.; Hertel, D.; Leuschner, C.; Hauck, M. Stem increment and hydraulic architecture of a boreal conifer (Larix sibirica) under contrasting macroclimates. Trees 2015, 29, 623–636. [Google Scholar] [CrossRef]
  55. Khansaritoreh, E.; Schuldt, B.; Dulamsuren, C. Hydraulic traits and tree-ring width in Larix sibirica Ledeb. as affected by summer drought and forest fragmentation in the Mongolian forest steppe. Ann. For. Sci. 2018, 75, 30. [Google Scholar] [CrossRef] [Green Version]
  56. Koehler, A.-K.; Challinor, A.J.; Hawkins, E.; Asseng, S. Influences of increasing temperature on Indian wheat: Quantifying limits to predictability. Environ. Res. Lett. 2013, 8, 034016. [Google Scholar] [CrossRef]
  57. Gibbs, J.G.; Patten, D.T. Plant temperatures and heat flux in a Sonoran Desert ecosystem. Oecol. 1970, 5, 165–184. [Google Scholar] [CrossRef]
  58. Hesslerová, P.; Pokorný, J.; Brom, J.; Rejšková–Procházková, A. Daily dynamics of radiation surface temperature of different land cover types in a temperate cultural landscape: Consequences for the local climate. Ecol. Eng. 2013, 54, 145–154. [Google Scholar] [CrossRef]
  59. Altergot, V.F.; Mordkovich, S.S. Heat Damage to Wheat under Conditions of Sufficient Moisture; Science: Novosibirsk, Russia, 1977. (In Russian) [Google Scholar]
  60. Friend, D.J.C. Ear length and spikelet number of wheat grown at different temperatures and light intensities. Can. J. Bot. 1965, 43, 345–353. [Google Scholar] [CrossRef]
  61. Hossain, A.; da Silva, J.A.T.; Lozovskaya, M.V.; Zvolinsky, V.P. High temperature combined with drought affect rainfed spring wheat and barley in South-Eastern Russia: I. Phenology and growth. Saudi J. Biol. Sci. 2012, 19, 473–487. [Google Scholar] [CrossRef] [Green Version]
  62. Kistner, E.; Kellner, O.; Andresen, J.; Todey, D.; Morton, L.W. Vulnerability of specialty crops to short-term climatic variability and adaptation strategies in the Midwestern USA. Clim. Chang. 2018, 146, 145–158. [Google Scholar] [CrossRef] [Green Version]
  63. Vanhanen, H.; Veteli, T.O.; Päivinen, S.; Kellomäki, S.; Niemelä, P. Climate change and range shifts in two insect defoliators: Gypsy moth and nun moth—A model study. Silva Fenn. 2007, 41, 621–638. [Google Scholar] [CrossRef] [Green Version]
  64. Nazimova, D.I.; Polikarpov, N.P. Forest zones of Siberia as determined by climatic zones and their possible transformation trends under global change. Silva Fenn. 1996, 30, 201–208. Available online: http://hdl.handle.net/1975/9232 (accessed on 1 September 2020). [CrossRef] [Green Version]
  65. Abaimov, A.P.; Lesinski, J.A.; Martinsson, O.; Milyutin, L.I. Variability and Ecology of Siberian Larch Species; Reports, 43; Swedish University of Agricultural Sciences, Department of Silviculture: Umea, Sweden, 1998. [Google Scholar]
  66. Antonova, G.F.; Stasova, V.V. Effects of environmental factors on wood formation in larch (Larix sibirica Ldb.) stems. Trees 1997, 11, 462–468. [Google Scholar] [CrossRef]
  67. Bazhenova, O.I.; Tyumentseva, E.M. The structure of contemporary denudation in the steppes of the Minusinskaya depression. Geogr. Nat. Resour. 2010, 4, 362–369. [Google Scholar] [CrossRef]
  68. Leigh, A.; Sevanto, S.; Close, J.D.; Nicotra, A.B. The influence of leaf size and shape on leaf thermal dynamics: Does theory hold up under natural conditions? Plant Cell Environ. 2017, 40, 237–248. [Google Scholar] [CrossRef] [PubMed]
  69. Bhusal, N.; Lee, M.; Han, A.R.; Han, A.; Kim, H.S. Responses to drought stress in Prunus sargentii and Larix kaempferi seedlings using morphological and physiological parameters. For. Ecol. Manag. 2020, 465, 118099. [Google Scholar] [CrossRef]
  70. Babushkina, E.A.; Zhirnova, D.F.; Belokopytova, L.V.; Tychkov, I.I.; Vaganov, E.A.; Krutovsky, K.V. Response of four tree species to changing climate in a moisture-limited area of South Siberia. Forests 2019, 10, 999. [Google Scholar] [CrossRef] [Green Version]
  71. Liu, H.; Park Williams, A.; Allen, C.D.; Guo, D.; Wu, X.; Anenkhonov, O.A.; Liang, E.; Sandanov, D.V.; Yin, Y.; Qi, Z.; et al. Rapid warming accelerates tree growth decline in semi-arid forests of Inner Asia. Glob. Change Biol. 2013, 19, 2500–2510. [Google Scholar] [CrossRef] [PubMed]
  72. Rossi, S.; Deslauriers, A.; Griçar, J.; Seo, J.-W.; Rathgeber, C.B.K.; Anfodillo, T.; Morin, H.; Levanic, T.; Oven, P.; Jalkanen, R. Critical temperatures for xylogenesis in conifers of cold climates. Glob. Ecol. Biogeogr. 2008, 17, 696–707. [Google Scholar] [CrossRef]
  73. Gower, S.T.; Richards, J.H. Larches: Deciduous conifers in an evergreen world. BioScience 1990, 40, 818–826. [Google Scholar] [CrossRef]
  74. Velisevich, S.N.; Khutornoi, O.V. Effects of climatic factors on radial growth of Siberian stone pine and Siberian larch in sites with different soil humidity in the south of western Siberia. J. Sib. Fed. Univ. Biol. 2009, 12, 11732. (In Russian) [Google Scholar]
  75. Heide, O.M. Growth and dormancy in Norway spruce ecotypes (Picea abies) I. Interaction of photoperiod and temperature. Physiol. Plant. 1974, 30, 1–12. [Google Scholar] [CrossRef]
  76. Cartenì, F.; Deslauriers, A.; Rossi, S.; Morin, H.; De Micco, V.; Mazzoleni, S.; Giannino, F. The physiological mechanisms behind the earlywood-to-latewood transition: A process-based modeling approach. Front. Plant Sci. 2018, 9, 1053. [Google Scholar] [CrossRef] [PubMed]
  77. Huang, J.G.; Campelo, F.; Ma, Q.; Zhang, Y.; Bergeron, Y.; Deslauriers, A.; Fonti, P.; Liang, E.; Mäkinen, H.; Oberhuber, W.; et al. Photoperiod plays a dominant and irreplaceable role in triggering secondary growth resumption. Proc. Natl. Acad. Sci. USA 2020, 117, 32865–32867. [Google Scholar] [CrossRef] [PubMed]
  78. Babushkina, E.A.; Belokopytova, L.V.; Grachev, A.M.; Meko, D.M.; Vaganov, E.A. Variation of the hydrological regime of Bele-Shira closed basin in Southern Siberia and its reflection in the radial growth of Larix sibirica. Reg. Environ. Chang. 2017, 17, 1725–1737. [Google Scholar] [CrossRef] [Green Version]
  79. Tao, F.; Yokozawa, M.; Xu, Y.; Hayashi, Y.; Zhang, Z. Climate changes and trends in phenology and yields of field crops in China, 1981–2000. Agric. For. Meteorol. 2006, 138, 82–92. [Google Scholar] [CrossRef]
  80. Estrella, N.; Sparks, T.H.; Menzel, A. Trends and temperature response in the phenology of crops in Germany. Glob. Change Biol. 2007, 13, 1737–1747. [Google Scholar] [CrossRef]
  81. Ren, S.; Qin, Q.; Ren, H.; Sui, J.; Zhang, Y. Heat and drought stress advanced global wheat harvest timing from 1981–2014. Remote Sens. 2019, 11, 971. [Google Scholar] [CrossRef] [Green Version]
  82. McMaster, G.; Wilhelm, W. Phenological responses of wheat and barley to water and temperature: Improving simulation models. J. Agric. Sci. 2003, 141, 129–147. [Google Scholar] [CrossRef] [Green Version]
  83. Lobell, D.B.; Sibley, A.; Ortiz-Monasterio, J.I. Extreme heat effects on wheat senescence in India. Nat. Clim. Chang. 2012, 2, 186–189. [Google Scholar] [CrossRef]
  84. Belokopytova, L.V.; Babushkina, E.A.; Zhirnova, D.F.; Panyushkina, I.P.; Vaganov, E.A. Pine and larch tracheids capture seasonal variations of climatic signal at moisture-limited sites. Trees 2019, 33, 227–242. [Google Scholar] [CrossRef] [Green Version]
  85. Kug, J.S.; Jeong, J.H.; Jang, Y.S.; Kim, B.M.; Folland, C.K.; Min, S.K.; Son, S.W. Two distinct influences of Arctic warming on cold winters over North America and East Asia. Nat. Geosci. 2015, 8, 759. [Google Scholar] [CrossRef]
  86. Liu, X.; Pan, Y.; Zhu, X.; Yang, T.; Bai, J.; Sun, Z. Drought evolution and its impact on the crop yield in the North China Plain. J. Hydrol. 2018, 564, 984–996. [Google Scholar] [CrossRef]
  87. Demorenko, I.F.; Vasiljeva, O.M. Selection and seed growing of the spring wheat in conditions of the south of average Siberia. Achiev. Sci. Technol. AIC 2011, 4, 24–25. (In Russian) [Google Scholar]
  88. Popov, A.V.; Shatravskii, A.I. Removal of floating timber from the Sayano-Shushenskoe hydrostation reservoir. Hydrotech. Constr. 1994, 28, 204. [Google Scholar] [CrossRef]
  89. Savkin, V.M. Water reservoirs of Siberia: Consequences of their creation to water ecology and water management facilities. Sib. Ecol. J. 2000, 2, 109–121. (In Russian) [Google Scholar]
  90. Kosmakov, I.V. Thermal and Ice Regime in the Upper and Lower Reaches of High-Pressure Hydroelectric Power Stations on the Yenisei; Klaretianum: Krasnoyarsk, Russia, 2001. (In Russian) [Google Scholar]
Figure 1. Study area: (a) Administrative map of the Republic of Khakassia. Hatched area is the most suitable for agriculture plains of Khakass-Minusinsk Depression; administrative districts and state variety-testing stations ( Forests 12 00174 i001 Forests 12 00174 i002 Forests 12 00174 i003) are colored in accordance to agroclimatic classification according to Babushkina et al. [40]: rain fed moderately dry Northern zone (dark shaded area, Forests 12 00174 i001), irrigated dry Central zone (light shaded area, Forests 12 00174 i002); Karatuz variety-testing station outside of Khakassia used as a source of phenological data ( Forests 12 00174 i003). Locations of Minusinsk climatic station ( Forests 12 00174 i004) and dendrochronological sampling sites ( Forests 12 00174 i005) are marked. (b) Climatic diagram at the Minusinsk climatic station: daily series of air temperature (lines) and precipitation (bars) averaged over 1936–2017 (dark shades) and their standard deviations (light shades). (c) Location of the Republic of Khakassia in the South Siberia.
Forests 12 00174 g001
Figure 2. Residual generalized chronologies of larch tree-ring width (TRW), earlywood width (EWW), and latewood width adjusted (LWWadj). Upper plot shows number of trees (individual series) for each year. On the TRW plot, vertical dashed line marks beginning of period with expressed population signal above threshold EPS > 0.85.
Forests 12 00174 g002
Figure 3. Climatic response of larch tree-ring parameters (TRW, EWW, and LWWadj) and crops yield generalized for Northern zone (Y_N) and Central zone (Y_C): correlations with centered 21-day moving series of average temperature (Temp; lines), sum of precipitation (Prec; shaded areas in the left column) from April to August, and of hydrothermal coefficient (HTC; shaded areas in the right column) from May to August. Dashed horizontal lines represent significance level p = 0.05. Rectangles mark periods when climatic factors have maximum correlations with respective yield series.
Forests 12 00174 g003
Figure 4. Dynamics of the climatic response (moving correlation coefficients with 21-day series of temperatures and precipitation, window 40 years, step 1 year) of the larch radial growth parameters and zonal grain crops yield. Significant correlations at p < 0.05 are marked. The average dates of the cereal phenophases marked on the right are given according to the observations of the Karatuz variety-testing station for 2015–2019. Sign of the correlation is marked with color (positive—green, negative—red).
Forests 12 00174 g004
Figure 5. Crops yield modeling. (a) Component of the crops yield climatic response not captured by earlywood-latewood-based models: correlations of 21-day moving climatic series with differences between actual yield chronologies and respective models Y(EWW, LWWadj); rectangles mark periods when climatic factors have maximum correlations with respective yield series. (b) Dynamics of the crops yield in Northern and Central zones and its models based on tree-ring parameters alone (top row), on tree-ring parameters and temperature (middle row), and on tree-ring parameters and both climatic factors (bottom row). (c) Scheme of developed models’ limitation by difference in signals from growing season temperature and precipitation (bubbles with T and P letters, respectively) registered in tree-ring parameters and crops yield. Bubble sizes indicate relative signal strength.
Forests 12 00174 g005
Figure 6. Reconstructed and actual crops yield (transformed in Z-scores): shaded areas represent 5+ year periods when average modeled yield is less then mean—0.5 SD threshold (grey dashed line); dotted and dashed lines represent actual crops yield in Northern and Central zones respectively; black lines represent model Y_N(EWW, LWWadj) and its 5-year smoothed time-series.
Forests 12 00174 g006
Table 1. Statistic characteristics of crops yield and larch tree-ring parameters’ residual chronologies.
VariableSample CharacteristicsChronology Characteristics
Length,
Years
Cover
Period,
Years
No. of
Series 1
Mean
Value 2
Standard
Deviation
(SD)
Mean
Inter-Series
Correlation
Coefficient
Mean
Expressed
Population
Signal
Sensitivity
Coefficient
Yield Northern zoneY_N681945–2012181.2350.4180.6400.9700.532
Yield Central zoneY_C741939–2012151.2960.3390.4850.9340.438
Tree-ring widthTRW3141706–2019460.7350.3040.4520.9740.372
Earlywood widthEWW3141706–2019460.5330.3190.4220.9710.388
Latewood width 3LWW3141706–2019460.1840.3370.2920.9500.403
1 Individual series in yield chronologies are averaged series for administrative districts and data from variety-testing stations within each zone. Individual series in tree-ring chronologies are measurements of trees. 2 Yield values are measured in 103 kg/ha; larch radial growth parameters’ values are measured in mm. 3 LWW chronology statistics are shown before its adjustment.
Table 2. Linear regression models of crops yield zonal chronologies (Northern and Central zones) based on larch tree-ring standardized regional chronologies and climatic factors.
Model Equation 1RR2R2adjFpSE
Northern zone
0.373 + 0.610·TRW0.4310.1860.17415.10.00020.380
−0.072 + 0.455·EWW + 0.592·LWWadj0.4780.2290.2059.60.00020.373
3.771 − 0.196·Tadd + 0.330·EWW + 0.444·LWWadj0.6470.4180.39115.3<0.00010.326
3.315 − 0.175·Tadd + 0.00187·Padd + 0.264·EWW + 0.373·LWWadj0.6720.4510.41612.9<0.00010.319
Central zone
0.652 + 0.326·TRW0.2770.0770.0635.50.02220.337
0.507 + 0.268·EWW + 0.200·LWWadj0.2780.0770.0492.70.07340.339
3.935 − 0.177·Tadd + 0.150·EWW + 0.072·LWWadj0.5530.3060.2749.4<0.00010.296
3.425 − 0.153·Tadd + 0.00257·Padd + 0.048·EWW − 0.033·LWWadj0.6620.3870.34810.0<0.00010.281
1 Periods of additional climatic predictors’ calculation (averaging Tadd and summing Padd) in each zone are presented in Figure 5a.
Publisher’s Note: MDPI stays neutral with regard to jurisdictional claims in published maps and institutional affiliations.

