Article

Condition of Illegally Logged Stands Following High Frequency Legal Logging in Bago Yoma, Myanmar

1
Graduate School of Bioresource and Bioenvironmental Sciences, Kyushu University, 744 Motooka, Fukuoka 819-0395, Japan
2
Forest Research Institute, Yezin, Ministry of Natural Resources and Environmental Conservation, P.O. Box 05282 Nay Pyi Taw, Myanmar
3
Faculty of Agriculture, Kyushu University, 744 Motooka, Fukuoka 819-0395, Japan
4
Faculty of Agriculture, Kagoshima University, Kagoshima 890-8580, Japan
*
Author to whom correspondence should be addressed.
Forests 2021, 12(2), 115; https://doi.org/10.3390/f12020115
Submission received: 8 December 2020 / Revised: 12 January 2021 / Accepted: 19 January 2021 / Published: 21 January 2021
(This article belongs to the Section Forest Ecology and Management)

Abstract

:
The restoration of degraded forests is the focus of global attention. Effective restoration requires information on the condition of degraded forests. This study aimed to understand the conditions of illegally logged stands that had also experienced inappropriately short rotations between legal logging cycles in natural production forests in Myanmar. Four rectangular plots (each 0.64 ha) were established in 2013. The plots included illegally logged stumps in three compartments where the latest legal logging was conducted in 2011 after very short rotations between legal logging cycles (up to five harvests between 1995 and 2011, compared with a recommended 30-year logging cycle). Using data from the field measurements in 2013 on the legal and illegal stumps and living trees, we reconstructed stand structure just before and after legal logging in 2011. Before the legal logging in 2011, there were variations in stand structure and the composition of commercial species among four plots. Illegal logging (14–31 trees ha−1) was much higher than legal logging (0–11 trees ha−1). Illegal logging targeted six to nine species that were suitable for high-quality charcoal from various sized trees, while legal logging targeted one or two timber species with a diameter at breast height (DBH) larger than 58 cm. The number of remaining trees in 2013 ranged from 33 to 181 trees ha−1. There was a negative relationship with the number of bamboo clumps, which varied from 6 to 145 clumps ha−1. Bamboo-dominated stands with a low remaining stock of commercial trees may need active restoration such as bamboo cutting and replanting of commercial species. Bamboo cutting could generate income for the local community.

1. Introduction

Approximately 20% of natural tropical forests are classified as production forests, where selective logging is a common practice for timber production [1]. Tropical production forests supply both timber and non-timber forest products [2,3]. Additionally, there is a growing focus on the conservation values of tropical production forests in terms of various ecosystem services [4,5,6]. However, selectively logged production forests are often degraded because of over-harvesting and/or large disturbances to the remaining trees and the ground [7,8,9]. In degraded forests, understory vegetation such as grasses and bamboos can become dominant, resulting in negative impacts on tree regeneration [10,11]. The restoration of degraded forests has become increasingly important [12,13,14]. As the first step for restoring degraded production forests, it is necessary to identify the different states of degradation, such as the remaining stock and regeneration status of commercial tree species in relation to understory vegetation [12,15,16].
Myanmar has a long history of applying selective logging, called the Myanmar Selection System (MSS), in tropical mixed deciduous forests, where teak (Tectona grandis) and pyinkado (Xylia xylocarpa) are the main high-quality timber species [17]. An important feature of the MSS is the use of elephants to drag logs from the felling sites to log landings (skidding). Khai et al. [18] revealed that elephant skidding contributes the lowest level of ground disturbance compared with using bulldozers for skidding, as is performed outside Myanmar. This long history of low-impact logging using elephants suggests that the MSS could be a good practice for sustainable forestry. However, studies have revealed widespread forest degradation in selectively logged production forests in Myanmar [9,19]. The major reasons for degradation include over-harvesting because of shorter rotation periods than the MSS standard of 30 years and illegal logging that often occurs after legal logging operations [9,17,20]. Khai et al. [17] indicated that there were two types of illegal logging: one for sawn timber production and the other for charcoal making. Illegal logging for timber targeted a small number of large trees, focused on two high-quality timber species, teak and pyinkado [17,20,21]. This type of illegal logging was found in better condition stands in compartments with a longer cycle of legal logging [17]. In contrast, illegal logging for charcoal targeted different sized trees of various species, and this practice was found in a degraded, bamboo-dominated stand in the compartment with inappropriately short cycles of legal logging [17]. Thus, the impacts of illegal logging on remaining tree stocks and species composition may differ between the two types of illegal logging.
This present study aimed to further understand the structure of illegally logged stands in compartments with inappropriately frequent legal logging cycles in Myanmar. Our working hypothesis is that illegal logging in compartments under high frequent legal logging may occur mainly for charcoal making, and bamboo dominance may be related to reduced tree density. While Khai et al. [17] investigated a single sample plot (1 ha) without replication, we conducted field measurements in four plots each measuring 0.64 ha (80 m × 80 m) in compartments with a high frequency of legal logging, where people were illegally settled.

2. Materials and Methods

2.1. Study Site

Our study sites were located in South Zamaye Reserved Forest (RF), Bago Township, in the southeast of Bago Yoma, Myanmar (Figure 1). Bago Yoma has the longest history of timber production using the MSS in the country. There are three seasons each year: “hot” from February to May, “rainy” from June to September, and “dry” from October to January. The mean annual rainfall is 3360 mm with an average humidity of 82.9%, and the mean annual temperature is 26.7 °C in the Bago District. Bago Township covers 2905 km2, of which around 53% is forested. The dominant forest type is a moist upper mixed deciduous forest where teak, pyinkado, and other commercial species can be found along with bamboo species.
South Zamaye RF covers 79,613 ha, including 119 compartments (Figure 1). At the time of our field survey in 2013, official harvesting operations were being practiced in this RF. Among the 119 compartments, 21 were encroached by a total of 336 households in 2013 (Figure 1). To establish the sample plots, we intentionally selected three compartments (29, 46, and 54) where the latest logging operation was conducted in 2011, the frequency of legal logging was higher than the MSS standard 30-year rotation cycle (e.g., logging occurred once in 30 years), and people had encroached and illegally settled (Forest Department, Bago Township, 2013). The Myanmar forest law prohibits the settlement and commercial use of the RF and PPF without permission, while subsistence use is allowed in designated areas [22].
In compartment 29, with an area of 1238 ha, legal logging was practiced in 1999, 2000, 2004, 2009, and 2011; a total of 6053 trees, equal to 11,694.13 m3 of timber, were harvested; and 41 households have been living temporarily in this compartment since 2010–2012 (Forest Department, Bago Township, 2013). In compartment 46, with an area of 429 ha, legal logging was conducted in 1995, 2000, and 2011; a total of 3518 trees, equal to 11,912.89 m3 of timber, were harvested; and 32 households have been resident temporarily since 2011–2012. In compartment 54, covering 741 ha, legal logging was carried out in 1997, 2007, and 2011; a total of 3027 trees, equal to 7455.67 m3, were harvested; and encroachments were found only in 2013 (FD Bago, 2013).

2.2. Legal Logging Operations under the MSS

Under the MSS, logging is operated in compartments, which are basic units that yield approximately equal volumes of timber products in a 30-year felling cycle [9]. Staff of the Myanmar Forest Department (FD) select and mark trees to be cut following the prescribed minimum diameter cut limits (MDCL). Then, felling the marked trees and skidding operations are carried out by Myanmar Timber Enterprise (MTE) or its subcontracting agent, or both, normally from July to December. Forest roads for log transportation are usually constructed at the end of the rainy season, generally after November when the soil hardens. These roads are usable only in the dry season.
The MDCL depends on species; for example, diameter at breast height (DBH) is 78 cm for teak, Dipterocarpus spp., Hopea odorata, Anisoptera scaphula, and Parashorea stellata; 68 cm for pyinkado, Lagerstroemia speciosa, and Lagerstroemia tomentosa; and 58 cm for other hardwood species. Tree species are classified into six commercial species groups: teak and Groups I–V depending on the commercial value. Teak represents the most valuable product; commercial value as timber decreases from Group I through V. Pyinkado, Pentacme siamensis, and Dalbergia oliveri are the representative species of Group I, and Group V has lesser-used species. During selecting and cutting the trees, the FD and MTE staff put hammer marks on the remaining stumps and cut logs to ensure the legality of logging operations. Hammer-marked information on the stump surface includes the tree number, log number from the single tree, and the code of the person in charge. FD has to inspect hammer marks put on the stumps and the logs during harvesting of the marked trees and transporting the logs to ensure the legality of logging operations. After finish logging operations, MTE needs to destroy the logging road constructed during logging operations following the MSS regulation. Then, MTE has to report to FD about the completion of logging operations and leaving the working RF or Compartment. FD has to inspect whether MTE follows the prescribed rules in logging operations as a final check.

2.3. Field Measurements and Data Analysis

Data collection was conducted in December 2013 and January 2014. The four permanent sample plots (80 × 80 m) were set up; one plot each in compartments 29 (Plot 1) and 54 (Plot 4) and two in compartment 46 (Plots 2 and 3) (Figure 1, Table 1). The reason for establishing one more plot in the smallest compartment (46) is because we noticed relatively large variations in stand structure within this compartment. To set up each sample plot, a starting point was selected to include illegally logged stumps or legally logged ones, or both, to represent a production stand. Then, the base line and grid lines were laid down in north to south and east to west directions from this starting point. Each plot was divided into four subplots (40 × 40 m). In each plot, all standing trees ≥ 10 cm DBH were tagged, identified, and their DBH was measured. The following details were recorded for all bamboo clumps: the number of culms per clump (n), and the maximum and minimum culm diameter (Dmax and Dmin). The basal area of the ith bamboo clump (BAi) was calculated as [23]:
BAi = n × Dmax × Dmin × π/40000
All stumps were also measured for their diameter at cut height, and the local name of the species was identified by the aid of FD staff and local people. All recorded trees, stumps, and bamboos with their local name were then confirmed using the checklist of Kress and Lace [24]. Legal stumps were distinguished by judging whether the MSS rules of logging operations were followed or not; for example, if the diameter of the cut trees was larger than the MDCL, stump height was lower than 0.4 m, and the hammer sign was present on the stumps (see the photographs in Supplementary Material Figure S1) [17,20]. The DBHi of ith extracted tree was estimated using the stem shape model [23]:
DBHi = di/(1.028 hi−0.114)
where di and hi are the diameter and height of the ith stump, respectively. We also distinguished old stumps that were legally or illegally cut before 2011 from new stumps that were cut legally in 2011. It was not difficult with help from local people and FD staff to distinguish old and new stumps based on their texture and condition [20]. For data analysis, we only used stumps that were legally cut in 2011 and that were illegally cut from 2011 to 2013.
Using data from the field measurements in 2013 on the legal and illegal stumps and living trees, we reconstructed the stand structure just before and after official logging in 2011. For this, we did not consider the DBH increment when we reconstructed the DBH in 2011 from DBH measurements in 2013 because of limited information on the diameter increment of each species.
Studies have shown that illegal logging often targets the larger trees of specific commercial species [20,25]. To examine such effects, we applied a generalized linear model (GLM) with a binomial distribution and a logit link function. The dependent variable was whether the tree was standing (0) or had been cut illegally, and the independent variables were DBH (cm), quality for timber, and quality for charcoal (1 (best), 2, 3, 4 (worst)). The grading of the quality for timber and charcoal was conducted in consultation with local people and local FD staff (see the grading definition and species list in Supplementary Material Table S1). We also applied a GLM with a Poisson distribution and a log link function to confirm whether the number of trees was related to the number of bamboo clumps in the remaining stands. For this, we tested two levels of data: one for the plot level (n = 4, each 0.64 ha) and the other for the subplot level (n = 16, each 0.16 ha). In the Poisson GLM, we used tree counts in the surveyed area (0.64 or 0.16 ha) as the response variable, bamboo clump density (clumps ha−1) as the explanatory variable, and log of the surveyed area as the offset. All statistical analyses were conducted using the R environment [26].

3. Results

3.1. Stand Structure Prior to the Latest Legal Logging in 2011

Stand structure prior to the latest legal logging, which was conducted in 2011, was different among the four plots (Table 1). Stocks ranged from 54 to 212 trees ha−1 for tree density and from 15.3 to 19.4 m2 ha−1 for tree basal area. Species richness varied from 16 to 23 species 0.64 ha−1.
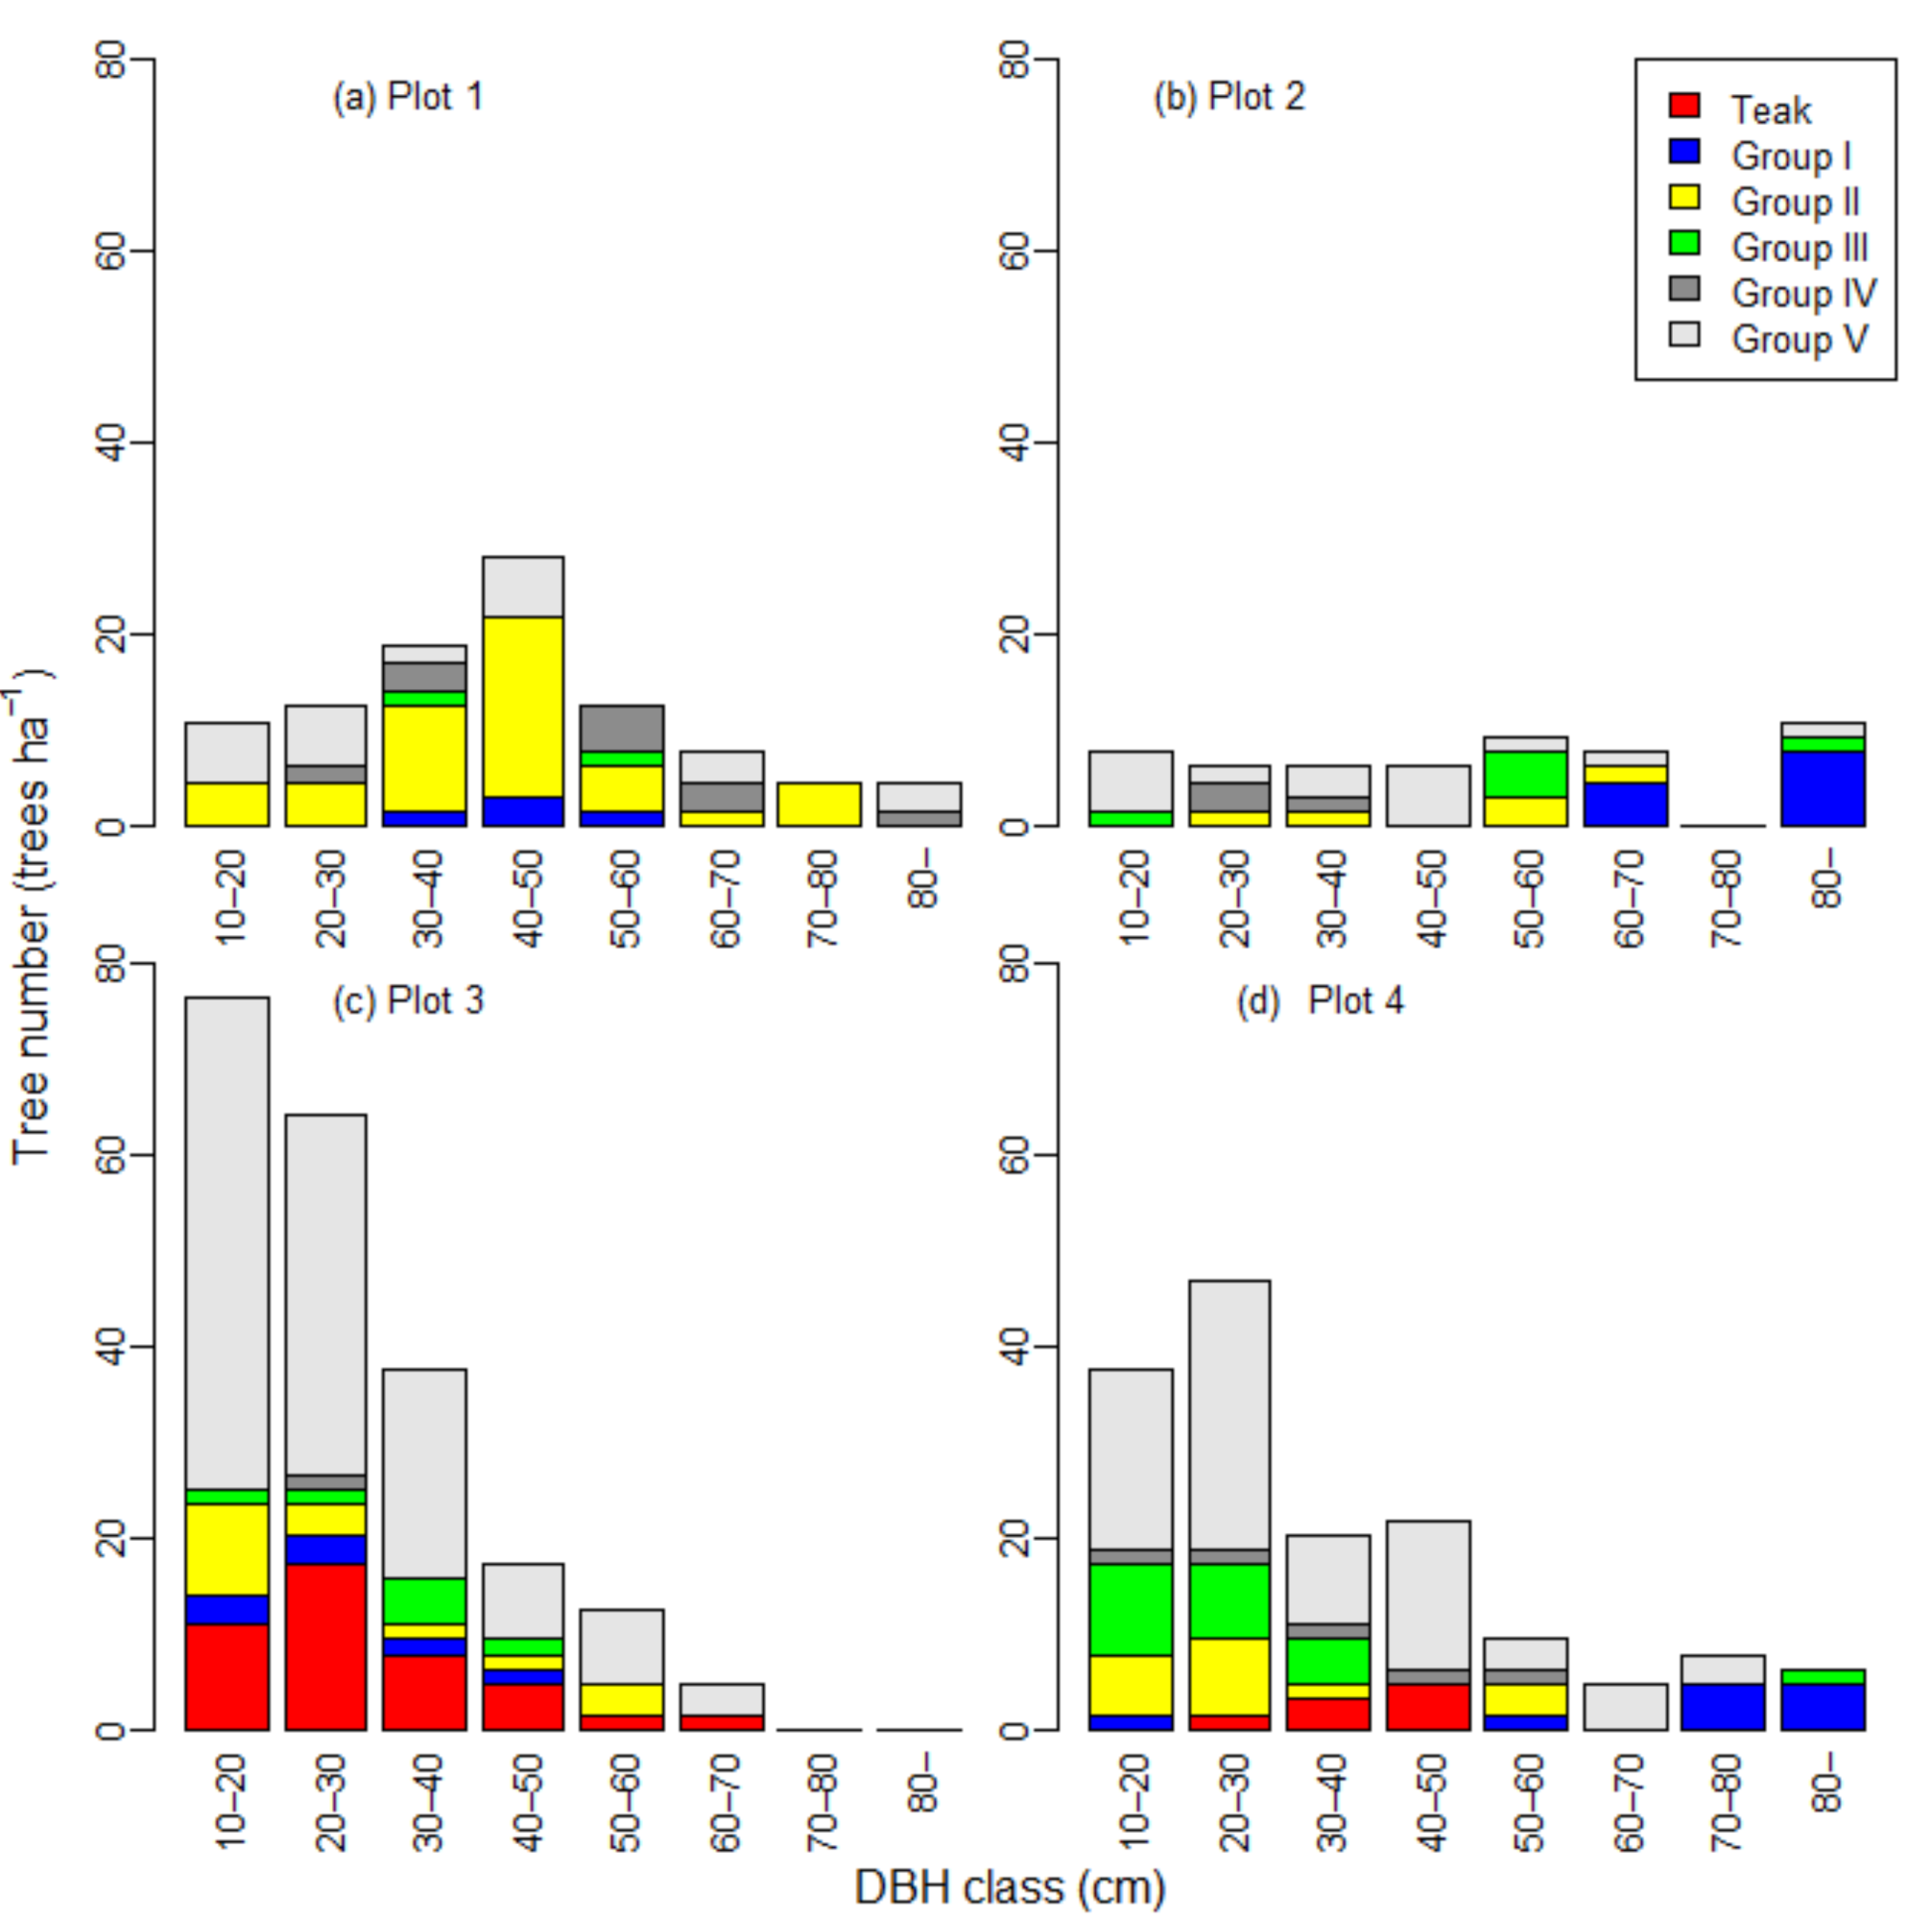
The DBH distribution was also different among the four plots: an inverse-J shape for plots 3 and 4, a single peak for plot 1, and uniform in plot 2 (Figure 2). The composition of the commercial species groups also varied. The relative dominance in tree numbers, except for Group V, was found to be teak for plot 3, Group I for plot 2, Group II for plot 1, and Group III for plot 4 (Table 2, Figure 2).

3.2. Legally and Illegally Cut Trees

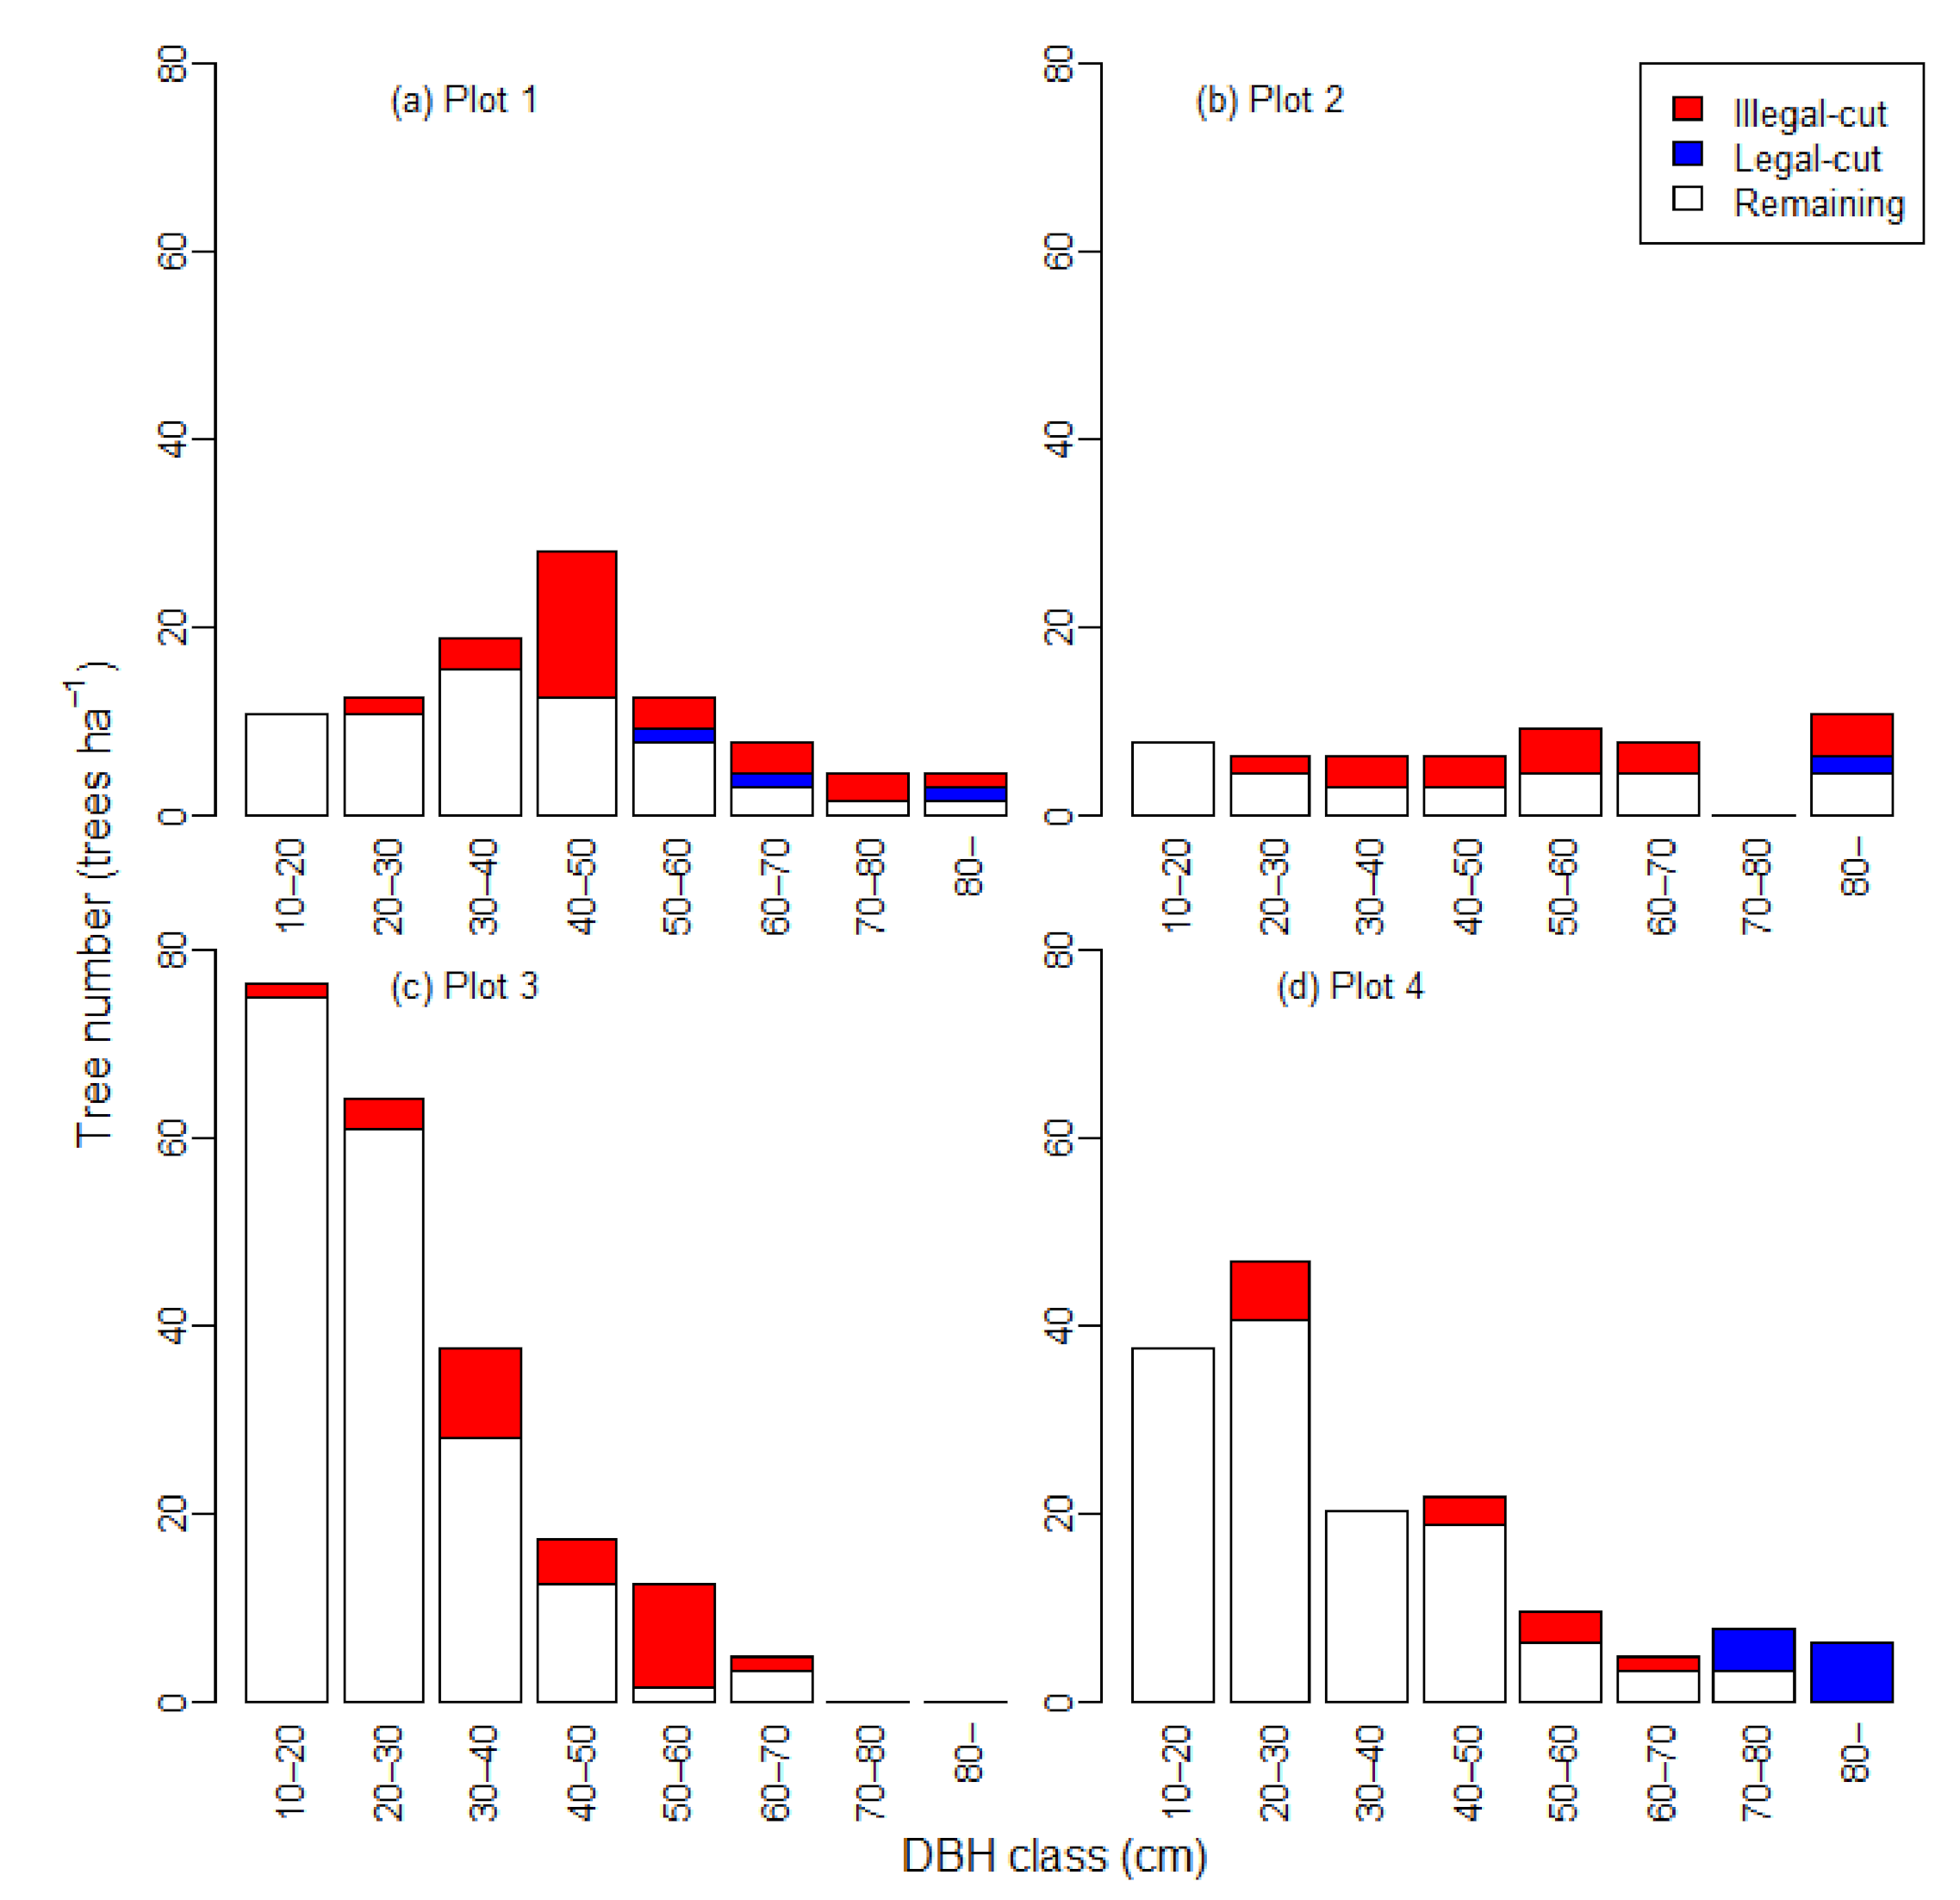
For legal cutting, felling intensities were from 1.6 to 10.9 trees ha−1 in three of the plots; in plot 3, no legally cut stumps were found (Table 1). The species of the cut trees were Xylia xylocarpa (Group 1) in plots 2 and 4, Garuga pinnata (Group 4) in plot 1, and Terminalia tomentosa (Group 3) in plot 4 (Table 1 and Table 2). The average DBH was from 69.9 to 103.0 cm (Table 1, Figure 2).
For illegal cutting, the number of cut trees ranged from 14.1 to 31.3 trees ha−1 (Table 1), and the mean DBH varied from 38.5 to 59.2 cm among the four plots. The number of illegally cut tree species varied from 6 to 9 in the 0.64-ha plots (Table 1). These were classified into various species groups (Table 2).
The GLM model for illegal logging indicated that the likelihood of illegal logging was higher for larger trees and species of higher quality for charcoal making (Table 3). In contrast, the quality for timber was not selected as an explanatory variable in the model.

3.3. The Remaining Stands in 2013

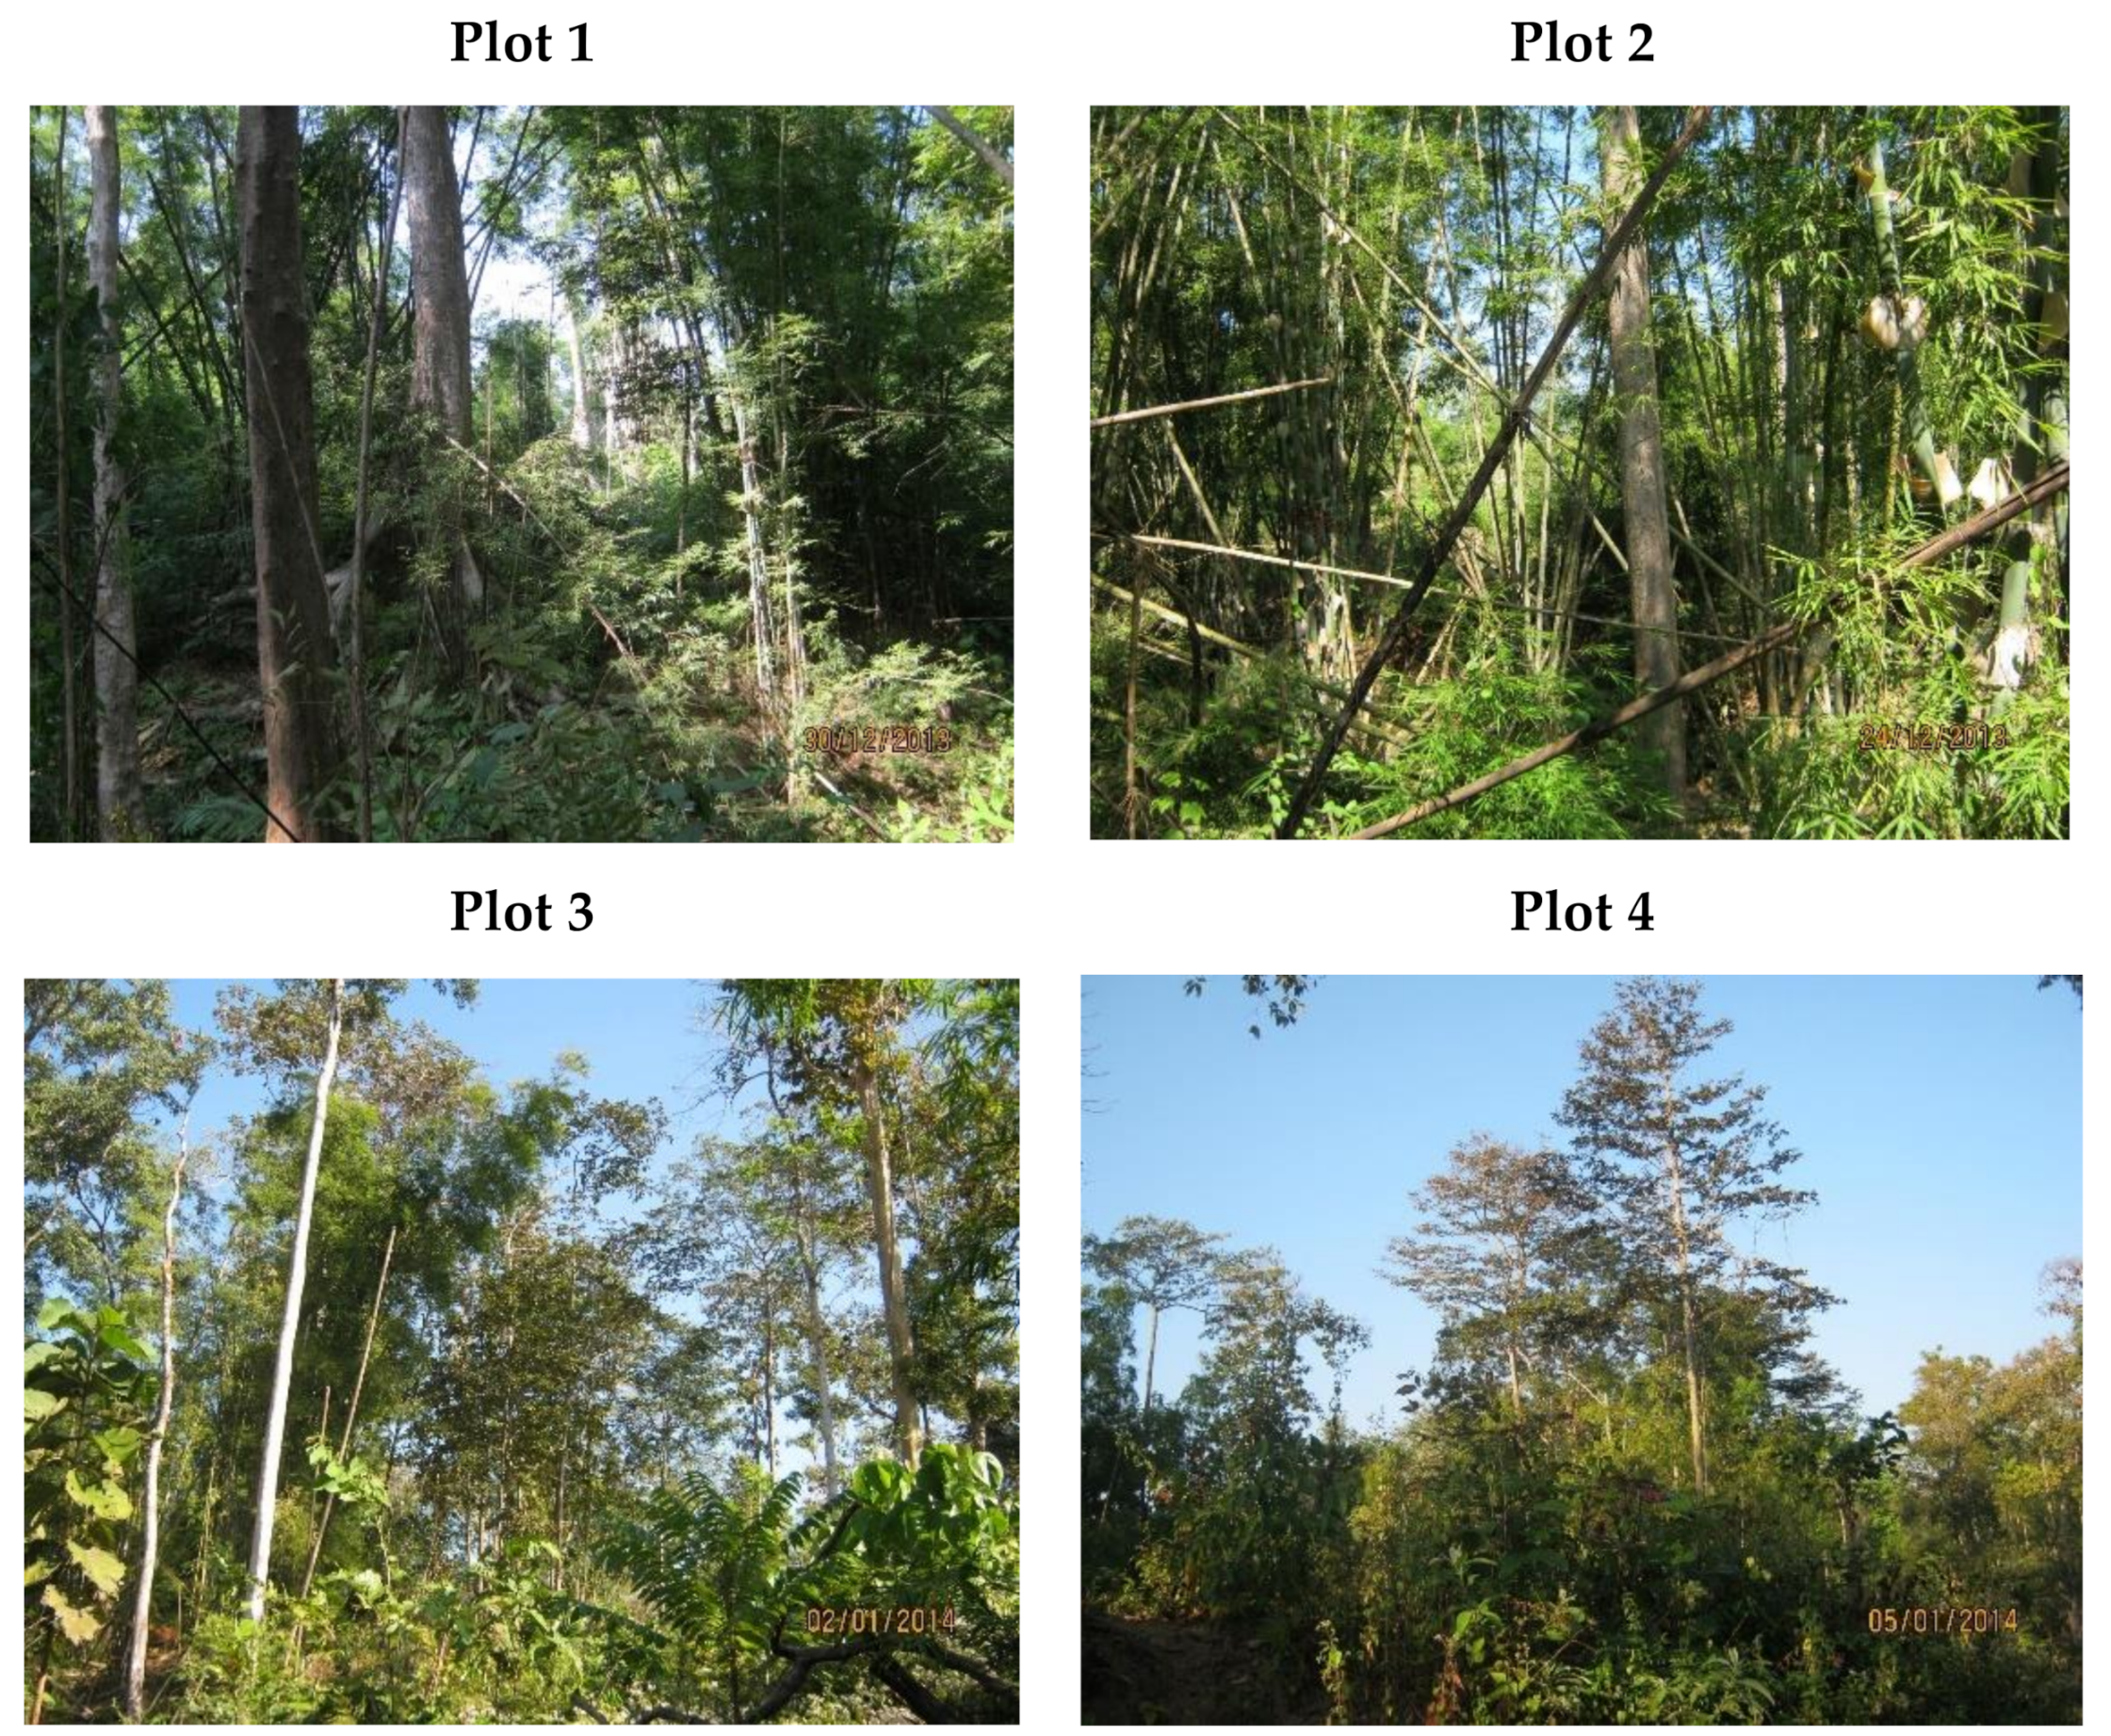
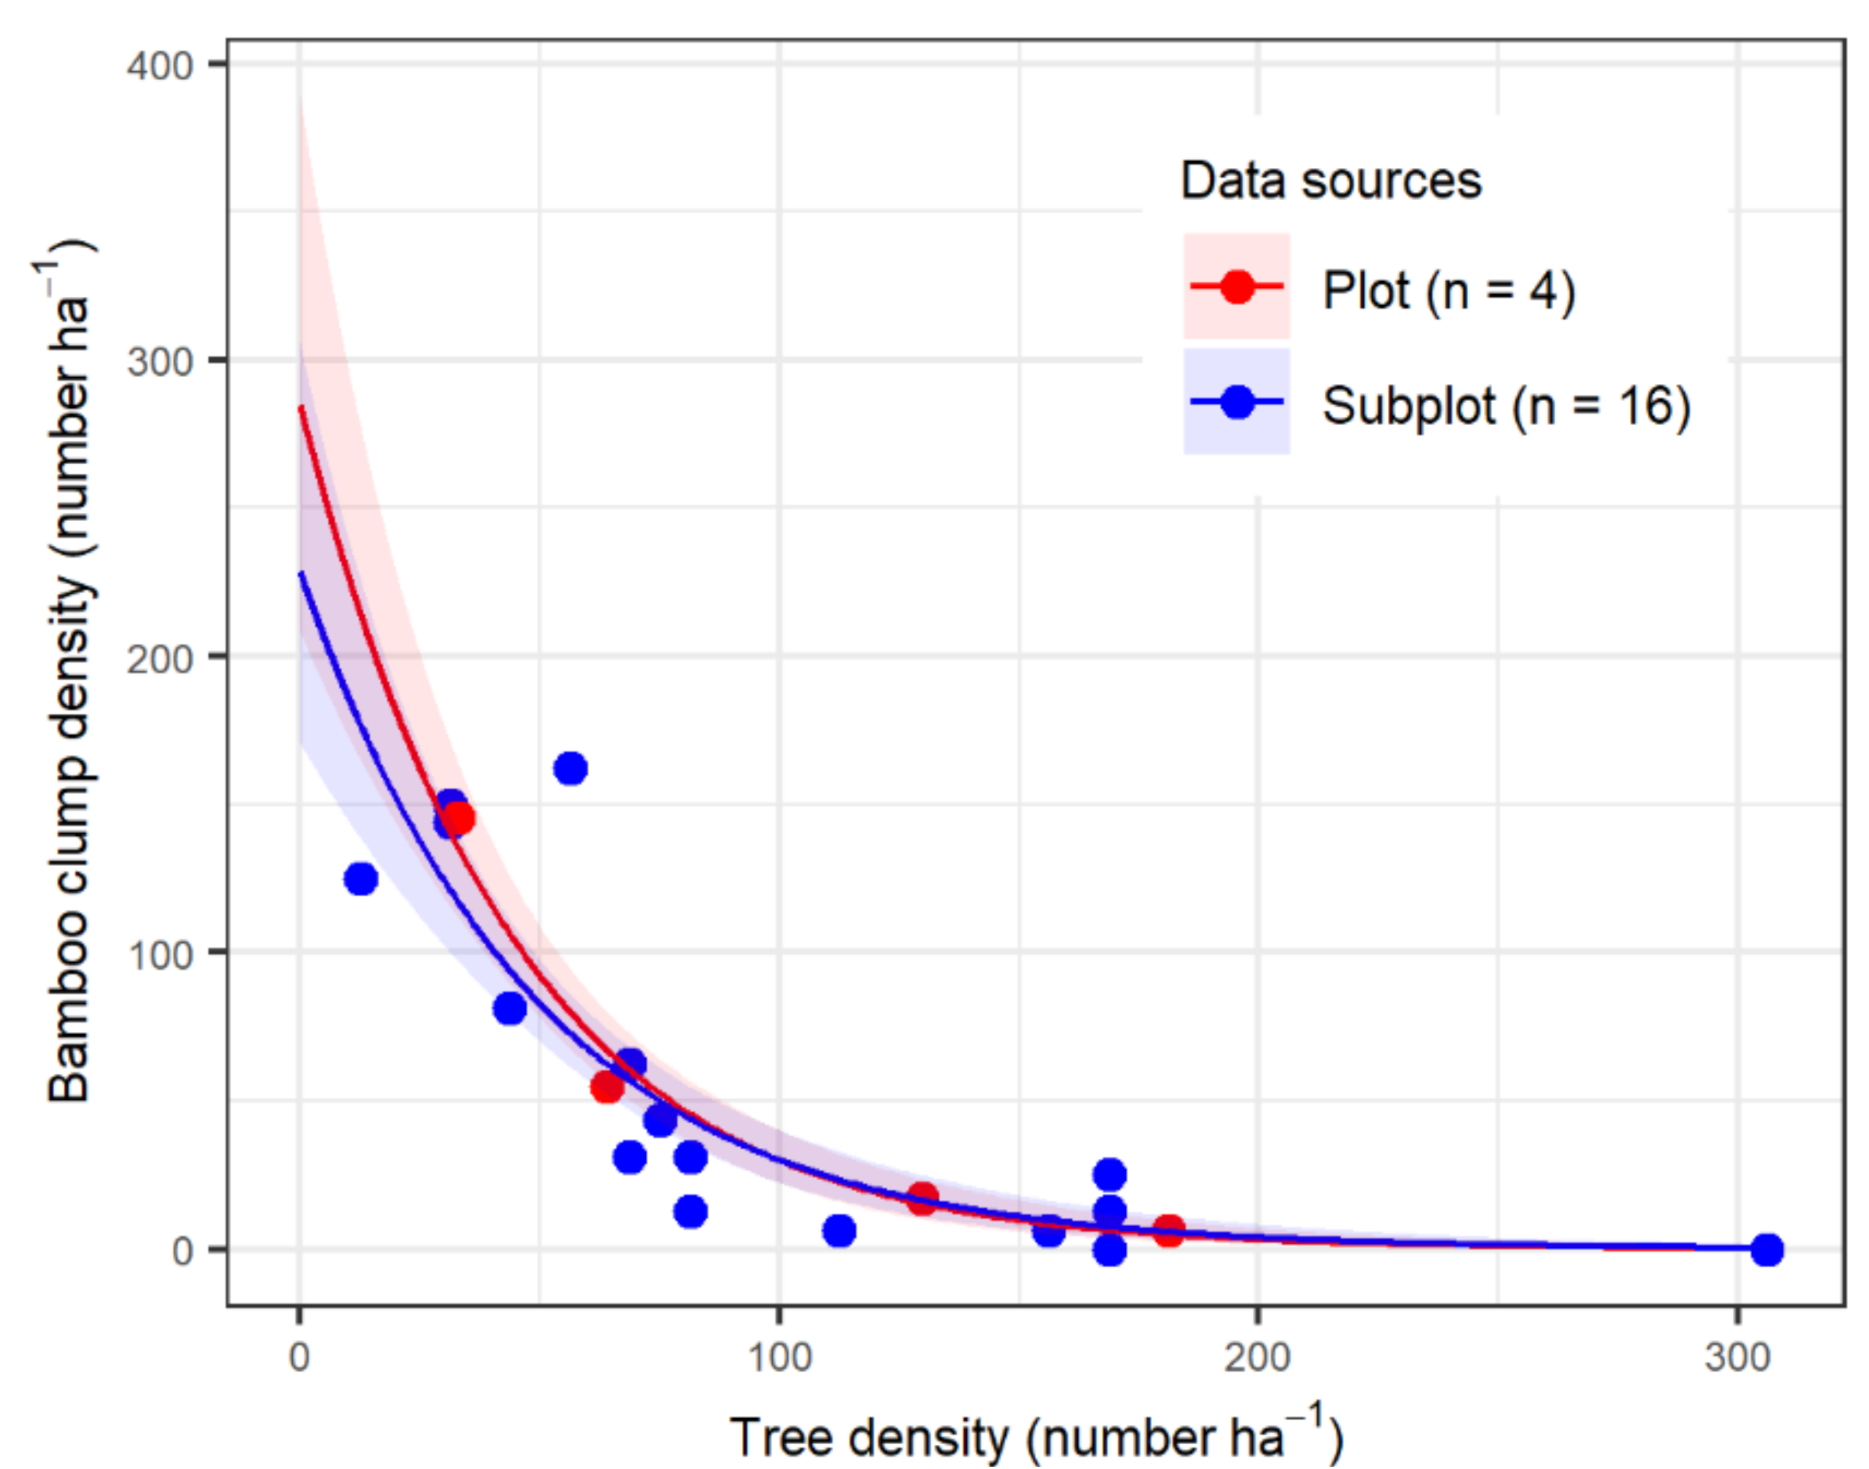
The structure of the remaining stands after legal and illegal cutting differed among four plots (Figure 3). Tree density ranged from 32.8 to 181.3 trees ha−1 and the BA for trees varied from 7.6 to 11.4 m2 ha−1 (Table 1). Bamboo clump density was also very different among the four plots (Figure 4), ranging from 6.3 to 145.3 clumps ha−1 (Table 1). A significant negative relationship was found between tree density and bamboo clump density both at the plot (n = 4) and subplot (n = 16) levels (Figure 5, Supplementary Material Table S2).

4. Discussion

4.1. Stand Structure before the Latest Legal Logging

Logging frequency is one of the most important parameters in yield regulation during selective logging in tropical natural forests. The MSS has a standard of a 30-year cutting cycle and the annual allowable cut is determined based on the assumption that the stocking of commercial trees has recovered 30 years after logging. Unfortunately, shorter cutting cycles were adopted because of the high demand for timber production in Myanmar, especially between 1990 and 2000 [9,17]. Khai et al. [17] revealed that a higher frequency of legal logging (five times in the last 18 years) can substantially reduce stocking; only 41 trees ha−1 and 8.25 m2 ha−1 of BA remained prior to the latest legal logging. In contrast, this present study indicates that a compartment with a higher frequency of legal logging does not necessarily result in much lower levels of stocks. Rather, stocks (tree density and BA) in our plots were relatively similar to those in stands where no legal logging operations had occurred for several years [17,21]. These results call for a larger scale of forest inventory with systematic sampling in compartments to generalize the effects of logging frequency on stand structure. Win et al. [19] used data from 327 plots under systematic sampling with 2 km grids covering 139,360 ha in Bago Yoma, Myanmar, but their analysis focused on stand structure at the RF scale, but not at the compartment scale.

4.2. Legal and Illegal Logging

We found the amount of illegal logging during the 2 years after legal logging was much larger than legal logging (Figure 3). This result was consistent with that from Win et al. [20], who indicated that the number and BA of stumps resulting from illegal logging were 9.93- and 3.89-fold greater, respectively, than those of legal logging. The logistic GLM of this study indicated that illegal logging was targeted at species of higher quality for charcoal but not higher quality for timber. This is in contrast to Win et al. [20] and Khai et al. [17,21] who indicated that more illegal logging occurred for high-quality timber species such as teak and pyinkado. Our study plots were within compartments where people had settled illegally, and Saung et al. [27] indicated that such encroachers mostly engaged in charcoal making to generate income (see the photos 3 and 6 in the Supplementary Material S1). Our GLM result on the preference for charcoal species for illegal logging is compatible with the survey results on charcoal making as a livelihood strategy [27]. Moreover, we found charcoal kilns near the plots. Therefore, we can state that the illegally logged trees in our study sites were used mainly for charcoal making, which was conducted by encroachers. Illegal logging for timber focused mainly on a few very high-quality timber species, while our study revealed that illegal logging for charcoal targeted six to eight species in each plot and the amount of illegal logging is likely larger for charcoal making than for timber production [17,21]. Thus, illegal logging for charcoal making may be more destructive than that for timber production.

4.3. Stand Structure after Legal and Illegal Logging, and Management Implications

After legal and illegal logging, tree density and basal area were substantially reduced to 102 ± 57.6 trees ha−1 and 9.7 ± 1.4 m2 ha−1 in mean ± SD (Table 1), although they were higher than in the study plot of Khai et al. [17] where the values were only 20 trees ha−1 and 4.39 m2 ha−1 for BA. These stocks are much lower than those in pre-logging conditions in the production forests in Myanmar (193 ± 58.9 and 16.85 ± 3.0 m2 ha−1) [18], as well as in Central Africa (578 ± 42.4 tree ha−1, 32.6 ± 3.9 m2 ha−1) [28] and in Indonesia (530 ± 71.6 tree ha−1, 31.5 ± 4.2 m2 ha−1) [29]. These values are also lower than those reported for logged-over forests in other tropical regions; 25.2 m2 ha−1 in East Kalimantan [30], 26.0 ± 6.4 and 24.1 ± 7.1 m2 ha−1 in Sarawak, Malaysia [31], and 20.3 and 25.9 m2 ha−1 in the Brazilian Amazon [32]. Species that had a high quality for timber but a low quality for charcoal, such as teak in plots 3 and 4 (Table 2, Figure 2), were almost untouched by illegal logging. Such stands may have future potential for timber production if illegal logging does not occur for a long time. However, species richness in our plots (18.3 ± 3.8 per 0.64-ha) may be smaller than that in pre-harvest stands in Myanmar (42.6 ± 6.7 per 1.0-ha) [18], even though we cannot directly compare them due to differences in plot size.
Among the four plots, there was a wide range of tree density and bamboo clump density. Our Poisson GLM model showed that there were negative relationships between tree density and bamboo clump density at the plot and subplot levels (Figure 5). This indicates that the lower the tree density, the higher the bamboo density. Studies show that bamboo dominance can reduce tree regeneration [10,11] and control forest succession [33]. In plot 2, which was the worst case in this study, tree density was only 32.8 trees ha−1, while bamboo clump density was 145.3 clumps ha−1. Such bamboo-dominated degraded forests may need active restoration such as assisted regeneration of commercial trees and bamboo cutting [14,34]. To limit pioneer invasion and favor commercial species regeneration, it is necessary to limit logging intensity to an acceptable threshold, and 8 trees ha−1 of felling intensity or a 15% basal area reduction rate was recommended for a dipterocarp forest in Indonesia [35]. In our present study, we cannot propose such a threshold due to lack of data on tree regeneration, but we can suggest that tree density should be maintained to at least 70 to 80 trees ha−1 because bamboo density sharply increased when tree density became less than these values (Figure 5).
When we consider restoration strategies in degraded forests in RFs, forest resource use by local people for their income should be taken into account, although the Myanmar forest law prohibits local households from harvesting forest products from RFs for commercial use without permission. Saung et al. [27] revealed that many households living adjacent to RFs engage in illegal bamboo cutting to generate income. Thus, it may be an option to provide a legal right for local households to use bamboo resources sustainably, coupled with a strategy for restoring bamboo-dominated forests. In contrast, most of the encroachers in RFs were illegally engaged in charcoal making [27] and this present study has indicated that this illegal activity is a major factor of forest degradation. Because there is still an increasing demand for charcoal in rural areas in Myanmar [36], the establishment of a sustainable charcoal production system should be targeted through community forestry programs.

5. Conclusions

We found that compartments with a high frequency of legal logging did not necessarily show a heavily degraded condition. Rather, there was variation in terms of tree density and BA. A larger scale of forest inventory with systematic sampling is needed to generalize the effects of logging frequency on stand structure. In contrast, we confirmed that illegal logging following legal logging resulted in a substantial reduction in tree stocks. Illegally logged trees were used mainly for charcoal making by people who had settled illegally in the production forests. We also found that stands with lower tree density had higher bamboo density. Bamboo-dominated degraded forests need active restoration such as bamboo cutting and enrichment planting of commercial tree species. Legal participation from forest-dependent households may be effective both for the restoration of degraded forests and for the improvement of livelihoods.

Supplementary Materials

Supplementary materials related to this article are available online at https://www.mdpi.com/1999-4907/12/2/115/s1, Figure S1: Photographs of legal-and illegal-cut stumps and charcoal making, Table S1: Data for the trees and bamboo culms in each plot and subplot, Table S2:The result of the Poisson GLM for bamboo clump counts (number per the surveyed area) with log of surveyed area (ha) as the offset, in relation to tree density (number ha−1) for data from the plots (n = 4, each surveyed area = 0.64 ha) and subplots (n = 16, each surveyed area = 0.16 ha).

Author Contributions

T.S., N.M. and T.O. performed the analysis and wrote the manuscript. T.C.K. and T.K. supervised and provided comments and suggestions for the research and reviewed the manuscript. All authors have read and agreed to the published version of the manuscript.

Funding

This study was funded by JSPS KAKENHI (grant number JP23405029, JP17H01477, and JP19H04339) and a Grant for Environmental Research Projects from the Sumitomo Foundation.

Data Availability Statement

The data presented in this study can be available on request from the corresponding author.

Acknowledgments

The author (T.S.) was financially supported by the Japan Human Resource Development Scholarship. We thank the Forest Department of Myanmar, particularly the Bago Township Forest Department, for their support and arrangement of our field work.

Conflicts of Interest

The authors declare no conflict of interest.

References

  1. Blaser, J.; Sarre, A.; Poore, D.; Johnson, S. Status of tropical management. ITTO Tech. Ser. Yokahama Jpn. 2011, 38, 460. [Google Scholar]
  2. Guariguata, M.R.; García-Fernández, C.; Sheil, D.; Nasi, R.; Herrero-Jáuregui, C.; Cronkleton, P.; Ingram, V. Compatibility of timber and non-timber forest product management in natural tropical forests: Perspectives, challenges, and opportunities. For. Ecol. Manag. 2010, 259, 237–245. [Google Scholar] [CrossRef] [Green Version]
  3. Rist, L.; Shanley, P.; Sunderland, T.; Sheil, D.; Ndoye, O.; Liswanti, N.; Tieguhong, J. The impacts of selective logging on non-timber forest products of livelihood importance. For. Ecol. Manag. 2012, 268, 57–69. [Google Scholar] [CrossRef]
  4. Edwards, D.P.; Tobias, J.A.; Sheil, D.; Meijaard, E.; Laurance, W.F. Maintaining ecosystem function and services in logged tropical forests. Trends Ecol. Evol. 2014, 29, 511–520. [Google Scholar] [CrossRef] [Green Version]
  5. Putz, F.E.; Zuidema, P.A.; Synnott, T.; Peña-Claros, M.; Pinard, M.A.; Sheil, D.; Vanclay, J.K.; Sist, P.; Gourlet-Fleury, S.; Griscom, B.; et al. Sustaining conservation values in selectively logged tropical forests: The attained and the attainable. Conserv. Lett. 2012, 5, 296–303. [Google Scholar] [CrossRef] [Green Version]
  6. Berry, N.J.; Phillips, O.L.; Lewis, S.L.; Hill, J.K.; Edwards, D.P.; Tawatao, N.B. The high value of logged tropical forests: Lessons from northern Borneo. Biodivers Conserv. 2010, 19, 985–997. [Google Scholar] [CrossRef]
  7. Asner, G.P.; Broadbent, E.N.; Oliveira, P.J.C.; Keller, M.; Knapp, D.E.; Silva, J.N.M. Condition and fate of logged forests in the Brazilian Amazon. Proc. Natl. Acad. Sci. USA 2006, 103, 12947–12950. [Google Scholar] [CrossRef] [Green Version]
  8. Pereira, R.; Zweede, J.; Asner, G.P.; Keller, M. Forest canopy damage and recovery in reduced-impact and conventional selective logging in eastern Para, Brazil. For. Ecol. Manag. 2002, 168, 77–89. [Google Scholar] [CrossRef]
  9. Mon, M.S.; Mizoue, N.; Htun, N.Z.; Kajisa, T.; Yoshida, S. Factors affecting deforestation and forest degradation in selectively logged production forest: A case study in Myanmar. For. Ecol. Manag. 2012, 267, 190–198. [Google Scholar] [CrossRef]
  10. Panadda, L.; Moe, S.R.; Totland, Ø. Bamboo dominance reduces tree regeneration in a disturbed tropical forest. Oecologia 2011, 165, 161–168. [Google Scholar] [CrossRef]
  11. Larpkern, P.; Moe, S.R.; Totland, Ø. The effects of environmental variables and human disturbance on woody species richness and diversity in a bamboo-deciduous forest in northeastern Thailand. Ecol. Res. 2009, 24, 147–156. [Google Scholar] [CrossRef]
  12. Chazdon, R.L. Beyond deforestation: Restoring forests and ecosystem services on degraded lands. Science 2008, 320, 1458–1460. [Google Scholar] [CrossRef] [PubMed] [Green Version]
  13. Lamb, D.; Erskine, P.D.; Parrotta, J.A. Restoration of degraded tropical forest landscapes. Science 2005, 310, 1628–1632. [Google Scholar] [CrossRef] [PubMed] [Green Version]
  14. Philipson, C.; Cutler, M.; Brodrick, P.G.; Asner, G.P.; Boyd, D.S.; Costa, P.M.; Fiddes, J.; Foody, G.M.; van der Heijden, G.M.F.; Ledo, A.; et al. Active restoration accelerates the carbon recovery of human modified-tropical forests. Science 2020, 369, 838–841. [Google Scholar] [CrossRef] [PubMed]
  15. Tálamo, A.; Lopez de Casenave, J.; Garibaldi, L.A.; Núñez-Regueiro, M. Direct and indirect relationships between logging intensity and regeneration of two timber species in the Dry Chaco of Argentina. For. Ecol. Manag. 2020, 474, 118343. [Google Scholar] [CrossRef]
  16. Fadrique, B.; Santos-Andrade, P.; Farfan-Rios, W.; Salinas, N.; Silman, M.; Feeley, K.J. Reduced tree density and basal area in Andean forests are associated with bamboo dominance. For. Ecol. Manag. 2021, 480, 118648. [Google Scholar] [CrossRef]
  17. Khai, T.C.; Mizoue, N.; Kajisa, T.; Ota, T.; Yoshida, S. Stand structure, composition and illegal logging in selectively logged production forests of Myanmar: Comparison of two compartments subject to different cutting frequency. Glob. Ecol. Conserv. 2016, 7, 132–140. [Google Scholar] [CrossRef] [Green Version]
  18. Khai, T.C.; Mizoue, N.; Ota, T. Harvesting intensity and disturbance to residual trees and ground under Myanmar selection system; comparison of four sites. Glob. Ecol. Conserv. 2020, 24, e01214. [Google Scholar] [CrossRef]
  19. Win, Z.C.; Mizoue, N.; Ota, T.; Kajisa, T.; Yoshida, S.; Oo, T.N.; Ma, H. Evaluating the Condition of Selectively Logged Production Forests in Myanmar: An Analysis Using Large-scale Forest Inventory Data for Yedashe Township. J. For. Plan 2018, 23, 1–8. [Google Scholar] [CrossRef]
  20. Win, Z.C.; Mizoue, N.; Ota, T.; Wang, G.; Innes, J.L.; Kajisa, T.; Yoshida, S. Spatial and temporal patterns of illegal logging in selectively logged production forest: A case study in Yedashe, Myanmar. J. For. Plan 2018, 23, 15–25. [Google Scholar] [CrossRef]
  21. Khai, T.C.; Mizoue, N.; Ota, T. Post-harvest stand dynamics over five years in selectively logged production forests in Bago, Myanmar. Forests 2020, 11, 195. [Google Scholar] [CrossRef] [Green Version]
  22. Forest Department. Forest Law in Myanmar; Forest Department, The State Law and Order Restoration Council: Naypyitaw, Myanmar, 1992. [Google Scholar]
  23. Thein, H.M.; Kanzaki, M.; Fukushima, M.; Yazar, M. Structure and Composition of a Teak-bearing Forest under the Myanmar Selection System: Impacts of Logging and Bamboo Flowering. Southeast Asian Stud. 2007, 45, 297–302. [Google Scholar]
  24. Kress, W.; Lace, J. A Checklist of the Trees, Shrubs, Herbs, and Climber of Myanmar; Department of Systematic Biology-Botany, National Museum of Natural History: Washington, DC, USA, 2003. [Google Scholar]
  25. Toyama, H.; Kajisa, T.; Tagane, S.; Mase, K.; Chhang, P.; Samreth, V.; Ma, V.; Sokh, H.; Ichihashi, R.; Onoda, Y.; et al. Effects of Logging and Recruitment on Community Phylogenetic Structure in 32 Permanent Forest Plots of Kampong Thom, Cambodia. Philos. Trans. R. Soc. B Biol. Sci. 2015, 370, 1–13. [Google Scholar] [CrossRef] [Green Version]
  26. R Core Team. A Language and Environment for Statistical Computing; R Foundation for Statistical Computing: Vienna, Austria, 2019; Available online: https://www.R-project.org/ (accessed on 20 January 2021).
  27. Saung, T.; Mizoue, N.; Ota, T.; Kajisa, T. Differences in forest use strategies and forest income dependency between households living outside and inside selectively logged production forests in Myanmar. Forests 2020, 11, 1263. [Google Scholar] [CrossRef]
  28. Gourlet-Fleury, S.; Mortier, F.; Fayolle, A.; Baya, F.; Ouédraogo, D.; Bénédet, F.; Picard, N. Tropical forest recovery from logging: A 24 year silvicultural experiment from Central Africa. Philos. Trans. R. Soc. B Biol. Sci. 2013, 368. [Google Scholar] [CrossRef] [Green Version]
  29. Sist, P.; Nolan, T.; Bertault, J.G.; Dykstra, D. Harvesting intensity versus sustainability in Indonesia. For. Ecol. Manag. 1998, 108, 251–260. [Google Scholar] [CrossRef]
  30. Fadilah, D.; Tyrie, G.; Yasman, I. Financial and ecological analysis of management options for logged-over Dipterocarp forests in Indonesian Borneo. For. Ecol. Manag. 2003, 183, 1–29. [Google Scholar] [CrossRef]
  31. Kammesheidt, L.; Ago, A.; Schwarzwa, W. Growth patterns of dipterocarps in treated and untreated plots. For. Ecol. Manag 2003, 174, 437–445. [Google Scholar] [CrossRef]
  32. Silva, J.N.M.; De Carvalhoa, J.O.P.; Lopes, J.C.A.; De Almeida, B.F.; Costa, D.H.M. Growth and yield of a tropical rain forest in the Brazilian Amazon 13 years after logging. For. Ecol. Manag. 1995, 71, 267–274. [Google Scholar] [CrossRef] [Green Version]
  33. Griscom, B.W.; Ashton, P.M.S. Bamboo control of forest succession: Guadua sarcocarpa in Southeastern Peru. For. Ecol. Manag. 2003, 175, 445–454. [Google Scholar] [CrossRef]
  34. Campanello, P.I.; Villagra, M.; Garibaldi, J.F.; Ritter, L.J.; Araujo, J.J.; Goldstein, G. Liana abundance, tree crown infestation, and tree regeneration ten years after liana cutting in a subtropical forest. For. Ecol. Manag. 2012, 284, 213–221. [Google Scholar] [CrossRef]
  35. Sist, P.; Nguyen-the, N. Logging damage and the subsequent dynamics of a dipterocarp forest in East Kalimantan (1990–1996). For. Ecol. Manag. 2002, 165, 85–103. [Google Scholar] [CrossRef]
  36. Win, Z.C.; Mizoue, N.; Ota, T.; Kajisa, T.; Yoshida, S. Consumption rates and use patterns of firewood and charcoal in urban and rural communities in Yedashe Township, Myanmar. Forests 2018, 9, 429. [Google Scholar] [CrossRef] [Green Version]
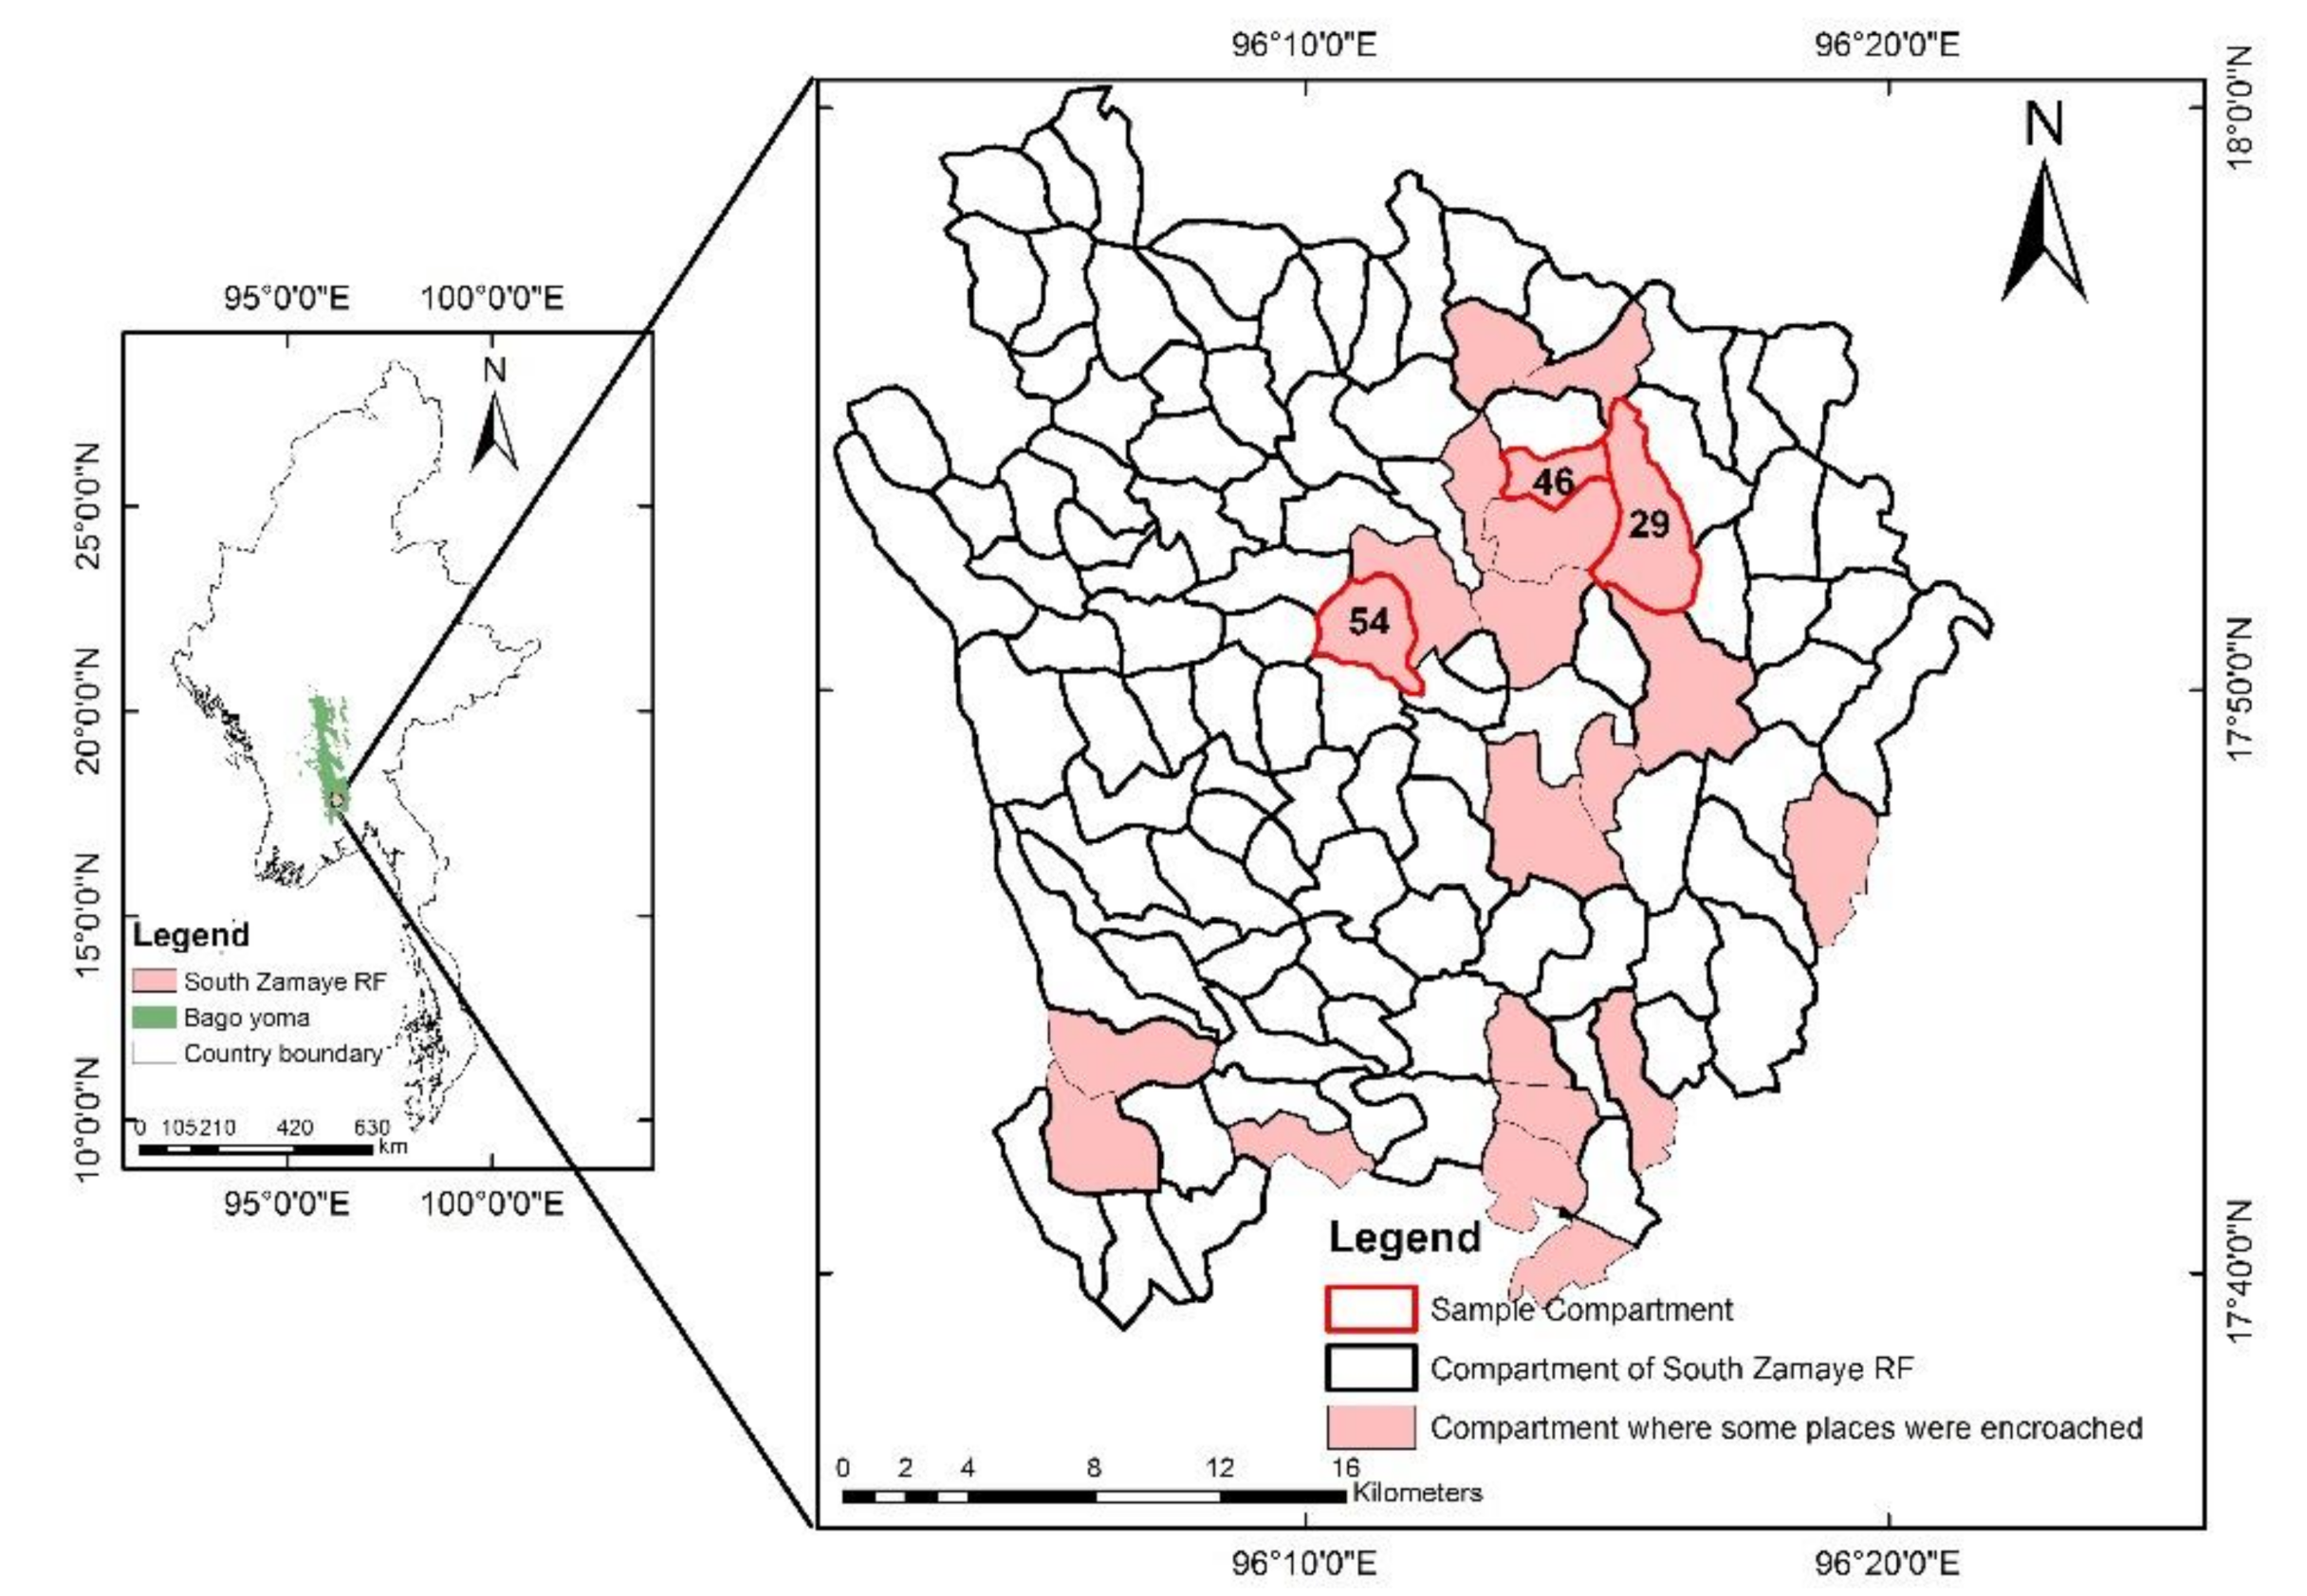
Figure 1. Location of study sites in South Zamaye Reserved Forest (RF), Bago Township, Myanmar.
Forests 12 00115 g001
Figure 2. Diameter at breast height (DBH) distribution prior to the latest legal logging for commercial species groups in the four plots for plots 1 to 4 (ad).
Forests 12 00115 g002
Figure 3. Diameter at breast height (DBH) distribution prior to the latest legal logging in 2011 and the classification after the legal logging up 2013 for plots 1 to 4 (ad).
Forests 12 00115 g003
Figure 4. Photographs of the four plots in December 2013 and January 2014.
Forests 12 00115 g004
Figure 5. Relationships between tree density and bamboo clump density at the plot (n = 4) and subplot (n = 16) levels with prediction lines obtained from the Poisson generalized linear model (GLM) assuming that the area is 1 ha.
Forests 12 00115 g005
Table 1. Stand structure before and after the latest legal logging in 2011, and legally and illegally cut trees in four plots.
AttributesPlot 1Plot 2Plot 3Plot 4
Stand structure prior to the latest official logging in 2011
Tree density (trees ha−1)100.054.7212.5154.7
Mean tree DBH (cm)43.852.027.334.5
Tree BA (m2 ha−1)18.115.515.319.4
Tree species richness (counts 0.64-ha−1)16192223
Legal cut trees in 2011
Cut-tree number (trees ha−1)4.71.60.010.9
Mean cut tree DBH (cm)69.9103.00.083.9
Cut-tree BA (m2 ha−1)1.91.30.06.1
Cut-tree species number (counts 0.64-ha−1)1102
Illegal cut trees from 2011 to 2013
Cut-tree number (trees ha−1)31.320.331.314.1
Mean cut tree DBH (cm)50.459.244.138.5
Cut-tree BA (m2 ha−1)6.76.65.11.9
Cut-tree species number (counts 0.64-ha−1)7976
Stand structure of remaining stands in 2013
Tree density (trees ha−1)64.132.8181.3129.7
Mean tree DBH (cm)38.645.124.429.9
Tree BA (m2 ha−1)9.57.610.111.4
Tree species richness (counts 0.64-ha−1)15152223
Bamboo clump density (clumps ha−1)54.7145.36.317.2
Bamboo clump BA (m2 ha−1)4.47.80.51.1
Table 2. Tree density (ha−1) for each species group before and after the latest legal logging in 2011, and legally and illegally cut tree in four plots.
Species GroupPrior to the Latest Legal Logging in 2011Legally Cut Trees in 2011Lllegally Cut Trees from 2011 to 2013Remaining Stand in 2013
Plot 1Plot 2Plot 3Plot 4Plot 1Plot 2Plot 3Plot 4Plot 1Plot 2Plot 3Plot 4Plot 1Plot 2Plot 3Plot 4
Teak0.00.043.89.40.00.00.00.00.00.01.60.00.00.042.29.4
Group I6.312.59.412.50.01.60.09.46.36.36.31.60.04.73.11.6
Group II50.07.818.818.80.00.00.00.015.63.14.73.134.44.714.115.6
Group III3.17.89.423.40.00.00.01.61.61.61.63.11.66.37.818.8
Group IV14.14.71.67.84.70.00.00.00.03.10.00.09.41.61.67.8
Group V26.621.9129.782.80.00.00.00.07.86.317.26.318.815.6112.576.6
Total100.054.7212.5154.74.71.60.010.931.320.331.314.164.132.8181.3129.7
Table 3. The result of the generalized linear model (GLM) with logit link to predict probabilities of illegal logging for a given tree.
VariableEstimateStd. ErrorZ-ValuePr (>|Z|)
Intercept−1.61120.5568−2.89400.0038
DBH (cm)0.03060.00694.4140<0.00001
Quality for charcoal−0.71080.1714−4.1470<0.00001
Quality for timber0.17700.13091.35200.176
The response variables are 1 and 0 for illegally logged trees and remaining trees, respectively. Quality for charcoal and timber is classified into four classes, with decreasing quality from 1 to 4.
Publisher’s Note: MDPI stays neutral with regard to jurisdictional claims in published maps and institutional affiliations.