
Intsia bijuga Heartwood Extract and Its Phytosome as Tyrosinase Inhibitor, Antioxidant, and Sun Protector

 ,
,  ,
,
Abstract
:1. Introduction
2. Materials and Methods
2.1. Extraction
2.2. Total Phenolic Content (TPC) and Total Flavonoid Content (TFC)
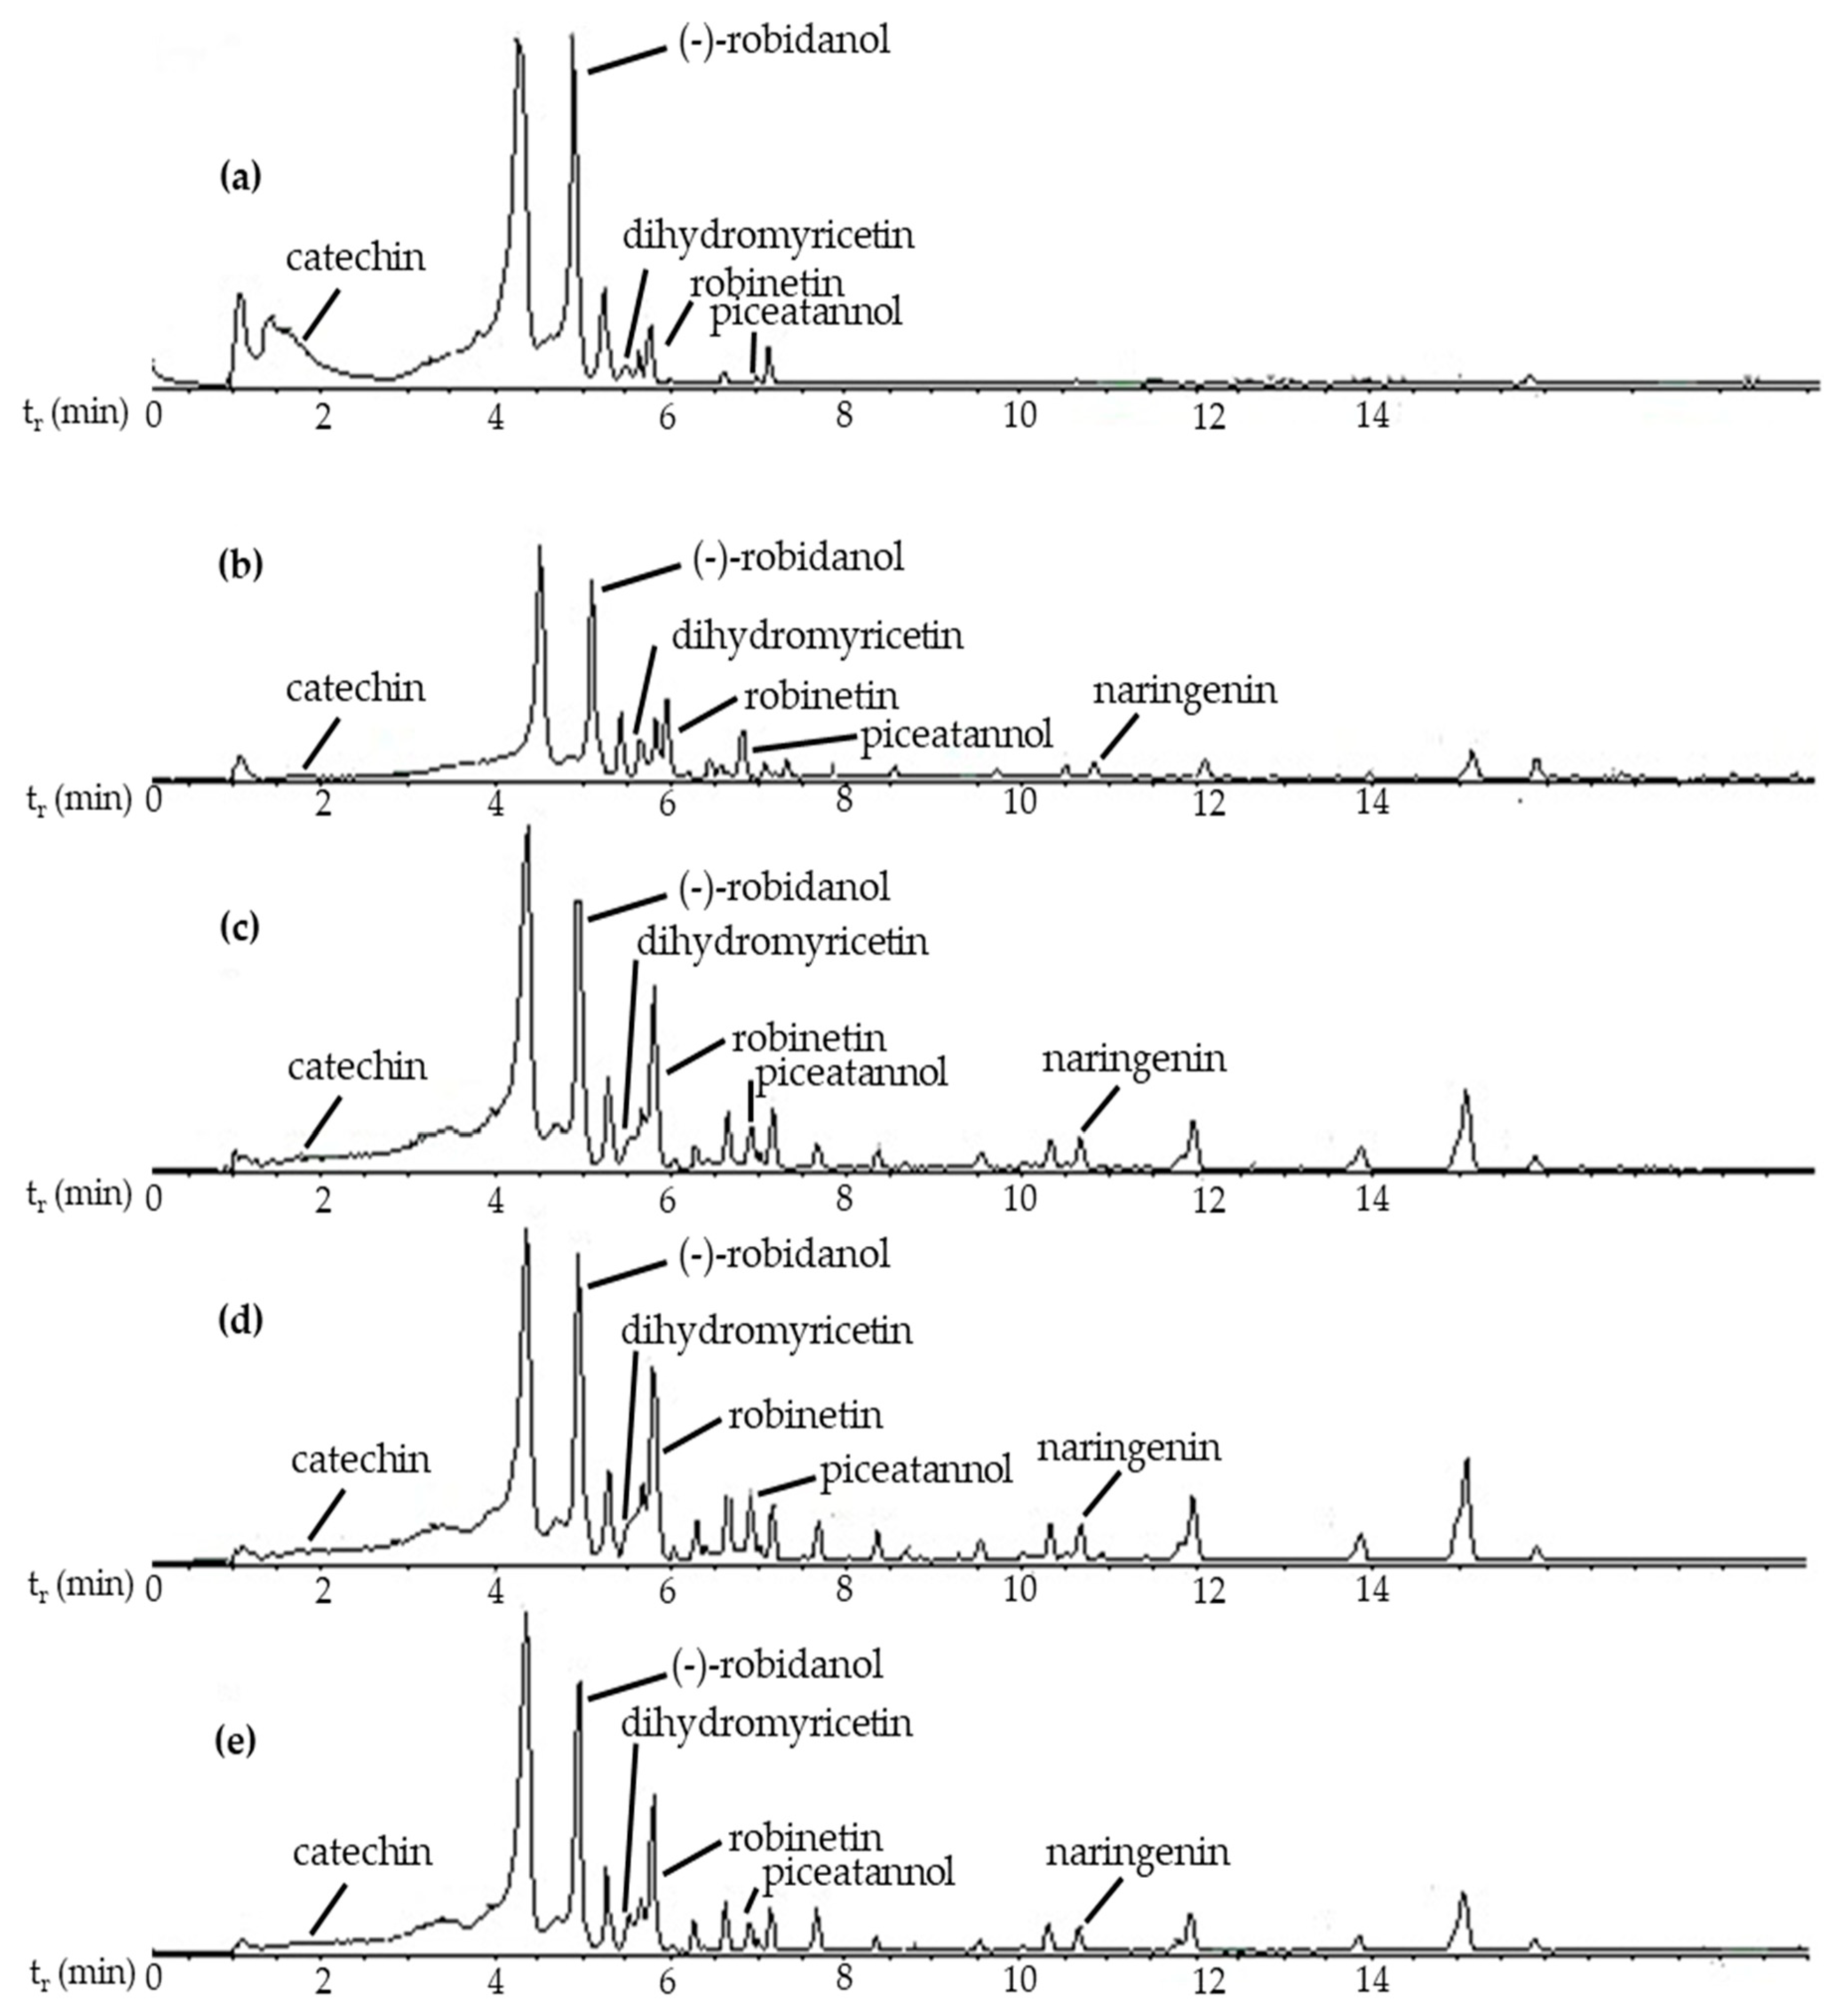
2.3. LC-MS/MS Analysis
2.4. Antioxidant Activity
2.5. Tyrosinase Inhibition Activity
2.6. SPF Value Determination
2.7. Phytosome-Extract Complexation
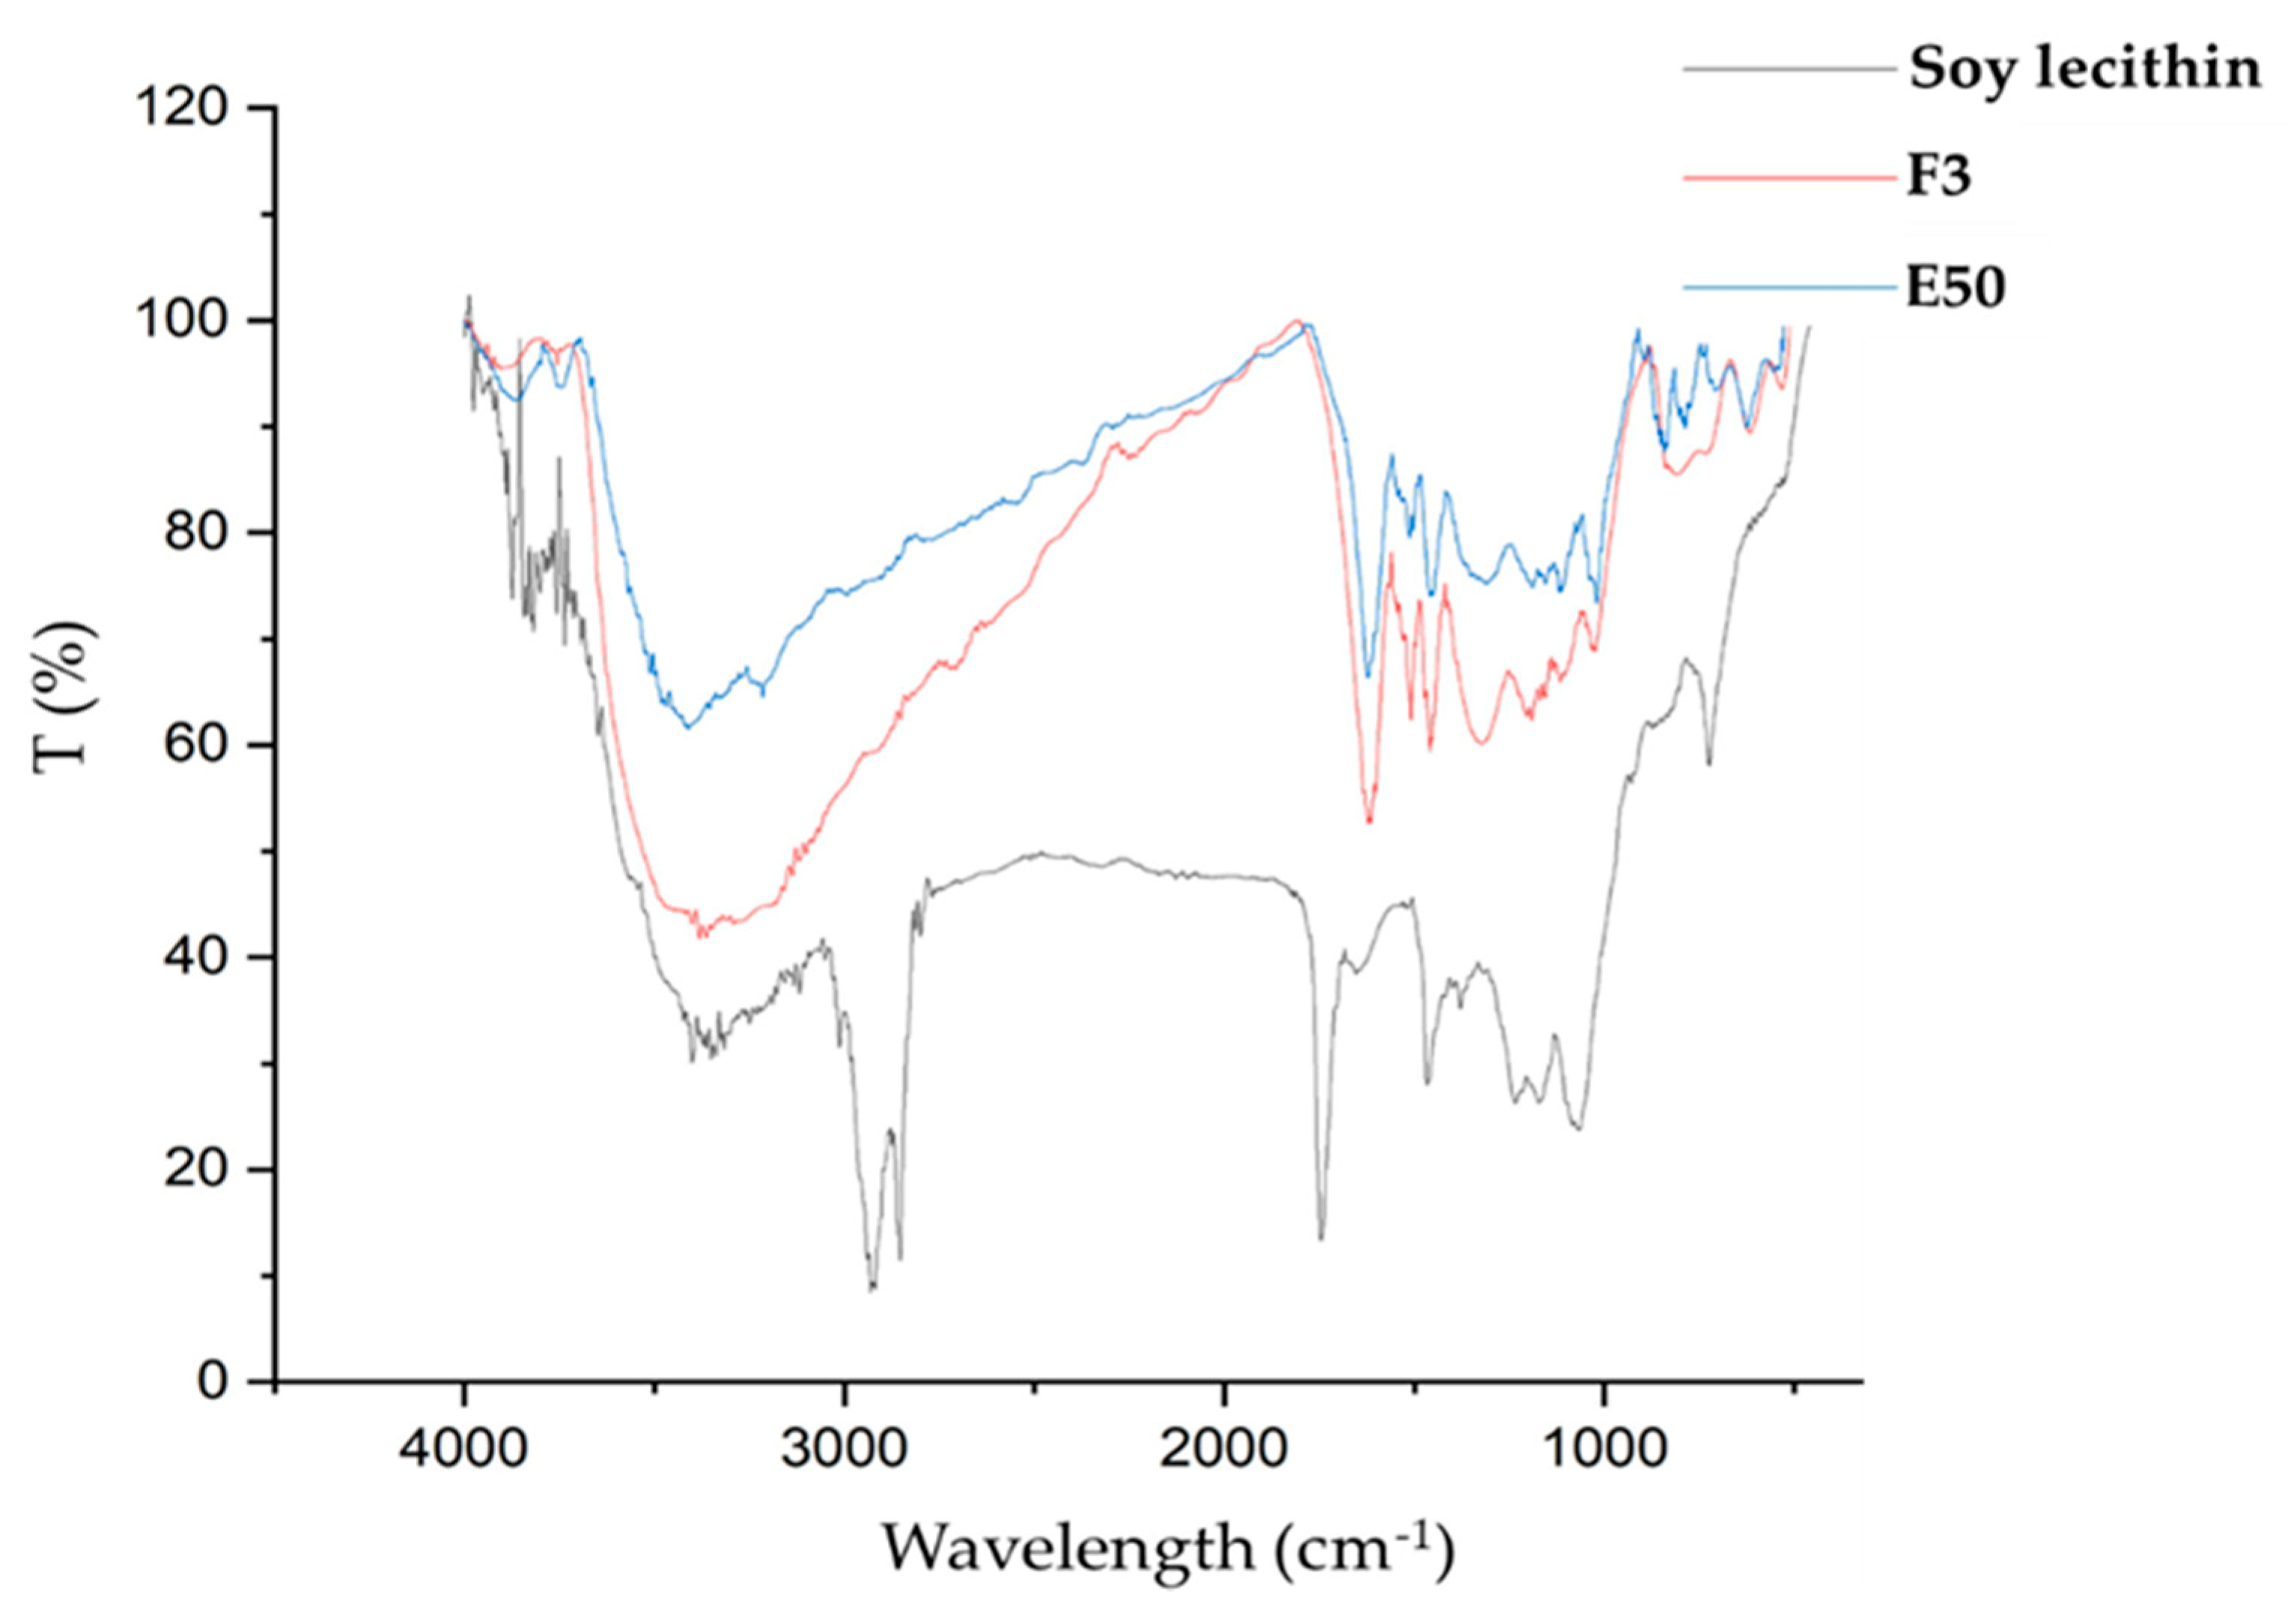
2.8. Fourier Transform Infrared (FTIR) Spectroscopy Analysis
2.9. Statistical Analysis
3. Results
3.1. Yield, Bioactivity, and Phytochemical Profile of Extracts
3.2. Yield, Bioactivity, and Phytochemical Profile of Phytosome
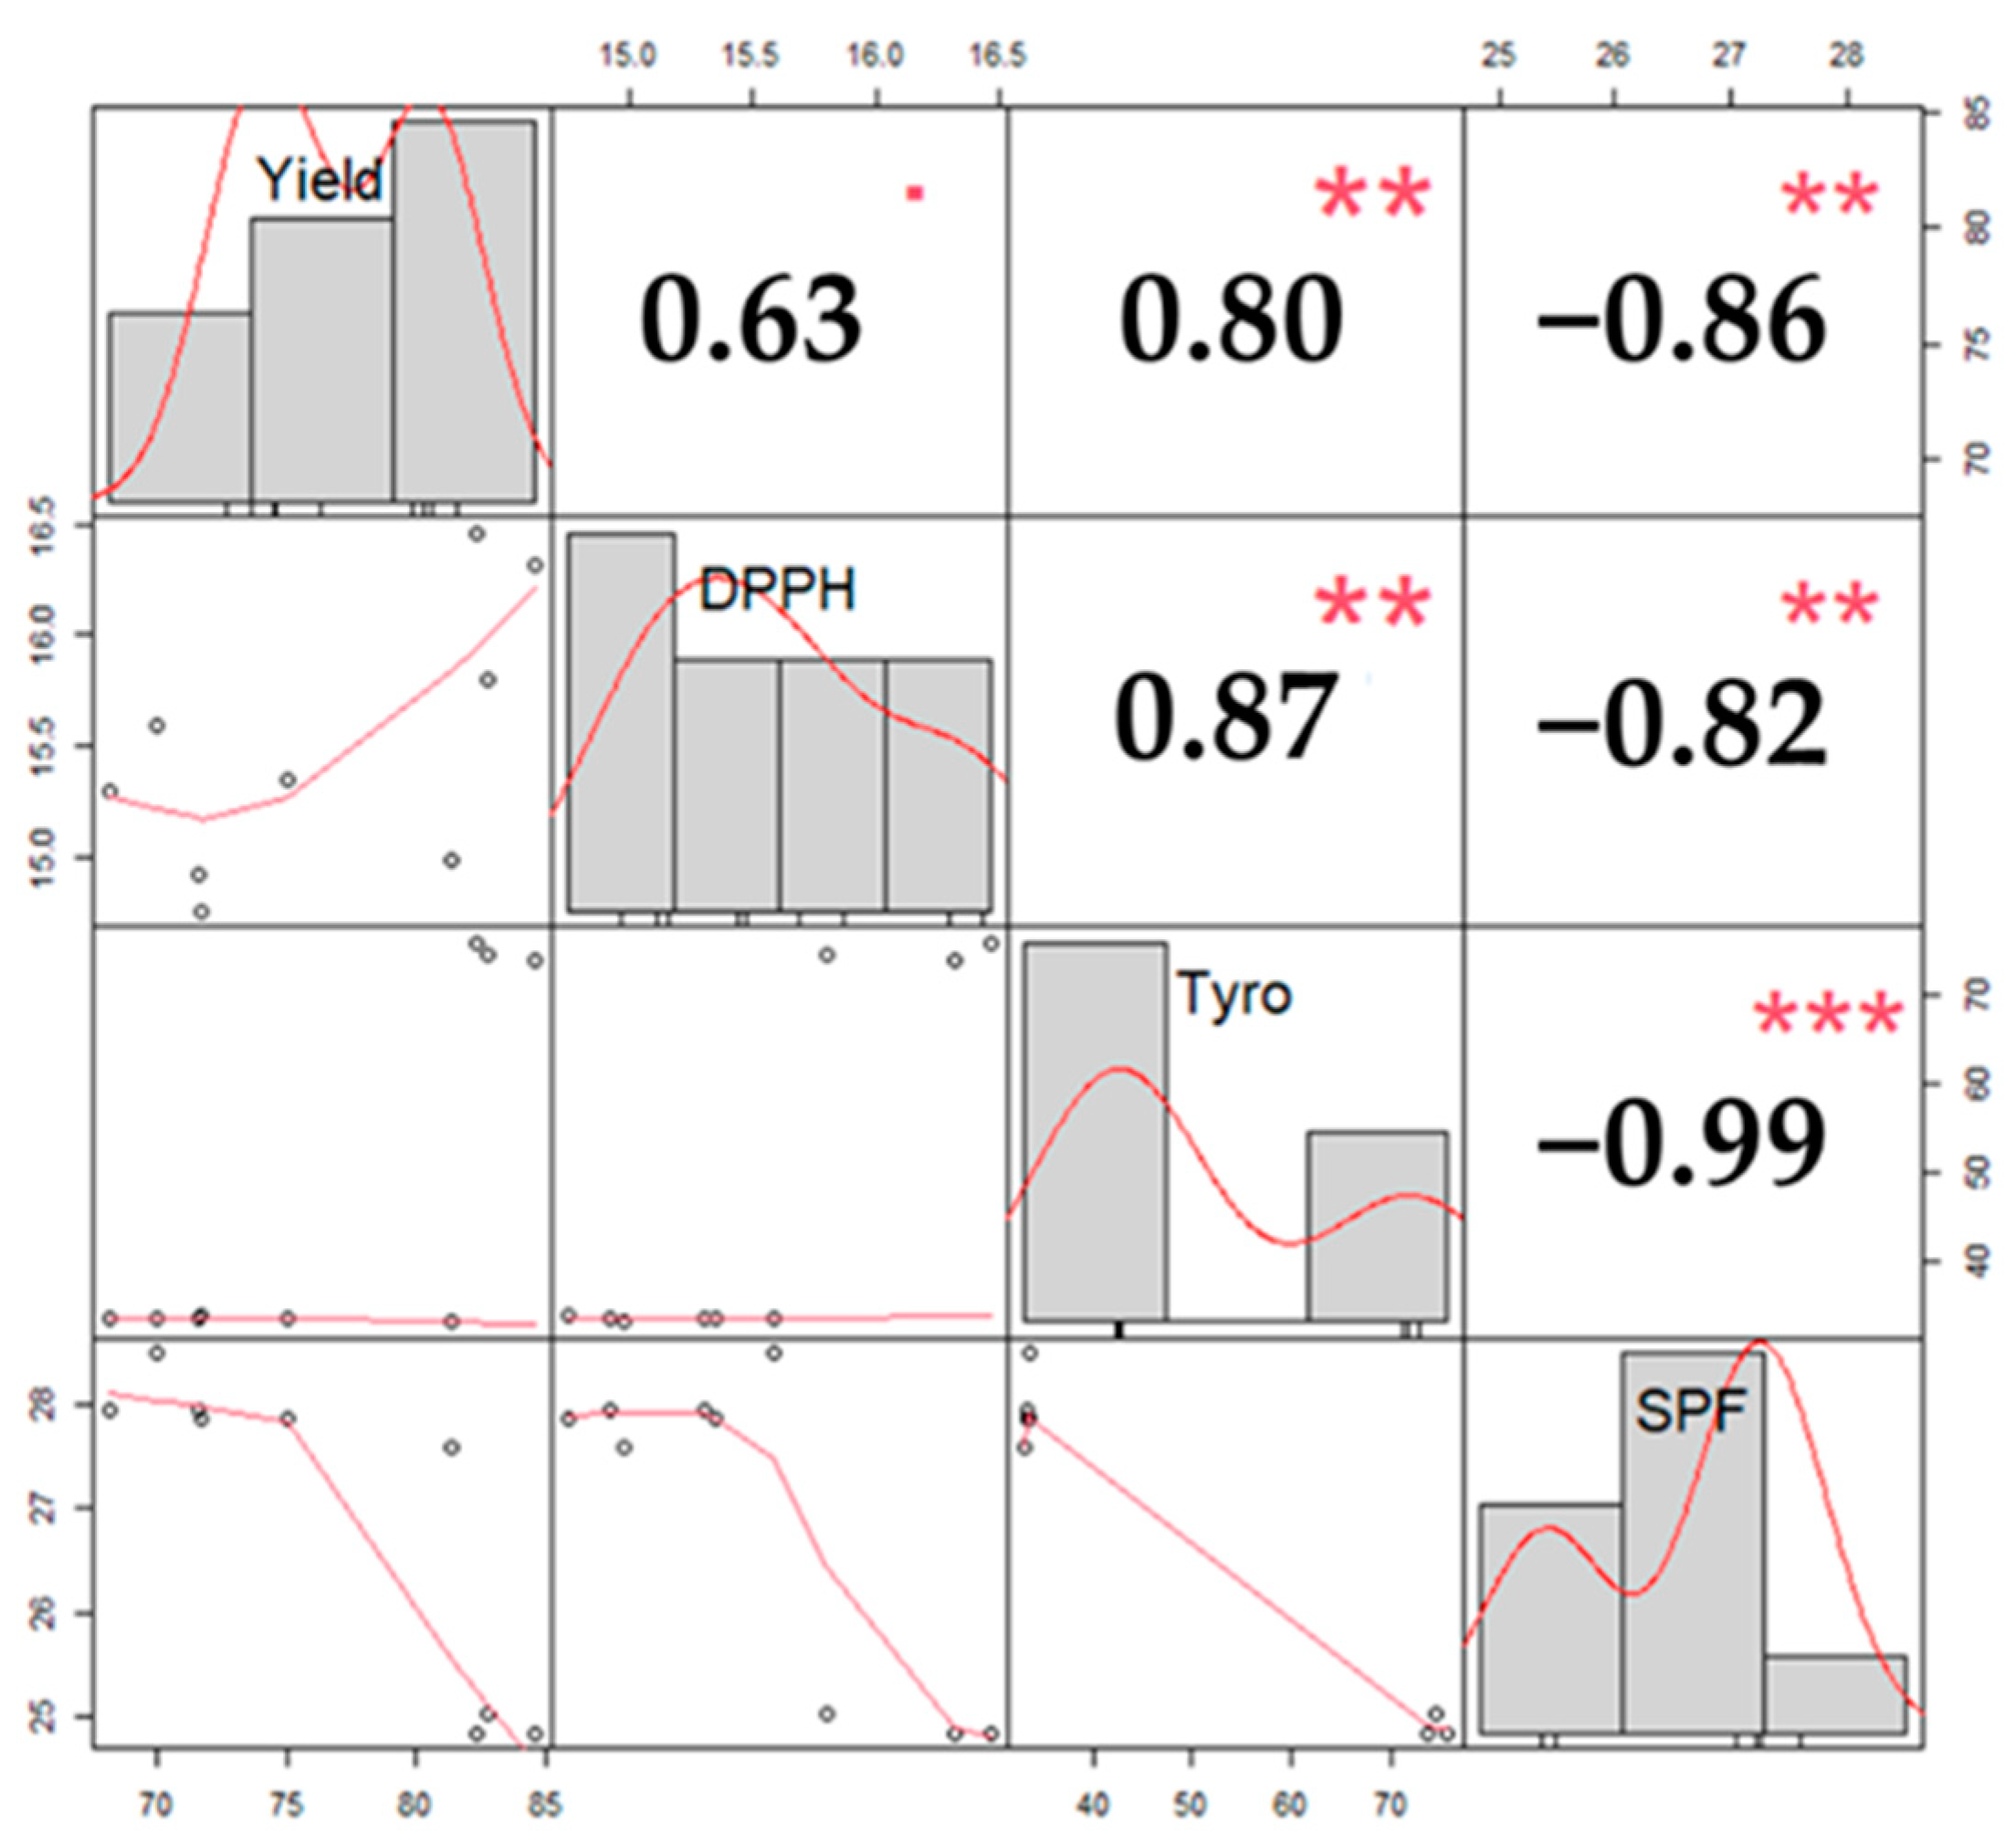
3.3. The Correlation among Parameters
4. Discussion
5. Conclusions
Author Contributions
Funding
Institutional Review Board Statement
Informed Consent Statement
Data Availability Statement
Acknowledgments
Conflicts of Interest
References
- Tong, P.S.; Chen, H.K.; Hewitt, J.; Affre, A. Review of Trade in Merbau from Major Range States; TRAFFIC Southeast Asia: Petaling Jaya, Selangor, Malaysia, 2009; ISBN 9789833393176. [Google Scholar]
- Badan Pusat Statistik. Statistik Produksi Kehutanan 2019. Available online: https://www.bps.go.id/publication/2020/11/27/969702bd7c227b224b293795/statistik-produksi-kehutanan-2019.html (accessed on 12 November 2021).
- Binic, I.; Lazarevic, V.; Ljubenovic, M.; Mojsa, J.; Sokolovic, D. Skin Ageing: Natural Weapons and Strategies. Evid.-Based Complement. Altern. Med. 2013, 2013, 1–10. [Google Scholar] [CrossRef] [PubMed] [Green Version]
- Batubara, I.; Kuspradini, H.; Muddathir, A.M.; Mitsunaga, T. Intsia Palembanica Wood Extracts and Its Isolated Compounds as Propionibacterium Acnes Lipase Inhibitor. J. Wood Sci. 2014, 60, 169–174. [Google Scholar] [CrossRef]
- Batubara, I.; Darusman, L.K.; Batubara, I.; Mitsunaga, T.; Aoki, H.; Rahminiwati, M.; Djauhari, E.; Yamauchi, K. Flavonoid from Intsia Palembanica as Skin Whitening Agent. J. Biol. Sci. 2011, 11, 475–480. [Google Scholar] [CrossRef] [Green Version]
- Hazizul Hasan, M.H.; Wahab, I.A.; Adam, A. Antioxidant Properties of the Ethyl Acetate Fraction of Intsia Palembanica (Merbau, Fabaceae). Arch. Pharm. Pharmacol. Res. 2019, 2, 2–9. [Google Scholar] [CrossRef] [Green Version]
- Widodo, H.; Sismindari, S.; Asmara, W.; Rohman, A. Antioxidant Activity, Total Phenolic and Flavonoid Contents of Selected Medicinal Plants Used for Liver Diseases and Its Classification with Chemometrics. J. Appl. Pharm. Sci. 2019, 9, 99–105. [Google Scholar] [CrossRef] [Green Version]
- Hillis, W.E.; Yazaki, Y. Polyphenols of Intsia Heartwoods. Phytochemistry 1973, 12, 2491–2495. [Google Scholar] [CrossRef]
- Sun, C.; Wu, Z.; Wang, Z.; Zhang, H. Effect of Ethanol/Water Solvents on Phenolic Profiles and Antioxidant Properties of Beijing Propolis Extracts. Evid.-Based Complement. Altern. Med. 2015, 2015, 1–9. [Google Scholar] [CrossRef] [PubMed] [Green Version]
- Permana, A.D.; Utami, R.N.; Courtenay, A.J.; Manggau, M.A.; Donnelly, R.F.; Rahman, L. Phytosomal Nanocarriers as Platforms for Improved Delivery of Natural Antioxidant and Photoprotective Compounds in Propolis: An Approach for Enhanced Both Dissolution Behaviour in Biorelevant Media and Skin Retention Profiles. J. Photochem. Photobiol. B Biol. 2020, 205, 111846. [Google Scholar] [CrossRef]
- Molaveisi, M.; Noghabi, M.S.; Parastouei, K.; Taheri, R.A. Fate of Nano-Phytosomes Containing Bioactive Compounds of Echinacea Extract in an Acidic Food Beverage. Food Struct. 2021, 27, 100177. [Google Scholar] [CrossRef]
- Direito, R.; Reis, C.; Roque, L.; Gonçalves, M.; Sanches-Silva, A.; Gaspar, M.M.; Pinto, R.; Rocha, J.; Sepodes, B.; Bronze, M.R.; et al. Phytosomes with Persimmon (Diospyros Kaki l.) Extract: Preparation and Preliminary Demonstration of in Vivo Tolerability. Pharmaceutics 2019, 11, 296. [Google Scholar] [CrossRef] [Green Version]
- Batubara, I.; Komariah, K.; Sandrawati, A.; Nurcholis, W. Genotype Selection for Phytochemical Content and Pharmacological Activities in Ethanol Extracts of Fifteen Types of Orthosiphon Aristatus (Blume) Miq. Leaves Using Chemometric Analysis. Sci. Rep. 2020, 10, 1–11. [Google Scholar] [CrossRef] [PubMed]
- Tillah, M.; Batubara, I.; Sari, R.K. Antimicrobial and Antioxidant Activities of Resins and Essential Oil From Pine (Pinus Merkusii, Pinuso Ocarpa, Pinus Insularis) and Agathis (Agathis Loranthifolia). Biosaintifika J. Biol. Biol. Educ. 2017, 9, 134. [Google Scholar] [CrossRef] [Green Version]
- Nerya, O.; Vaya, J.; Musa, R.; Izrael, S.; Ben-Arie, R.; Tamir, S. Glabrene and Isoliquiritigenin as Tyrosinase Inhibitors from Licorice Roots. J. Agric. Food Chem. 2003, 51, 1201–1207. [Google Scholar] [CrossRef]
- Singh, R.P.; Narke, R. Preparation and Evaluation of Phytosome of Lawsone. Int. J. Pharm. Sci. Res. 2015, 6, 5217. [Google Scholar] [CrossRef]
- Do, Q.-D.; Angkawijaya, A.E.; Tran-Nguyen, P.L.; Huynh, L.H.; Soetaredjo, F.E.; Ismadji, S.; Ju, Y.-H. Effect of Extraction Solvent on Total Phenol Content, Total Flavonoid Content, and Antioxidant Activity of Limnophila Aromatica. J. Food Drug Anal. 2014, 22, 296–302. [Google Scholar] [CrossRef] [Green Version]
- Sari, R.K.; Wahyuningrum, M.; Rafi, M.; Wientarsih, I. Effect of Ethanol Polarity on Extraction Yield, Antioxidant, and Sunscreen Activities of Phytochemicals from Gyrinops Versteegii Leaves. IOP Conf. Ser. Mater. Sci. Eng. 2020, 935, 012038. [Google Scholar] [CrossRef]
- Sultana, B.; Anwar, F.; Ashraf, M. Effect of Extraction Solvent/Technique on the Antioxidant Activity of Selected Medicinal Plant Extracts. Molecules 2009, 14, 2167–2180. [Google Scholar] [CrossRef] [PubMed]
- Panche, A.N.; Diwan, A.D.; Chandra, S.R. Flavonoids: An Overview. J. Nutr. Sci. 2016, 5, e47. [Google Scholar] [CrossRef] [PubMed] [Green Version]
- Hashemi, Z.; Ebrahimzadeh, M.A.; Khalili, M. Sun Protection Factor, Total Phenol, Flavonoid Contents and Antioxidant Activity of Medicinal Plants from Iran. Trop. J. Pharm. Res. 2019, 18, 1443–1448. [Google Scholar] [CrossRef]
- Telange, D.R.; Patil, A.T.; Pethe, A.M.; Fegade, H.; Anand, S.; Dave, V.S. Formulation and Characterization of an Apigenin-Phospholipid Phytosome (APLC) for Improved Solubility, in Vivo Bioavailability, and Antioxidant Potential. Eur. J. Pharm. Sci. 2017, 108, 36–49. [Google Scholar] [CrossRef] [Green Version]
- Rondanelli, M.; Peroni, G.; Riva, A.; Petrangolini, G.; Allegrini, P.; Fazia, T.; Bernardinelli, L.; Naso, M.; Faliva, M.A.; Tartara, A.; et al. Bergamot Phytosome Improved Visceral Fat and Plasma Lipid Profiles in Overweight and Obese Class I Subject with Mild Hypercholesterolemia: A Randomized Placebo Controlled Trial. Phytother. Res. 2021, 35, 2045–2056. [Google Scholar] [CrossRef]
- Freag, M.S.; Elnaggar, Y.S.; Abdallah, O.Y. Lyophilized Phytosomal Nanocarriers as Platforms for Enhanced Diosmin Delivery: Optimization and Ex Vivo Permeation. Int. J. Nanomed. 2013, 8, 2385–2397. [Google Scholar] [CrossRef] [Green Version]
- Nunes, A.R.; Vieira, G.P.; Queiroz, D.B.; Leal, A.L.A.B.; Morais, S.M.; Muniz, D.F.; Calixto-Junior, J.T.; Coutinho, H.D.M. Use of Flavonoids and Cinnamates, the Main Photoprotectors with Natural Origin. Adv. Pharmacol. Sci. 2018, 2018, 5341487. [Google Scholar] [CrossRef] [PubMed]
- Prayogo, Y.H.; Syafii, W.; Sari, R.K.; Batubara, I. Danu Pharmacological Activity and Phytochemical Profile of Acacia Heartwood Extracts. Sci. Pharm. 2021, 89, 37. [Google Scholar] [CrossRef]
- Miyazawa, M.; Tamura, N. Inhibitory Compound of Tyrosinase Activity from the Sprout of Polygonum Hydropiper L. (Benitade). Biol. Pharm. Bull. 2007, 30, 595–597. [Google Scholar] [CrossRef] [Green Version]


| Extracts | Yield (%) | TPC (GAE/g Extract) | TFC (QE/g Extract) |
|---|---|---|---|
| E100 | 12.81 ± 1.21 d | 1238.96 ± 3.61 a | 1.63 ± 0.00 c |
| E75 | 16.13 ± 0.20 b | 859.80 ± 7.22 b | 2.53 ± 0.00 b |
| E50 | 17.79 ± 0.48 a | 768.13 ± 10.83 c | 1.58 ± 0.004 d |
| E25 | 14.69 ± 0.90 c | 570.21 ± 3.61 d | 0.71 ± 0.00 e |
| E0 | 11.11 ± 0.36 e | 491.04 ± 7.22 e | 3.12 ± 0.02 a |
| Extracts | IC50 (mg/L) | SPF Value | |
|---|---|---|---|
| Antioxidant | Antityrosinase | ||
| E100 | 9.37 ± 0.11 b | 11.61 ± 0.17 b | 16.84 ± 0.01 a |
| E75 | 8.17 ± 0.16 c | 11.17 ± 0.29 bc | 13.25 ± 0.13 b |
| E50 | 5.68 ± 0.48 d | 10.36 ± 0.16 d | 12.36 ± 0.99 c |
| E25 | 5.72 ± 0.11 d | 10.97 ± 0.27 c | 8.33 ± 0.1 d |
| E0 | 6.07 ± 0.13 d | 11.23 ± 0.33 bc | 6.22 ± 0.04 e |
| Positive control | * 9.78 ± 0.08 a | ** 31.33 ± 0.25 a | - |
| Compound Name | Retention Time (min) | Compound Class | Relative Abundance (%) | ||||
|---|---|---|---|---|---|---|---|
| E0 | E25 | E50 | E75 | E100 | |||
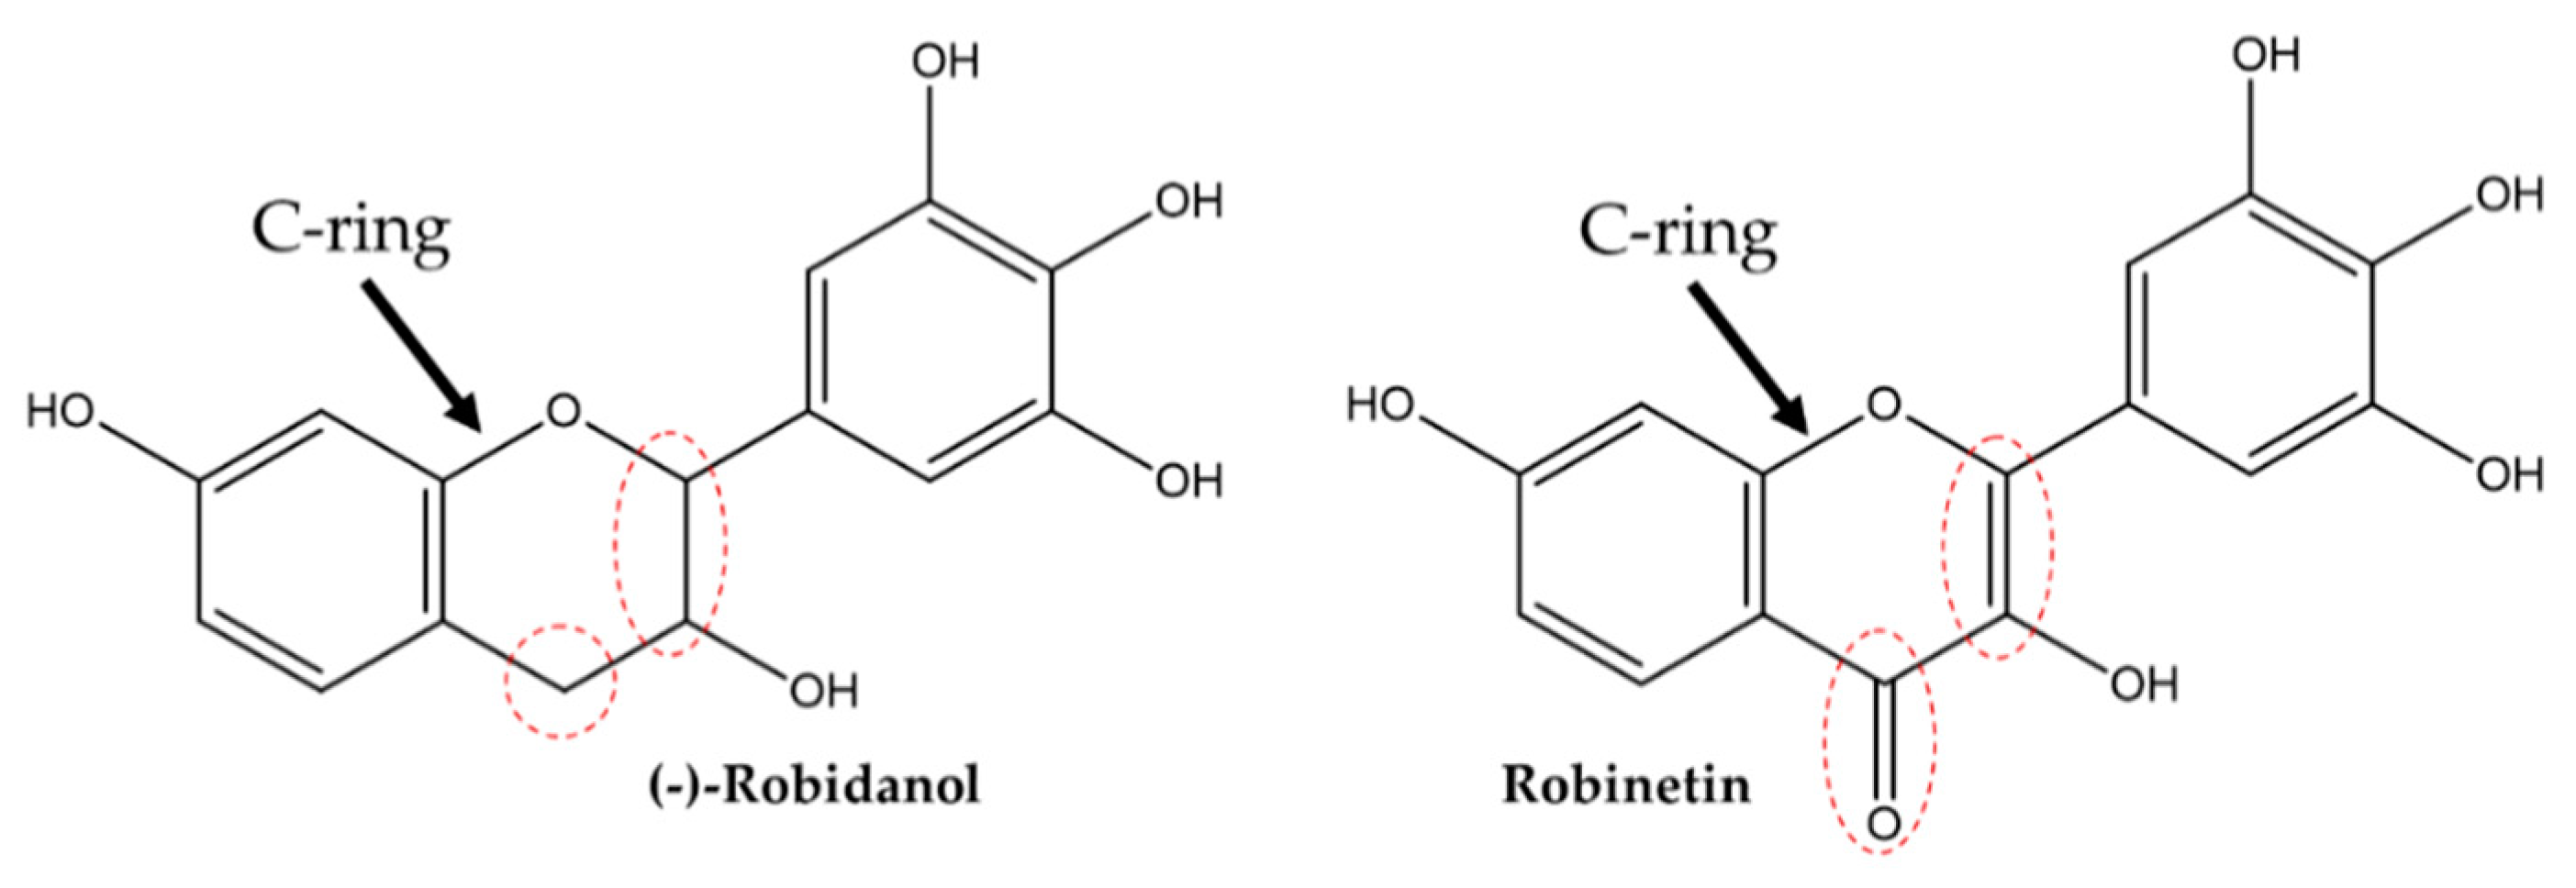
| (-)-Robidanol | 4.787 | Flavonoid | 57.8 | 47.8 | 46.3 | 40.7 | 47.4 |
| Robinetin | 6.250 | Flavonoid | 2.8 | 28.6 | 31.5 | 35.0 | 29.5 |
| Catechin | 1.953 | Flavonoid | 20.8 | 3.9 | 4.6 | 4.0 | 4.8 |
| Naringenin | 10.784 | Flavonoid | 0.6 | 3.2 | 3.0 | 3.5 | 3.3 |
| Dihydromyricetin | 5.499 | Flavonoid | 1.4 | 4.6 | 2.3 | 2.3 | 1.9 |
| Piceatannol | 6.737 | Stilbene | 0.1 | 2.9 | 1.8 | 2.4 | 2.4 |
| Quercetin | 9.127 | Flavonoid | 0.1 | 1.0 | 1.9 | 2.1 | 1.4 |
| Fustin | 7.470 | Flavonoid | 0.8 | 1.3 | 1.4 | 1.3 | 1.8 |
| Extracts | Yield (%) | IC50 (mg/L) | SPF Value | |
|---|---|---|---|---|
| Antioxidant | Antityrosinase | |||
| F1 | 69.87 ± 1.69 b | 15.27 ± 0.34 b | 33.40 ± 0.05 b | 28.13 ± 0.32 a |
| F2 | 83.20 ± 1.17 a | 16.19 ± 0.35 a | 74.66 ± 1.08 a | 24.91 ± 0.11 b |
| F3 | 76.02 ± 4.92 b | 15.03 ± 0.30 b | 33.36 ± 0.33 b | 27.78 ± 0.16 a |
| Positive control | * 9.78 ± 0.08 | ** 25.56 ± 0.57 | ||
| Compound/Parameter | DPPH | Tyrosinase Inhibition | SPF |
|---|---|---|---|
| (-)-Robidanol | 0.85 | 0.63 | 0.74 |
| Robinetin | −0.85 | 0.7 | −0.75 |
| Catechin | 0.77 | 0.65 | 0.71 |
| Naringenin | −0.79 | −0.57 | −0.79 |
| Dihydromyricetin | 0.11 | 0.14 | 0.00 |
| Piceatannol | −0.54 | −0.38 | −0.66 |
| Quercetin | −0.96 * | −0.79 | −0.73 |
| Fustin | −0.77 | −0.45 | −0.87 |
| TPC | 0.87 *** | 0.40 | 0.97 *** |
| TFC | 0.14 | 0.24 | −0.21 |
Publisher’s Note: MDPI stays neutral with regard to jurisdictional claims in published maps and institutional affiliations. |
© 2021 by the authors. Licensee MDPI, Basel, Switzerland. This article is an open access article distributed under the terms and conditions of the Creative Commons Attribution (CC BY) license (https://creativecommons.org/licenses/by/4.0/).
Share and Cite
Sari, R.K.; Prayogo, Y.H.; Sari, R.A.L.; Asidah, N.; Rafi, M.; Wientarsih, I.; Darmawan, W. Intsia bijuga Heartwood Extract and Its Phytosome as Tyrosinase Inhibitor, Antioxidant, and Sun Protector. Forests 2021, 12, 1792. https://doi.org/10.3390/f12121792
Sari RK, Prayogo YH, Sari RAL, Asidah N, Rafi M, Wientarsih I, Darmawan W. Intsia bijuga Heartwood Extract and Its Phytosome as Tyrosinase Inhibitor, Antioxidant, and Sun Protector. Forests. 2021; 12(12):1792. https://doi.org/10.3390/f12121792
Chicago/Turabian StyleSari, Rita Kartika, Yanico Hadi Prayogo, Ratih Afrida Lismana Sari, Nur Asidah, Mohamad Rafi, Ietje Wientarsih, and Wayan Darmawan. 2021. "Intsia bijuga Heartwood Extract and Its Phytosome as Tyrosinase Inhibitor, Antioxidant, and Sun Protector" Forests 12, no. 12: 1792. https://doi.org/10.3390/f12121792
APA StyleSari, R. K., Prayogo, Y. H., Sari, R. A. L., Asidah, N., Rafi, M., Wientarsih, I., & Darmawan, W. (2021). Intsia bijuga Heartwood Extract and Its Phytosome as Tyrosinase Inhibitor, Antioxidant, and Sun Protector. Forests, 12(12), 1792. https://doi.org/10.3390/f12121792