Article

Allometric Models for Estimating Aboveground Biomass in Short Rotation Crops of Acacia Species in Two Different Sites in Chile

by
Antonio Cabrera-Ariza
1,2,†,
Sara Valdés
3,†,
Horacio Gilabert
4,
Rómulo Eduardo Santelices-Moya
2 and
Máximo Alonso-Valdés
5,*
1
Centro de Investigación y Estudios Avanzados del Maule, Universidad Católica del Maule, Avenida San Miguel 3605, Talca 3460000, Chile
2
Centro de Desarrollo del Secano Interior, Universidad Católica del Maule, Avenida San Miguel 3605, Talca 3460000, Chile
3
Graduate School, Faculty of Agronomy and Forestry, Pontificia Universidad Católica de Chile, Avenida Vicuña Mackenna 4860, Santiago 7820436, Chile
4
Department of Ecosystems and Environment, Pontificia Universidad Católica de Chile, Avenida Vicuña Mackenna 4860, Santiago 7820436, Chile
5
Institute of Animal Production, Universidad Austral de Chile, Independencia 631, Valdivia 5091000, Chile
*
Author to whom correspondence should be addressed.
These authors contributed equally to this work.
Forests 2021, 12(12), 1767; https://doi.org/10.3390/f12121767
Submission received: 15 November 2021 / Revised: 3 December 2021 / Accepted: 9 December 2021 / Published: 14 December 2021
(This article belongs to the Section Forest Inventory, Modeling and Remote Sensing)

Abstract

:
We evaluated the ability of different allometric models to estimate the biomass production of short-rotation woody crops of Acacia dealbata, A. mearnsii and A. melanoxylon. Models considered the adjustment and validation of biomass functions and biological restrictions, such as the use of additive components of the biomass (stem, branches, and leaves). Adjustments of linear and nonlinear models of the three acacia species—established in two locations and of three densities in southern Chile—were utilized. Systems of equations were adjusted to guarantee the addition of the biomass components and the trees’ total biomass. The selection of models was performed based on their goodness of fit and predictive quality. Methods that accounted for the correlation between biomass components granted an additively consistent equations system with efficient estimates and reliable prediction intervals.

1. Introduction

Volatility in fossil fuel prices has increased the relevance of forest biomass as an alternative energy source. However, traditional forest plantations require relatively long rotations. Thus, biomass from short-rotation woody crops (SRWC) constitutes a better alternative for renewable energy. Of the SRWC species with high potential worldwide, those of the genus Acacia are especially valuable due to their reproductive strategies, plasticity, and combustible properties, which are praised throughout the existing literature and on the international stage [1,2,3].
In this context, the development of prediction models capable of precise biomass estimations is required. Allometric biomass models are regression models that use tree dimensions, such as diameter at breast height and/or tree height to predict aboveground biomass [4]. To estimate forest biomass, there is significant literature on the development and use of allometric models [5]. However, variations in different aspects (stand age, topography, species composition, etc.) can lead to a bias in estimating biomass for a particular species [6]. The choice of an appropriate allometric model is, therefore, critical to reducing uncertainties in the estimation of biomass. To reduce this uncertainty in the estimation of biomass, it is generally best to use species- and site-specific allometric models [7]. In addition, all allometric models have limitations since they are based on a limited number of destructively sampled trees and often the sample locations are unrepresentative of forest heterogeneity [8]. These models are usually built using predictors based on locally developed regression systems. Technically, such models are formulated from biomass data and should consider the heterogeneity of variance of the residuals, to assure the efficiency of the estimators. Once formulated, models should be validated, so those with the best predictive qualities can be chosen. Moreover, if the determination of a sample’s aerial biomass aboveground considers the separation in tree components, then the sum of the regression equations of each component must be equal to the regression of the total biomass [9,10].
Nowadays, there are only a few biomass prediction models for Acacia species [11,12,13,14,15] they are all very general. Thus, the goal of this study was to evaluate and propose predictive models for Acacia dealbata Link, Acacia mearnsii De Wild, and Acacia melanoxylon R. Br. biomass, with data organized according to the following classification variables: species, location, and plant density.
The study tested the adjustment and validation of allometric models for biomass prediction considering the heteroscedasticity, the additivity of the tree components, and the predictive ability. This complements the lack of knowledge in this area of allometric equations. We used data collected from SRWC of the three Acacia species established at different plant densities at the Bío-Bío Region in southern Chile.

2. Materials and Methods

2.1. Study Area

Crops of Acacia dealbata, Acacia mearnsii, and Acacia melanoxylon were established at two contrasting experimental sites in Los Ángeles County in the Bío-Bío Region. The trial at Luanco (37°17′3.2″ S, 72°18′7.6″ W) was established in July 2011 on an 11 ha plot, while the trial in Santa Luisa (37°33′4.63″ S, 72°22′52.98″ W) was established in August 2012 on a 6.5 ha plot.
Soils in Luanco are red clay (Collipulli Series), with a pH of 6.0 and an organic matter content of 1.9 to 2.5% at 20–40 cm of soil depth [16]. Mean annual precipitation there is 1465 mm and mean temperatures are 19.5 °C and 8.6 °C in January and July, respectively [17]. In Santa Luisa, the soil is sandy (Arenales Series), poor in organic matter, and with low water holding capacity [18]. Soil pH is 6.18 and the C:N ratio is 23.4 [19]. The mean annual precipitation there is 1200 mm and the mean temperatures are 20.1 °C and 8.1 °C in January and July, respectively [17].

2.2. Trial Establishmet

In Luanco, 0.5 ha plots of A. dealbata, A. mearnsii, and A. melanoxylon were established at plant densities of 3000 (2.5 × 1.3 m) and 5000 (2.5 × 0.8 m) plants ha−1 while in Santa Luisa 0.5 ha plots of the same three species were established at 8000 (2.5 × 0.5 m) plants ha−1. Three replicates of each treatment were randomly distributed at the experimental sites, for a total of 27 plots including both sites. The differences in the plantation framework are due to the fact that the trial was originally proposed for the study of biomass productivity with different densities.

2.3. Biomass Sampling According to Species, Location and Plant Density

Destructive sampling was performed to account for the biomass of the species. Eighty plants per species, location, and density were randomly collected from the center of each plot avoiding border effect during three harvest dates: April 2013, July 2013, and April 2014.
The age (A) of each plot was registered in months. The height of the principal stem (H, in cm) and the diameter of the stem at neck height (DNH, in mm), defined as 10 cm above the soil, were measured with a metric tape for each plant. Each tree was manually separated into three components: leaves, branches, and main stem. Each component was kept in paper bags and the samples were oven dried at 70 °C until a constant weight was reached. Then, samples were weighted to determine the dry mass (DM, in g).

2.4. Fitting of Linear and Non-Linear Functional Forms

Data were organized into categories based on species, species and location, and species-location-plant density to detect associations between these categories and any specific functional form. Of the data points, 70% were randomly selected for the adjustments and the remaining 30% were segregated to evaluate the prediction of each model apart from the sample (validation). The adjustments were made using R version 3.1 [20]. The distributional assumptions of the linear model were analyzed and it was verified that the requirements of linearity, normality, independence, and homoscedasticity of the residuals were met.

2.4.1. Linear Forms

Adjusted power models with a multiplicative error were linearized using a logarithmic transformation (1).
ln ( B i o m a s s ) = ln ( a 0 ) + a 1 ln ( X ) + ln ( ε )
The variables included in the models corresponded to DNH, H, the age in months (A), or a combination of these factors. The adjustment of these functional forms was performed by ordinary least squares (OLS) using the correction factor proposed by Baskerville [21], obtained from the standard error of the estimation to reduce the residual error.
Alternatively, linear models were adjusted by weighted regression and variance regression models (2 and 3) [22]. In the weighted regression models, a weight (wi) was associated with each observation, which was inversely proportional to the residual variance ( σ i 2 ) . The regression model’s variance indicated a model for the variance of the residuals, corresponding to a power function with a predictor variable X.
V a r ( ε i ) = ( X i c ) 2
w i ~ X i 2 c
where X = D N H , since biomass almost always increased with the diameter of the tree.

2.4.2. Non-Linear Forms

The adjustments were conducted using the maximum verisimilitude method, resulting in the following adjusted power function models (4 and 5):
B i o m a s s ( Y ) = a 0 X a 1 + ε
V a r ( ε ) = ( X c ) 2
where the predictor variable X corresponds to DNH, DNH2 * H, DNH2 * H * A as well as a combination of these, and X corresponds to DNH. The adjustments of linear and non-linear models were performed using R version 3.1 [20].

2.5. Selection of the Functional Forms

2.5.1. Preselection Based on Goodness of Fit

For each category, the best linear and non-linear models were preselected based on the regression equations obtained. The Furnival Index (FI) (6 and 7) was used to select linear models because it allows for a comparison between models which do not have the same dependent variable. The index is in the reverse order of verisimilitude of the model; thus, the highest values of this index indicate the poorest fit and vice-versa [23].
F I l n = σ ^ i = 1 n B i n = e x p [ 1 n i = 1 n ( B i ) ] σ ^
F I = e x p [ i = 1 n { c l n ( D N H i ) } ]
where Bi is the biomass value of the stem, branches, or leaves to the i-th tree measured, σ ^ is the estimation of the residual standard deviation of the adjusted model and c is one of the parameters of the model to be estimated.
The selection of non-linear models was based on the Akaike Information Criteria (AIC) (8). The AIC uses the Kullback–Leibler’s distance, which corresponds to the measurement of the information lost when a “g” model is used to represent the true and unknown “f” model [24].
A I C = 2 ln ( l θ ^ ) + 2 q
where l( θ ^ ) is the likelihood of the sample for the estimated values of the model’s parameters and q is the number of free parameters in the model [20]. Thus, based on the set of non-linear functional forms, the model with the highest likelihood, and thus the lowest AIC value, was considered the best.

2.5.2. Selection Bases on Prediction Quality

The selection of the best linear and non-linear model was carried out based on bias (9), defined as:
B i a s = i = 1 n ( B i B ^ i   ) n
where Bi corresponds to the i-th observation of the total biomass or the components’ biomass, B ^ i is the i-th estimation of the biomass, and n is the number of observations.

2.6. Evaluation of the Additivity of the Selected Systems of Equations

Based on the previous selection, the additivity of the systems of equations calculated for each category of data was analyzed. The additivity was forced using the procedures described by Parresol [9]. The first method (method 1) considered that the regression function of the total biomass, for both the linear and non-linear models, could be defined as the sum of the best regression functions of the components. Thus, each linear and non-linear formula was adjusted using the generalized least squares method (GLS and NGLS respectively). In both cases, the adjustments were carried out using SAS’s PROC MODEL procedure [25].
For all the tree components, the variance of the error was estimated as a power function of the predictor variable, whose expression was linearized and adjusted using ordinary least squares (OLS).
Based on the adjustment of the parameters, the weight of each observation and the matrix of the covariance of errors φ ^ were obtained by using the methods described by Parresol [4]. The estimator of the parameters for the linear models (10) was represented by:
β ^ = ( X φ ^ 1 X ) 1 X φ ^ 1 y = ( X ψ ^ 1 X ) 1 X ψ ^ 1 y
In the case of non-linear models, the expression for the estimator β was minimized using the Gauss–Newton’s iterative algorithm (11) [4]:
β n + 1 = β n l n P n γ n
where γn = ∂S/∂β|βn is a gradient vector, Pn is a directional matrix defined by Pn = [Z(βn)ψ( θ ^ )−1Z(βn)]−1, and ln is known as the step length [10].
The second method considered the statistical dependence between the tree components and the total biomass [9,10]. Thus, the regression function for the total biomass was obtained from the adjustment of the system of equations, whose parameters were adjusted based on Seemingly and Nonlinear Seemingly Unrelated Regressions (SUR and NSUR) methods in SAS/IML (12, 13, 14, and 15) [25]. In this way, the system of equations was expressed as:
B s t e m = X 1 β 1 + ε 1
B b r a n c h e s = X 2 β 2 + ε 2
  B l e a v e s = X 3 β 3 + ε 3
B t o t a l = X 4 β 4 + ε 4
The additivity was achieved by imposing restrictions on the parameters. For this, a matrix of weights for the system of equations and a variance-covariance matrix of the parameters of the model were obtained. The SUR estimator subjected to the linear restrictions was obtained from this matrix (16, 17, and 18).
β ^ * = β ^ + C ^ R ( R C ^ R ) 1 ( r R β ^ )
β ^ = [ X Δ ^ ( S ^ 1     I ) Δ ^ X ] 1 X Δ ^ ( S ^ 1 I ) Δ ^ y
C ^ = [ X Δ ^ ( S ^ 1     I ) Δ ^ X ] 1
The symbol ⨂ denotes the Kronecker product. The expression Δ corresponds to the root of the inverse matrix of weights and S ^ corresponds to the variance-covariance matrix of the parameters of the model. The matrix (Rβ = r) represents the linear restrictions of the model.
For the adjustments using NSUR, the estimation was made with the Gauss–Newton gradient minimization model [25] using an iterative algorithm (19):
β n + 1 = β n + l n [ F [ ( β n ) Δ ^ ( S ^ 1     I ) Δ ^   F ( β n ) ] 1 F ( β n ) Δ ^ ( S ^ 1 I ) Δ ^ [ y f ( X , β n ) ]
where F(β) is the matrix of partial derivatives of residuals with respect to the parameters, with a dimension KxMT (20)
F ( β ) = ε β = [ f 1 β , f 2 β , f 3 β , f 4 β ]

3. Results

Table 1 summarizes the descriptive statistics for the set of predictor variables used and the values obtained for the dry biomass of the stem, branches, and leaves of A. dealbata, A. melanoxylon, and A. mearnsii in both sites as well as the three plant densities.

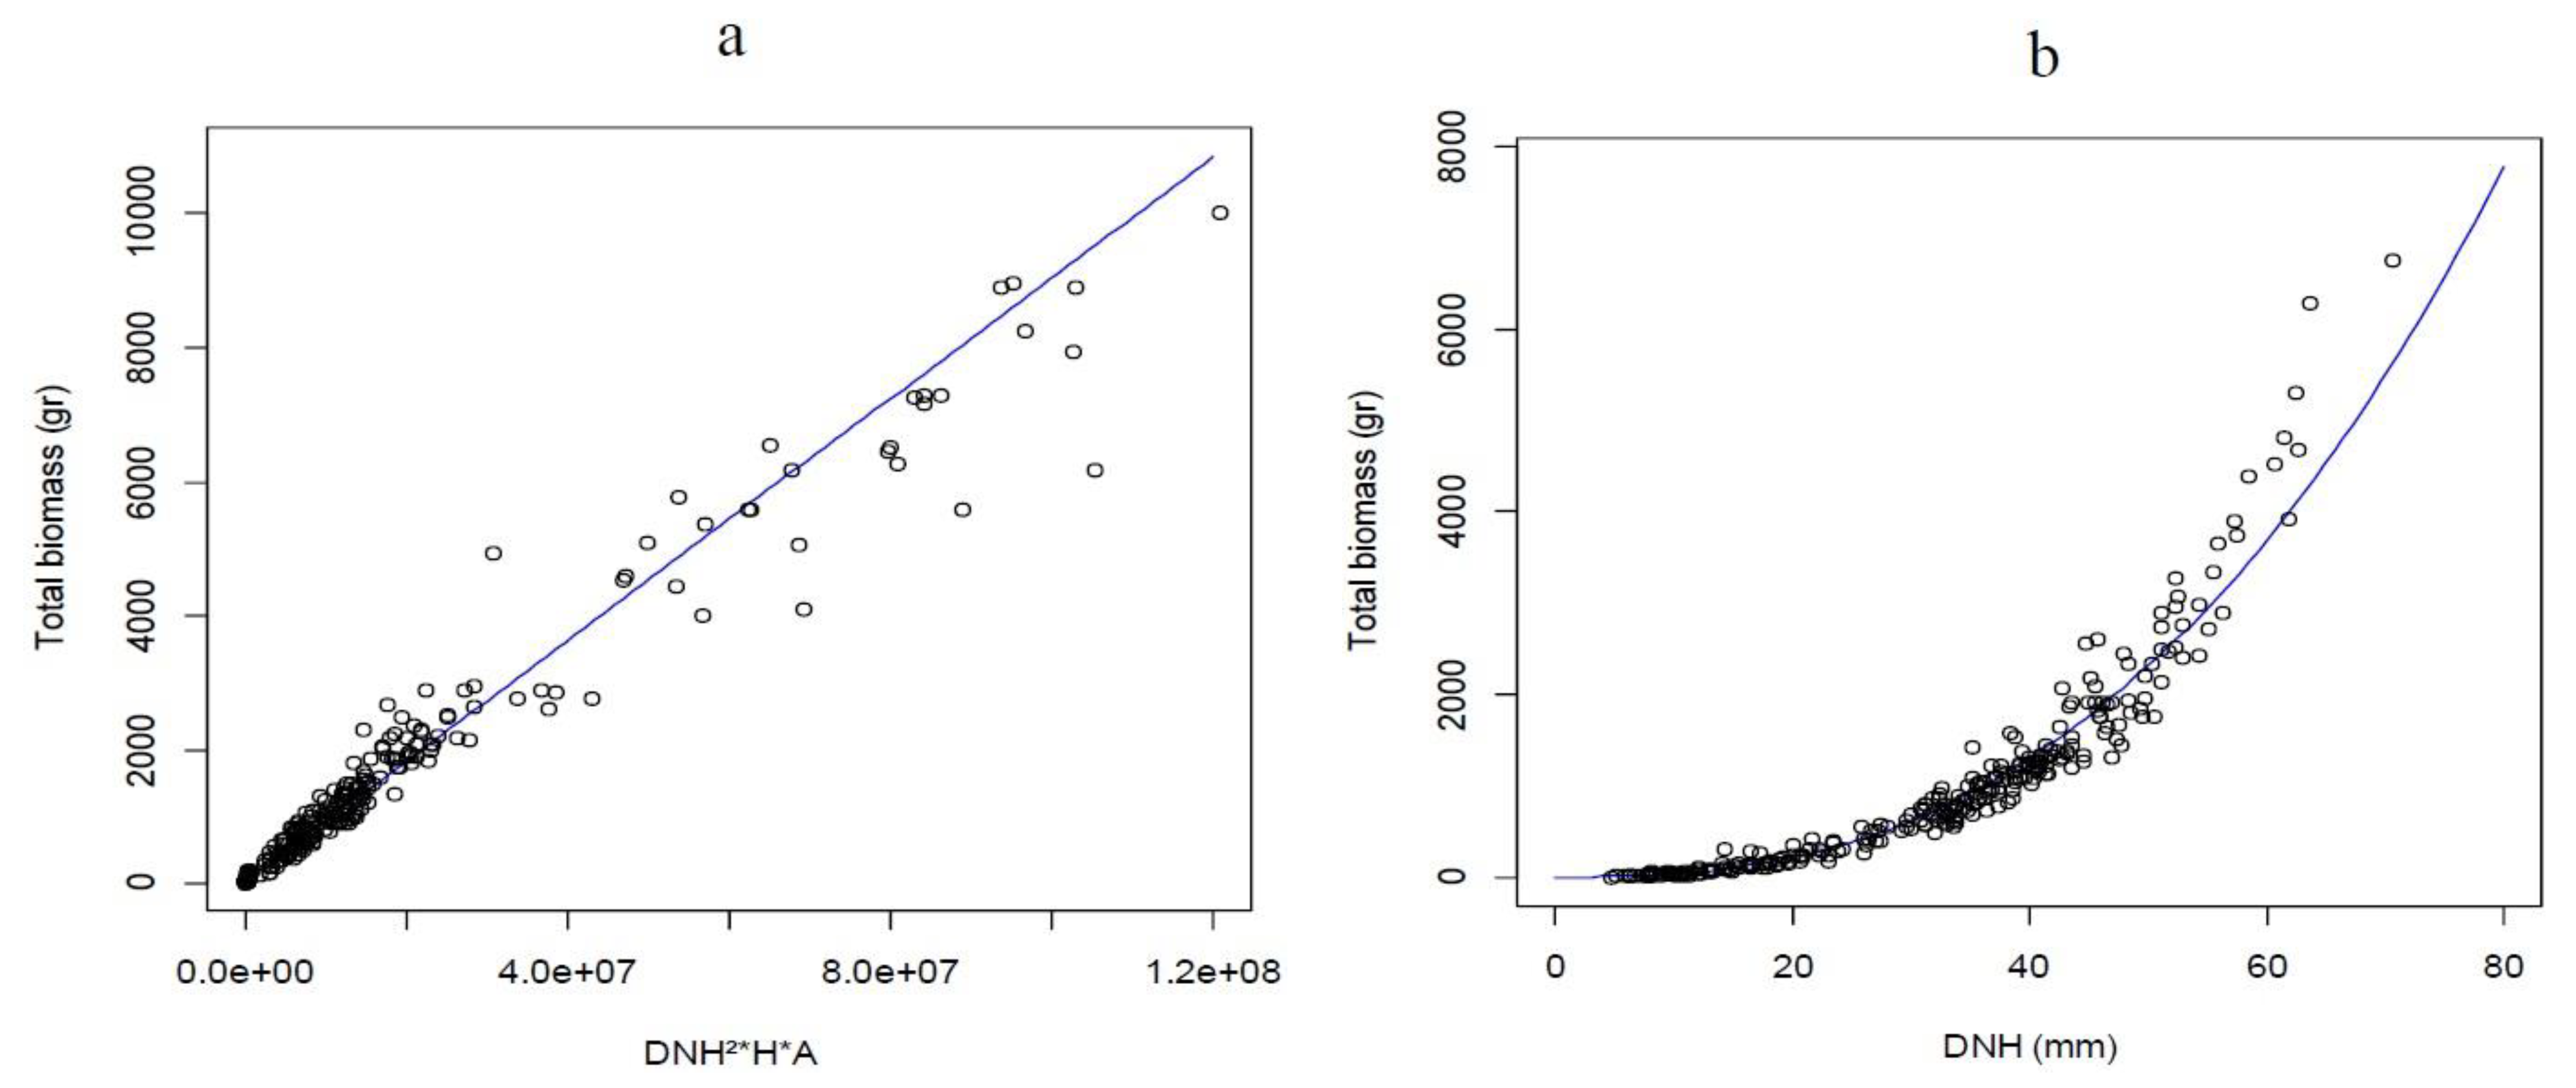
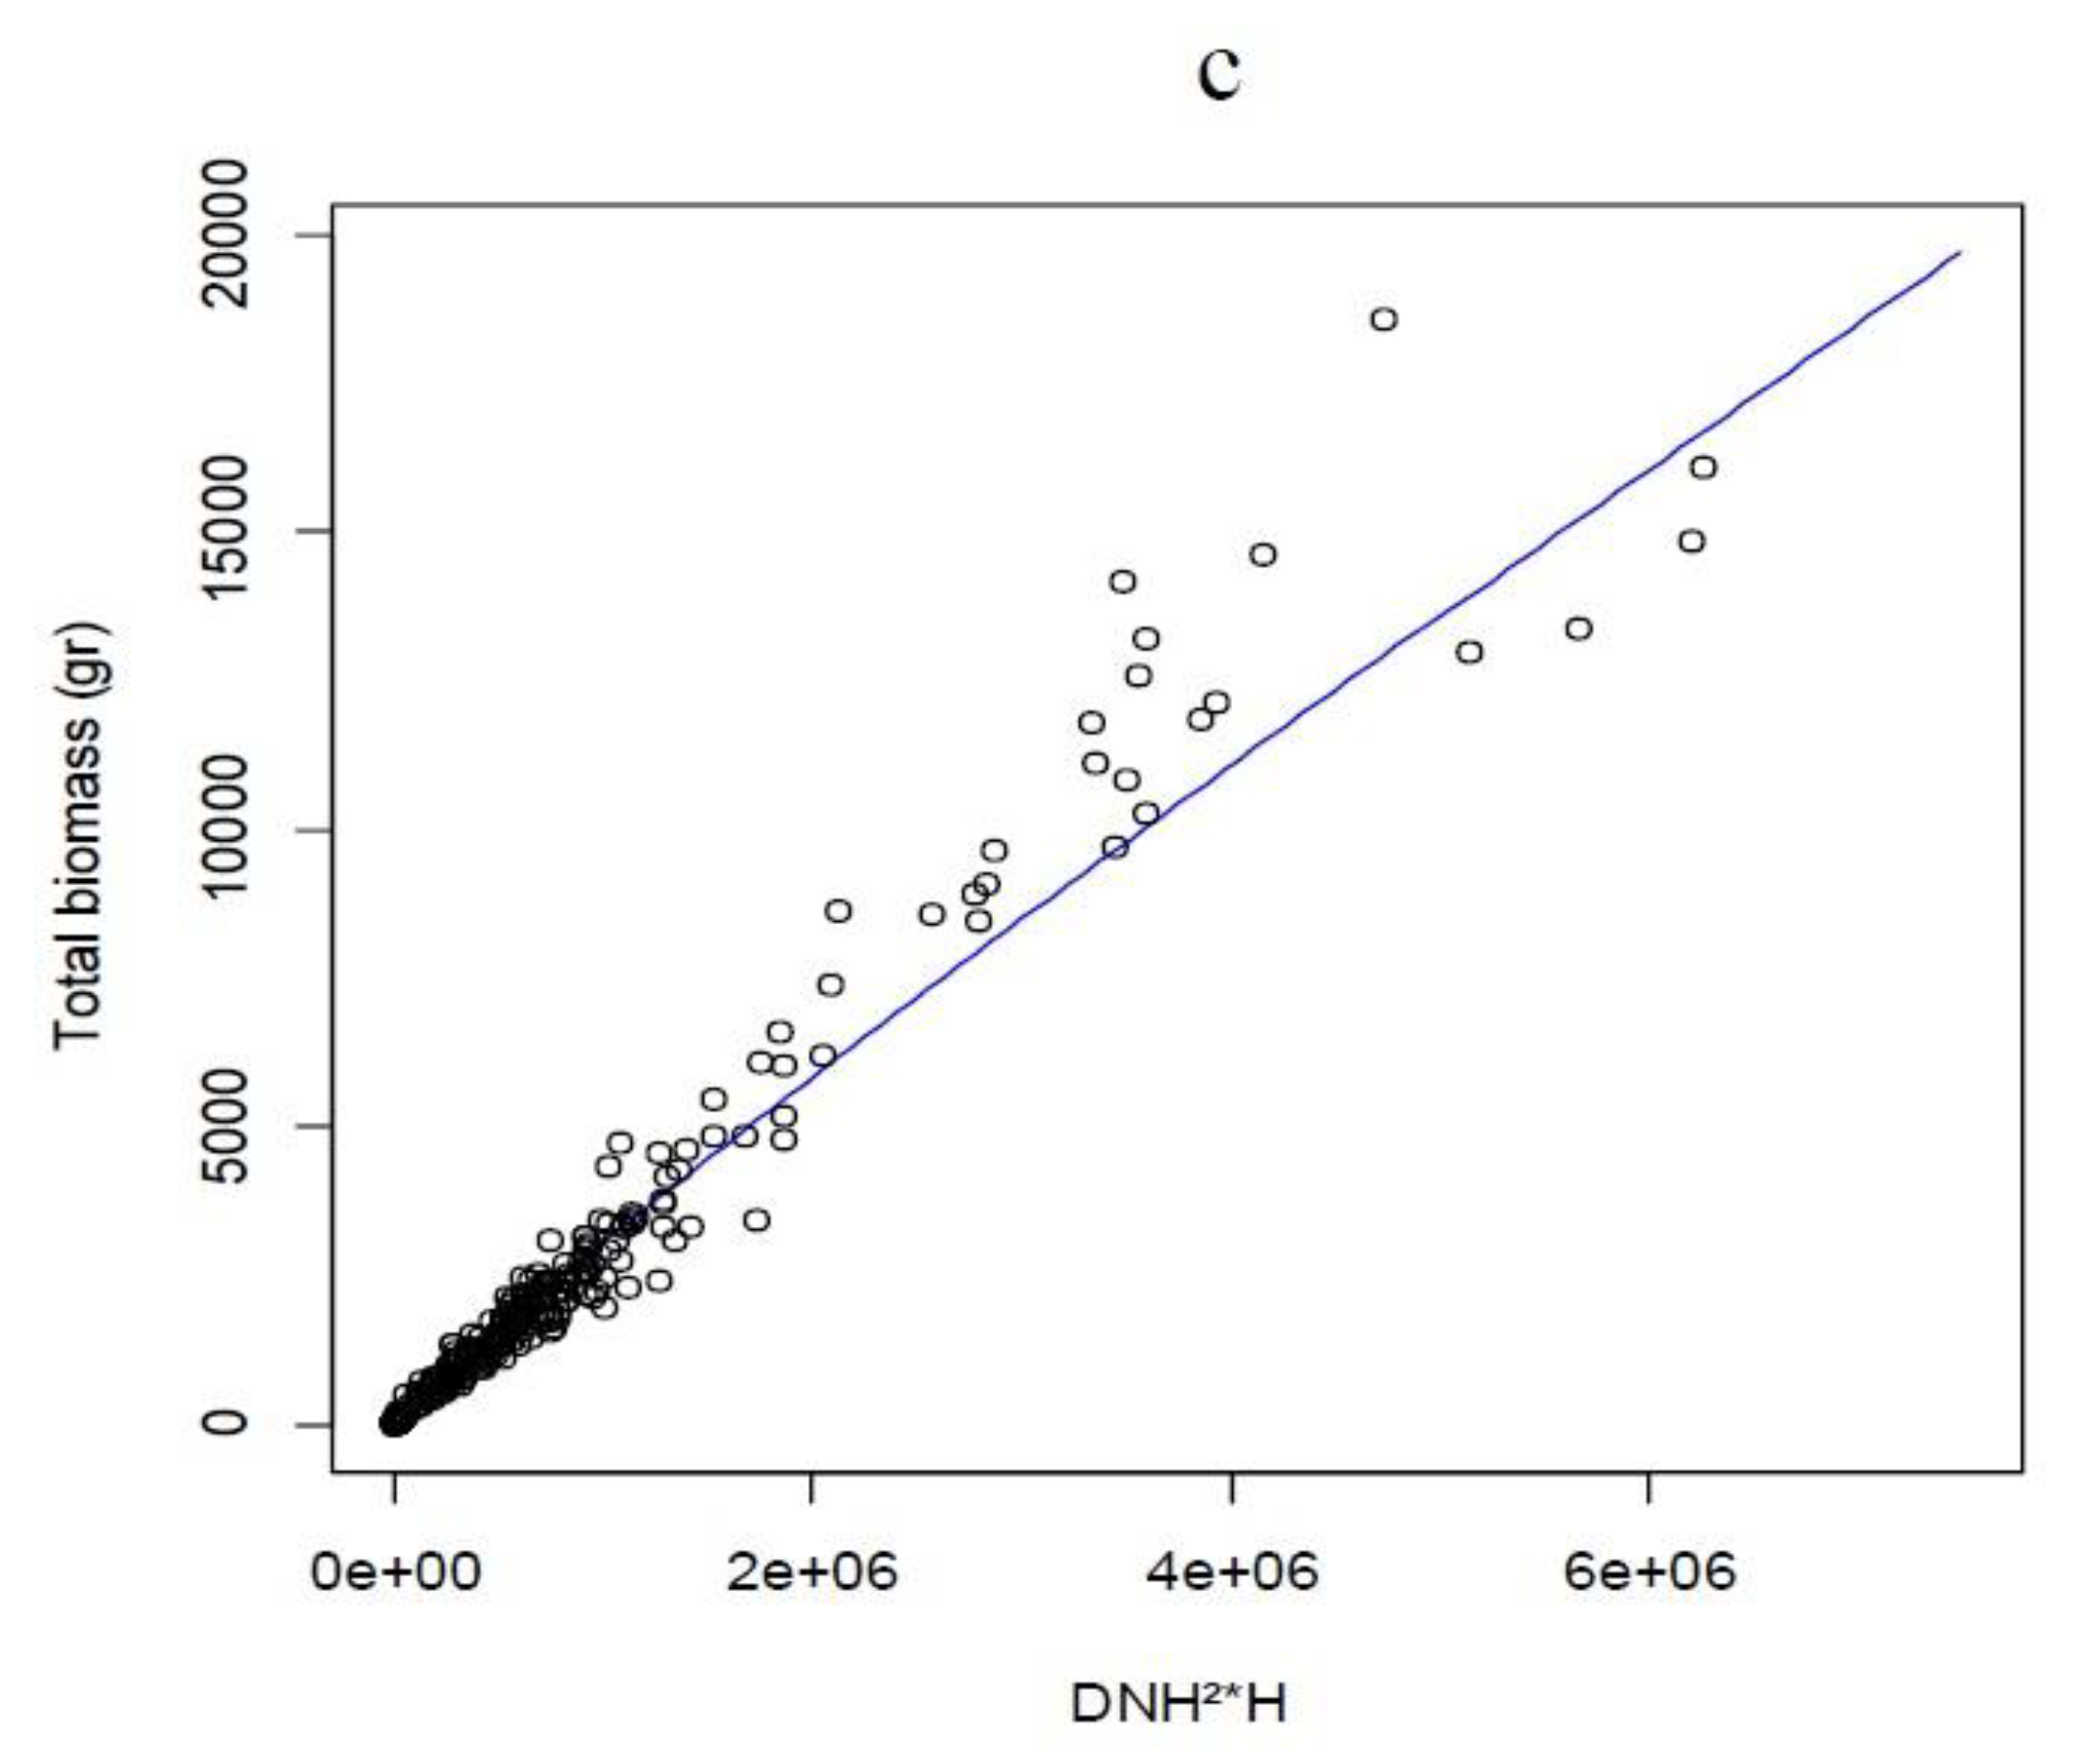
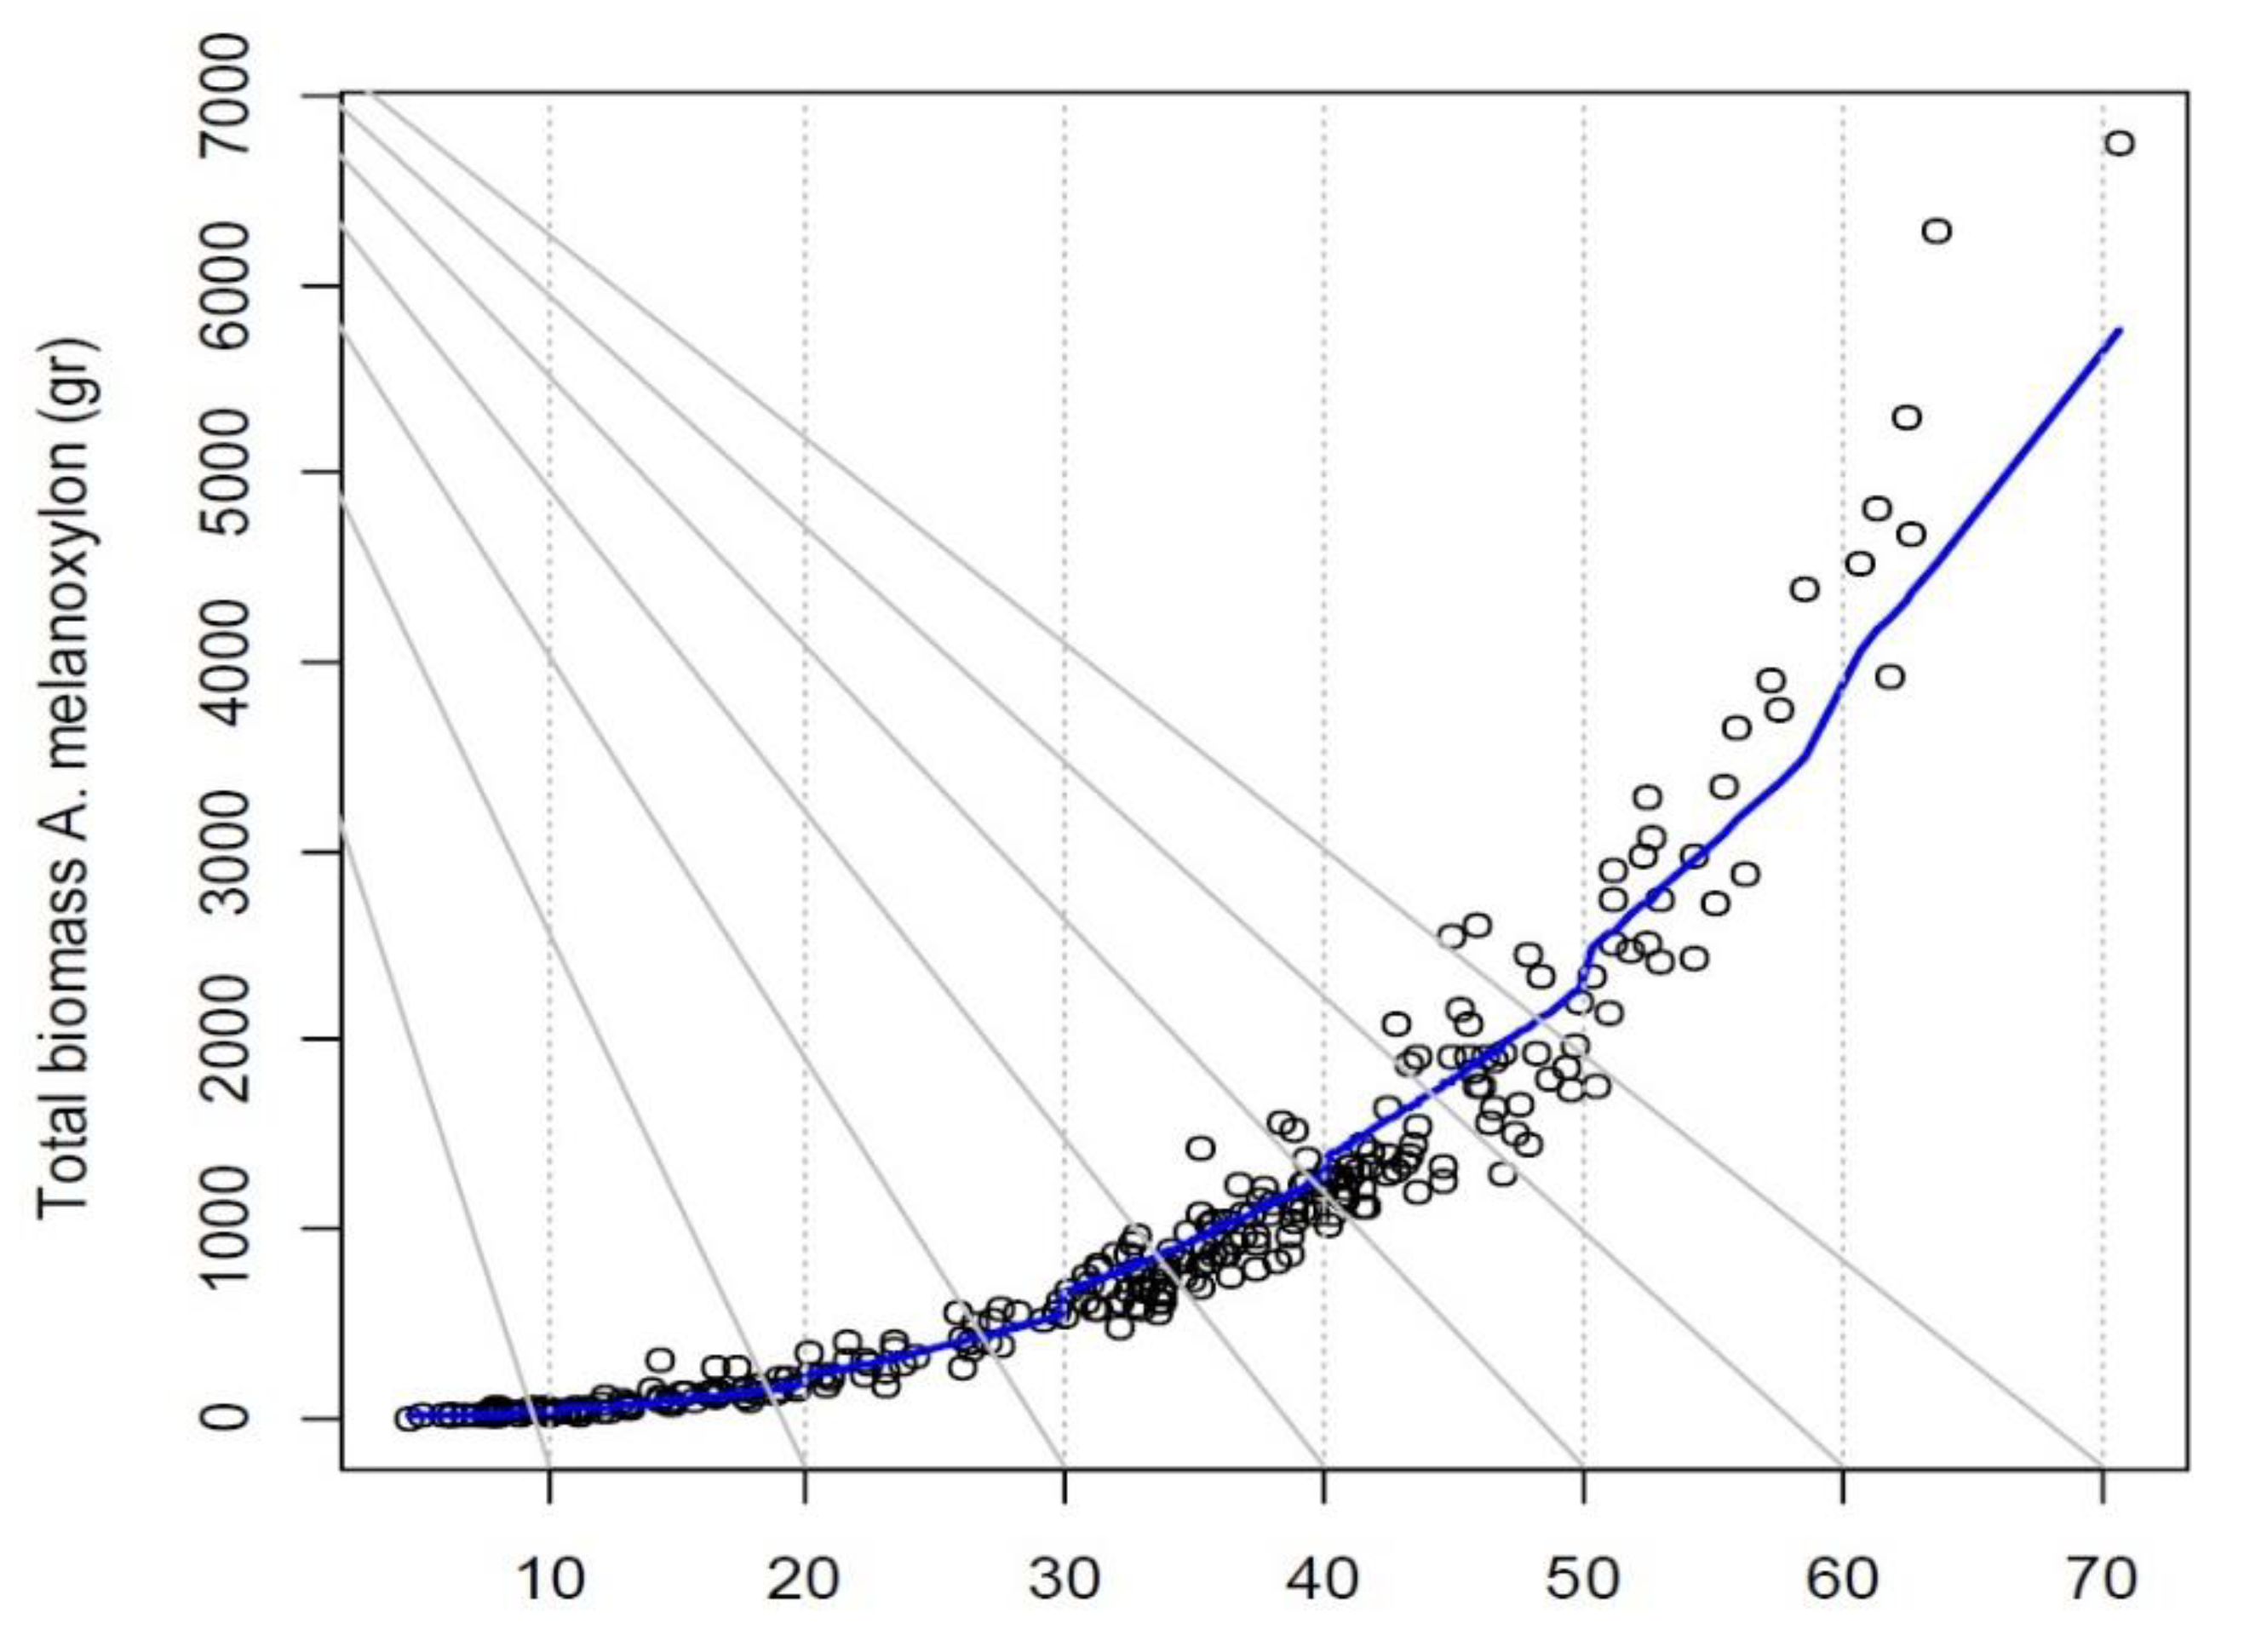
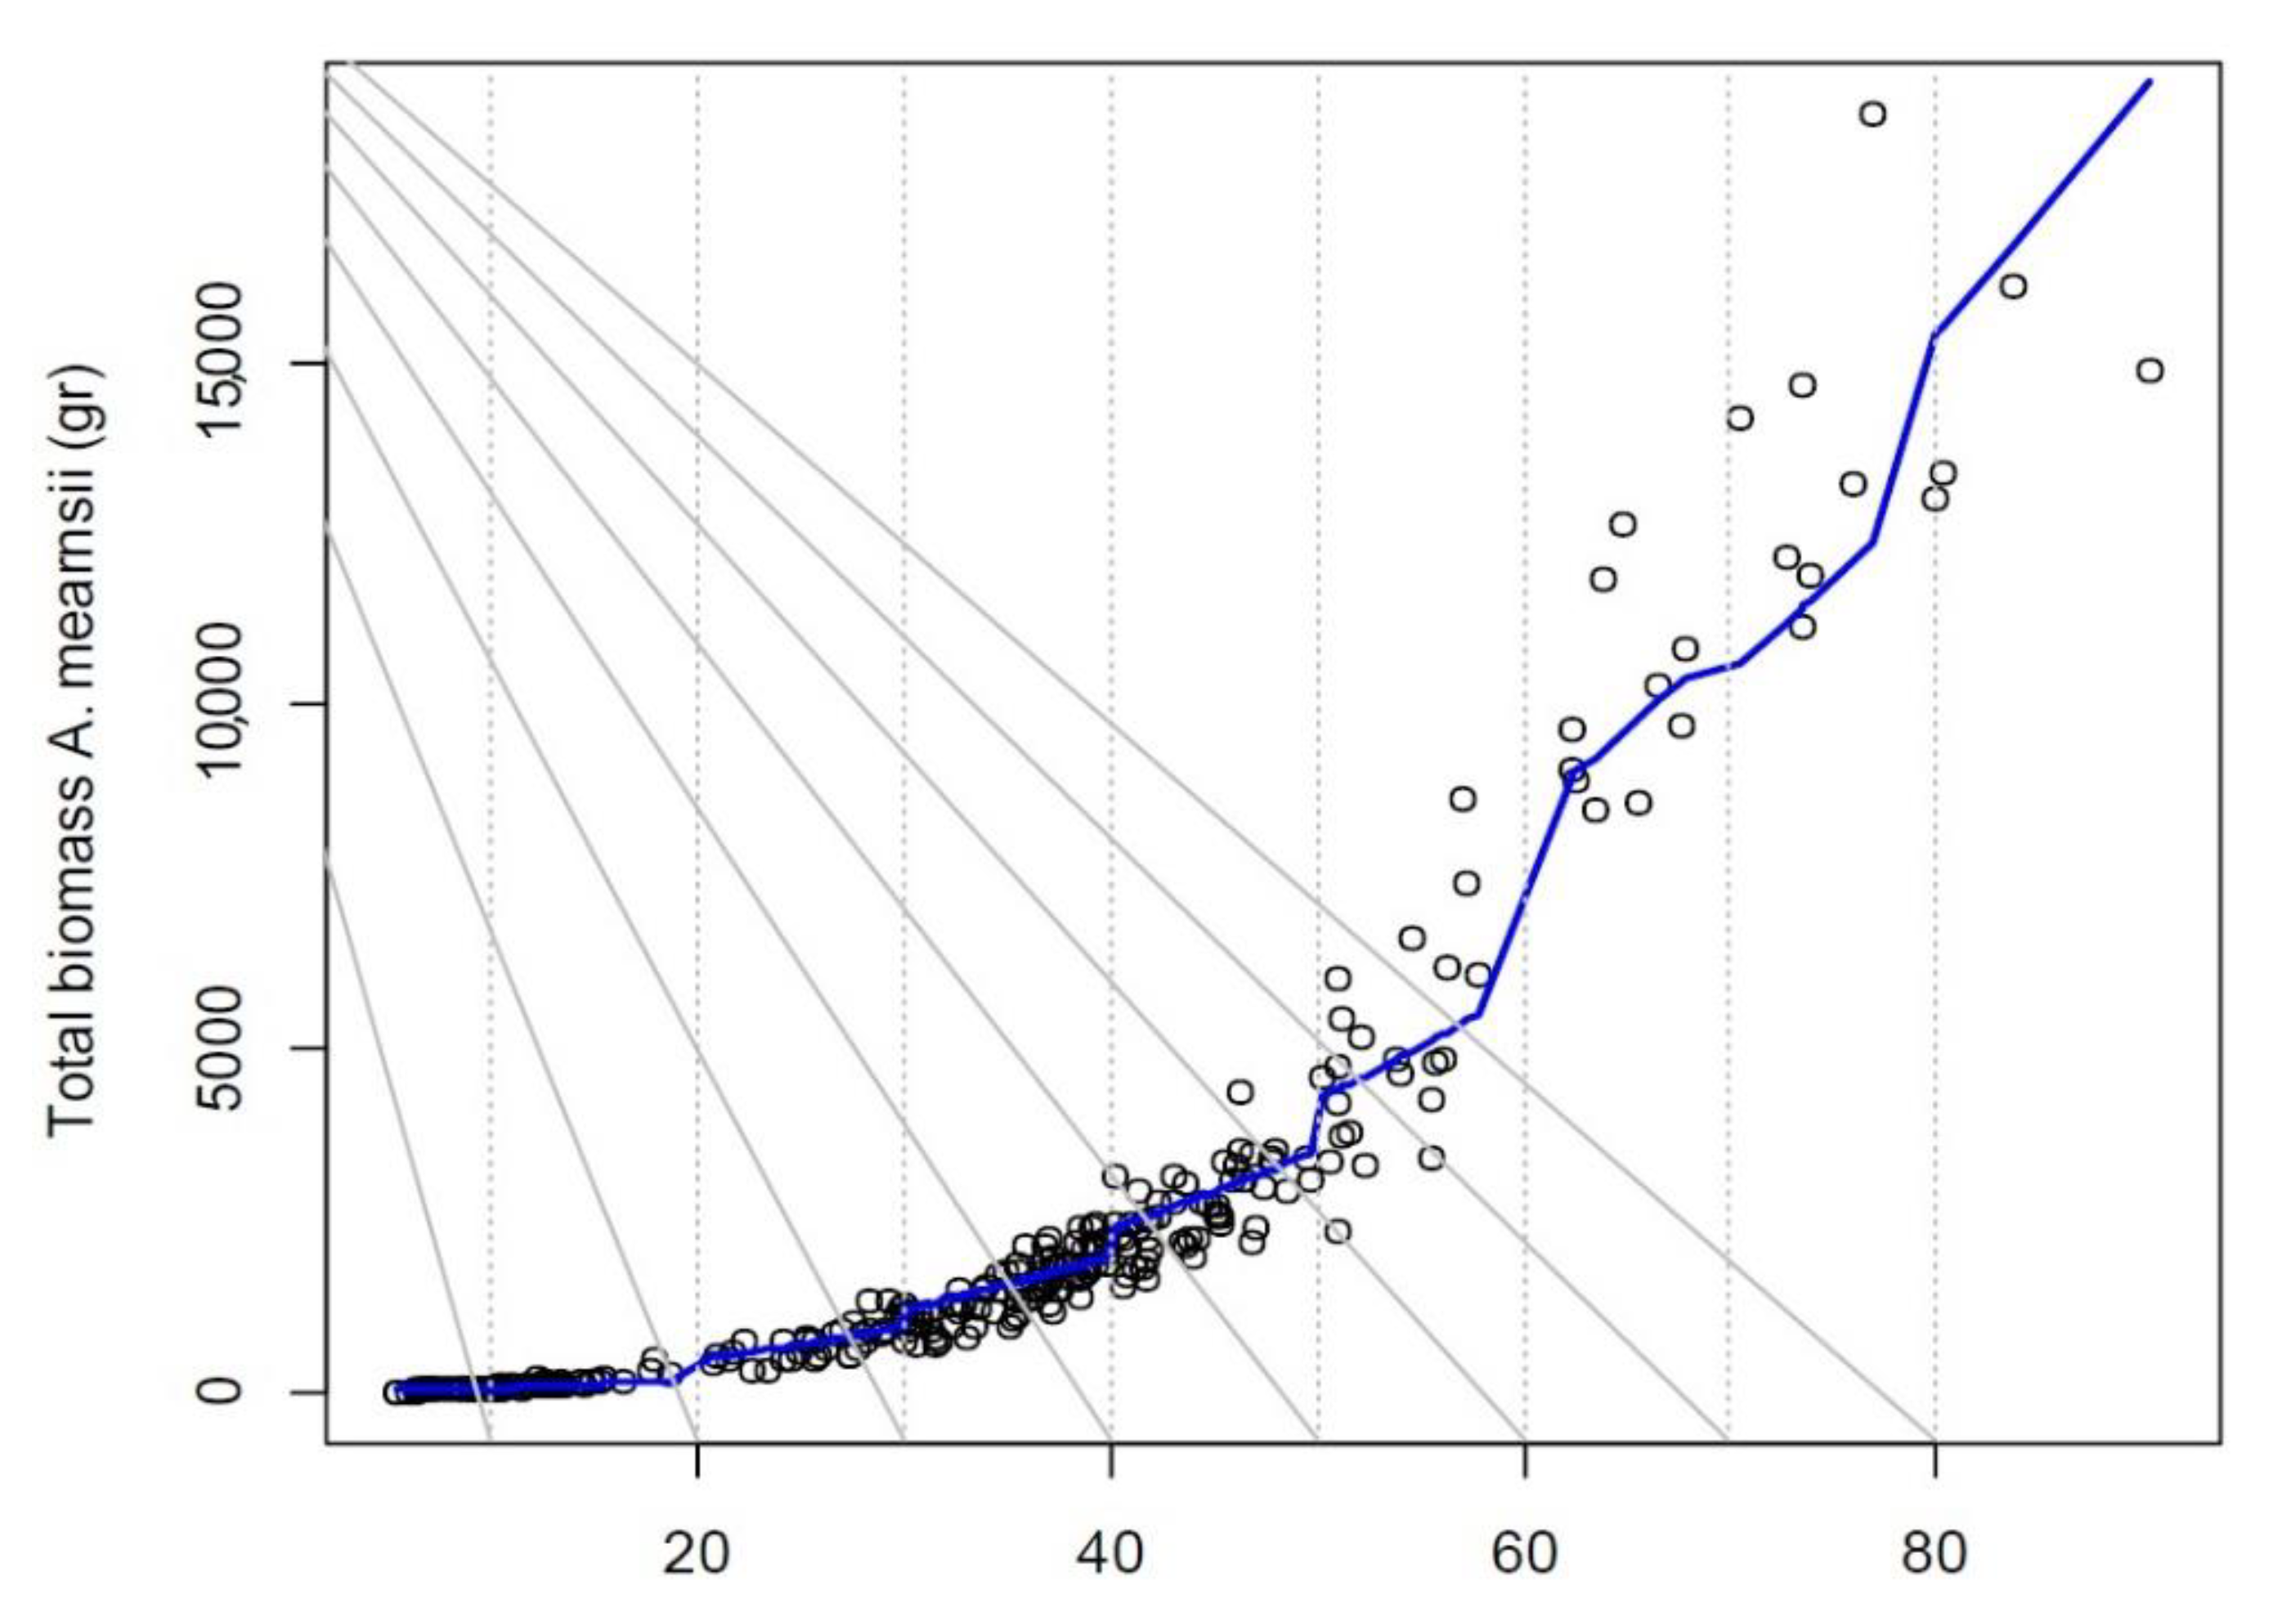
3.1. Classification and Predictive Quality of the Models

Prediction models for total biomass and its components, selected based on their goodness of fit and predictive quality are summarized in Table 2. In this selection, it was not possible to associate a functional form to the hierarchy “species-location-plant density”, so it was not considered in the later analyses.
Models with the best predictions corresponded to those which predicted the total biomass and biomass of the tree stem (Table 2). Models for the prediction of the biomass of leaves and branches did not present good predictive quality.
For the SRWC of Acacia species in this study, the total biomass could be properly estimated through models which consider the separation of data per species (Figure 1), since no significant increase in predictive power was observed when the data was organized by location. The exception for this was the estimation of the stem biomass of A. dealbata and A. melanoxylon, since the estimation bias decreased when organized by species-location hierarchy, which could be associated with the effect of the environmental variables on the biomass production.

3.2. Model Selection by Linear and Non-Linear Regressions

Based on the results of Table 2 it can be stated that there is a linear or near-linear relationship between the biomass of A. dealbata (for components and in total) and the predictor variables. This relationship was previously observed in Figure 1a.
Models which best predicted the biomass of A. melanoxylon included both linear and non-linear forms. In the case of A. mearnsii, all the selected models corresponded to power functions with one or more predictor variables.
Results indicate that the adjustment method was relevant for the generation of less biased models. For the linear regression, the most plausible method was the most adequate procedure as it generated the best goodness of fit and predictive quality. For the linear models, the use of weighted regressions did not yield a relevant goodness of fit.
The best method to adjust the non-linear models was the maximum likelihood method, which assumes the additive error within the model. In this case, the heterogeneity of the variance of the error was addressed by modeling the variance.

3.3. Heteroscedasticity of the Residuals’ Variance

Our results indicate that modeling the error’s variance produced significant differences in the SE estimation when compared to the adjustments obtained using OLS. These differences showed considerably high values for A. dealbata and A. melanoxylon (Table 3). However, confidence intervals of the coefficients did not vary enough to modify the significance of the parameters of each model. Despite this, our results demonstrate the importance of considering the heterogeneity of variance to reduce the uncertainty with which the parameters of each model are estimated.

3.4. Additivity in Systems of Equations to Predict Acacia Species Biomass

The procedures evaluated in this study enabled the prediction of the total biomass of Acacia spp. based on a set of equations additively consistent with each other.
For A. dealbata, method 1 allowed the direct prediction of the total biomass based on independent predictions from the adjusted models for each component, which were previously selected based on their predictive quality. The SUR method permitted the use of the same functional forms (and their corresponding weighted functions), as did method 1. However, the SUR method also considered the possible correlation between errors that affect the biomass components, which is why the selected models were adjusted as a system and the additivity was assured.
For almost all the adjusted parameters, it was observed that the SUR method produced lower SE values. For example, comparing method 1 and the SUR method, the reduction in the estimation of SE varied between 6–64%. Figure 2 shows the model fit for A. dealbata using the SUR method with different DNH intervals based on the adjusted values. The SUR method offered the most precise estimation of the models’ parameters. Therefore, this method increased the probability of obtaining estimations closer to the expected values.
For A. melanoxylon and A. mearnsii, the analysis of standard errors indicated that the estimation precision of the parameters was considerably improved using the NSUR method. Comparing the values obtained by both, the reduction in the estimation of SE varied between 5.5 and 32% in the case of A. melanoxylon (Figure 3) and between 11 and 54% in the case of A. mearnsii (Figure 4). Consequently, the SUR and NSUR methods resulted in more efficient estimations of the parameters for the biomass prediction models of the studied species.

Prediction Intervals for Total Biomass

Results indicate that for A. dealbata and A. melanoxylon, the sample errors of the prediction intervals obtained using SUR and NSUR were lower than those obtained using method 1 or using the direct adjustment of the model, which did not consider the segregation of the biomass into its components (Table 4). Consequently, prediction intervals obtained using apparently uncorrelated regressions were reduced between 12.3 and 16.5% compared to method 1, and between 27.0 and 39.5% compared to the direct adjustment of the prediction model for total biomass (Table 4). Thus, results suggest that the SUR and NSUR methods generate more precise predictions of the total biomass of the three species considered in this study.

4. Discussion

Models for the prediction of the biomass of leaves and branches did not present good predictive quality. This could be because due to the fact that within natural stands the biomass of the canopy varies between trees with similar diameter and height, as was observed by Carvalho and Parresol [26] for Quercus pyrenaica.
Pardé [27] indicated that the leaves’ biomass is a tree component with the greatest variability since unlike total biomass it does not necessarily increase with the growth of the stand. Mäkelä and Vanninen [28] sustained that the increased competition for light promotes the generation of new foliage on the top of the canopy, elevating its base and modifying its form. In this way, the existing allometry between the diameter and the height changes significantly.
Thus, some authors consider the “Pipe model theory”, which suggests that the leaves’ biomass is sustained for a conduction system of vascular tissue whose transversal section area is constant at the base of the canopy [29]. Other researchers maintain that the use of variables such as the stem diameter in the base of the canopy base, the height, and the average diameter of the canopy contribute to explaining the variability of the biomass in the same stand [30,31].
For the SRWC of Acacia species in this study, the total biomass could be properly estimated through models which consider the separation of data per species. The exception was the estimation of the stem biomass of A. dealbata and A. melanoxylon. Regarding this aspect, Campoe [32] indicated that the physical and chemical characteristics of the soil and the water availability of each location could modify the productivity of the crop, altering their allometric relationships. Stands established in clay-textured soils with higher water retention capacity and a higher percentage of base cations, as in Luanco, have registered an increase in the net primary productivity (NPP) and a higher partitioning of carbon in the stem biomass, which is reflected in the adjustment of the prediction functions. Thus, to estimate the stem biomass, using models which consider more than one location is required to avoid estimation errors due to the omission of the effect of environmental factors on the crop’s productivity.
Regarding the model selection by linear and non-linear regressions, Ter-Mikaelian and Koszukhin [33] indicated that the advantages of the power model versus the dependent variable and the predictor variable models lie in the fact that it provides a good balance between the accuracy of the prediction and in that it requires a small quantity of data, as it occurs with the species considered in this study.
Results indicate that the adjustment method was relevant for the generation of less biased models. For the linear regression, the most plausible method was the most adequate procedure as it generated the best goodness of fit and predictive quality. In this case, the advantage could be associated with the adjustment procedure, which considers the exponent c as another parameter to estimate. For the linear models, the use of weighted regressions did not yield a relevant goodness of fit. This could be attributed to the fact that this method requires the previous choice of the exponent, which defines a power model for the variance of the error that only exists in approximated models. In this case, the parameter was estimated based on the linear regression of the logarithm of the standard deviation of the biomass related to the median value of DNH for different diameter classes [22]. An acceptable estimation of the standard deviation depends on the sample size, which may not have been sufficiently large to generate reliable values.
The best method to adjust the non-linear models was the maximum likelihood method, which assumes additive error in the model [10]. This methodology considered the selection of the initial parameters of the model with a previous logarithmic transformation and its subsequent adjustment by linear regressions. In this case, the heterogeneity of the variance of the error was addressed by modeling the variance.
The logarithmic transformation resulted to be irrelevant due to the use of the multiplicative factor (CF) proposed by Baskerville [21], which depends on the estimation of the population variance [34]. In this study, the possible overestimation of the variance could generate an overestimation of the correction factor, increasing the model’s bias. Thus, it should be considered that the transformations which allow for the linearity and/or for the stability of the residual variance could negatively affect other desirable properties of the model.
The validity of the hypotheses and the tests of confidence intervals depend on the fulfillment of the model’s assumptions. Among these, the homogeneity of the variance of the residuals is a relevant requirement. The best predictive quality of this study was obtained by linear and nonlinear regressions whose variances of error were modeled.
Hayes and Cai [35] indicated that it is not easy to generalize the effect of heteroscedasticity on the model inferences. However, these authors pointed out that when the variance of errors is higher at higher predictor variables, as observed in this study, the standard error (SE) estimator tends to underestimate the true value, which results in smaller confidence intervals than the true interval. Thus, there is a risk of considering model variables without a significant relationship with the estimated variables.
Finally, as Judge [36] and Parresol [10] indicated, it could be expected that total biomass prediction models adjusted using GLS or NGLS generate estimations with minimal variance. However, the SUR and the NSUR methods considered the correlation between components of the biomass, which is expected in this study. All the equations’ parameters were estimated simultaneously so that the adjustment of each equation considered the information provided by the other equations. As Zellner [37] stated, the latter results in higher efficiency in the estimation of parameters (minimum variance) since additional information is used to describe the system using a variance-covariance matrix for all the models combined. Thus, if the objective is to predict the biomass of a tree, the use of apparently non-related regressions (SUR and NSUR methods) is recommended.

5. Conclusions

In terms of goodness of fit and predictive quality, the separation of data per species allowed for acceptable estimations of the species’ biomass. However, more precise estimations of the stem biomass can be obtained by separating the data per species and location, which can be associated with the error generated by the omission of environmental variables such as physical and chemical soil properties.
Methods used to adjust the variance heterogeneity of error were more relevant than the functional form adopted. The adjustment of using the maximum likelihood method has the advantages of being applicable to both linear and non-linear models and of being applied directly to the original data without requiring previous transformations that cause estimation bias.
SUR and NSUR methods showed higher efficiency (lower standard errors) in the estimation of the models’ parameters, increasing the probability of obtaining estimations closer to the expected values. These methods allowed an improved efficiency in the prediction of total biomass since their prediction intervals were more tightly bound than those obtained through the direct adjustment of the model. Thus, if the objective is to efficiently predict biomass of Acacia species, the additivity of a set of models which predict biomass per component should be considered.

Author Contributions

Conceptualization, M.A.-V., S.V., A.C.-A. and H.G.; methodology, M.A.-V., S.V., A.C.-A. and H.G.; formal analysis, S.V. and A.C.-A.; resources, M.A.-V. and H.G.; writing—original draft preparation, S.V. and A.C.-A.; writing—review and editing, S.V., A.C.-A., M.A.-V. and R.E.S.-M.; supervision, M.A.-V.; funding acquisition, M.A.-V. All authors have read and agreed to the published version of the manuscript.

Funding

This material is based upon work supported by t INNOVA-CHILE, Project BIOCOMSA No. 08CTE02-06.

Institutional Review Board Statement

Not applicable.

Informed Consent Statement

Not applicable.

Data Availability Statement

Data are available on request from the corresponding author.

Conflicts of Interest

The authors declare no conflict of interest.

References

  1. Goel, V.L.; Behl, H.M. Productivity assessment of three leguminous species under high-density plantations on degraded soil sites. Biomass Bioenergy 2004, 27, 403–409. [Google Scholar] [CrossRef]
  2. Beadle, C.L.; Brown, A.G. Acacia Utilisation and Management-Adding Value: Proceedings of a Blackwood Industry Group (BIG) Workshop, Victoria, Australia, 26–29 April 2006; Rural Industries Research and Development Corporation: Kingston, Australia, 2007.
  3. Albaugh, T.J.; Rubilar, R.A.; Maier, C.A.; Acuña, E.A.; Cook, R.L. Biomass and nutrients mass of Acacia dealbata and Eucalyptus globulus bioenergy plantations. Biomass Bioenergy 2017, 97, 162–171. [Google Scholar] [CrossRef] [Green Version]
  4. Dutcă, I. The Variation Driven by Differences between Species and between Sites in Al-lometric Biomass Models. Forests 2019, 10, 976. [Google Scholar] [CrossRef] [Green Version]
  5. Roxburgh, S.H.; Paul, K.I.; Clifford, D.; England, J.R.; Raison, R.J. Guidelines for constructing allometric models for the prediction of woody biomass: How many individuals to harvest? Ecosphere 2016, 6, 1–27. [Google Scholar] [CrossRef] [Green Version]
  6. Zhao, H.; Li, Z.; Zhou, G.; Qiu, Z.; Wu, Z. Site-Specific Allometric Models for Prediction of Above-and Belowground Biomass of Subtropical Forests in Guangzhou, Southern China. Forests 2019, 10, 862. [Google Scholar] [CrossRef] [Green Version]
  7. Miah, M.D.; Islam, K.N.; Kabir, M.H.; Koike, M. Allometric models for estimating aboveground biomass of selected homestead tree species in the plain land Narsingdi district of Bangladesh. Trees For. People 2020, 2, 100035. [Google Scholar] [CrossRef]
  8. Rahman, M.D.; Donoghue, D.M.; Bracken, L.J.; Mahmood, H. Biomass estimation in mangrove forests: A comparision of allometric models incorporating species and structural information. Environ. Res. Lett. 2021, 16, 124002. [Google Scholar] [CrossRef]
  9. Parresol, B. Assessing tree and stand biomass: A review with examples and critical comparisons. For. Sci. 1999, 45, 573–593. [Google Scholar] [CrossRef]
  10. Parresol, B. Additivity of nonlinear biomass equations. Can. J. For. Res. 2001, 31, 865–878. [Google Scholar] [CrossRef]
  11. Böhm, C.; Quinkenstein, A.; Freese, D. Yield prediction of young black locust (Robinia pseudoacacia L.) plantations for woody biomass production using allometric relations. Ann. For. Res. 2011, 54, 215–227. [Google Scholar] [CrossRef]
  12. Sandoval, S.; Cancino, J.; Rubilar, R.; Esquivel, E.; Acuña, E.; Muñoz, F. Probability distributions in high-density dendroenergy plantations. For. Sci. 2012, 58, 663–672. [Google Scholar] [CrossRef] [Green Version]
  13. Jiban, C.D.; Abdul, M.; Enam, A. An allometric equation for estimating stem biomass of Acacia auriculiformis in the north-eastern region of Bangladesh. South For. 2012, 74, 103–113. [Google Scholar] [CrossRef]
  14. Ríos-Saucedo, J.C.; Acuña-Carmona, E.; Cancino-Cancino, J. Allometric equations commonly used for estimating shoot biomass in short-rotation wood energy species: A review. Rev. Chapingo Ser. Cienc. For. Ambiente 2016, 22, 193–202. [Google Scholar] [CrossRef]
  15. Adam, N.S.; Jusoh, I. Allometric Model for Predicting Aboveground Biomass and Carbon Stock of Acacia Plantations in Sarawak, Malaysia. Bioresources 2018, 13, 7381–7394. [Google Scholar] [CrossRef]
  16. CIREN. Descripciones de Suelos, Materiales y Símbolos. Estudio Agrológico VIII Región; Centro de Información de Recursos Naturales (CIREN): Santiago, Chile, 1999. [Google Scholar]
  17. Morales, L.; Acevedo, E.; Castellaro, G.; Román-Osorio, L.; Morales-Inostroza, J.; Alonso, M.F. A simple method for estimating suitable territory for bioenergy species in Chile. Cienc. Investig. Agrar. 2015, 42, 227–242. [Google Scholar] [CrossRef] [Green Version]
  18. Probosque: Plan de Manejo Forestal. Available online: http://www.probosque.cl/Docs/20151103Plan_de_manejo.pdf (accessed on 14 April 2021).
  19. Universidad Austral de Chile. Análisis Químico de Suelo Predio Santa Luisa; Laboratorio de Nutrición Y Suelos Forestales, Facultad de Ciencias Forestales: Valdivia, Chile, 2004. [Google Scholar]
  20. R Core Team. R: A Language and Environment for Statistical Computing; R Foundation for Statistical Computing: Vienna, Austria, 2016. [Google Scholar]
  21. Baskerville, G.L. Use of logarithmic regression in the estimation of plant biomass. Can. J. For. Res. 1972, 2, 49–53. [Google Scholar] [CrossRef]
  22. Picard, N.; Saint-André, L.; Henry, M. Manual de Construcción de Ecuaciones Alométricas Para Estimar el Volumen y la Biomasa de los Árboles. Del Trabajo de Campo a la Predicción; CIRAD and FAO: Roma, Italy, 2012. [Google Scholar]
  23. Furnival, G. An index for comparing equations used in constructing volume tables. For. Sci. 1961, 7, 337–341. [Google Scholar]
  24. Burnham, K.; Anderson, D. Model Selection and Multimodel Inference: Practical Information–Theoretic Approach, 2nd ed.; Springer: New York, NY, USA, 2002. [Google Scholar]
  25. SAS Institute Inc. SAS/IML® 9.22 User’s Guide; SAS Institute Inc.: Cary, NC, USA, 2010. [Google Scholar]
  26. Carvalho, J.; Parresol, B. Additivity in tree biomass components of Pyrenean oak (Quercus pyrenaica Willd.). For. Ecol. Manag. 2003, 179, 269–276. [Google Scholar] [CrossRef]
  27. Pardé, J.D. Forest Biomass. For. Abstr. 1980, 41, 343–362. [Google Scholar]
  28. Mäkelä, A.; Vanninen, P. Impacts of size and competition on tree form and distribution of aboveground biomass in Scots pine. Can. J. For. Res. 1998, 28, 216–227. [Google Scholar] [CrossRef]
  29. Meadows, J.; Hodges, J. Sapwood area as an estimator of leaf area and foliar weight in cherrybark oak and Green ash. For. Sci. 2002, 48, 69–76. [Google Scholar] [CrossRef]
  30. Hakkila, P. Utilization of Residual Forest Biomass, 1st ed.; Springer Series in Wood Sciences: Berlin, Germany, 1989. [Google Scholar]
  31. Socha, J.; Wezyk, P. Allometric equations for estimating the foliage biomass of Scots pine. Eur. J. For. Res. 2007, 126, 263–270. [Google Scholar] [CrossRef]
  32. Campoe, O.; Stape, J.L.; Laclau, J.P.; Marsden, C.; Nouvellon, Y. Stand level patterns of carbon fluxes and partitioning in a Eucalyptus grandis plantation across a gradient of productivity in São Paulo State, Brazil. Tree Physiol. 2012, 32, 696–710. [Google Scholar] [CrossRef] [PubMed] [Green Version]
  33. Ter-Mikaelian, M.; Korzukhin, M. Biomass equations for sixty-five North American tree species. For. Ecol. Manag. 1997, 97, 1–24. [Google Scholar] [CrossRef] [Green Version]
  34. Snowdon, P. A ratio estimator for bias correction in logarithmic regressions. Can. J. For. Res. 1991, 21, 720–724. [Google Scholar] [CrossRef]
  35. Hayes, A.; Cai, L. Using heteroscedasticity-consistent standard error estimators in OLS regression: An introduction and software implementation. Behav. Res. Methods 2007, 39, 709–722. [Google Scholar] [CrossRef] [PubMed] [Green Version]
  36. Judge, G.; Hill, R.; Griffiths, W.; Lutkepohl, H.; Lee, T. Introduction to the Theory and Practice of Econometrics, 2nd ed.; Wiley: New York, NY, USA, 1988. [Google Scholar]
  37. Zellner, A. An efficient method of estimating seemingly unrelated regressions and test for aggregation bias. J. Am. Stat. Assoc. 1962, 57, 348–368. [Google Scholar] [CrossRef]
Figure 1. Total biomass as a function of its predictor variables for A. dealbata (a), A. melanoxylon (b), and A. mearnsii (c) DNH: diameter of the stem at neck height. H: stem height.
Forests 12 01767 g001aForests 12 01767 g001b
Figure 2. Adjustment of the total biomass of Acacia dealbata using the SUR method as a function of the observed values. The line represents the values adjusted by DNH intervals, considering average height and age values for each diameter class.
Forests 12 01767 g002
Figure 3. Adjustment of the total biomass of Acacia melanoxylon using the NSUR method as a function of the observed values. The line represents the values adjusted by DNH intervals, considering average height and age values for each diameter class.
Forests 12 01767 g003
Figure 4. Adjustment of the total biomass of Acacia mearnsii using the NSUR method as a function of the observed values. The line represents the values adjusted by DNH intervals, considering average height and age values for each diameter class.
Forests 12 01767 g004
Table 1. Descriptive statistics obtained for the predictor variables and the dry biomass for the tree components of Acacia dealbata, Acacia melanoxylon and Acacia mearnsii.
SpeciesParameterAverageS.D.MinMax
A. dealbataDNH 1 (mm)3215.386.380
H total (cm)337.98178.0250807
Age (months)19.517.798.533.2
Wstem (g)837.61194.263.416822.87
Wbranches (g)240.28342.210.691796.16
Wleaves (g)401.76473.183.22598.36
A. melanoxylonDNH 1 (mm)31.1715.054.6970.7
H total (cm)265.05127.712605
Age (months)19.837.988.533.2
Wstem (g)572.93635.850.733985.9
Wbranches (g)165.52207.70.231411.14
Wleaves (g)262.84269.210.091572.07
A. mearnsiiDNH 1 (mm)3317.915.490.4
H total (cm)353.6193.7143895
Age (months)19.947.778.533.2
Wstem (g)1265.552008.90.9111,084.01
Wbranches (g)395.7529.480.12905.15
Wleaves (g)597.64728.661.344742.78
1 DNH: diameter of the stem at neck height. H: stem height. Wstem, Wbranches, and Wleaves are the weight of the stem, branches, and leaves, respectively.
Table 2. Comparison of the total biomass models and biomass of branches, foliage, bark, and stem.
HierarchyFunctional FormVariance ModelFIAICBias%
Total Biomass
A. melanoxylonBtotal = 0.09416 × (DNH)².⁵⁸³⁶(DNH¹.⁷⁸¹⁷)² 2480.58−1.01
A. dealbataBtotal = 46.2256 + 0.00009 × (DNH² × H × A)(DNH¹.⁹⁵²)²184.49 0.11
A. mearnsiiBtotal = 0.009484 × (DNH² × H)⁰.⁹¹⁸⁹(DNH².³¹⁴⁹)² −1.50
Stem Biomass
A. melanoxylon-Santa LuisaBstem = 2.3284 + 0.001276 × (DNH² × H) 9.30 −0.81
A. melanoxylon-LuancoBstem = 0.00027 × (DNH)¹.⁹⁹⁶⁴ × (H)⁰.⁸⁹¹³ × (A)⁰.⁶⁹⁹³ 93.05 −0.10
A. dealbata-SantaLuisaBstem = 6.8092 + 0.001381 × (DNH² × H)(DNH¹.⁸⁰⁶⁶)²11.48 0.06
A. dealbata-LuancoBstem = 0.0001065 × (DNH² × H × A)⁰.⁹⁵⁸²(DNH².⁴⁹³⁸)² 1667.52−0.68
A. mearnsiiBstem = 0.0004323 × (DNH)¹.⁷⁴⁸⁴ × (H)¹.⁰⁶⁰² × (A)⁰.⁵⁹⁹⁷(DNH².³⁶⁵⁶)² 2391.77−0.80
Branches Biomass
A. melanoxylonBbranches = 0.009182 × (DNH)².¹²⁹⁶ × (A)⁰.⁶⁹⁵⁴(DNH².⁰⁵⁰⁴⁴)² 1997.17−8.30
A. dealbataBbranches = 4.9792 + 0.000014 × (DNH² × H × A)(DNH².³¹⁸⁵)²44.50 6.82
A. mearnsiiBbranches = 0.002183 × (DNH² × H)⁰.⁸⁹⁹³(DNH².²⁹¹⁰⁶)² 2135.160.08
Leaves Biomass
A. melanoxylonBleaves = 12.168 + 0.00059 × (DNH² × H)(DNH¹.³⁸⁸²)²71.60 −5.56
A. dealbataBleaves = 20.0042 + 0.000613 × (DNH² × H)(DNH¹.⁸⁰¹⁸)²72.58 10.35
Table 3. Heteroscedasticity in the estimation of the total biomass of A. dealbata, A. melanoxylon, and A. mearnsii.
SpeciesParametersAdjusted Using OLSAdjusted Using Variance Model
Estimated ValueS.E.t ValueProb (>|t|)IFConfidence IntervalEstimated ValueS.E.t ValueProb (>|t|)FIConfidence IntervalDifference in Se (%)
A. dealbataa1205.4835.445.800400.5(134.59 276.36) 46.233.7812.210184.52(38.66 53.8)−89.32
b18 × 10−51.33 × 10−659.230(7.7 × 10⁻⁵ 8.3 × 10⁻⁵)9 × 10−52 × 10−654.630(8.6 × 10⁻⁵ 9.4 × 10⁻⁵)50.83
A. melanoxylona10.022330.0054394.104702719.72(0.01145 0.0332)0.09420.015036.261402480.58(0.06414 0.1243)176.34
b12.96020.06247.74440 (2.8362 3.0842)2.58360.043259.85290 (2.4972 2.67)−30.39
A. mearnsiia10.004740.0013083.62284 × 10−43150.61(2.1 × 10⁻³ 7.4 × 10⁻³)0.0094840.0013347.106602629.13(0.0068 0.012)1.99
b10.97070.0184752.54170 (0.9338 1.0076)0.91890.010487.62280 (0.8981 0.9397)−43.69
Table 4. Prediction intervals of 95% to estimate the total biomass based on the average values of the predictor variables.
SpeciesAverage Values Prediction Interval of the Individual ModelPrediction Interval: Method 1Prediction Intervals: SUR and NSUR Method
DNH (mm)Height (cm)Age (months)
A. dealbata3233820697.88 g ± 663.14 g719.32 g ± 459.13 g704.7 g ± 402.44 g
A. melanoxylon3126520663.04 g ± 382.45 g627.91 g ± 334.28 g658.372 g ±279.13 g
A. mearnsii33354201284 g ± 549.84 g1201.84 g ± 514.53 g1252 g ± 557.517 g
Publisher’s Note: MDPI stays neutral with regard to jurisdictional claims in published maps and institutional affiliations.

