Article

Hydrological Droughts in the Białowieża Primeval Forest, Poland, in the Years 1951–2020

1
Department of Water Engineering and Applied Geology, Institute of Environmental Engineering, Warsaw University of Life Sciences-SGGW, ul. Nowoursynowska 159, 02-776 Warsaw, Poland
2
Water Center, Warsaw University of Life Sciences-SGGW, Ciszewskiego 6, 02-776 Warsaw, Poland
*
Author to whom correspondence should be addressed.
Forests 2021, 12(12), 1744; https://doi.org/10.3390/f12121744
Submission received: 5 November 2021 / Revised: 3 December 2021 / Accepted: 7 December 2021 / Published: 10 December 2021
(This article belongs to the Section Forest Hydrology)

Abstract

:
The occurrence of hydrological drought, caused by rainfall deficiency, poses a threat to forest areas—not only due to the danger of fire, but as a result of changes in habitat conditions. It is predicted that more frequent periods of drought and high temperatures will reduce the stability of forests and increase their susceptibility to industrial pollution, pressure from insect pests, fungal pathogens, and fires. The main aim of this study was to investigate the current streamflow droughts in the catchment area of the Narewka River as an indicator of hydrological droughts in the Białowieża Primeval Forest for the period 1951–2020. The research presented in this paper shows that low flows of surface waters have appeared as an indicator of hydrological droughts almost every year since 1983. The analysis of the trend over the past 70 years shows that the aggregated annual volumes of low flows and the number of days with low flows are increasing significantly. This indicates a significant and relatively permanent change in the seasonal structure of the river runoff in the event of low summer flow.

1. Introduction

1.1. Thermal Anomalies and Frequency of Hydrological Droughts

One of the manifestations of modern climate warming is significant changes in the frequency of thermal anomalies. In Poland, as in the rest of Europe, asymmetric warming is being observed. This is caused more by an increase in the frequency of anomalously warm months than by the decrease in anomalously cold months [1]. In the 20th century, extremely frosty winter periods were a problem, while from the end of the 20th century, extremely hot summer periods as well as very warm spring and autumn periods have appeared more and more often. Warming was also expressed by an increase in the range of abnormally warm months in the early 2000s in Europe. The observed anomalously warm periods are among the extreme climatic phenomena affecting nature, human health and wellbeing, and many areas of the economy [2]. In Poland, periodic droughts with deep low flows of rivers, as well as floods, are characteristic of this climate. However, the frequency and intensity of droughts is increasing, and climate change in Poland manifests to the greatest extent in the temperature and heat stress records [3,4]. Projections of future floods and hydrological droughts in Europe under a + 2 °C global warming show that for a significant part of Europe there will be a clear intensification of the hydrological cycle, resulting in increases in both droughts and floods [5]. The classification of the early 21st century in terms of water abundance, based on the assessment of total outflow of Polish rivers in 1951–2020, showed that 2003, 2012, 2015, 2016, 2019, and 2020 were dry. Over the years, 2015, 2019, and 2016 turned out to be the least water abundant (V2015year = 40.8 km3, V2019year = 41.2 km3; V2016year = 41.4 km3)—the outflow volume was so small that in the past 70 years (1951–2020) only 1954 was drier, with an outflow equal to 37.3 km3 [6].

1.2. The Impact of Drought on the Functioning of Forests

The occurrence of hydrological drought as the last stage in the process of development of the phenomenon of drought, caused by rainfall deficiency, poses a threat to forest areas—not only due to the danger of fire, but also as a result of changes in habitat conditions. It is predicted that more frequent periods of drought and high temperatures will reduce the stability of forests and increase their susceptibility to industrial pollution and the pressures of insect pests and fungal pathogens, as well as fires. Additionally, long-lived forest trees may also have problems adapting to changing habitat conditions [7]. There has been a strong increase in biotic (forest pest) and abiotic (droughts) disturbances in Central European forests in recent years [8]. Forecasts suggest that the forests of Northern Europe will receive an increased supply of water in spring, but will be subject to more frequent and intense droughts in summer [9]. A common phenomenon occurring in many European countries is the dieback of oaks, probably as a result of changes in water conditions [10], as a consequence of long-term droughts, heatwaves, and the related fluctuations in groundwater levels or sudden and severe frosts [11].

1.3. The Species Most Sensitive to Drought

During a hydrological drought, the groundwater resources that supply the flows in watercourses are depleted, sometimes until the groundwater aquifer is completely depleted. The most vulnerable plant communities to changes caused by the negative effects of river lowlands are mainly in areas associated with river valleys and adjacent sandy areas with shallow groundwater levels. The arising disturbances in the water management of forest habitats may cause very profound changes in the species of plant communities. One of the species more susceptible to drought is shallow-rooting spruce [7]—the host tree of the spruce bark beetle. This species is highly vulnerable to the increasing frequency and severity of drought events associated with recent climate change. Norway spruce is a boreal species; thus, it is cold-adapted but drought-sensitive [12]. As a result of a significant water shortage resulting in an increase in the number of weakened trees with low defense potential, the population of the spruce bark beetle may increase rapidly—as in the case of windbreaks, where overturns and scraps constitute an excellent “easy” breeding material for the bark beetle—and the thermal conditions that are extremely favorable for its reproduction are largely derivative of the hot and dry growing season and a long and warm autumn, as was the case during the catastrophic drought of 2015 in Poland [13].

1.4. Forecasts of the Impact of Climate Change on the Functioning of Forests

According to [14], forecasts of changes in basic climatic parameters (e.g., temperature, precipitation) for selected aspects of forest functioning in Europe (including geographical ranges, competitive ability, or the broadly understood forest-forming role of basic tree species) were already developed in the early 1990s. The obtained results clearly indicated the high sensitivity of the existing forests to the forecast climate changes. The results of the simulations showed significant shifts in the current range boundaries of the species (especially spruce, pine, beech, and sessile oak) in the general direction from the southwest to the northeast. The main factor causing these shifts would be an increase in temperatures in winter. With regard to the area of Poland, the results obtained in the above-mentioned studies suggested a far-reaching limitation of the forest-forming role of spruce and pine (in theory, a complete withdrawal of these species from the territory of the country) and a clear increase in the roles of beech and sessile oak [14]. Contemporary forecasts [15] on the impact of climate change on the future condition and production potential of forests in Europe indicate that under future climatic conditions the spatial distribution of the main types of European forests will change; they also state that the impact of climate change on Europe’s forests is already clearly visible today. Spruce, being the species of greatest productive importance in Europe, is giving way to the western, southern, and central areas of its current range, and is moving north (northern Sweden, Finland, and Norway). Similarly, in the case of deciduous species such as oak and beech, the simulation results show significant shifts in ranges and the retreat of these species from areas where they currently dominate (i.e., France, the Netherlands, Germany, Central and Eastern European lowlands), and suggest their expansion into Northeast Europe. Brzeziecki [14] presents attempts to quantify the impact of changes in selected bioclimatic parameters on tree growth in Polish literature. A moderate (up to 20%) increase in the effective temperature (which is a measure of the amount of heat in the growing season) causes a strong decline in the competitive ability and viability of species such as spruce in the conditions of the highlands region, while in the case of the lowlands the same direction of changes is observed, but not as intense. Interesting research by Zajączkowski et al. [16], presented by Brzeziecki [14], was carried out for the lowlands of Poland; the results clearly show that future climatic conditions (assuming an increase in the maximum temperature in the spring months (April–June) of 3 °C, and 4 °C in the remaining months, a similar increase in the minimum temperature, and a 10% increase in precipitation in autumn and winter, with a similar decrease in the remaining months) will significantly deteriorate the degree of water supply for forest tree species in practically the entire lowland area of Poland. The most endangered species were spruce, fir, beech, black alder, and ash. The warty birch, Scots pine, and English oak were relatively less affected by this problem. On the other hand, the projected temperature increase itself had a rather positive effect on all the species under consideration.
Another important consequence of the disruption of tree life processes due to climate change is their reduced role in air pollution reduction processes. In the future, phytotoxic ground-level ozone concentrations are projected to increase in the northern hemisphere at a rate that depends on emission scenarios. Under severe drought conditions, the uptake of ozone by trees decreases [17] and, thus, so too does their positive role in maintaining air quality.

1.5. Białowieża Primeval Forest—Case Study

The research area under consideration concerns the Narewka River catchment area which, together with its tributaries, discharges water from the central and northern parts of the Białowieża Forest to the Narew River, lying in the Vistula River basin. The Białowieża Primeval Forest is located in the northeastern part of Poland. The importance of the Białowieża Primeval Forest for the preservation of nature on a global scale is emphasized by the fact that this area is covered by several international forms of nature protection. The Białowieża Forest is one of the 10 UNESCO Biosphere Reserves established in Poland, which protect the unique natural and cultural values of the area. In 2008, the entire Polish part of the Białowieża Primeval Forest was under protection in the form of the Natura 2000 PLC200004 area. In June 2014, the area of the entire Białowieża Primeval Forest was recognized as a UNESCO World Heritage Site, obliging Poland to guarantee full protection of the natural processes taking place there and the proper protection status of the entire spectrum of organisms and species groups that make up the unique diversity of this ecosystem [18].

1.6. Research in the Narewka River Catchment Area

Research conducted in the Narewka catchment on the influence of climate change on hydrological extremes forecasts an increase in air temperature and precipitation in the years 2021–2050 and beyond (2071–2100) [19]. The expected impact of climate change on the outflow of rivers in the Vistula River basin indicates the predominance of increases in low and high flows. These results suggest that future hydrological droughts may be less severe than today, while the risk of flooding may increase. However, when interpreting these results, the authors indicate that caution should be exercised, in the case of both low and high flows [20]. Previous detection of long-term trends in river flow indices in Poland over two time intervals (1956–2016 and 1981–2016) in small and medium-sized catchments with relatively unmodified flow regimes show decreases in river flow dominating in the northern part of the country (including in the Narewka catchment), while increases usually dominate in the southern part [21]. Research conducted at the Białowieża National Park (BPN) as a part of Białowieża Primeval Forest in the period 1985–2001 showed that some elements of the water balance changed. At the end of the analyzed years, long rainless periods were also noted, occurring in spring and autumn, along with the occurrence of snowless winters, during which the lack of a thick snow cover resulted in the disappearance of melt floods in the watercourses and a reduction in the appropriate amount of water stored in the soil at the beginning of the growing season. An increase in temperature was also observed, increasing the loss of water to evaporation and transpiration [22]. The groundwater table level in the forest wetlands biotope (Białowieża forests) became lower during the 1985–2004 period [23]. Subsequent studies [12] concerning the occurrence of atmospheric droughts in the Białowieża Primeval Forest in the period 1951–2015 confirmed that there was global warming compared to the changes observed in the entire Northern Hemisphere. It was also found that droughts and an increase in air temperature are the factors determining the dieback of spruce in the Białowieża Primeval Forest [12]. The changes taking place in the stands of the Strict Reserve of the Białowieża National Park, monitored for ~80 years, show that during this period there was, inter alia, a significant decrease in the role of spruce (a species associated with a cool and humid climate) in these stands. On the other hand, an increase in the role of linden—and especially hornbeam (species associated with a warmer climate and more resistance to drought)—was found [14].

1.7. Aim of the Study

The main aim of this study was to investigate the current streamflow droughts in the catchment area of the Narewka River as an indicator of hydrological droughts in the Białowieża Primeval Forest, and to establish whether the disturbing changes observed in thermal anomalies [1] and the structure of precipitation [24] also apply to the region of the Białowieża Primeval Forest. We examined whether, in recent years, the low flows of the Narewka River have been characterized by greater intensity and severity concerning their long-term average values, and whether they show the direction of changes in the outflow regime from the Białowieża Primeval Forest or, on the contrary, whether the results show that the low-flow outflow regime of the studied area is resilient despite the observed climate changes. This work is a continuation of the considerations stated in the article by Ciepielowski and Kaznowska [7]. The studies conducted thus far have concerned the period 1951–2005, and the present paper additionally covers the past 15 hydrological years (1951–2020), including many years with deep low flows of Polish rivers.

2. Materials and Methods

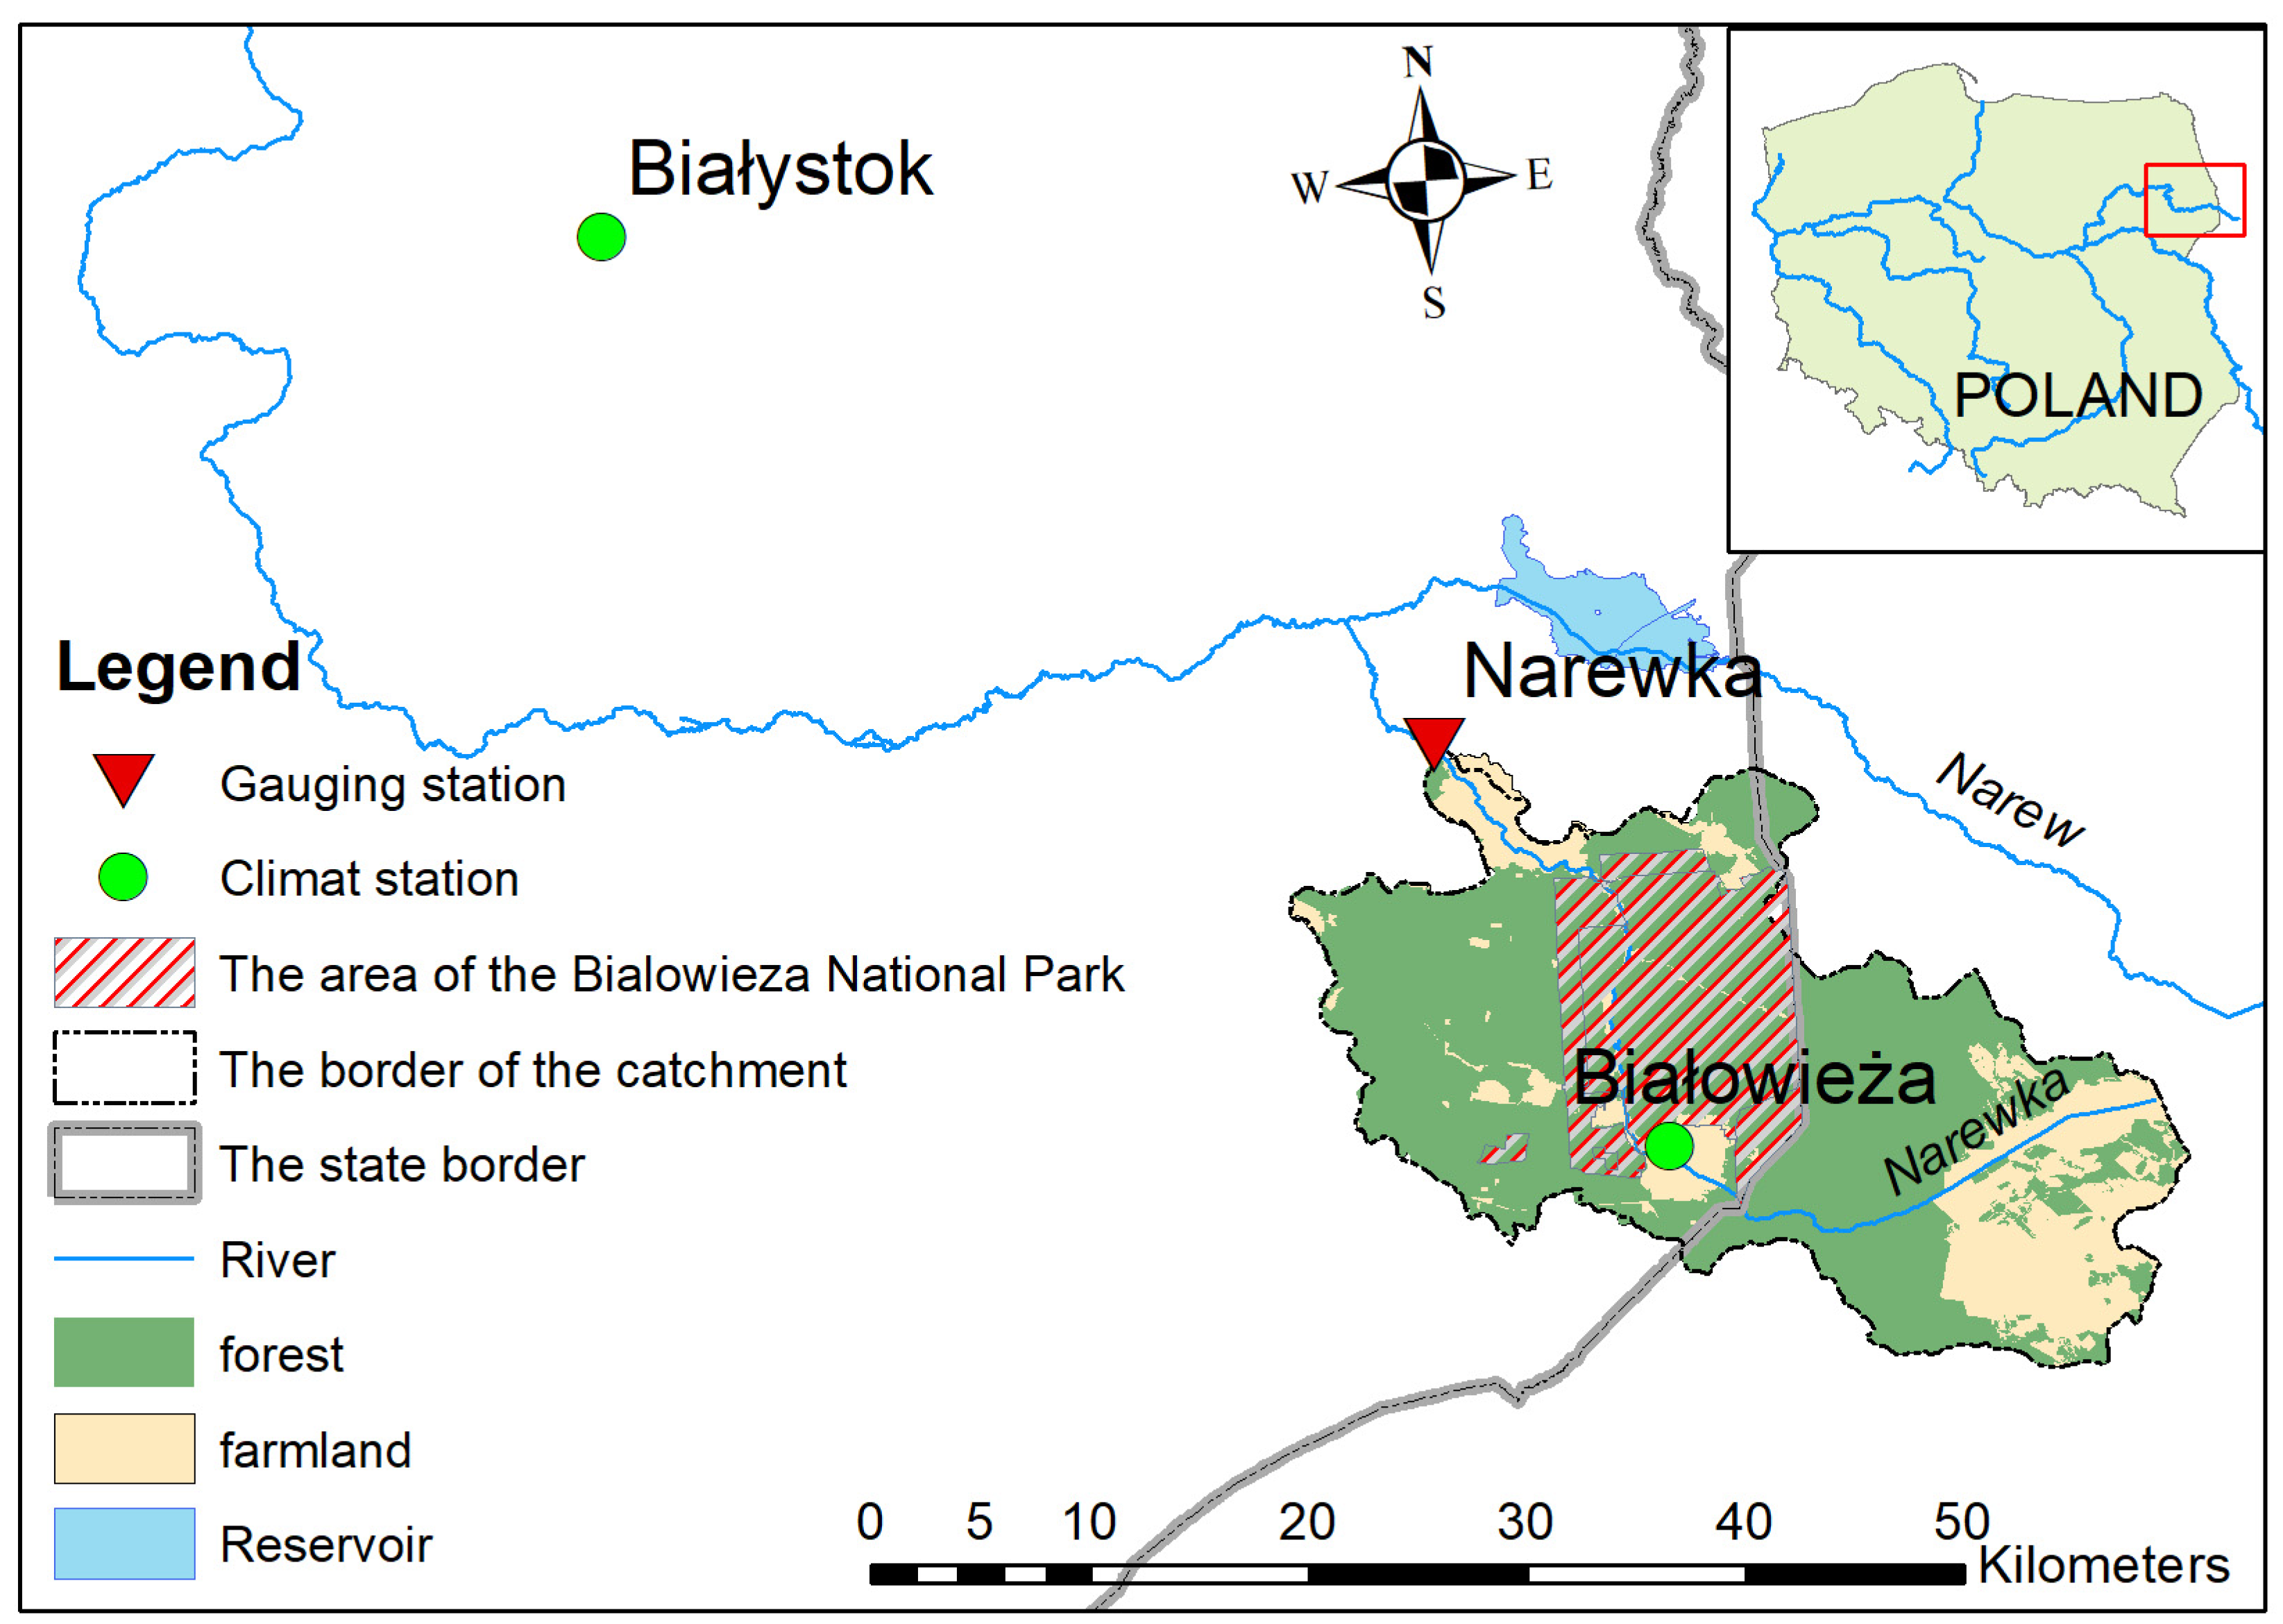
2.1. Watershed Land Use

The Narewka River catchment is situated in the northeastern part of Poland in the Białowieża Forest area, which is a large forest tract, with natural forests predominating, spreading its space in both Poland and Belarus (Figure 1). The Białowieża Forest constitutes 73% of the catchment, while meadows and marshes in the Narewka River lowland form most of the remaining part [7]. Wet deciduous and mixed forests cover approximately 14.5% of the Białowieża Forest [25]. For the most part, Białowieża Forest is composed of multispecies stands [12]. Spruce is one of the main species constituting the tree stands of Białowieża Forest. Coniferous and mixed coniferous stands account for 52% of the total area, wet broadleaved forests 20%, rich mesic broadleaved forests 15%, and successional stands 13%. The most common tree species are Norway spruce (26%), Scots pine (24%), black alder (17%), pedunculated and sessile oaks (12%), and birch sp. (11%) [12,26]. The high degree of the forest’s naturalness is reflected in the high richness of lichen species and the presence of many lichen relicts of the primeval forests [27]. The Białowieża Forest reserve is one of the last and largest fragments of original European lowland forest. From the 14th until the beginning of the 20th century, the Białowieża Forest served as an extensive royal hunting area and, therefore, escaped the widespread colonization and commercial timber extraction that occurred in most European forests. During World War I, the forest was exploited on a mass scale [28]. Currently, the forests of the Polish part of the Białowieża Forest, with an area of ~620 km2, are mostly (83%) managed by the State Forests—National Forest Holding, and are used as part of the forest management conducted by three forest districts: Białowieża (123 km2—19%), Browsk (204 km2—32.5%), and Hajnówka (196 km2—31.5% of the area) [18]. The forest covers an area of approximately 1500 km2, of which 630 km2 is in Poland and 870 km2 in Belarus. The entire Belarusian part is under protection in the form of a National Park, many of which are under strict protection. In Poland, the entire forest is a UNESCO World Heritage Site and a Natura 2000 area, but the Białowieża National Park (BNP) covers 17% of the forest [29]. The Białowieża National Park (BNP), with 10,517.27 ha in size today, is located in the central part of the catchment, of which 6059.27 ha is under strict protection. The remaining area of Białowieża Forest is managed forest, but this part also has nature preserves and sites with protected tree stands, habitats, and species [12].

2.2. Hydrography and Hydrogeology

The Narewka River is situated in the Belarussian part of the forest at an altitude of 159 m a.s.l. The catchment area up to the Narewka gauging station, on both the Polish and Belarussian sides, is 635.4 km2 in size, of which 346.2 km2 is in Poland. The Narewka water gauge closing the catchment area is located in the town of Planta. The shape of the catchment area is compact and elongated, and the catchment area is symmetrical. The river’s slope is slight, at 0.4‰, and its length is 50.1 km. The upper sector of the river in Belarus is regulated and the catchment is managed. From the Poland–Belarus frontier, the Narewka River flows through the High Bog forest reserve, and then it goes through the Białowieża locality. In that sector, the Narewka River had already been regulated in the 18th century, but the final straightening of its channel was done in the early 1960s [7]. The regulations were related to the water transport of timber, and required the elimination of a large part of the meanders. In the 1950s and 1960s, drainage works were carried out in the forest in order to drain meadows, swamps, and forest areas along the watercourses. In the postwar years, a large area of marshes was drained in Belarus—the bogs of Dziki Nikor and Kuta, which are the spring areas of Narew, Narewka, and Hwoźna. Regulation of watercourses and construction of drainage canals and ditches caused the increase in water discharge from the area and the drying of wetland forest habitats: riparian forests and alder carr [30]. Currently, small water reservoirs and the Siemianówka reservoir with a capacity of 79.5 million m3 are integrated into the forest, approximately 10 km from the border of the Białowieża National Park. The purpose of the construction of the Siemianówka reservoir was to reduce the frequency of cyclical water shortages in this region during periods of low flows, as well as the living and economic needs [22].
In 2001, on the initiative of the Polish Society for Bird Protection (PTOP), the construction of small-scale water retention elements was started within the Białowieża Forest area (outside the Białowieża National Park). In order to improve water conditions for wetland forests, several dozen small water reservoirs were built. Some of them were made by damming the watercourse, and the midfield ponds were simply dug out [30]. By 2005, a total of 33 structures had been built in the Łutownia River basin. The dams or weirs, built by the PTOP, created a perfect location for beaver settlements [25]. The main tributaries of the river are the Braszcza, Hwoźna, and Łutownia (Figure 2). In general, groundwater is shallow due to the definitely flat character of the catchment area and the low-permeability formations that are not too deep. In marshy areas of river valleys and peat bogs below the contour of 151 m above sea level, groundwater is shallow (0–1 m), and is hydrostatically related to the water level in the Narewka and its tributaries. In the northeastern part of the catchment area, the waters occur locally deeper than 2 m below the surface, and also exceptionally below 4–5 m from the surface [31]. The abundance of groundwater in the first utility level is usually significant. However, the shallow presence of the groundwater table on large surfaces prevents the accumulation of larger amounts of excess water. The greatest capacity to accumulate water is found in the raised areas of uplands built from coarse-grained formations, lying on the watersheds of the watercourses of the catchment area. Water resources collected in this way feed the entire network of streams originating in the uplands [32].

2.3. Hydrological Regime

The first studies on water relations in the Narewka River catchment area concerned the years 1948–1962 [33]. It was found that despite significant afforestation, the catchment retention resources were not large, and rainfall deficits with little variable field evaporation resulted in a significant reduction in runoff. The annual runoff cycle was typical for lowland rivers, where most runoff comes from the surface meltwater, and the summer runoff was influenced by the ground supply. High rainfall in the summer months (June–August) was consumed almost entirely to cover the increased field evaporation. In the Narewka catchment area, winter runoff accounted for 61.5% and summer runoff for 38.5% of the average annual runoff. According to Dynowska [34], Narewka is characterized by a moderate regime with spring and winter floods as well as ground–rain–snow supply. The amplitudes of the average monthly flows are considerable, and floods may appear in the early winter period. Air temperatures in the late autumn and early winter periods are lower in the northeast of Poland, resulting in lower evaporation losses in this period. The Narewka catchment is characterized by a diversified type of water circulation [34]; this is caused by large amounts of meltwater entering the circulation in one season, as well as by the shallow deposition of the groundwater table, a large share of poorly permeable sediments, slight denivelation, and high evaporation. In summer, surface runoff is slow and slight; as a result, the low flows of surface waters appear deep [32]. Previous studies on the phenomenon of low flows in the Narewka catchment have shown that summer low flows are the dominant type in the area under consideration; they usually start in June, and often last until the end of October. The summer low flows are characterized by a long duration—on average over a month—and they pose a threat to particularly valuable biotopes of alder and bog forest in the Białowieża National Park [35]. The winter streamflow drought results from the lack of surface and subsurface feeding of rivers with water, this being caused by negative air temperatures, resulting not only in the accumulation of precipitation in the form of snow cover, but also in a break-in subterranean water feeding of the river due to deep freezing of the bedrock. The winter low flows last less time than the summer low flows, and occur in January and February [7].

2.4. Data Set

Data from the Białowieża weather station, located in the Narewka catchment area, and Białystok station, located in the Narew catchment, into which the Narewka flows, were used for the needs of meteorological analysis (Figure 1). Hydrological data were obtained for the Narewka water gauge station, closing the Narewka catchment area with an area of 635.4 km2 [7]. The research period covers the years 1951–2020, and the results are presented in the systems of hydrological years (1XI–31X) or calendar years (1I–31XII), depending on the nature and availability of the analyzed indicators. The data come from the publicly available database of Institute of Meteorology and Water Management – National Research Institute (IMWM-NRI) (dane.imgw.pl, accessed date: 16 August 2021). The missing year 1956 in the chronological sequence of precipitation for the Białowieża station was supplemented with data from the literature review [32]. Meteorological measurements on the Białowieża station began to be recorded by the Forest Research Institute following the Second World War, and were continued by the Institute of Meteorology and Water Management (IMWM-NRI) from the mid-1960s to today [12]. In the case of air temperature measurements for the Białowieża station, the year 1956 is also not available in the IMWM-NRI database, and in this case, the literature was used [12], along with data for the Białystok station.

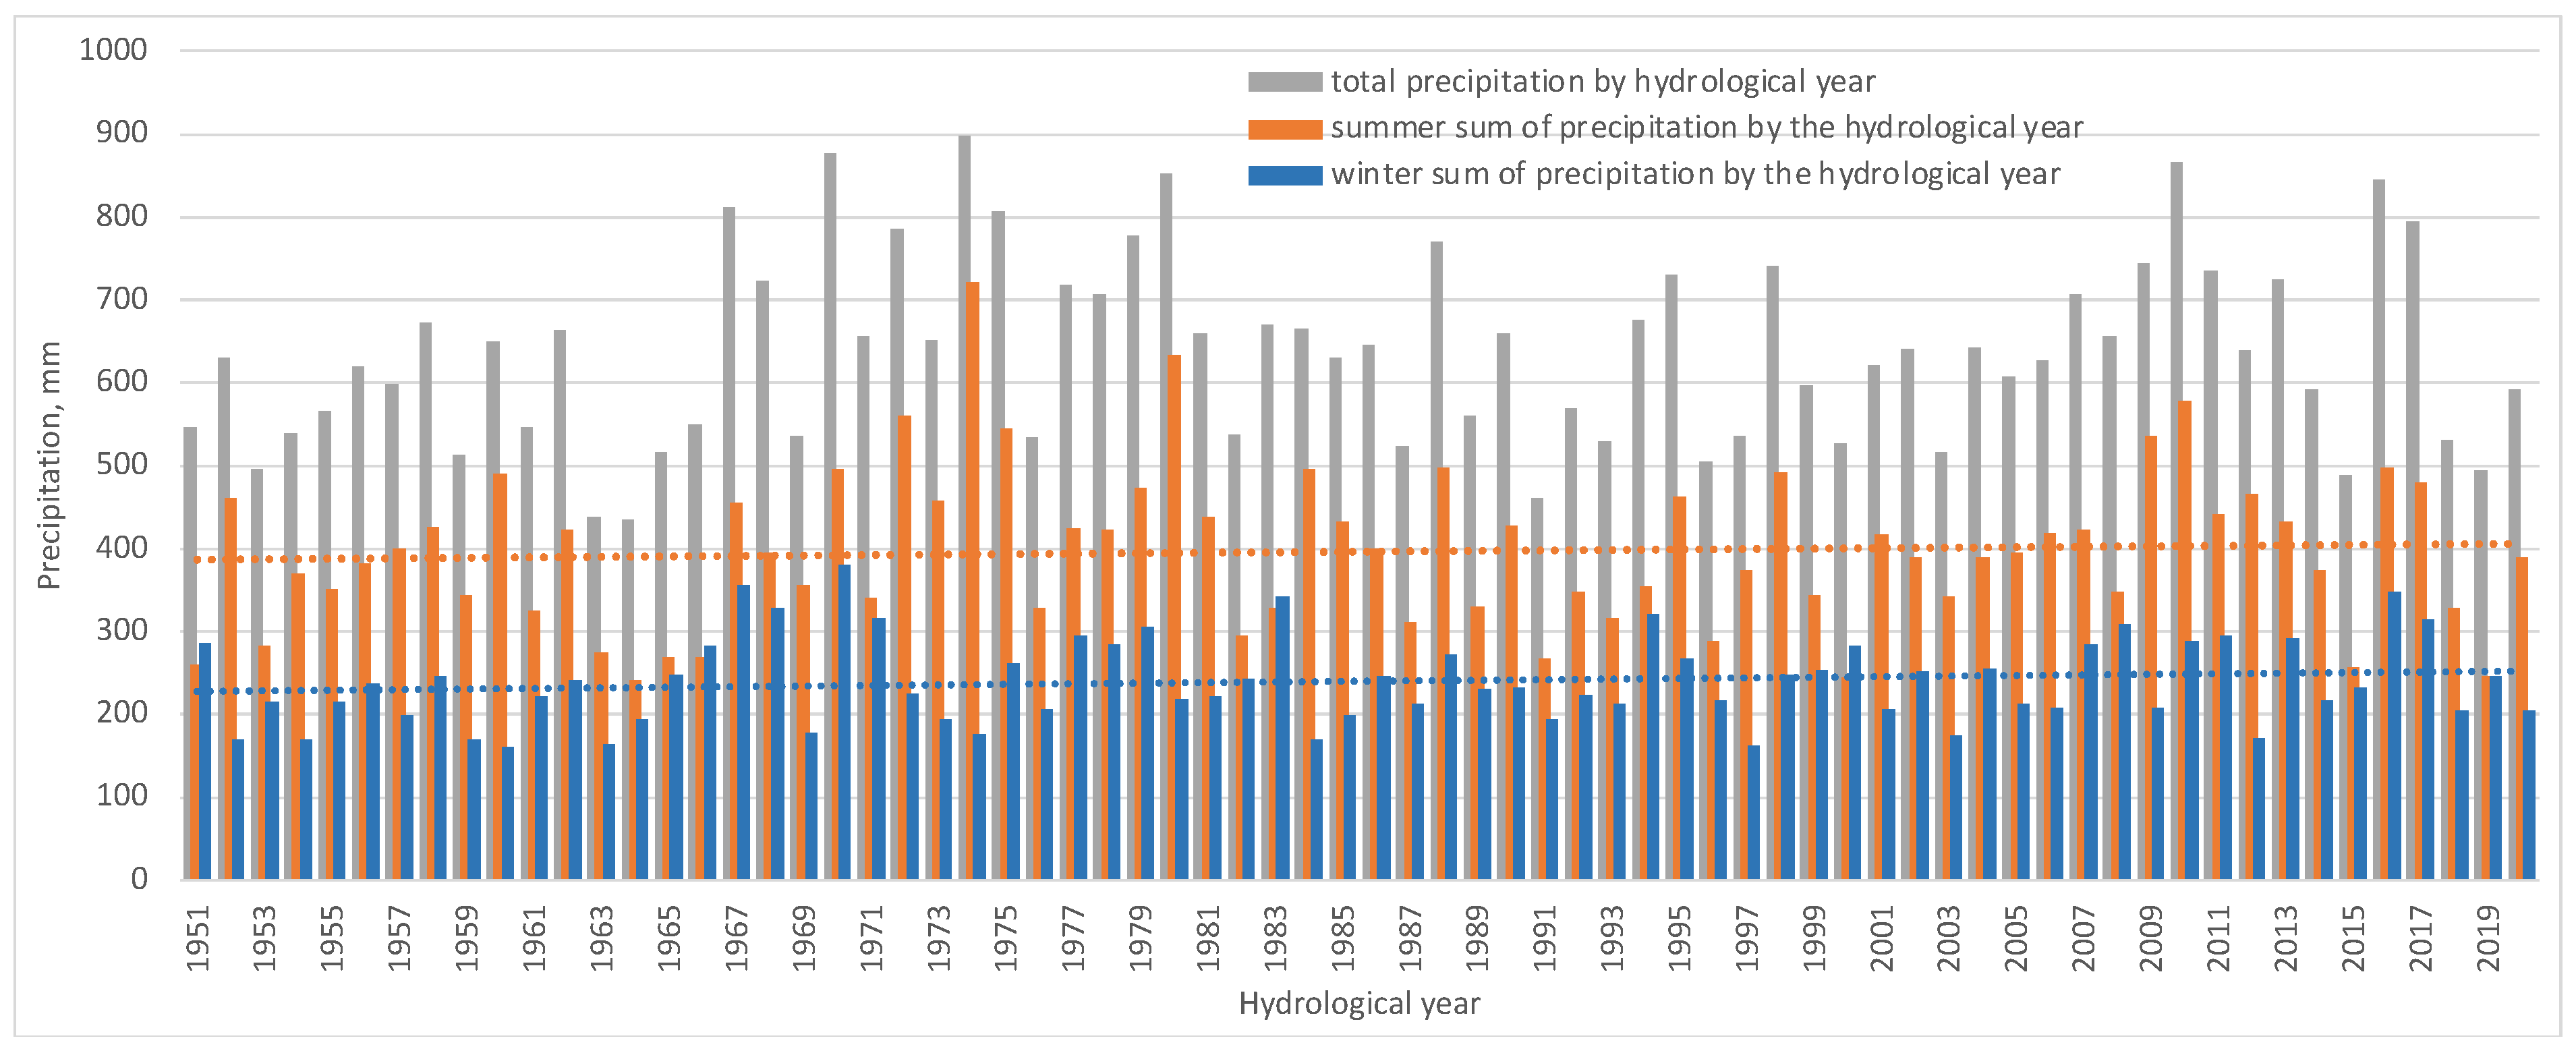
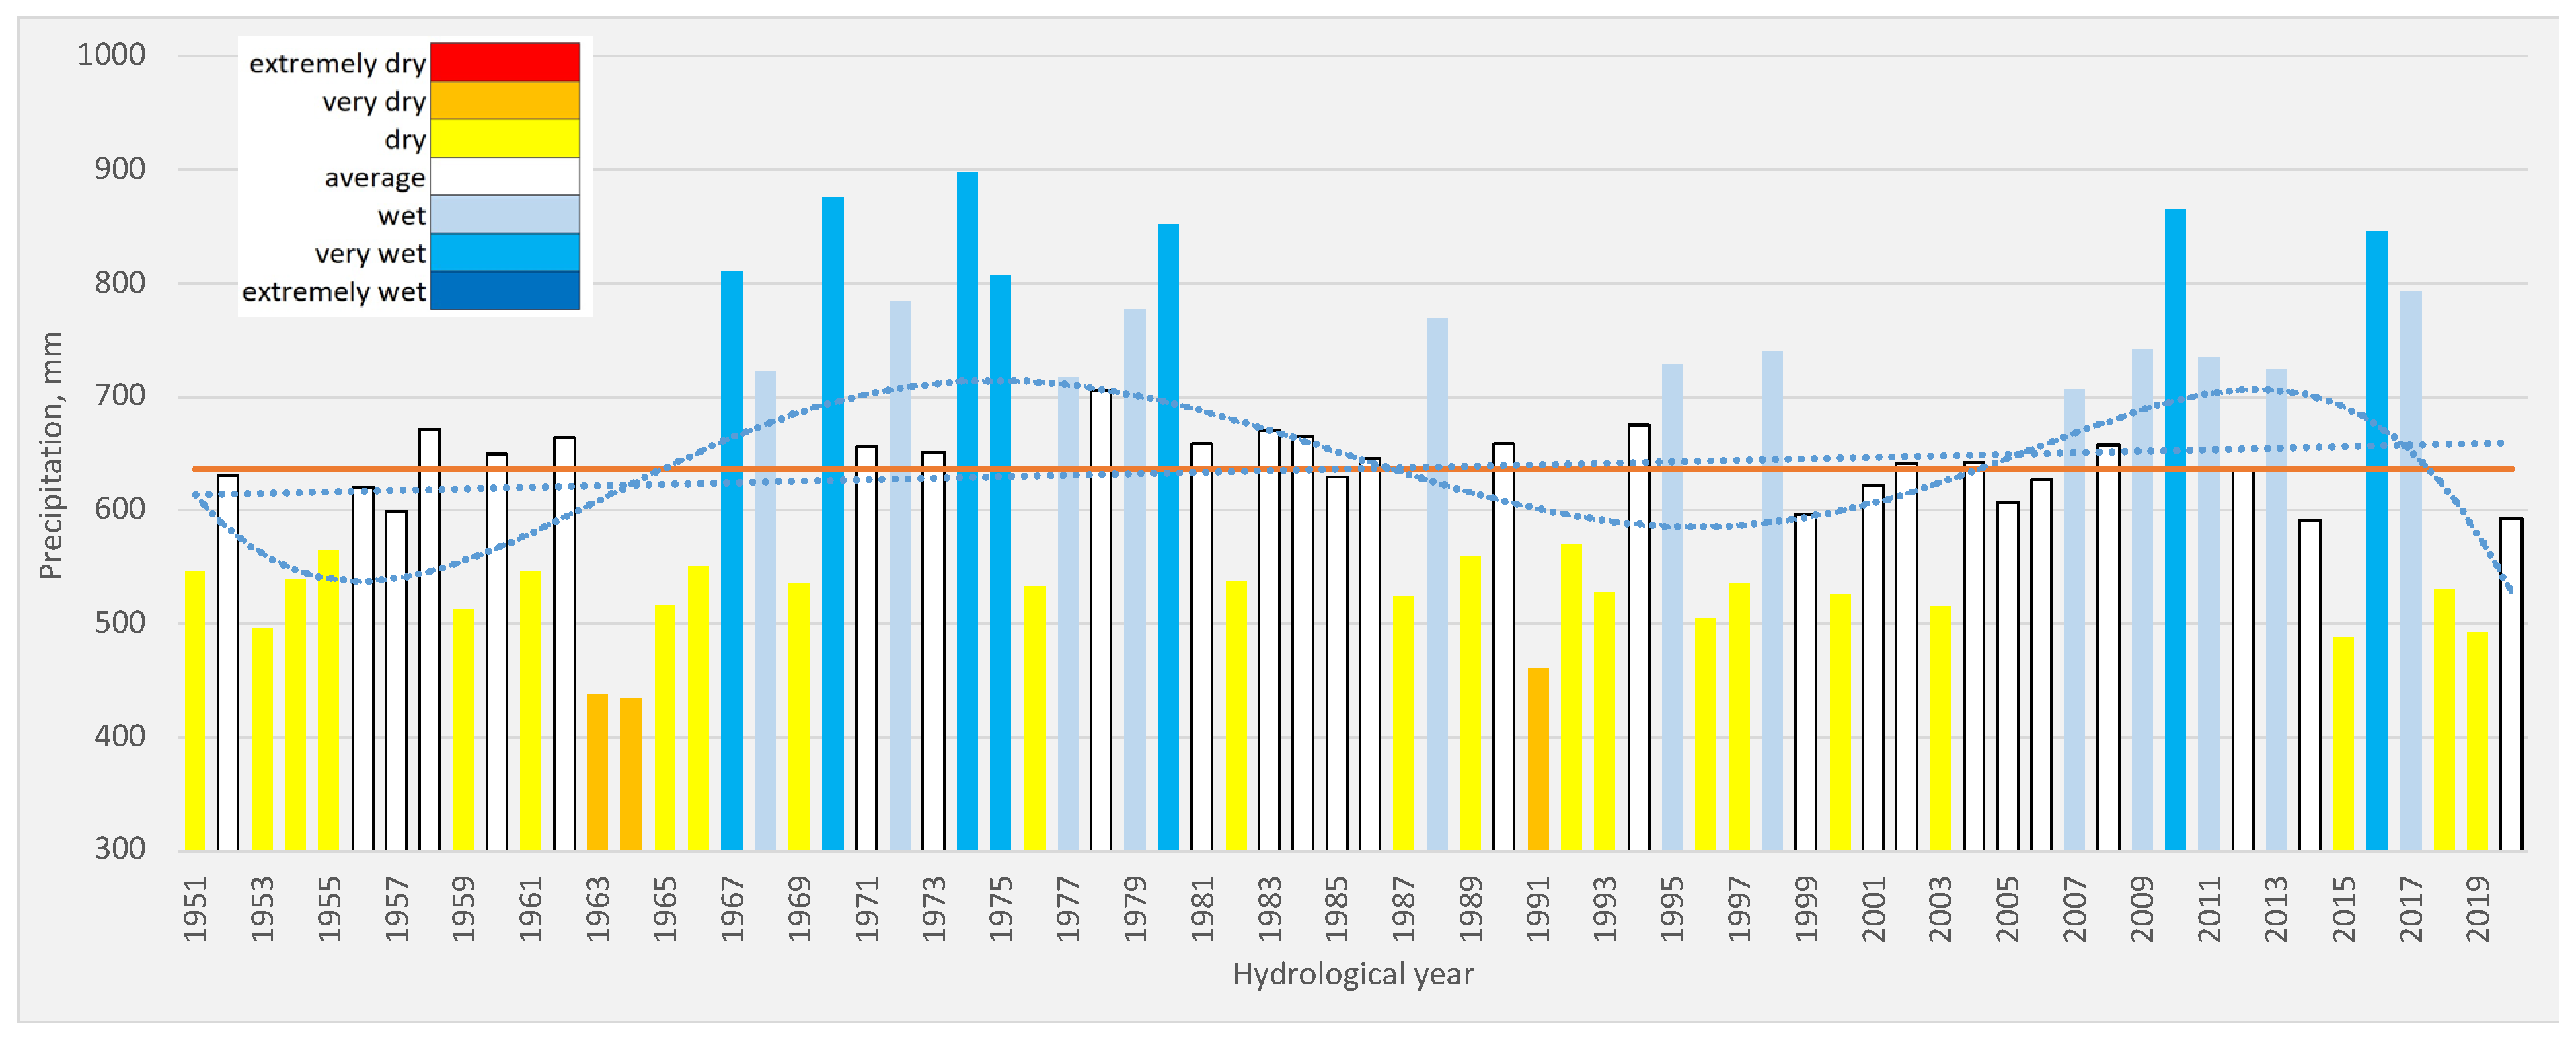
2.5. Rainfall, Runoff, and Temperature

For the calendar years of the period 1951–2020 for the Białystok station, the research covered annual precipitation totals, the number of days with precipitation no less than 0.1 mm, and the number of days with precipitation > 20 mm in the following periods: 1951–1970, 1961–1980, 1971–1990, 1981–2001, 1991–2011, 2001–2020. In terms of the hydrological years 1951–2020, annual and six-month precipitation totals were examined for the Białowieża station. The average annual air temperature for the Białowieża station was presented together with the annual rainfall and the number of hot days above 30 °C in the calendar years of the period 1951–2020. The relative precipitation index (RPI) [36] was used to assess the excess or shortage of rainfall at the Białowieża station, in particular in the hydrological years of the period 1951–2020. This indicator relates the annual rainfall to the long-term average value. The relative precipitation index (RPI) has been widely used to date in meteorological and agrometeorological analyses, as well as in water reclamation works published by IMWM-NRI. On this basis, the given hydrological year was classified as extremely dry, very dry, dry, average, wet, very wet, or extremely wet. In search of changes in the annual runoff regime from the Narewka catchment, the analysis covered selected measures. The analysis of the runoff variability in the 1951–2020 period was based on the annual values of the characteristic flows (NQ, WQ, SQ) determined in the Narewka profile on the basis of daily flows from hydrological years. Annual values of the outflow (H), expressed in mm, were also included in the research. In order to assess the relationship between the annual values of rainfall (P) and runoff (H) in the past 70 years, the runoff coefficient (c) was examined as the H/P ratio expressed in % and the balance losses (P–H) expressed in mm. To assess the annual and long-term changes in the outflow regime, the half-outflow term index (TPO) measure was used, which was proposed in the Polish literature by Jokiel and Bartnik [37]. At the same time, the English-language literature published an identical measure proposed by McCabe and Clark [38]—the center of mass data TPO is a measure that determines the day in a hydrological year when the sum of the daily runoff reaches half of the annual value. This measure is obtained by cumulating the daily flows (outflows) of the river until half of their annual total is obtained. These characteristics may be specified for any year or multiyear period. Observation of changes in TPO enables the discovery of answers about the directions and sizes of changes occurring in the outflow structure [39].

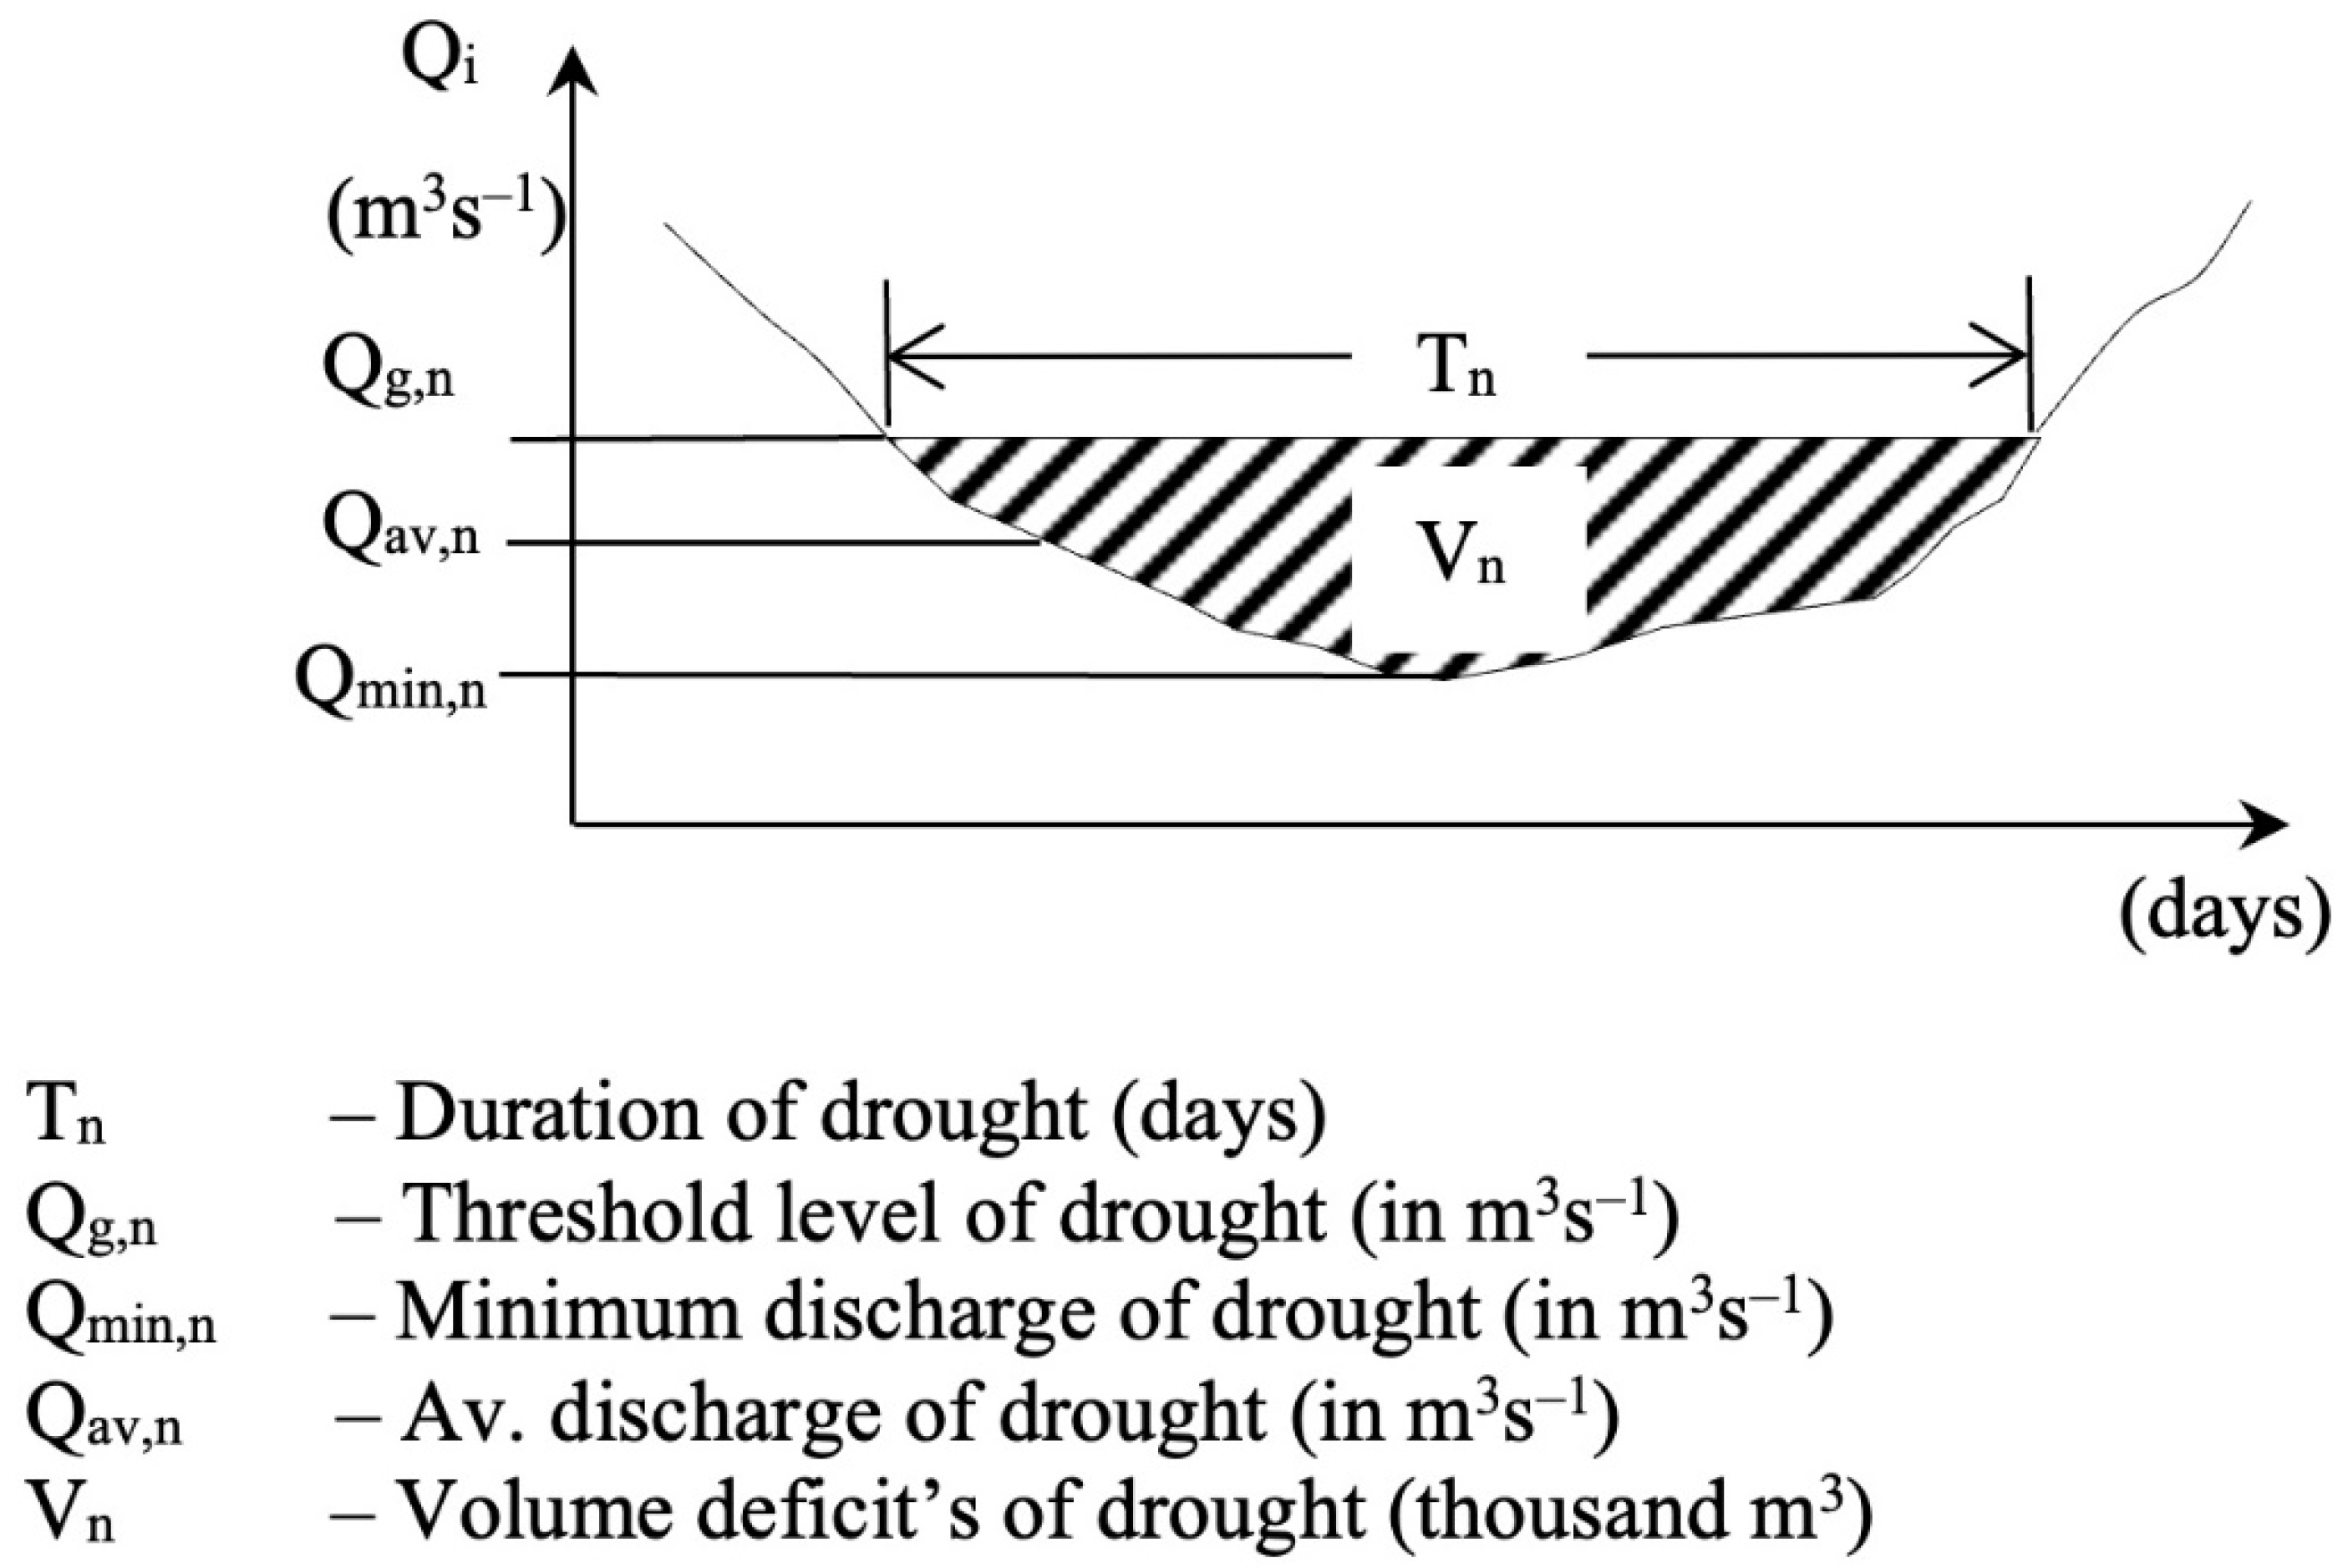
2.6. Hydrological Drought

Hydrological drought is usually an expression of deficiencies in the supply of surface and subsurface water supplies [40]. In practice, many methods and indicators are used to define the occurrence of drought [41,42,43]. A complex method for the estimation of drought being identified with hydrological drought was proposed by Tallaksen and van Lanen [44]. In general, the hydrological drought is a period when low water levels and streamflows persist in rivers, caused by long-lasting lack of precipitation, intensive evaporation (summer droughts), or long-lasting frost (winter droughts) [41]. The streamflow droughts in the river are a useful indicator of the occurrence of hydrological droughts in catchments. In summer, hydrological drought is the last stage in the drought process, which includes three successive phases: atmospheric, soil, and hydrological drought [45]. The winter droughts are caused by a lack of surface and subsurface alimentation of rivers; this can be due to negative air temperatures, resulting not only in an accumulation of precipitation in the form of snow cover, but also in a break in the subterranean water supply of a river due to deep freezing of the bedrock [7]. In recent years, depending on the purpose of the research, the stage of hydrogeological drought has also been distinguished in the process of drought development, and the concept of socioeconomic drought has also been used. Hydrological drought consists of low-flow periods, but the continuous seasonal appearance of low flow is not necessarily a hydrological drought. Low-flow periods are a seasonal phenomenon and an integral component of the hydrological regime of each river. In the context of drought analysis, identification of periods in which flows are equal to or smaller than a predefined truncation level is the most crucial issue [43]. A method that consists of extracting drought periods (streamflow droughts) from daily-recorded hydrographs using the assumed truncation value is referred to in the literature the threshold level method (TLM) [41], also known as a peak over the threshold (POT) [43]. In this work, Q90% was used as the threshold discharge, which was determined on the basis of the flow duration curve. Hisdal et al. [40] proposed Q90% as being useful for extracting information on drought from daily hydrographs. The use of the Q90% discharge threshold provides a possible separation of the phenomenon of streamflow drought from among the more common low-flow periods occurring every year as a natural hydrological regime of the river [7]. The minimum discharge duration below the threshold value is used as an additional criterion by which to identify streamflow droughts. Therefore, a sequence of discharges of at least 10 days in duration, with values equal to or less than Q90% = 0.79 m3·s−1, was recognized a constituting a streamflow drought. The range of 10–20 days is typically adopted as the minimum streamflow drought duration in research carried out in Poland [7]. The size of the truncation level—Q90%—was estimated at Narewka gauging station for the Narewka River for a period of 52 years (1951–2002). The applied low-flow threshold flow resulted from the need for continuity of research started in the study by Ciepielowski and Kaznowska [7] for the multiyear period 1951–2005, and continued in the presented study. Daily recorded hydrographs in the form of hydrological years (from 1 November to 31 October) from the period 1951–2020 were input as data for the estimation of streamflow droughts. Summer and winter droughts were analyzed separately due to the genesis of this process. The Nizowka2003 [46] model was used for the identification of streamflow droughts and their quantitative parameters (Figure 3): minimum drought discharge (Qmin,n), duration (Tn), drought deficit volume (Vn), and drought intensity (In).
To assess the severity of streamflow droughts in the years 1951–2020 (study period), the following characteristics were used: average duration of drought—Tav,n (days); average volume of drought deficit—Vav,n (103·m3); maximum drought duration in the study period—Tmax,n (days); maximum volume of drought deficit in the study period—Vmax,n (103·m3); lowest discharge during streamflow droughts observed in the study period—NQmin,n (m3·s−1); average discharge during streamflow droughts observed in the study period—SQav,n (m3·s−1); and average drought intensity—Iav,n (103·m3·day−1). Average drought intensity in the study period indicates how much the deficit in the outflow falls for one day of drought. The value was converted to a percentage of the average annual runoff. The average intensity of the low flows in the period 1951–2020 was calculated as the arithmetic mean of the intensity of all low flows (In) occurring over a long period, with a distinction between winter and summer low flows. The research also covered the number of days with low flow in the period 1951–2020, considering the summer and winter half-years separately. All days with flows less than or equal to Q90% were counted (without taking into account the criterion of the minimum duration of 10 days). A description of the methods that were used in this paper for estimation of streamflow drought can be found in [7,41,45,47].

2.7. Trend Analysis

For the considered characteristics of air temperature, precipitation, runoff, and measures of hydrological drought in the years 1951–2020 (70 years), trends and change points of a time-series analysis were used. The commonly used nonparametric Mann–Kendall test [48] and the nonparametric Pettitt change-point test were employed [49]. In this study, the confidence level of α = 0.05 was used to analyze the trend of meteorological and hydrological factors. The R software packages “Mann-Kendall Trend Test of Time Series Data Without Modifications” and “Non-Parametric Trend Tests and Change-Point Detection” were used to calculate the trend analysis.

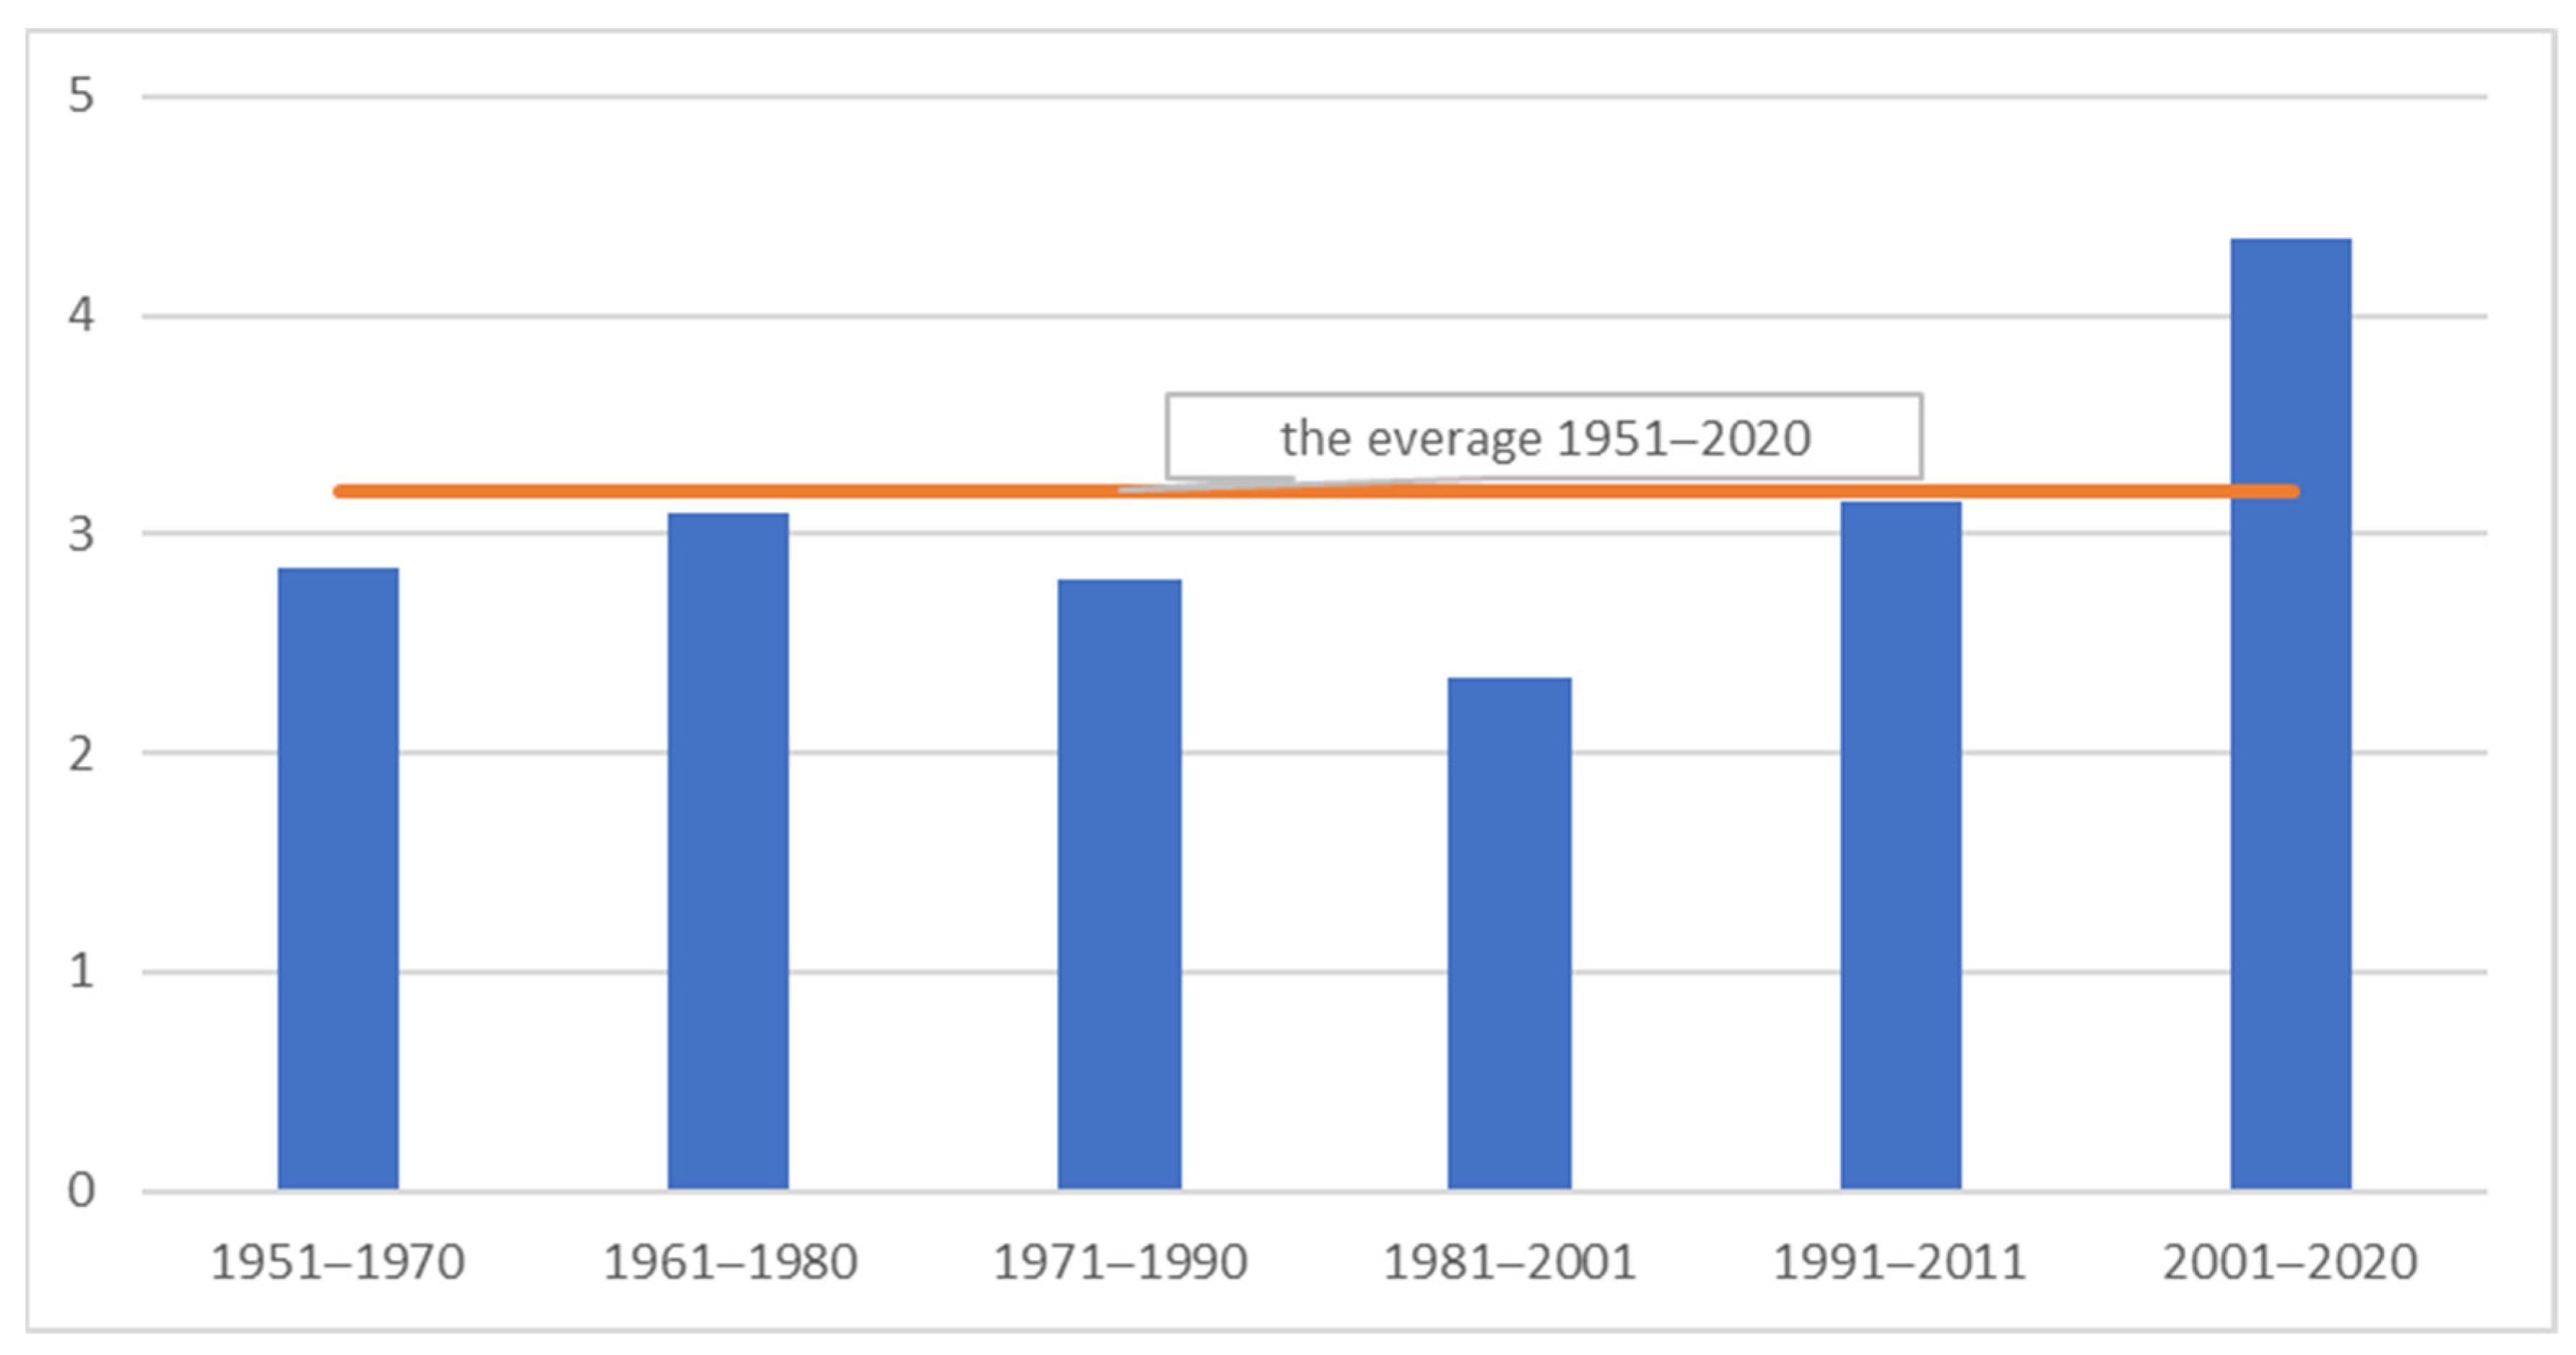
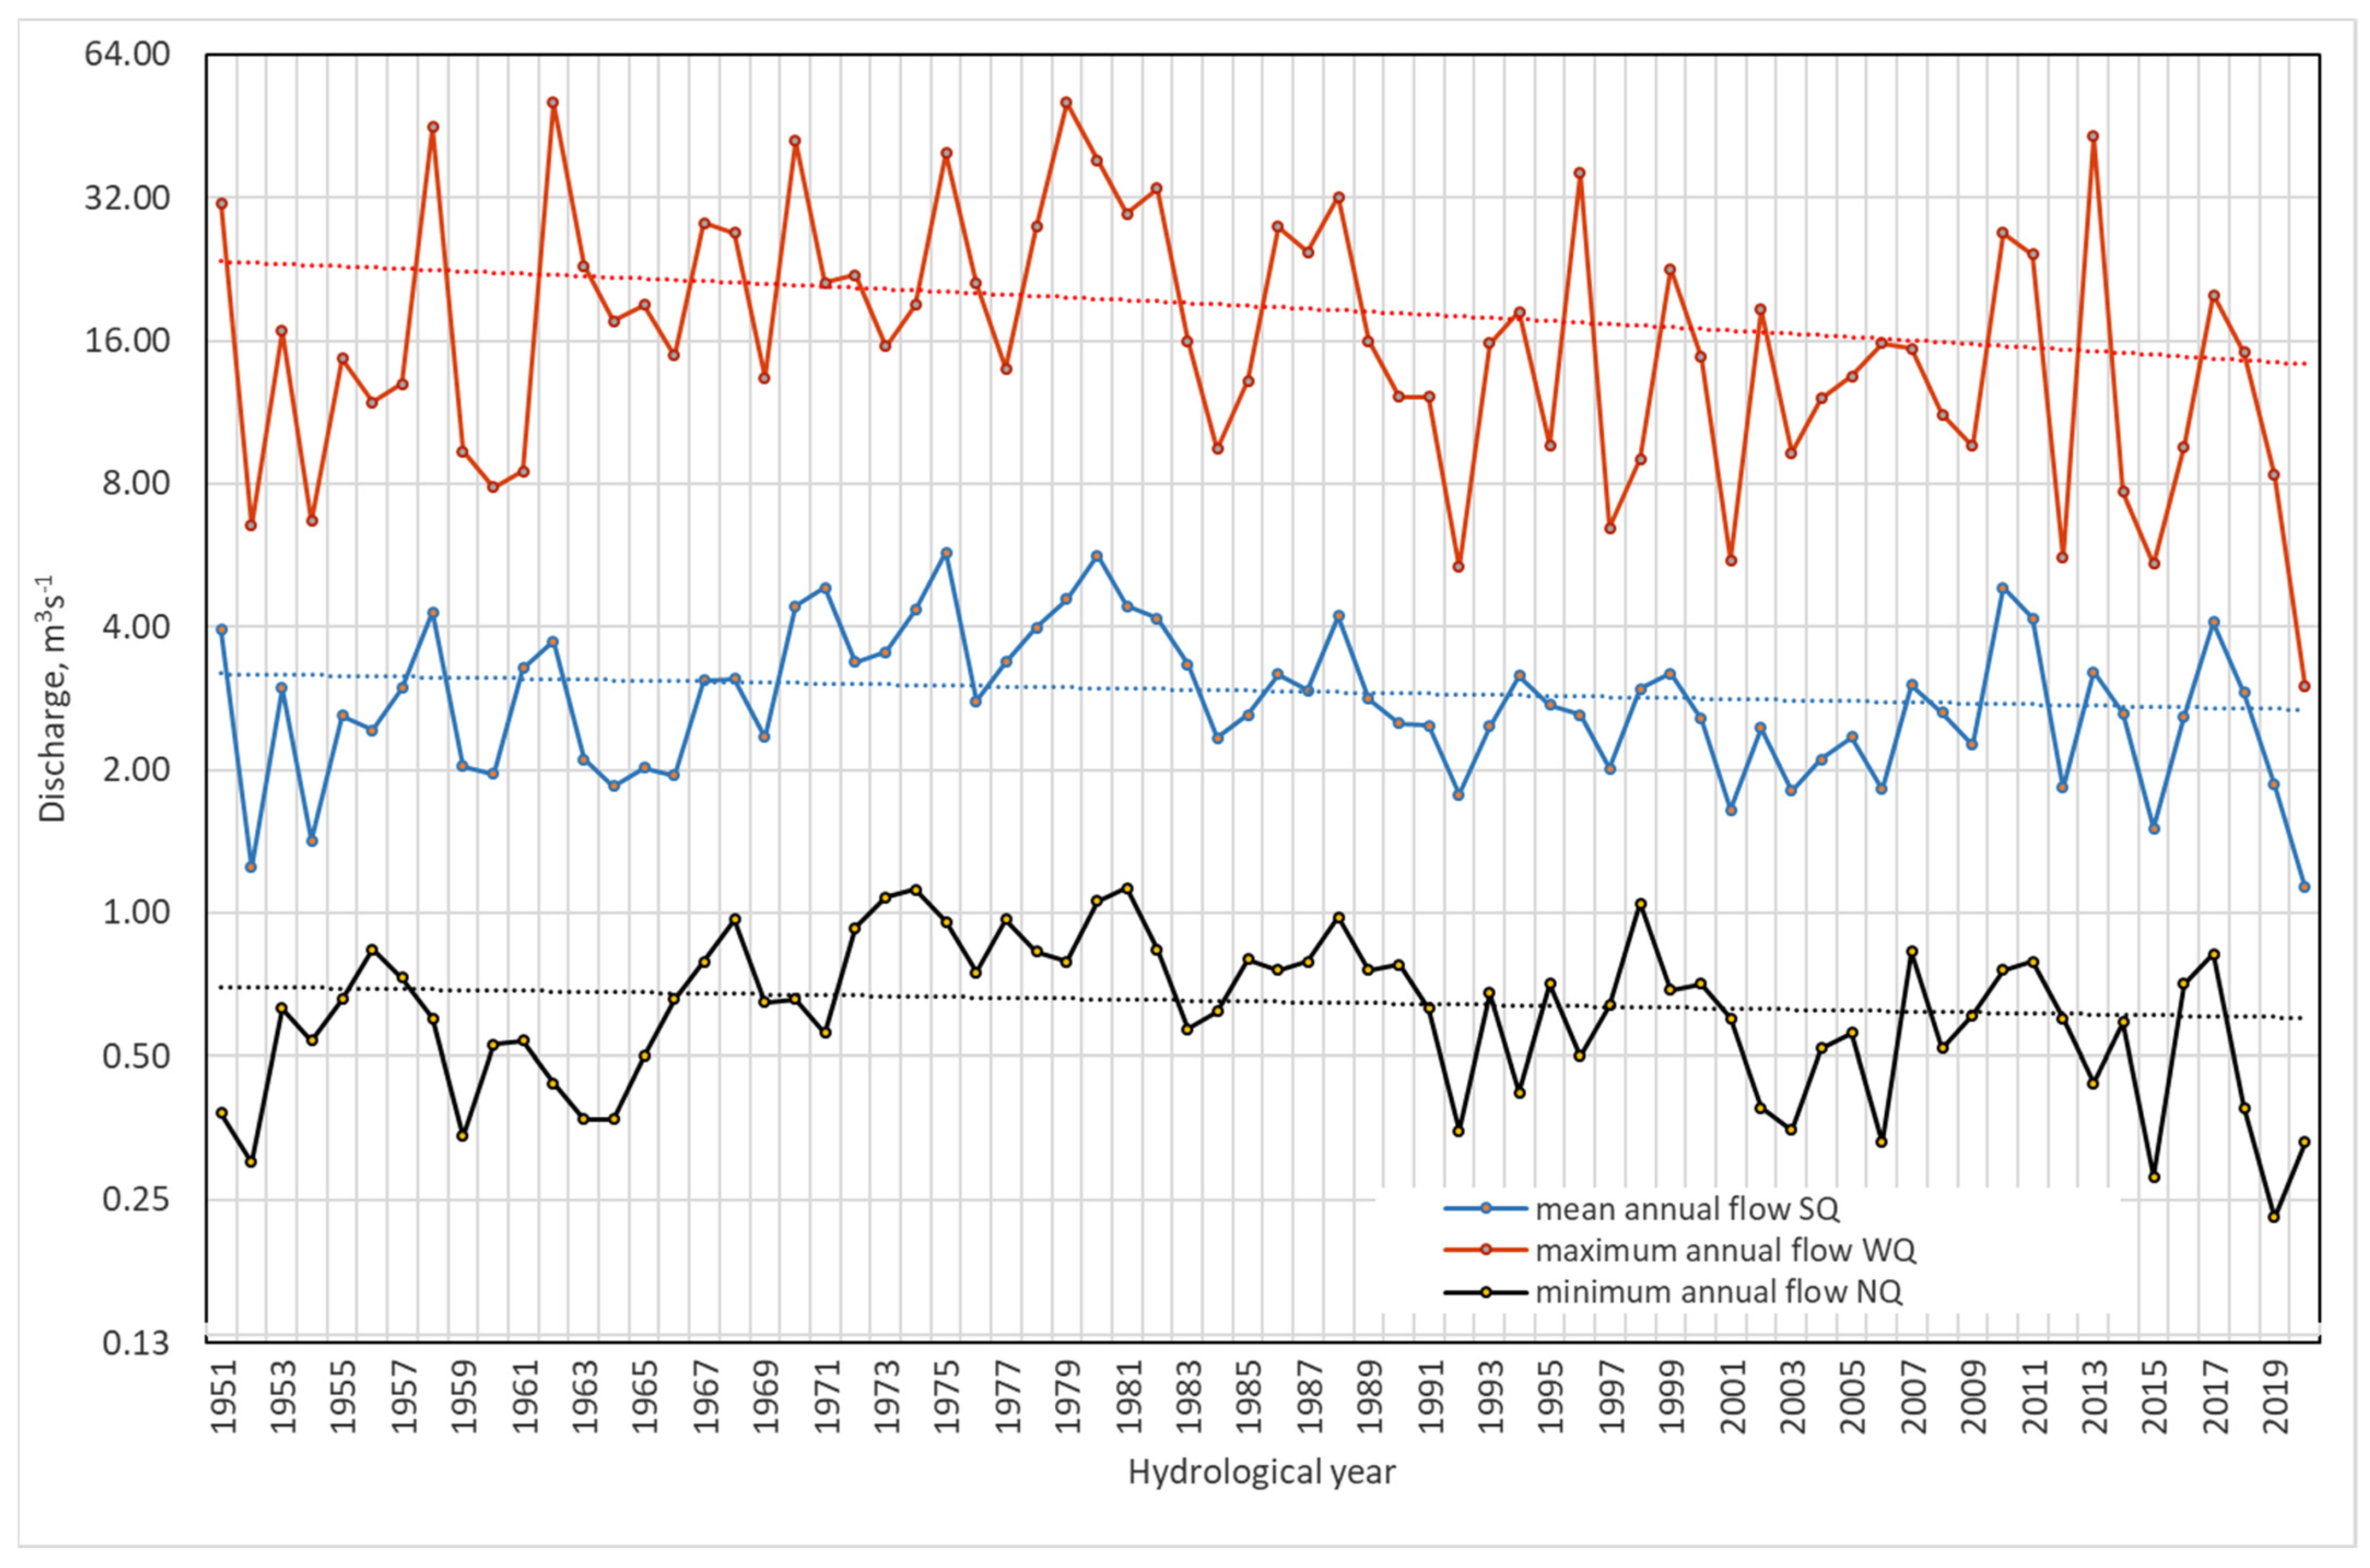
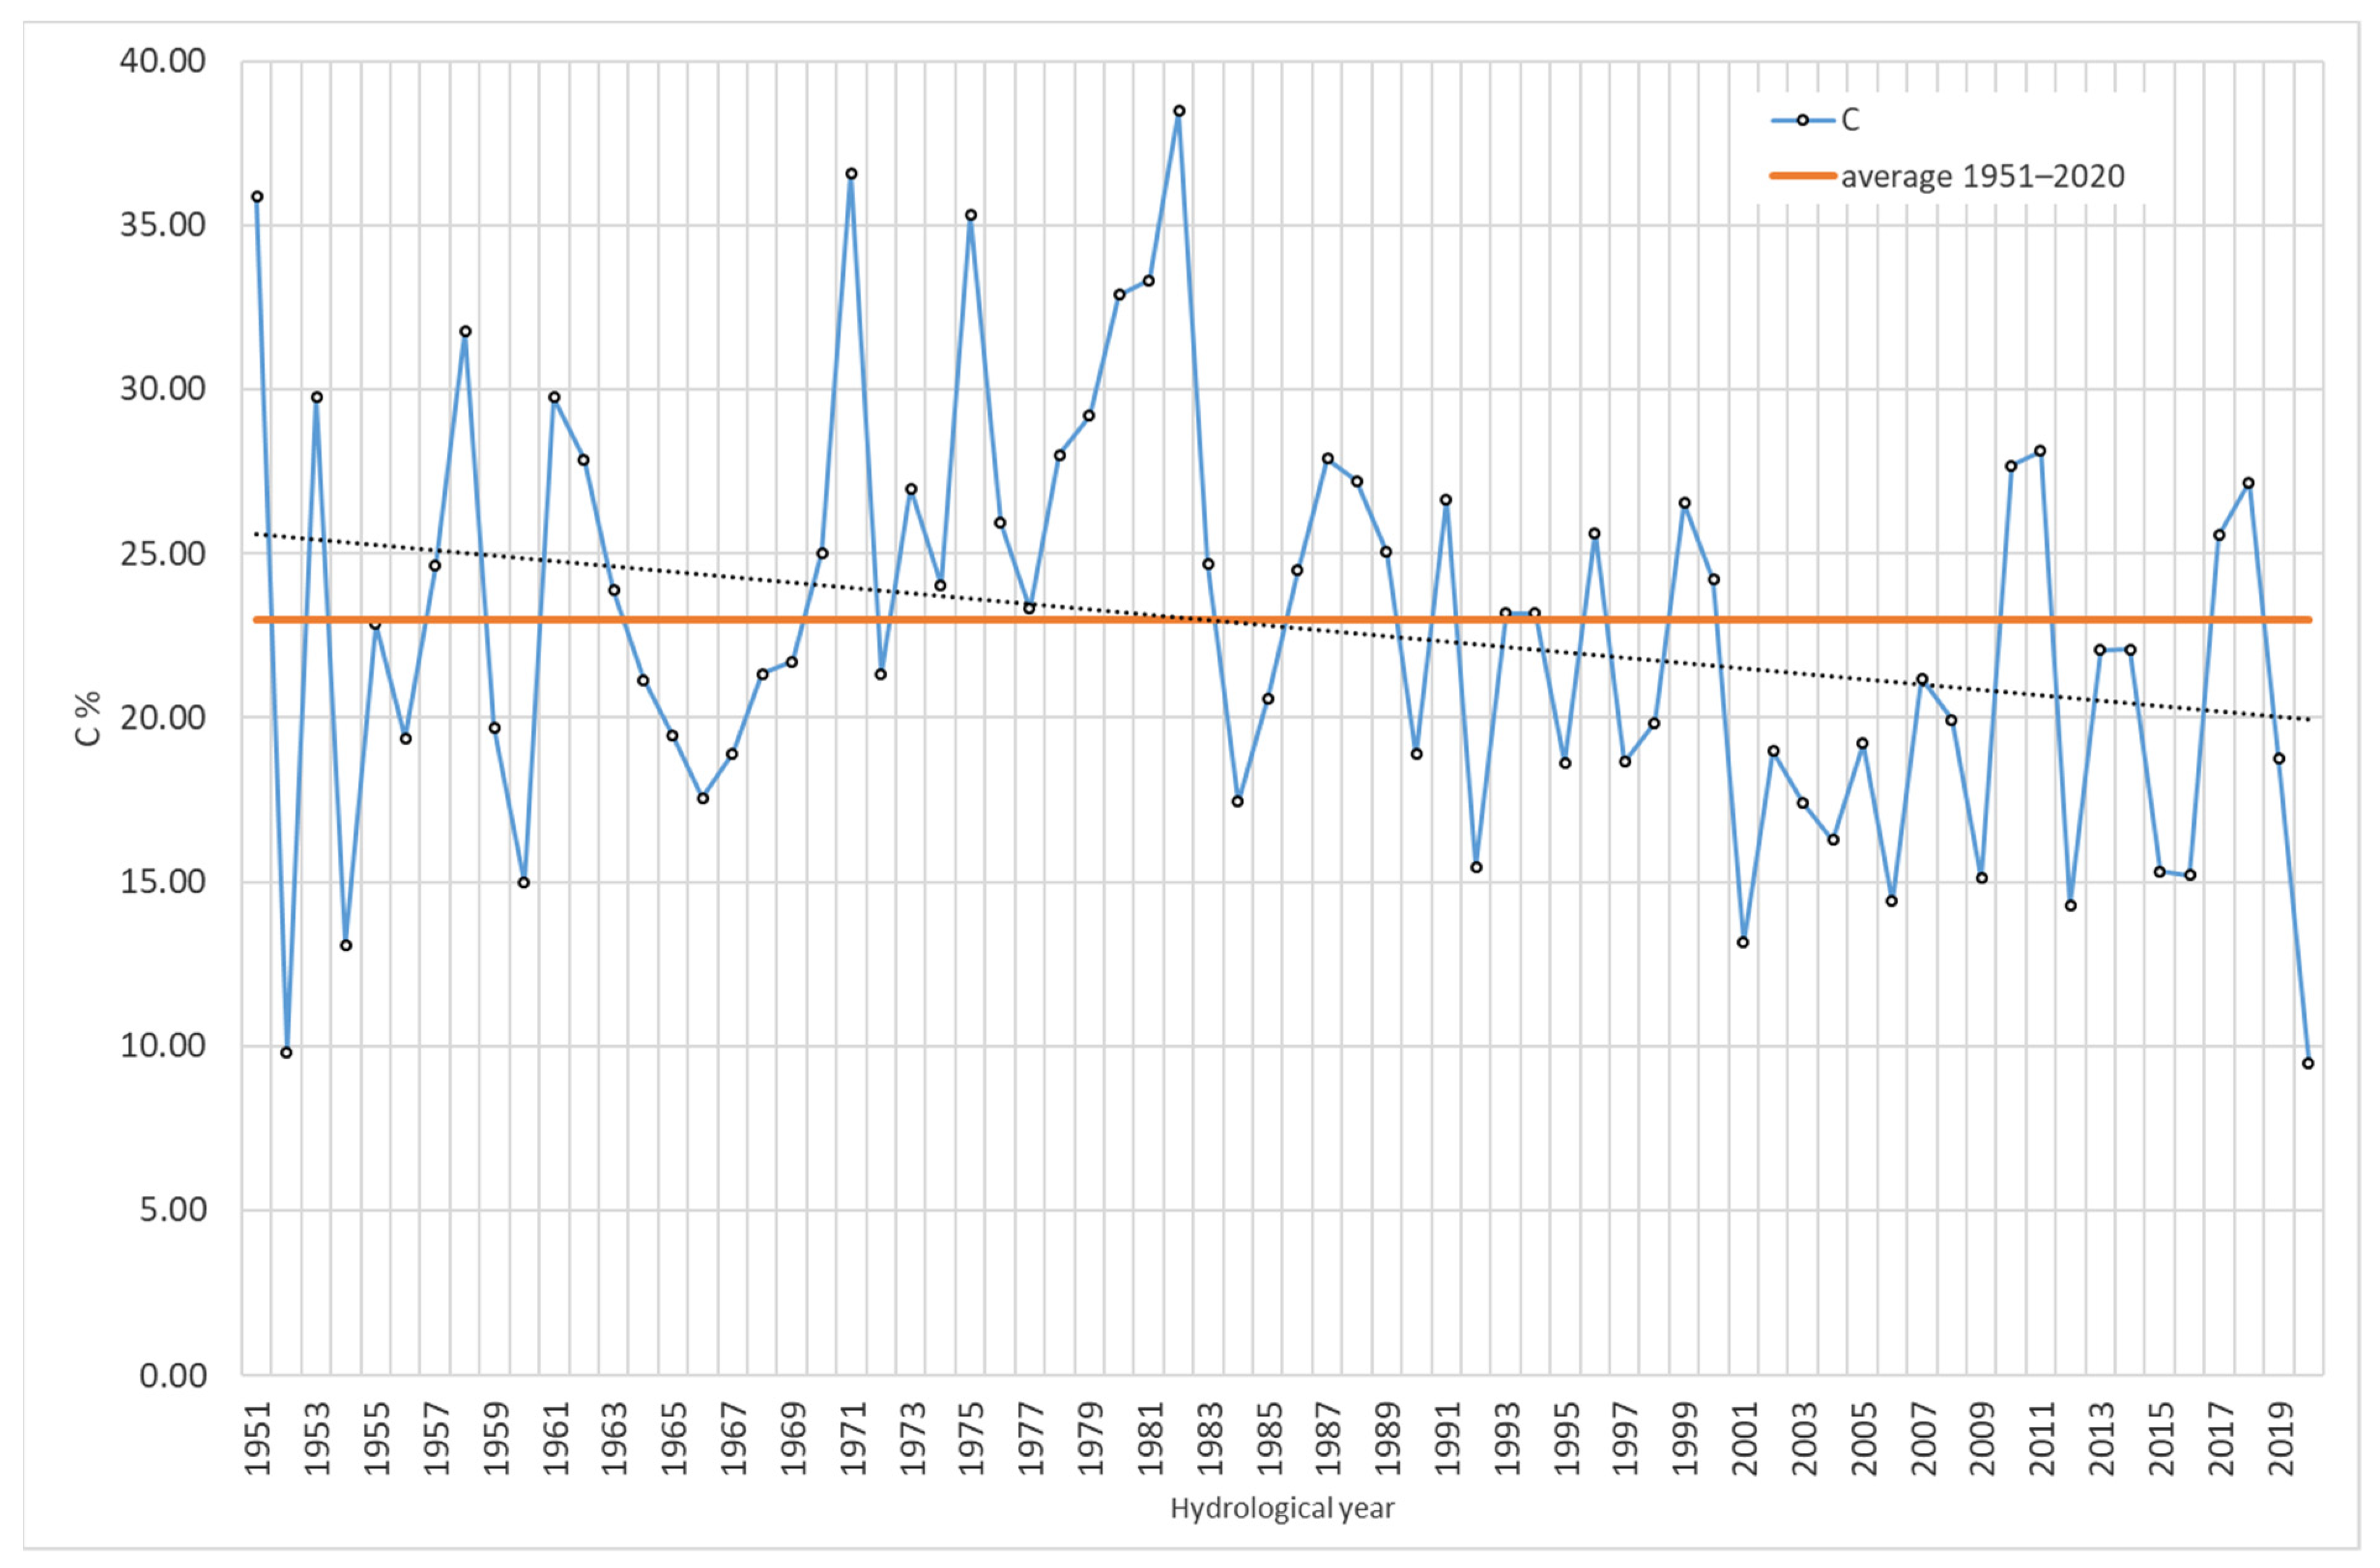
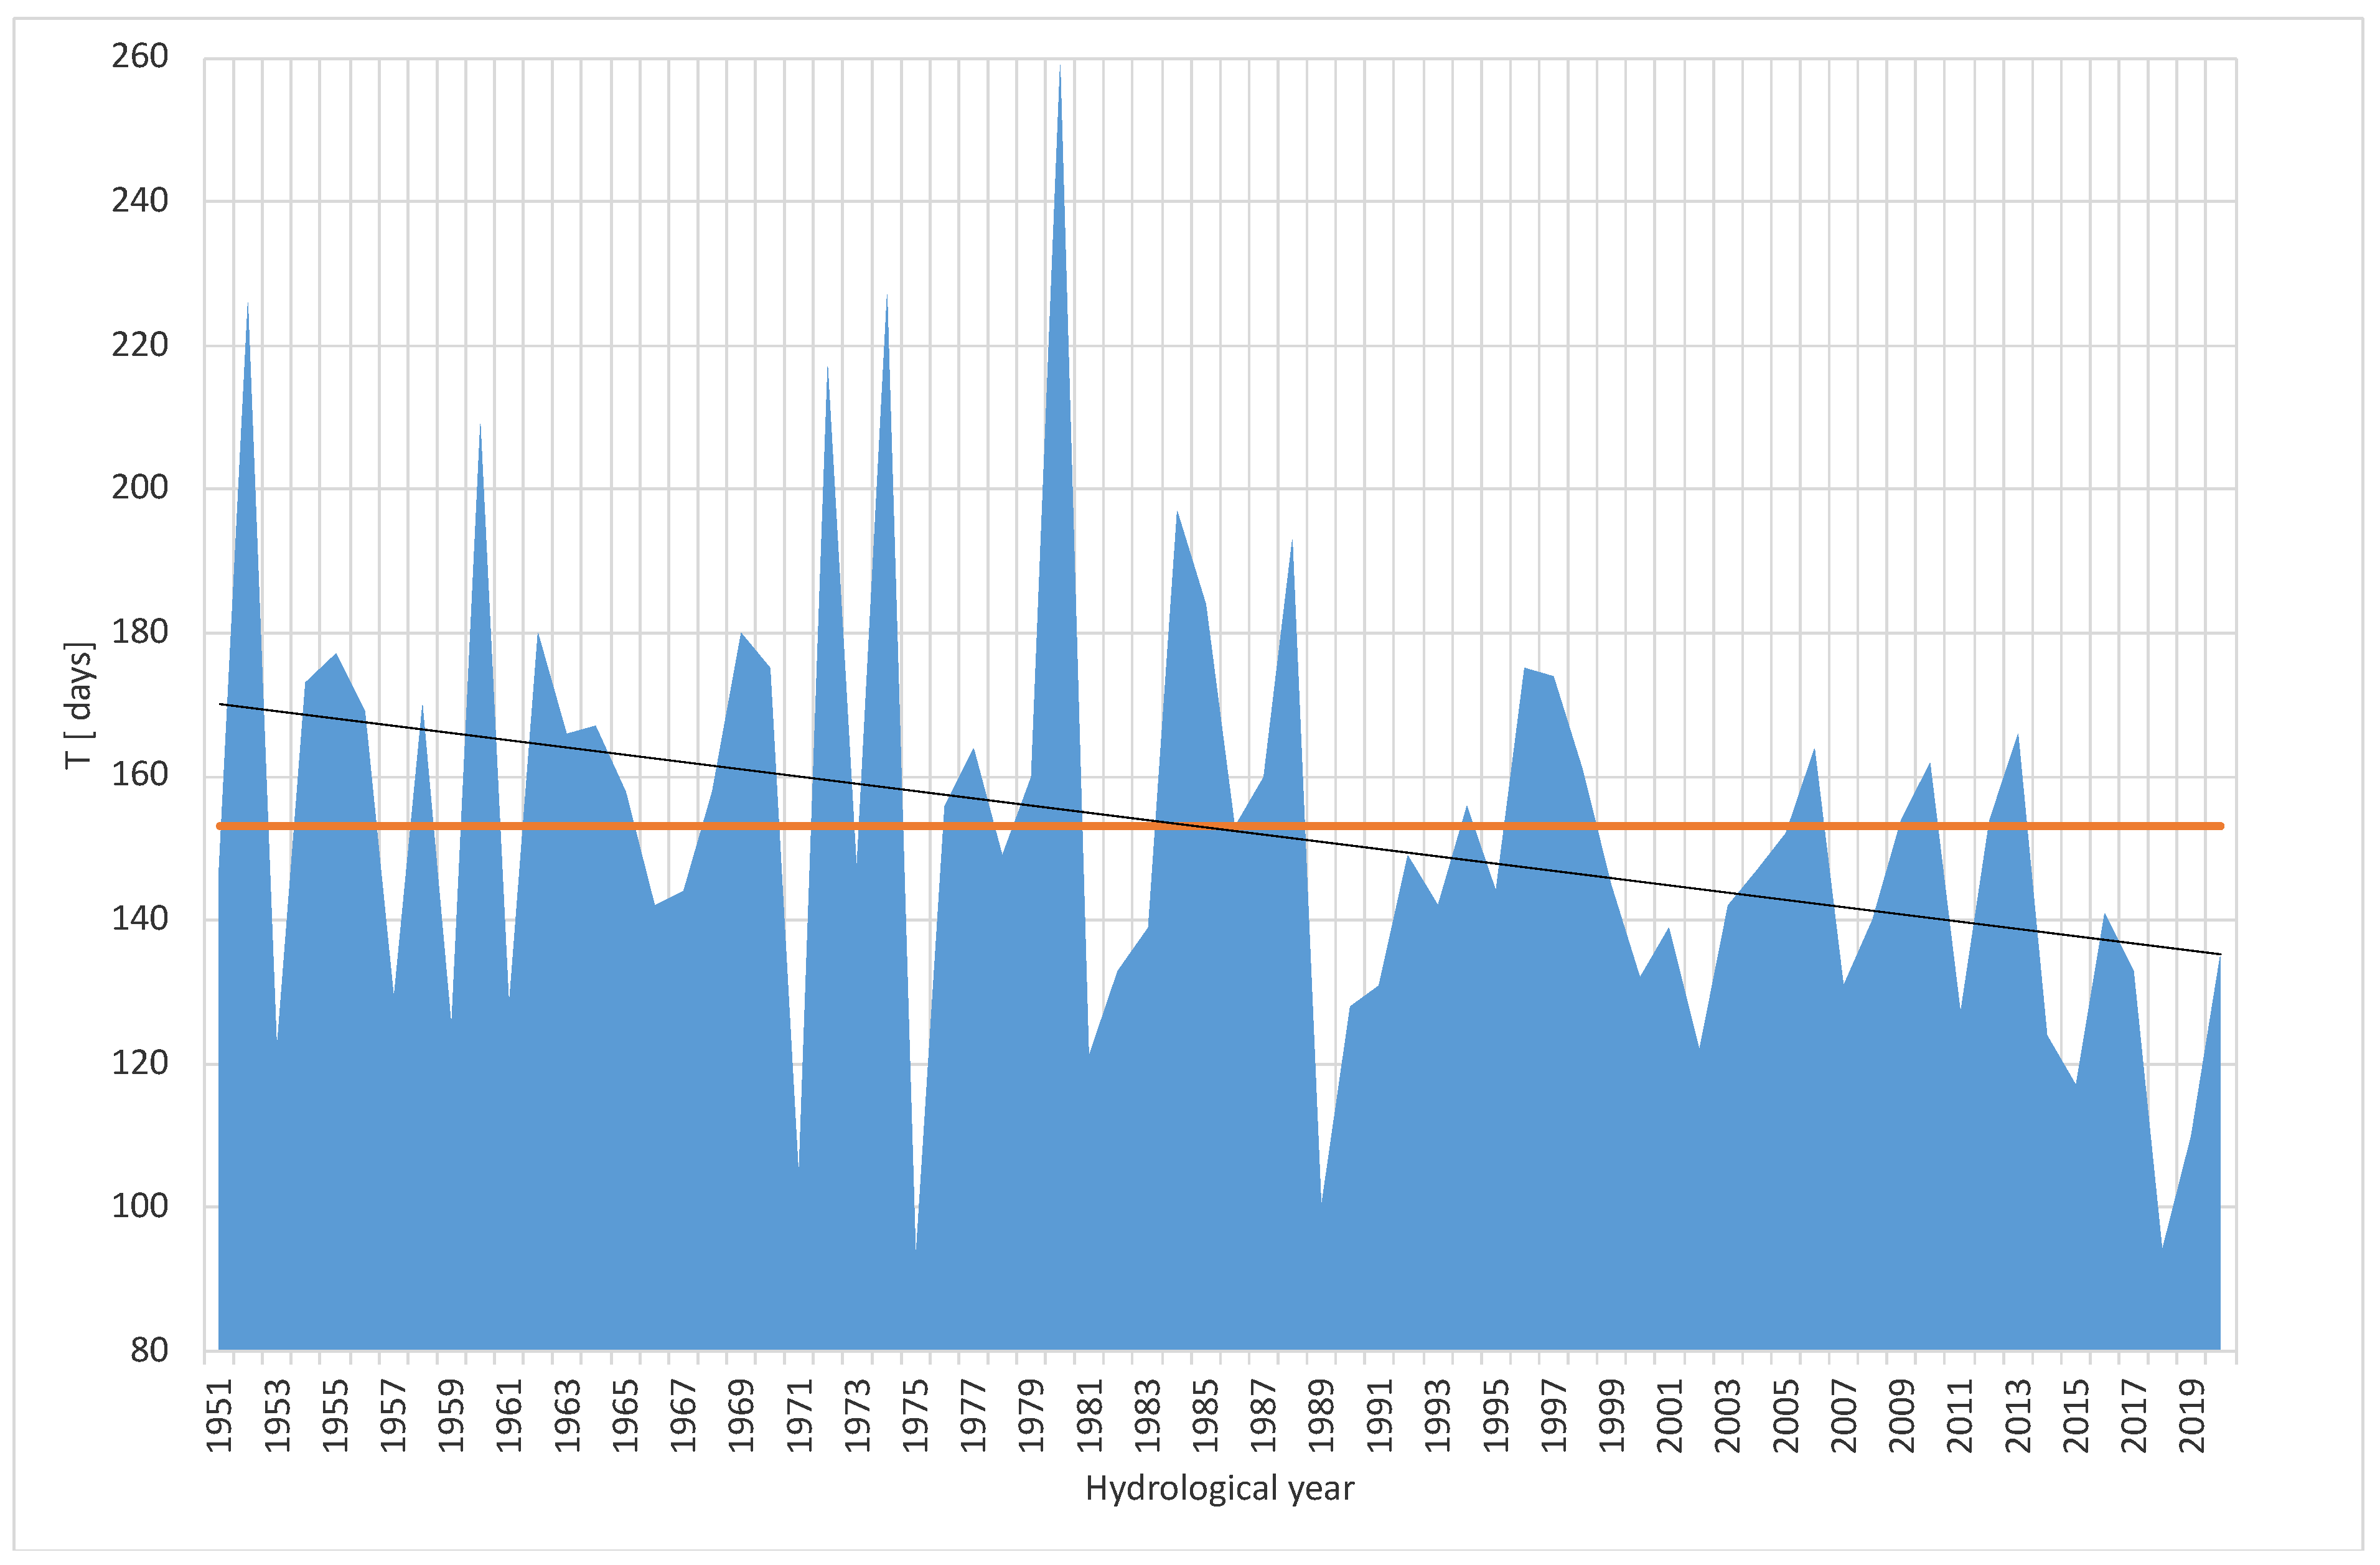
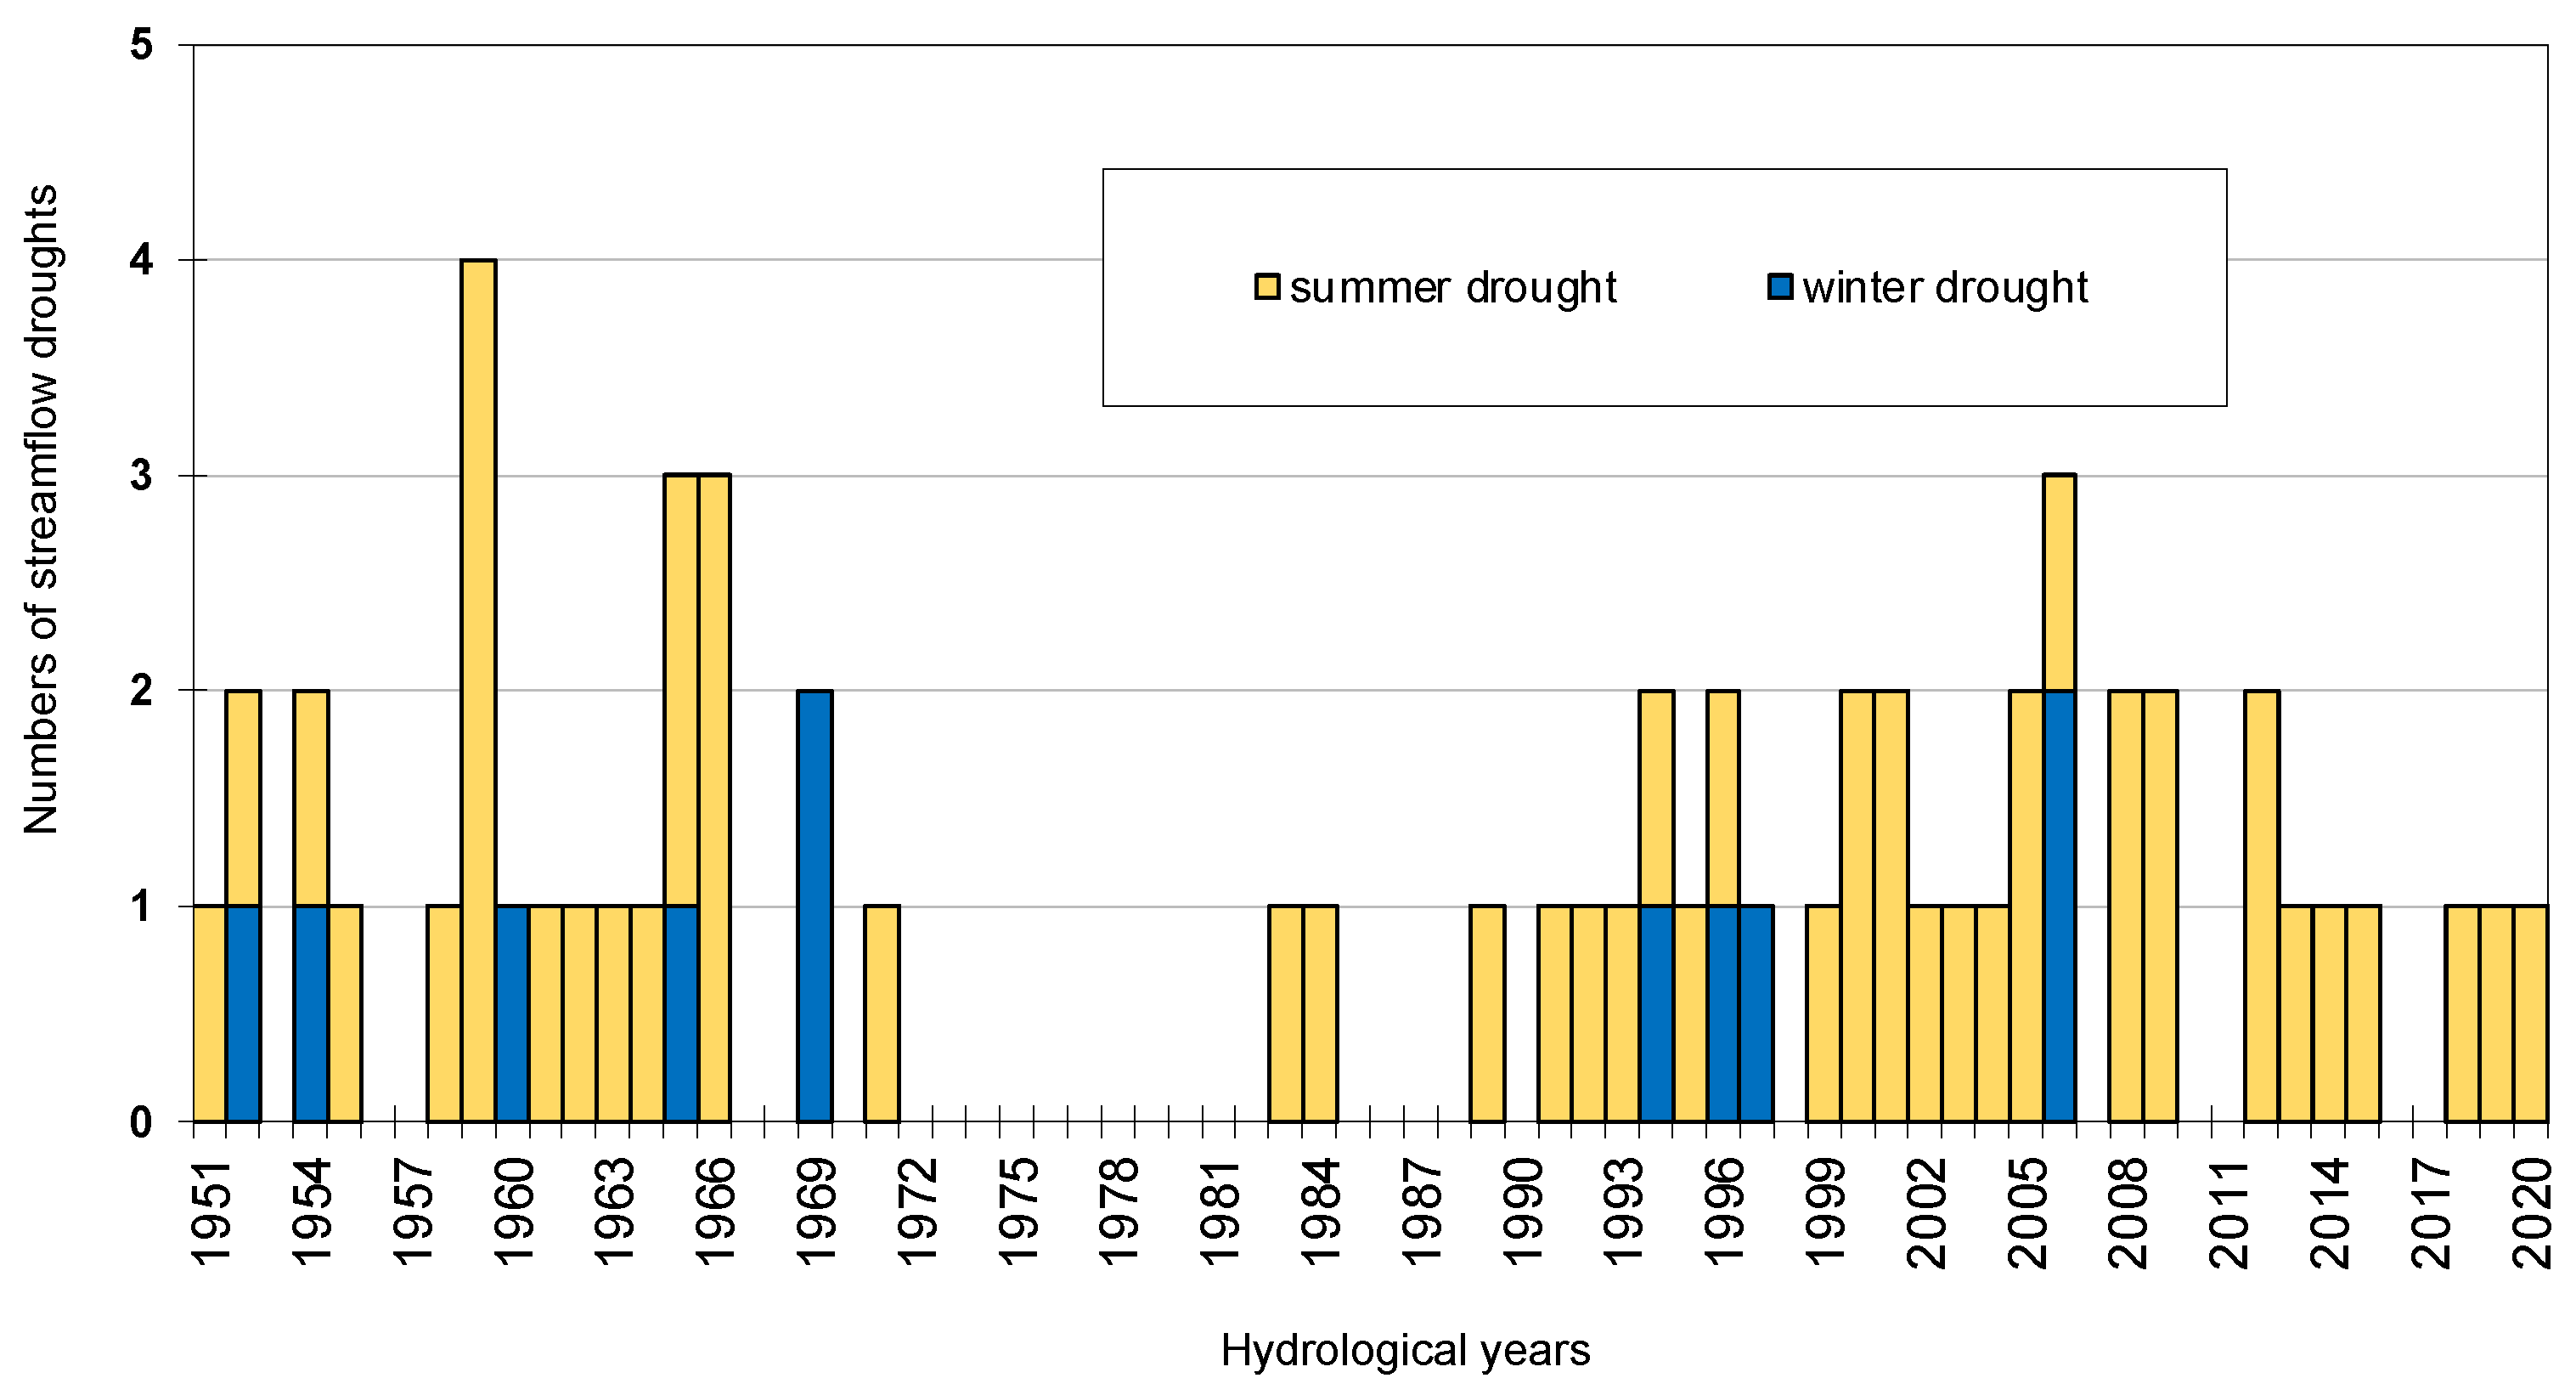
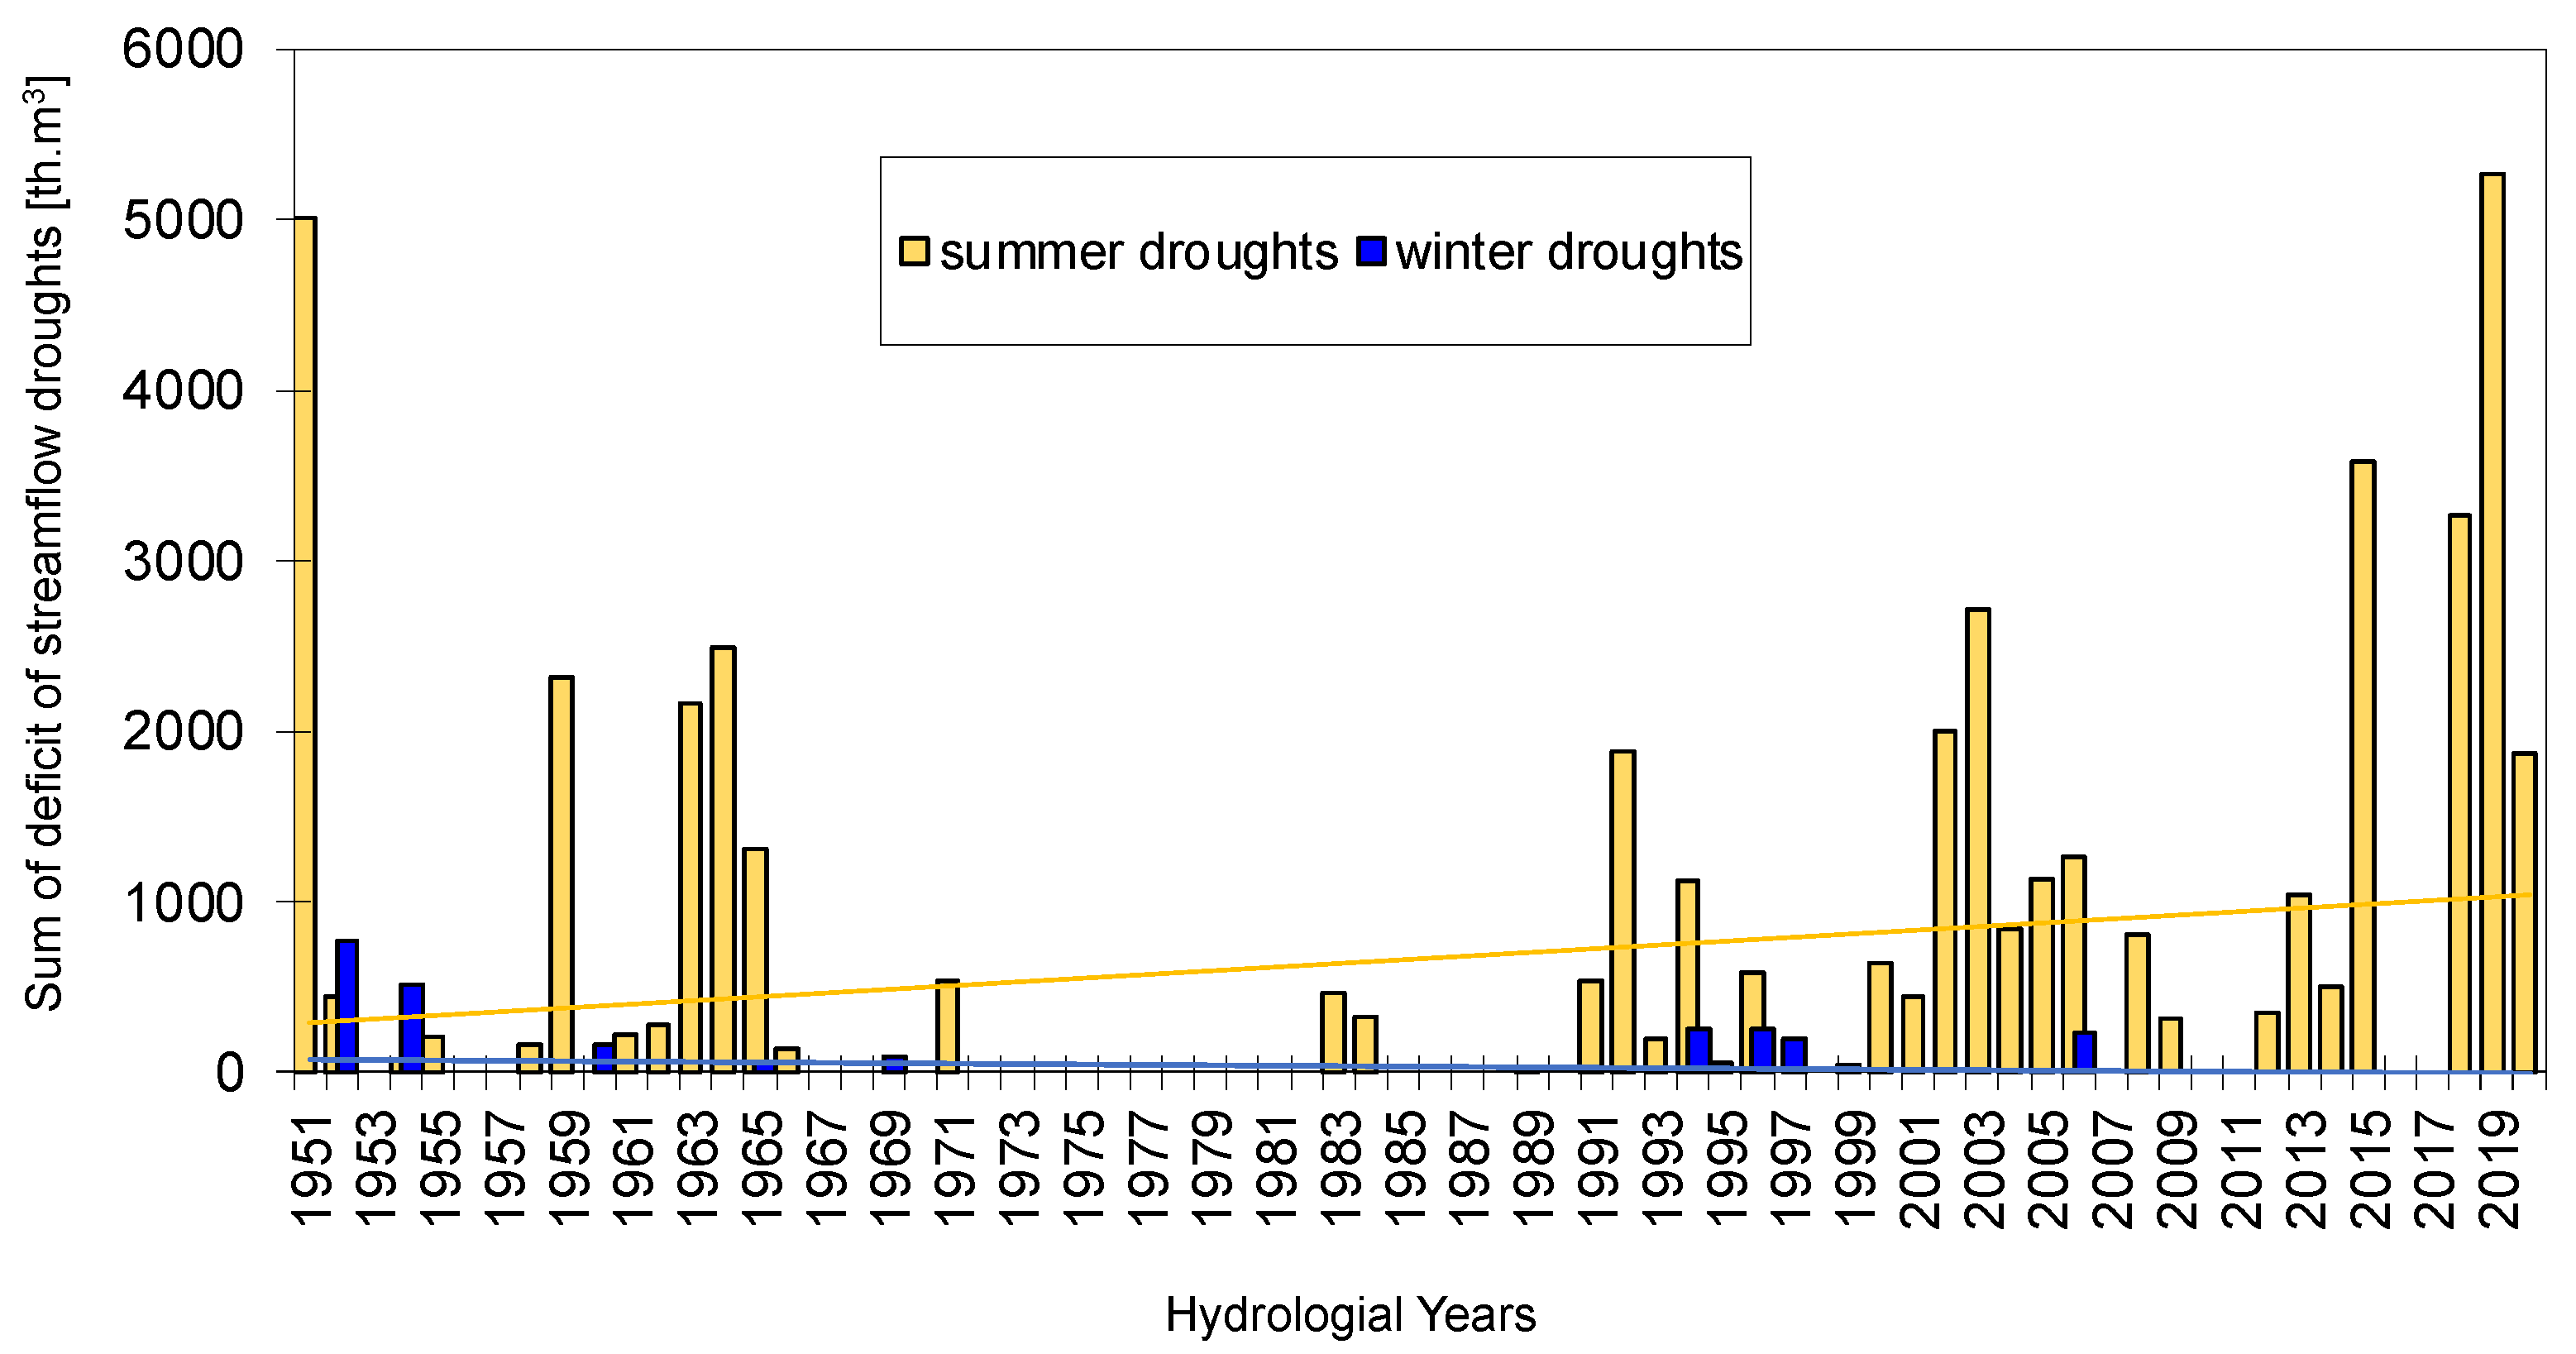
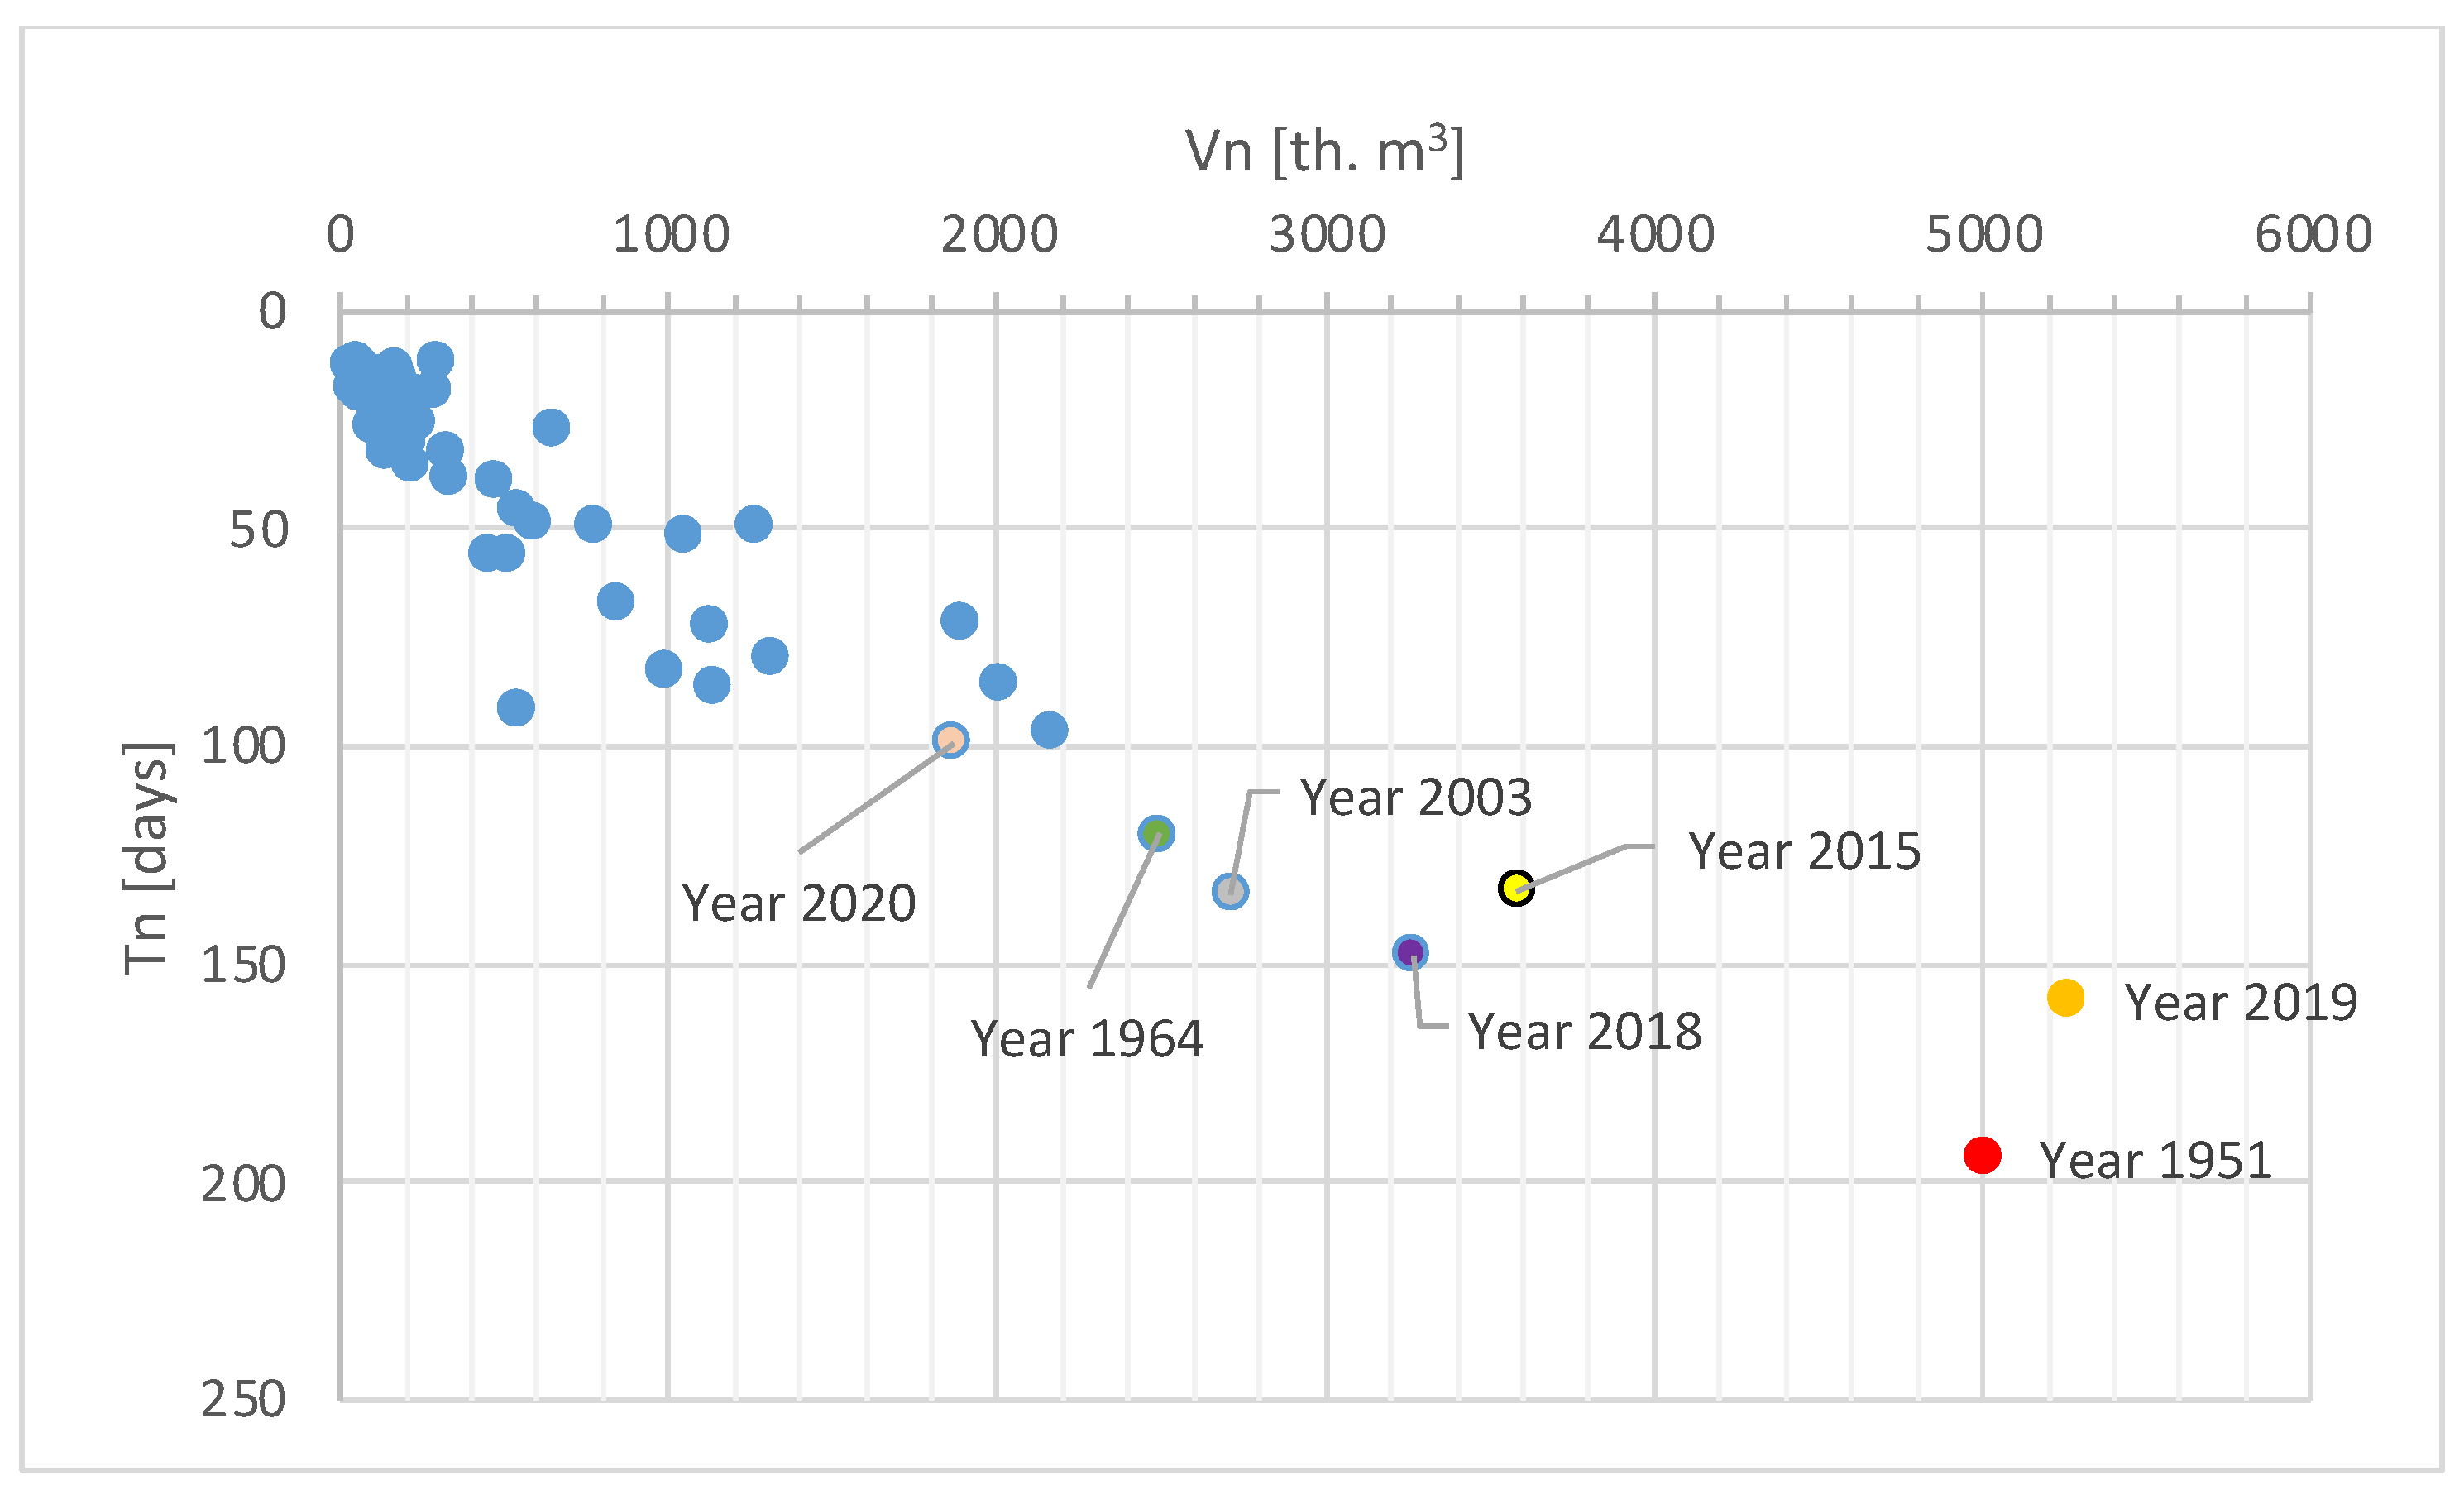
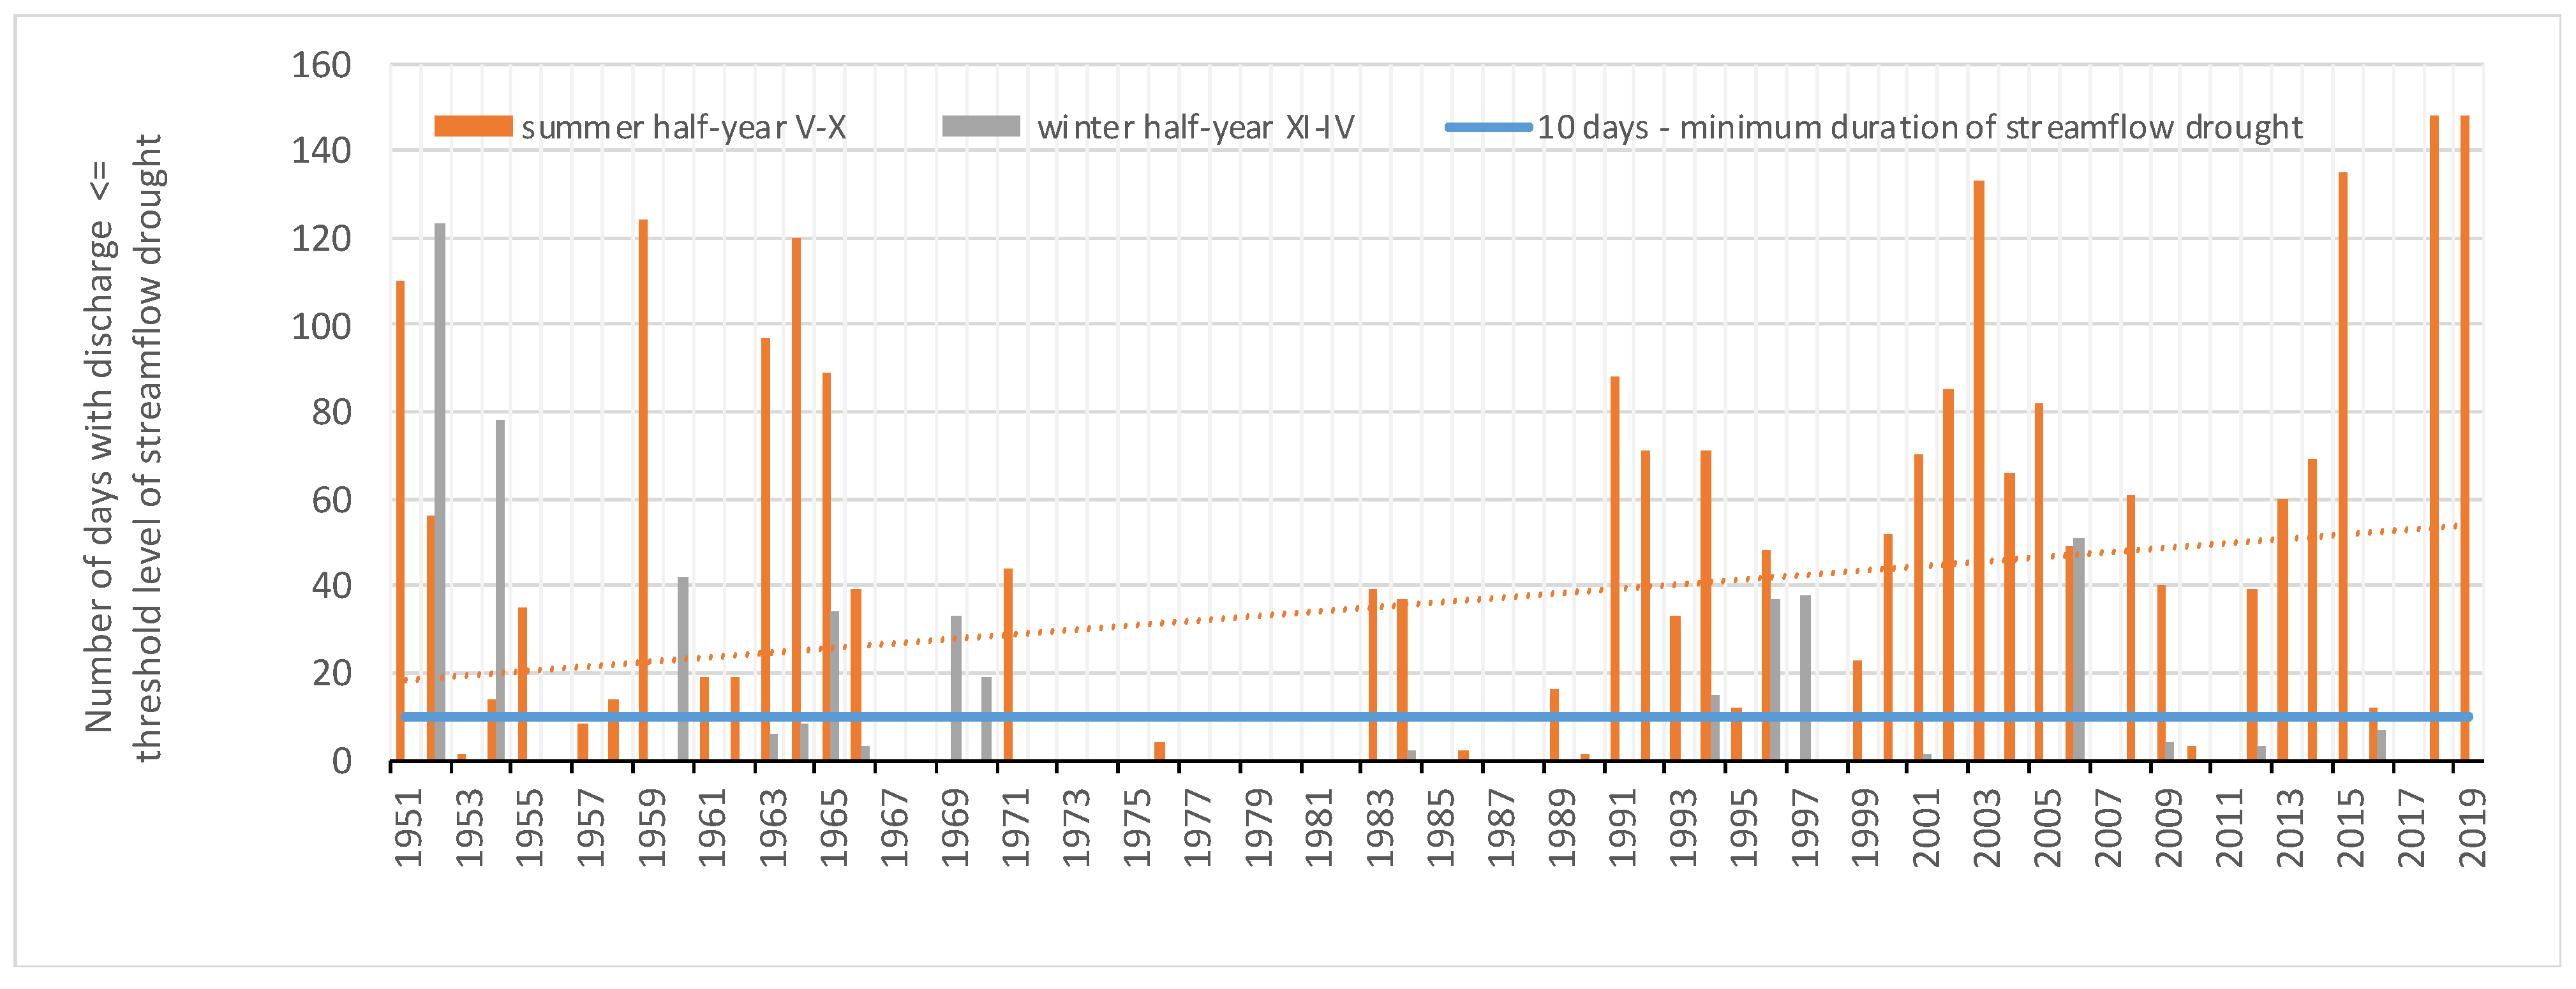
3. Results and Discussion

In the Narewka catchment in the period of the last 70 years, the mean annual air temperature significantly increased, while annual precipitation totals and the number of rainy days in Białowieża remained unchanged (Figure 4, Table 1). However, despite the lack of statistically significant changes in the course of the annual precipitation totals, a slight increase was noticeable (Figure 5 and Figure 6). These results correspond to both the research obtained in this work for the Białystok station (Figure 4, Table 1), located in the Narew basin, into which the Narewka flows, as well as to the research conducted for other regions of Poland, in both urbanized and non-urbanized areas [4,48,50,51,52,53,54]. In Białowieża, similarly to the annual precipitation totals, the sums from the summer and winter hydrological half-years also did not show a significant tendency to change over the past 70 years (1951–2020) (Figure 5, Table 1). When analyzing the course of annual rainfall totals in individual hydrological years (1951–2020), in relation to the average for this period of 637 mm, the RPI index was used. The time variability of the occurrence of dry, average, and wet years was obtained in relation to the long-term standard (Figure 6). In the period 1951–2020, there were 25 dry years (including 3 very dry) and 19 wet years (including 7 very wet) in Białowieża. The remaining 26 years were average years in terms of annual rainfall (Figure 6). The periodicity of dry and wet years is clearly visible, as repeatedly noticed in the literature for the lowland areas of Poland, including the Białowieża Forest [7,10,22,55,56], indicating the average cycle of variable hydrometeorological phenomena with a length of about 30 years [57]. The literature also shows the course of long-term fluctuations in the outflow in the shape of a quite clearly marked sinusoid with a period of 32–34 years [58]. The change in precipitation pattern is more pronounced if we consider monthly precipitation totals and relate them to the long-term norm [24], as well as analyzing the number of days with rainfall > 20 mm. The study stated that the last two decades of 2001–2020, in relation to all those occurring after 1951 (1951–70, 1971–90, 1981–2001, and 1991–2011), were characterized by the highest number of days with precipitation > 20 mm; however, the observed direction of changes was not statistically significant (Figure 7, Table 1). Despite the lack of significant changes in the annual or semi-annual rainfall totals, the visible increase in air temperature had an impact on the formation of the water resources of the catchment area, due to the increase in evaporation. According to the Lorenc thermal classification, commonly used by the IMWM-PIB for reference meteorological stations in Poland, the last decade (2011–2020) of the 21st century was exceptionally warm in relation to the long-term standard 1981–2010. From 2014 to 2020, with the exception of 2017, all years were particularly warm, anomalously warm, or even extremely warm [6]. The studies published to date indicate that climate change has already affected the Białowieża Forest [27], with a decrease in the number of days with the minimum air temperatures and an increase in the number of days with the maximum temperatures over the years of 1950–2007 [27]. For the next multiyear period, covering the years 1950–2015, published analyses for the Białowieża Primeval Forest [12] indicate the same directions of changes. During the 1950–2015 period, according to the Mann–Kendall test, there was a clear and significant 1.27 °C increase in temperature. Particularly noteworthy are the results for the spruce growth period (May–July), for which a significant temperature increase, amounting to 1.26 °C, occurred during 1951–2015. Similarly, in this work looking at the past 70 years (1951–2020), it can be clearly seen that the number of hot days (with temperatures above 30 degrees Celsius) has increased significantly (Figure 8, Table 1). Extreme ambient temperatures are particularly dangerous for the course of life processes. For plant species suited to temperate climates, the thermal optimum is 25–30 °C. The maximum temperature, also known as the lethal thermal maximum, reaches 35–40 °C [59].
The minimum (NQ), maximum (WQ), and average (SQ) annual flows for the period 1951–2020 are presented in Figure 9. The minimum and average flows show a statistically insignificant decreasing trend (Table 1), with record-low values in 2019 and 2020 (Figure 9). However, the maximum annual flows show a decrease in the statistically significant direction (alpha = 0.05) (Table 1). The reasons for the visible change should be sought in the warm and less snowy winters of recent years—especially in the winter from October 2019 to April 2020, which turned out to be the least snowy in the history of instrumental measurements in Poland [6]. In the Polish Lowlands, and locally in the southern and northeastern parts of the country, only episodes lasting several days with snow cover were recorded. Snow appeared at the beginning and end of December and January. A similar situation with local episodes lasting several days also took place at several stations in February and at the turn of March and April [6]. As floods on the Narewka River appear in the early spring, as a result of surface melting, their absence explains the low values of maximum annual flows (WQ) in recent years. The observed phenomenon of a decrease in spring runoff in the Narewka also applies to other rivers in the Polish Lowlands, for which there has been a decrease in the volume of floods in the winter half-year and a decrease in the number of days with flooding [51]. Particularly low water levels in 2018, 2019, and 2020 were observed on the Vistula River in Warsaw [60], where 2019 and 2020 were characterized by one of the lowest values of the total annual runoff of Polish rivers [6]. It should also be noted that a reduction in the annual sum of snowfall and its share in the total precipitation was observed in the lowland area of Poland in the years 1958–2000, and these changes were statistically significant [61]. Similarly, research conducted in the period 2003–2018 in a small catchment in the Kozienice Forest showed the same direction of changes—a visible decrease in the total number of days with snow cover in the winter half-year, and a decrease in the number of days with snow cover > 20 cm, until its absence in the hydrological years 2004, 2008, 2009, 2012, 2015, 2016, 2017, 2018 [51].The relationship between rainfall and runoff in the studied area of the Narewka River catchment is shown in Figure 10 and Figure 11; it is described by a runoff coefficient (c). Following the annual fluctuations (Figure 11), the change that occurred in the early 1980s–1983 can be observed. The c then decreased sharply from 38% in 1982 to 25% in 1983. This visible phenomenon is also noted for other lowland rivers in Poland [24,58,62]. As the year 1982 was one of the dry years in terms of annual rainfall totals (Figure 6), it ended the period of high runoff values lasting from the beginning of the 1970s (Figure 10)—a consequence of wet and very wet years due to annual rainfall totals (Figure 6). Since 1983, the outflow volumes have not reached the highest values recorded in the 1970s. There was a decrease in the outflows in the period 1951–2020 (Figure 10). Similarly, the value of the c has decreased in the past 70 years (1951–2020), undergoing a statistically significant change (Table 1). In 2020, the c amounted to 9.5%, and was thus far the lowest in the entire multiyear period of 1951–2020. Only for 1952, c (9.8%) (Figure 11), at the beginning of the 1951–2020 observation period, was close to this value. The relationship between rainfall and annual runoff in the Narewka catchment over the past 70 years is also presented in Figure 10. It can be seen that the direction of changes in the difference between P and H varied over time. In the long-term system, this difference can be treated as the so-called balance losses, and assuming a constant level of retention, at the beginning and the end of the analyzed series, as the amount of field evaporation [58]. The equation of the water balance of the catchment then takes the form P = H + E, where E is the field evaporation from the catchment area. For the territory of Poland, the average evaporation is 445 mm. This value characterizes the average conditions of the water cycle in Poland, as determined for the period 1951–1990 [63]. In the case of the Białowieża Forest, for the period 1951–2020, the value of evaporation from the water balance equation was 491 mm (Figure 10). However, for the period 1951–1990, this value was lower by 10 mm (2%), at 481 mm. Analyzing the balance losses (P–H) (Figure 10 and Figure 11) during the period 1951–2020, it can also be seen that the beginning of the 1980s was a breakthrough period. The size of the difference between rainfall and runoff decreased significantly compared to the 1970s. From the 1980s until the end of the 1990s, the differences between rainfall and runoff for many years were much lower than the long-term average—especially in the dry year 1982 and the very dry year 1991. Such low values were not recorded later, in the past two decades of the 21st century. Additionally, during the period 1951–2020, in the Narewka River catchment, balance losses increased and river runoff decreased, regardless of the rainfall, for which the annual sums do not show a definite direction of changes (Figure 5 and Figure 6); however, the observed trends are not statistically significant (Table 1). As noted by Jokiel and Bartnik [58], when examining changes in water resources in the central area of Poland, low outflows in the 1980s and 1990s arose only to a small extent from insufficient moisture. This may be associated with an absolute increase in evaporation over the year. The increase in evaporation for the Białowieża Primeval Forest may result from climatic changes, the effect of which is an increase in temperature and an extension of the vegetation time. For each particular year in the period 1951–2020, the measure of the seasonal runoff structure was calculated—the term of a half-outflow (TPO) (Figure 12). This measure marks the day of the hydrological year when the sum of the runoff reaches half of the annual value [39]. The range between the earliest (day 93; 1 February 1975) and the latest dates of the half outflow (day 259; 7 July 1980) for the Narewka is 166 days (almost 6 months). This value is more than a month lower than that recorded for rivers in central Poland (206 days) [39]. The long-term mean half-outflow term (in days) in the Narewka falls on the 153rd day of the hydrological year, i.e., on April 1 (Figure 12). The author of the TPO emphasizes that this is not a perfect measure. When defining the measure, it is assumed that the (hydrological) year is a “closed” time unit in which the outflows are independent of those occurring earlier, and will not affect the later ones. In the context of high inertia of the outflow caused, inter alia, by retention, this assumption is not always true, which should be kept in mind [39]. Thus, the late date of mid-runoff in year j significantly influences the appearance of early TPO in year j + 1, and vice versa. Previous studies of the long-term variability of the TPO conducted for the rivers of central Poland (43–53-year series from the period 1951–2002) indicate that late TPO is typical for years with very high precipitation sums in the warm half-year. The early TPOs are characterized by the years when rainfall and summer floods were lower than the average, while low flows dominated in the summer–autumn flow hydrographs [39]. For the Narewka catchment, a similar relationship can be noted in this study. It is also visible that in the last years from 2014 to 2020 all TPOs were lower than the long-term average. Particularly early TPOs occurred in 2015 (117 days, February 25), 2018 (day 94, February 2), and 2019 (day 110, February 18). The years 2015 and 2019 were not only dry in terms of water abundance, but were also characterized by one of the lowest values of the total annual runoff of Polish rivers from the years 1951 to 2020 [6]. Comparison of the long-term values of the TPO (Figure 12), the outflow (H) (Figure 10), and the runoff coefficient (c) (Figure 11), as well as the annual values of the flows NQ, SQ, and WQ (Figure 9), there is a tendency toward reducing the amount of runoff from the Białowieża Primeval Forest. However, only for the coefficient c, the annual values of the maximum flows of the Narewka River, and TPO is this change statistically significant (Table 1). According to the Pettitt test, the change point occurred between 1988 and 1989 for these characteristics.
The years 1988 and 1989 were average in terms of total river runoff in Poland. However, the year 1988 was characterized by values higher than the long-term average, and 1989 was characterized by an outflow lower than the average. From 1989, one of the longer and more catastrophic dry periods began in Poland, lasting until the mid-1990s [64]. The analysis of the annual temperature envelope presented in the literature indicates that the increase in the annual temperature over Poland was not uniform, but between 1987 and 1989 there was a step change in the thermal regime. After 1988, the structure of the types of synoptic situations and the weather associated with them led to a strong increase in insolation. This caused the increase in the temperature in July and August over Poland, and also over large areas of Europe [65], which had a direct impact on the observed direction of changes in hydrometeorological characteristics in the studied area in the analyzed multiyear period.
Research thus far on the occurrence of the hydrological drought in the Białowieża Primeval Forest has been conducted in the periods 1951–2002 and 1951–2005 [7]. In this work, which is a continuation of that research, the research period is longer, covering the past 70 years (1951–2020). The analysis concerned the frequency and size of low flows in the Narewka profile as an indicator of hydrological droughts. During the period 1951–2020, 62 streamflow droughts were identified using the Q90% value as the threshold (Table 2). Summer streamflow droughts predominate in the Narewka river profile of the Narewka catchment, constituting over 80% of all droughts occurring there (Table 2, Figure 13). The average duration of summer streamflow drought surpasses 50 days, while that of winter is ~30 days (Table 2). The winter droughts are shorter and less intensive than the summer ones. The average duration of the summer low flow in the multiyear period 1951–2020 was over a week longer compared to the period 1951–2002 [7]. The beginning of streamflow drought occurrence in the summer half-year usually falls on July and June, and rarely in August. The end of summer drought periods usually occurs in September or October but, in rare cases, the period of drought lasts longer—up to the first half of November—as in 1959, 1965, 2000, 2005, 2019. The last winter drought was noted in 2006 (Figure 13). The lack of winter droughts is caused by winter heating, as can be observed in [6]. Three periods differing in streamflow drought occurrence numbers can be seen on the Narewka River (Figure 13): The period 1951–1966 is the first, wherein drought appeared almost every year. The second is 1967–1982, with the absence of droughts; only two of them occurred—in the winter of 1969 and the summer of 1971. In the third period, 1983–2020, droughts appeared almost every year (Figure 13). The periods with the different occurrence of droughts as defined for the multi-annual period 1951–2020 can be compared via the variability of annual precipitation sums (Figure 6). In the last period of 1983–2020, summed up in individual years, the duration of summer low flows and their deficits (Figure 14 and Figure 15) were greater than in the period 1951–1966, with similar annual rainfall sums which, especially in recent years, is affected not only by the shortage of rainfall, but also by an increase in field evaporation per year. The increase in evaporation is clearly due to the increase in air temperature. Despite significant afforestation, the retention resources of the Narewka catchment are not large [33], and precipitation deficits cause a significant reduction in the runoff, intensified by an increase in field evaporation. According to Fal [33], deep groundwater deposition was found in the Białowieża National Park, meaning the possibility of periodical lack of contact between river water and groundwater. The tributaries of the Narewka, such as the rivers Łutownia and Orłówka, are characterized by shallowly cut channels, and the good permeability of the wild habitats creates favorable conditions for the infiltration of rainwater. This translates into a beneficial effect of the forest in reducing high flows, but not in compensating for low flows.
The longest streamflow drought in the Narewka lasted 194 days; it began on 12 July 1951 and ended on 23 January 1952, and its discharge deficit amounted to 5,002,560 m3. The minimum discharge was recorded during that streamflow drought, at 0.30 m3s−1 on 25 November 1951 (Table 2). The summer drought characterized by the largest volume of water deficit and highest intensity took place in 2019; the deficit volume (Vn) was the largest in the whole study period, and amounted to 5,262,620 m3. The deficit of the drought from 2019 comprised 11% of the sum of all summer drought deficits identified by truncation level Q90%. The drought intensity (In) in 2019, understood as the amount of drought deficit (the volume of runoff) for one day of its duration, was the largest in the period 1951–2020 (Table 2, Figure 16)—this streamflow drought lasted 158 days; it started on 6 June 2019 and ended on 10 November 2019. During this streamflow drought, the lowest discharge (NQ; Figure 9) in the whole period was recorded: NQmin, n = 0.23 m3s−1.
To answer the question regarding the possible increase in the risk of summer low flow in the Białowieża Forest, the direction of changes in selected measures was examined (Table 2, Figure 14, Figure 15 and Figure 16). In individual years of the period 1951–2020, the durations and deficits of low flows were added up; the highest intensity of low flows in a given year was selected (if there were more than one), as was the lowest flow of low flows in a given year. From the measures presented, it can be seen that the duration of low flows, their intensity, and the volume of the deficit all increase, but only the last measure is statistically significant. In the case of the minimum flows of low flows, there was no alarming tendency to reduce them (Table 3). On the other hand, when assessing the parameters (duration, deficit volume, intensity) of the summer low flows recorded in the years 2015, 2018, and 2019 (Figure 17), compared to the averages determined for the multiannual period 1951–2020 (Tav,n; Vav,n; Iav,n; Table 2), it can be seen that the water resources of the Białowieża Primeval Forest have decreased; this is due to both warm, less snow winters and increases in air temperature and field evaporation.
In this work, the low flow phenomenon is defined by the flow limit Q90% and a minimum duration of 10 days. Daily flow hydrographs may have shorter periods than the assumed minimum 10 days in which the flow is ≤Q90%. Therefore, in the period 1951–2020, the number of days with the low flow was also counted, separately considering the summer and winter half-years. In the case of the summer half-years, the number of days with low flow increased statistically (Table 3, Figure 18). According to the Pettitt test, the change point occurred in 1990.
The statistically significant directions of changes in the selected measures shown above may indicate a lack of stability in the regime of low flows, and the water resources of the Białowieża Primeval Forest are sensitive to the observed changes in climate elements, with only a limited possibility of mitigating water stress with retention, due to the abundance and location of aquifers.
However, the outflow of the Narewka River draining the Białowieża Forest is highly irregular. The flows in the same periods of different years show great irregularity. This can be seen by observing the hydrographs of daily flows from the hydrological years 1951, 2015, and 2019 (in which deep summer low flows occurred), along with the hydrograph from 2020. The low pressure may occur after a period of rapid increases inflows in Narewka—as was the case in 1951—or as a result of the slow depletion of water resources in the catchment area, as in 2015 and 2020 (Figure 19).
The course of average daily flows for the multiyear period of 1951–2020 in the Narewka profile was also compared to the shorter period 1951–2002 (Figure 19). There were no changes in the course of mean values in the summer half-year. However, when comparing the winter half-year, it can be seen that in February the values were higher, and in April they were lower, in the period 1951–2020 compared to 1951–2002. These changes result from the increasingly warmer months of winter and less snowy winters [6,51].

4. Conclusions

The condition of the forest ecosystems of the Białowieża Primeval Forest depends on the size of the water resources. The Narewka River along with its tributaries discharges water from the central and northern parts of the Białowieża Forest to the Narew River, lying in the Vistula basin. Despite significant afforestation, the retention resources of the Narewka catchment are not large [33]. The shallow presence of the groundwater table on large surfaces prevents the accumulation of larger amounts of water in the substrate. Locally, in the northeastern part of the catchment area, groundwater is deeper than 2 m below the surface and less frequently below 4–5 m from the surface [31]. This means that rivers and groundwater may not come into contact from time to time. The impact of afforestation on the hydrological conditions may manifested in the form of increased evaporation, which is covered with high rainfall in the summer months. In general, well-drained forest soils create favorable conditions for the infiltration of rainwater. The annual runoff cycle is therefore typical for lowland rivers in Poland, where most of the runoff comes from the surface meltwater supply, and the summer runoff is influenced by the ground supply. With regard to low flows in the Narewka catchment, the mitigating role of the forest is not noticed, as is the case with maximum flows [33]. Therefore, the water resources of the Białowieża Primeval Forest are sensitive to the occurrence of the phenomenon of drought. The Narewka catchment area is located in the northeastern part of Poland, and is prone to the frequent occurrence of hydrological droughts, which threaten the particularly valuable biotopes of alder and bog forest in the Białowieża National Park [35]. The arising disturbances in the water management of forest habitats may cause very profound changes in the species of plant communities. Studies on the location of groundwater in the alder habitats of the Białowieża Primeval Forest, published in the literature on the subject, have shown an increase in the amplitude of groundwater-level fluctuations since the mid-1980s [22]. The changes taking place in the stands of the Strict Reserve of the Białowieża National Park, having been monitored for ~80 years, show that during this period there was, inter alia, a strong reduction in the role of spruce (a species associated with a cool and humid climate) in these stands and a significant increase in the role of linden—especially hornbeam (i.e., species associated with a warmer climate and being more resistant to drought) [14]. The decisive factors for the dieback of spruce in the Białowieża Primeval Forest are droughts and increases in air temperature [12]. The research presented in the paper for the past 70 years (1951–2020) has shown that low flows of surface waters have appeared as an indicator of hydrological droughts almost every year since 1983, and in the recent years of 2015, 2018, and 2019, the sizes of the Narewka’s summer low flows have definitely exceeded their long-term average values. In 2019, the most severe summer low flow occurred among all of those recorded to date, in terms of intensity, volume deficit, and minimum flow. Only the low flow from the beginning of the 1951 research period lasted more than a month. No winter low flows were recorded after 2006. The reasons for this phenomenon can be found in the extremely hot summer periods, which have appeared more and more often since the end of the 20th century, as well as very warm spring and autumn periods [2]. The research presented in this paper confirms that both the average annual temperatures and the number of days with temperatures above 30 degrees Celsius have increased significantly in the area of the Białowieża Primeval Forest. Taking into account the above regularities, it can be argued that the changes in the water balance in the Białowieża Primeval Forest caused by warming and increased evaporation, along with less snowy winters, were so significant in the most recent years of the analyzed period that they caused one of the deepest low flows of the Narewka to date. The analysis of the trend over the past 70 years shows that the aggregated annual volumes of low flows and the number of days with low flows are increasing significantly. This may indicate a significant and relatively permanent change in the seasonal structure of the river runoff in the event of the summer low flow. There is a visible tendency to reduce the amount of runoff from the Białowieża Primeval Forest. However, this change is statistically significant only for the runoff coefficient and the annual values of the maximum flows of the Narewka River, as well as for the time of mid-runoff. It is necessary to continue works to improve the water balance by means of small retention methods in the catchment area—especially in the context of unfavorable climate forecasts regarding the increase in the intensity and frequency of droughts.

Author Contributions

Conceptualization, L.H. and E.K.; methodology, E.K.; writing—original draft preparation, L.H., E.K. and A.H.; formal analysis, M.W.; investigation, E.K.; writing—review and editing, L.H., A.H. and M.W.; visualization, M.W. All authors have read and agreed to the published version of the manuscript.

Funding

This research received no external funding.

Institutional Review Board Statement

Not applicable.

Informed Consent Statement

Not applicable.

Data Availability Statement

The data is available on request.

Conflicts of Interest

The authors declare no conflict of interest.

References

  1. Twardosz, R. Zmiany częstości anomalii termicznych w Polsce w latach 1951–2015. Pol. J. Agron. 2017, 8, 3–10. [Google Scholar]
  2. Kossowska-Cezak, U.; Twardosz, R. Anomalie termiczne o dużym zasięgu przestrzennym w Europie (1951–2018) Thermal anomalies with large geographic coverage in Europe (1951–2018). In Współczesne Problemy Klimatu Polski; Instytut Meteorologii i Gospodarki Wodnej Państwowy Instytut Badawczy: Warszawa, Poland, 2019; pp. 27–40. [Google Scholar]
  3. Graczyk, D.; Pińskwar, I.; Kundzewicz, Z.W.; Hov, Ø.; Førland, E.J.; Szwed, M.; Choryński, A. The Heat Goes on—Changes in Indices of Hot Extremes in Poland. Theor. Appl. Climatol. 2017, 129, 459–471. [Google Scholar] [CrossRef] [Green Version]
  4. Kubiak-Wójcicka, K. Variability of Air Temperature, Precipitation and Outflows in the Vistula Basin (Poland). Resources 2020, 9, 103. [Google Scholar] [CrossRef]
  5. Roudier, P.; Andersson, J.C.M.; Donnelly, C.; Feyen, L.; Greuell, W.; Ludwig, F. Projections of Future Floods and Hydrological Droughts in Europe under a +2 °C Global Warming. Clim. Chang. 2016, 135, 341–355. [Google Scholar] [CrossRef] [Green Version]
  6. Wereski, S.; Pawelec, W. (Eds.) Biuletyn Państwowej Służby Hydrologiczno-Meteorologicznej; Instytut Meteorologii i Gospodarki Wodnej Państwowy Instytut Badawczy: Warszawa, Poland, 2020. [Google Scholar]
  7. Ciepielowski, A.; Kaznowska, E. A Description of Hydrological Droughts in the Białowieża Primeval Forest in the Years 2003–2005. Geogr. Pol. 2007, 80, 125–136. [Google Scholar]
  8. Pietzsch, B.W.; Peter, F.J.; Berger, U. The Effect of Sanitation Felling on the Spread of the European Spruce Bark Beetle—An Individual-Based Modeling Approach. Front. For. Glob. Chang. 2021, 4, 103. [Google Scholar] [CrossRef]
  9. Boczoń, A.; Kowalska, A.; Dudzińska, M.; Wróbel, M. Drought in Polish Forests in 2015. Pol. J. Environ. Stud. 2016, 25, 1857–1862. [Google Scholar] [CrossRef]
  10. Boczoń, A. Charakterystyka Warunków Termiczno- Pluwialnych w Puszczy Białowieskiejw Latach 1950–2003 (Characteristics of Thermal and Pluvial Conditions in the Białowieża Primeval Forest between 1950 and 2003). Leśne Pr. Badaw. For. Res. Pap. 2006, 1, 57–72. [Google Scholar]
  11. Szostak, R. Dlaczego Giną Dęby? Echa Leśne 2006, 6, 16–17. [Google Scholar]
  12. Boczoń, A.; Kowalska, A.; Ksepko, M.; Sokołowski, K. Climate Warming and Drought in the Bialowieza Forest from 1950–2015 and Their Impact on the Dieback of Norway spruce Stands. Water 2018, 10, 1502. [Google Scholar] [CrossRef] [Green Version]
  13. Grodzki, W. Gradacyjne Występowanie Kornika Drukarza Ips Typographus (L.) (Col.: Curculionidae, Scolytinae) w Aspekcie Kontrowersji Wokół Puszczy Białowieskiej. Mass Outbreaks of the Spruce Bark Beetle Ips Typographus in the Context of the Controversies around the Białowieża Primeval Forest. Leśne Pr. Badaw. For. Res. Pap. 2016, 77, 324–331. [Google Scholar] [CrossRef] [Green Version]
  14. Brzeziecki, B. Zmiany klimatu i ich następstwa dla ekosystemów leśnych. In Zmiany Klimatu i ich Następstwa; Instytut Problemów Współczesnej Cywilizacji im. Marka Dietricha; Wydawnictwo SGGW: Warszawa, Poland, 2021; Volume 73, ISBN 978-83-89871-44-2. [Google Scholar]
  15. Hanewinkel, M.; Cullmann, D.A.; Schelhaas, M.-J.; Nabuurs, G.-J.; Zimmermann, N.E. Climate Change May Cause Severe Loss in the Economic Value of European Forest Land. Nat. Clim. Chang. 2013, 203–207. [Google Scholar] [CrossRef]
  16. Zajączkowski, J.; Brzeziecki, B.; Perzanowski, K.; Kozak, I. Wpływ Potencjalnych Zmian Klimatycznych Na Zdolność Konkurencyjną Głównych Gatunków Drzew w Polsce. Sylwan 2013, 157, 253–261. [Google Scholar]
  17. Agyei, T.; Juráň, S.; Ofori-Amanfo, K.K.; Šigut, L.; Urban, O.; Marek, M.V. The Impact of Drought on Total Ozone Flux in a Mountain Norway Spruce Forest. J. For. Sci. 2020, 66, 280–278. [Google Scholar] [CrossRef]
  18. Ochrona Przyrody i Gospodarka Leśna w Puszczy Białowieskiej; Najwyższa Izba Kontroli (NIK): Warsaw, Poland, 2019.
  19. Romanowicz, R.J.; Bogdanowicz, E.; Debele, S.E.; Doroszkiewicz, J.; Hisdal, H.; Lawrence, D.; Meresa, H.K.; Napiórkowski, J.J.; Osuch, M.; Strupczewski, W.G.; et al. Climate Change Impact on Hydrological Extremes: Preliminary Results from the Polish-Norwegian Project. Acta Geophys. 2016, 64, 477–509. [Google Scholar] [CrossRef] [Green Version]
  20. Piniewski, M.; Szcześniak, M.; Kundzewicz, Z.W.; Mezghani, A.; Hov, Ø. Changes in Low and High Flows in the Vistula and the Odra Basins: Model Projections in the European-Scale Context. Hydrol. Process. 2017, 31, 2210–2225. [Google Scholar] [CrossRef]
  21. Piniewski, M.; Marcinkowski, P.; Kundzewicz, Z.W. Trend Detection in River Flow Indices in Poland. Acta Geophys. 2018, 66, 347–360. [Google Scholar] [CrossRef] [Green Version]
  22. Pierzgalski, E.; Boczoń, A.; Tyszka, J. Zmienność Opadów i Położenia Wód Gruntowych w Białowieskim Parku Narodowym. Kosmos. Probl. Nauk Biol. 2002, 51, 415–425. [Google Scholar]
  23. Czerepko, J.; Boczoń, A.; Pierzgalski, E.; Sokołowski, A.W.; Wróbel, M. Habitat Diversity and Spontaneous Succession of Forest Wetlands in Bialowieza Primeval Forest. In Proceedings of the International Conference W3M “Wetlands: Modeling, Monitoring, Management”, Wierzba, Poland, 22 September 2005; pp. 37–43. [Google Scholar]
  24. Hejduk, L.; Kaznowska, E.; Wasilewicz, M.; Hejduk, A. Dynamics of the Natural Afforestation Process of a Small Lowland Catchment and Its Possible Impact on Runoff Changes. Sustainability 2021, 13, 10339. [Google Scholar] [CrossRef]
  25. Wróbel, M.; Boczoń, A.; Gawryś, R.; Kowalska, A. The Effect of Beaver Activity on Artificial Impoundment on the Braszcza River in the Białowieża Primeval Forest. Balt. For. 2016, 22, 5. [Google Scholar]
  26. Stereńczak, K.; Kraszewski, B.; Mielcarek, M.; Piasecka, Ż. Inventory of Standing Dead Trees in the Surroundings of Communication Routes—The Contribution of Remote Sensing to Potential Risk Assessments. For. Ecol. Manag. 2017, 402C, 76–91. [Google Scholar] [CrossRef]
  27. Łubek, A.; Kukwa, M.; Jaroszewicz, B.; Czortek, P. Shifts in Lichen Species and Functional Diversity in a Primeval Forest Ecosystem as a Response to Environmental Changes. Forests 2021, 12, 686. [Google Scholar] [CrossRef]
  28. Matuszkiewicz, J.M.; Affek, A.N.; Kowalska, A. Current and Potential Carbon Stock in the Forest Communities of the Białowieża Biosphere Reserve. For. Ecol. Manag. 2021, 502, 119702. [Google Scholar] [CrossRef]
  29. Chylarecki, P.; Gutowski, J.; Jaroszewicz, B.; Kowalczyk, R.; Kujawa, A.; Latałowa, M.; Mikusiński, G.; Orczewska, A.; Samojlik, T.; Selva, N.; et al. Puszcza Białowieska Miniprzewodnik Naukowy; Instytut Biologii Ssaków Polskiej Akademii Nauk: Białowieża, Poland, 2020. [Google Scholar]
  30. Bielecka, J.; Hardej, M.; Kozłowska, E.; Stepaniuk, W. Walory Przyrodnicze i Hydrologiczne Małych Zbiorników Wodnych Wybudowanych w Puszczy Białowieskiej. Woda-Sr.-Obsz. Wiej. 2006, 6, 17–27. [Google Scholar]
  31. Michalczuk, C. Siedliska i Drzewostany Białowieskiego Parku Narodowego (z 2 Mapami 1:20,000) (Forest Habitats and Treestands of the Białowieża National Park (with 2 Maps in 1:20,000). Phytocoen. Suppl. Cartogr. Geobot. 2001, 13, 1–22. [Google Scholar]
  32. Głogowska (Kaznowska), E. Występowanie Niżówek w Zlewniach o Odmiennych Warunkach Fizycznogeograficznych (The Occurrence of Low Flow Events in the Physical-Geographical Conditions of River Catchments); Szkoła Główna Gospodarstwa Wiejskiego w Warszawie: Warszawa, Poland, 2005. [Google Scholar]
  33. Fal, B. Odpływ z Terenu Puszczy Białowieskiej w Zlewni Rzeki Narewki. Gospod. Wodna 1966, 397–398. [Google Scholar]
  34. Dynowska, I. Typy Reżimów Rzecznych w Polsce; Zesz. Nauk. Uniw. Jagiellońskiego: Kraków, Poland, 1971; Volume CCLXVIII. [Google Scholar]
  35. Kaznowska, E. Charakterystyka susz hydrologicznych na przykładzie wybranych rzek północno-wschodniej części Polski (The Characteristics of Hydrological Droughts as Exemplified by Selected Rivers in the North-East Poland). Infrastrukt. I Ekol. Teren. Wiej. 2006, 4, 51–59. [Google Scholar]
  36. Bąk, B.; Łabędzki, L. Assessing Drought Severity with the Relative Precipitation Index and the Standardised Precipitation Index. J. Water Land Dev. 2002, 12, 89–105. [Google Scholar]
  37. Bartnik, A.; Jokiel, P. Niektóre Problemy Zmian i Zmienności Rocznego Hydrogramu Przepływu Rzeki Na Podstawie Pilicy w Przedborzu. Wiadomości IMGW 2005, XXVIII, 5–31. [Google Scholar]
  38. McCabe, G.J.; Clark, M.P. Trends and Variability in Snowmelt Runoff in the Western United States. J. Hydrometeorol. 2005, 6, 476–482. [Google Scholar] [CrossRef] [Green Version]
  39. Jokiel, P. Sezonowa struktura odpływu rzecznego w środkowej Polsce i jej zmiany w wieloleciu w świetle krzywych sumowych i terminów połowy odpływu. Przegl. Geograf. 2016, 88, 53–74. [Google Scholar] [CrossRef]
  40. Hisdal, H.; Tallaksen, L.M.; Clausen, B.; Peters, E.; Gustard, A. Hydrological Drought Characteristics. In Hydrological Drought—Processes and Estimation Methods for Streamflow and Groundwater; Tallaksen, L.M., van Lanen, H.A.J., Eds.; Developments in Water Science; Elsevier: Amsterdam, The Netherlands, 2004; pp. 139–198. [Google Scholar]
  41. Kaznowska, E. Analysis of low flow characteristics and drought frequency in agricultural catchments. In Prediction and Reduction of Diffuse Pollution, Solid Emission and Extreme Flows from Rural Areas—Case Study of Small Agricultural Catchment; Banasik, K., Øygarden, L., Hejduk, L., Eds.; Wydawnictwo SGGW: Warszawa, Poland, 2011; pp. 27–46. [Google Scholar]
  42. Tomaszewski, E. Hydrological Droughts in Central Poland-Temporal and Spatial Patterns. Geogr. Pol. 2007, 80, 117–124. [Google Scholar]
  43. Tokarczyk, T. Classification of Low Flow and Hydrological Drought for a River Basin. Acta Geophys. 2012, 61. [Google Scholar] [CrossRef]
  44. Tallaksen, L.; van Lanen, H.A.J. Hydrological Drought. Processes and Estimation Methods for Streamflow and Groundwater; Developments in Water Science; Elsevier: Amsterdam, The Netherlands, 2004; ISBN 978-0-444-51688-6. [Google Scholar]
  45. Kaznowska, E. Analysis of Hydrological Drought in the Biebrza River at the Burzyn Gauge 1951-2002. In Wetlands: Monitoring, Modelling and Management; Okruszko, T., Ed.; Taylor & Francis Group: London, UK, 2007; pp. 3–7. [Google Scholar]
  46. Jakubowski, W.; Radczuk, L. Nizowka2003 Software. In Hydrological Drought—Processes and Estimation Methods for Streamflow and Groundwater; Tallaksen, L.M., van Lanen, H.A.J., Eds.; Developments in Water Science; Elsevier: Amsterdam, The Netherlands, 2004. [Google Scholar]
  47. Kaznowska, E.; Hejduk, A.; Kempiński, C. The Vistula River Low Flows in Warsaw in the 21st Century. Acta Sci. Pol. Form. Circumiectus 2018, 1, 29–38. [Google Scholar] [CrossRef]
  48. Krajewski, A.; Sikorska-Senoner, A.E.; Ranzi, R.; Banasik, K. Long-Term Changes of Hydrological Variables in a Small Lowland Watershed in Central Poland. Water 2019, 11, 564. [Google Scholar] [CrossRef] [Green Version]
  49. Pettitt, A.N. A Non-Parametric Approach to the Change-Point Problem. J. R. Stat. Society. Ser. C (Appl. Stat.) 1979, 28, 126–135. [Google Scholar] [CrossRef]
  50. Miler, A. Climate of the Wielkopolski National Park in the Period of 1848–2017. For. Lett. 2018, 111, 6–11. [Google Scholar]
  51. Kaznowska, E.; Banasik, K.; Hejduk, A.; Krajewski, A.; Wasilewicz, M.; Hejduk, L.; Gładecki, J. Charakterystyki Hydrologiczne Małej Zlewni Południowego Mazowsza Od Połowy XX Wieku (Hydrological Characteristic since the Mid-Twentieth Century of Small Catchment in Southern Mazovian Region, Poland). In Współczesne problemy klimatu Polski; Chojnacka-Ożga, L., Lorenc, H., Eds.; Wydawnictwo IMGW-PIB: Warszawa, Poland, 2019; pp. 135–146. [Google Scholar]
  52. Czarnecka, M.; Nidzgorska-Lencewicz, J. Wieloletnia zmienność sezonowych opadów w Polsce. Woda-Sr.-Obsz. Wiej. 2012, 2, 45–60. [Google Scholar]
  53. Górski, T. Changes in Poland’s Agroclimatic Conditions over the Last Century. Pap. Glob. Chang. IGBP 2007, 14, 55–67. [Google Scholar]
  54. Szwed, M. Variability of Precipitation in Poland under Climate Change. Theor. Appl. Climatol. 2019, 135, 1003–1015. [Google Scholar] [CrossRef] [Green Version]
  55. Kaznowska, E.; Banasik, K. Ocena Intensywności Niżówek Rzecznych w Malej Zlewni Rolniczej Niziny Mazowieckiej w Ostatnich 45 -Latach (Intensity of Streamflow Droughts in Small Agricultural Catchment of Mazowiecka Lowland in Last 45 Years). Acta Sci. Form. Circumiectus 2009, 8, 5–16. [Google Scholar]
  56. Banasik, K.; Hejduk, L. Variability in Runoff from a Small Agricultural Catchment—Based on Long Term Monitoring Data. In Prediction and Reduction of Diffuse Pollution, Solid Emission and Extreme Flows from Rural Areas—Case Study of Small Agricultural Catchment; Banasik, K., Øygarden, L., Hejduk, L., Eds.; Wydawnictwo SGGW: Warszawa, Poland, 2011; pp. 7–25. [Google Scholar]
  57. Byczkowski, A.; Banasik, K.; Hejduk, A.; Mandes, B. Wieloletnie Tendencje Zmian Opadu i Odpływu w Małych Zlewniach Nizinnych Na Przykładzie Rzeki Zagożdżonki. In Dynamika Obiegu Wody w Zlewniach Rzecznych; Jaworski, J., Szkutnicki, J., Eds.; Monografie: Polskie Towarzystwo Geofizyczne; IMGW: Warszawa, Poland, 2001; pp. 43–52. [Google Scholar]
  58. Jokiel, P.; Bartnik, A. Zmiany w Sezonowym Rozkładzie Odpływu w Polsce Środkowej w Wieloleciu 1951–1998 (Changes in the Seasonal Distribution of Outflow in Central Poland during 1951–1998). Wiadomości IMGW 2001, 24, 3–17. [Google Scholar]
  59. Pukos, P. Dziadek Mróz. Odporność Roślin. Echa Leśne 2006, 12, 22–23. [Google Scholar]
  60. Kaznowska, E.; Wasilewicz, M. Historical streamflow droughts on the Vistula River in Warsaw in the context of the current ones. Acta Sci. Pol. Form. Circumiectus 2020, 19, 53–81. [Google Scholar]
  61. Piętka, I. Wieloletnia Zmienność Wiosennego Od- Pływu Rzek Polskich (Long-Term Variations of Spring Runoff of Polish Rivers). Pr. I Studia Geogr. 2009, 43, 81–95. [Google Scholar]
  62. Krajewski, A.; Sikorska-Senoner, A.E.; Hejduk, L.; Banasik, K. An Attempt to Decompose the Impact of Land Use and Climate Change on Annual Runoff in a Small Agricultural Catchment. Water Resour. Manag. 2021, 35, 881–896. [Google Scholar] [CrossRef]
  63. Byczkowski, A. Hydrologia; Wydanie Drugie; Wydawnictwo SGGW: Warszawa, Poland, 1999; Volume 2. [Google Scholar]
  64. Farat, R.; Kępińska-Kasprzak, M.; Kowalczyk, P.; Mager, P. Susze Na Obszarze Polski w Latach 1951–1990 [Droughts in Poland in the Years 1951–1990]; Materiały Badawcze IMGW. Gospodarka Wodna i Ochrona Wód; IMGW: Warszawa, Poland, 1995. [Google Scholar]
  65. Marsz, A.; Styszyńska, A. Skala i Przyczyny Zmian Temperatury Najcieplejszych Miesięcy Roku Nad Obszarem Polski Po Roku 1988 (The Scale and Causes of Changes in the Temperature of the Warmest Months of the Year over the Area of Poland after 1988). In Współczesne Problemy Klimatu Polski; Chojnacka-Ożga, L., Lorenc, H., Eds.; Seria Publikacji Naukowo-Badawczych IMGW-PIB; Instytut Meteorologii i Gospodarki Wodnej Państwowy Instytut Badawczy: Warszawa, Poland, 2019; pp. 9–26. ISBN 978-83-64979-33-0. [Google Scholar]
Figure 1. Locality map of the Narewka catchment and gauging station.
Forests 12 01744 g001
Figure 2. River network of Narewka River until the Narewka water gauge.
Forests 12 01744 g002
Figure 3. Parameters of streamflow drought.
Forests 12 01744 g003
Figure 4. Precipitation and mean air temperature in the Narewka catchment area in the period 1951–2020.
Forests 12 01744 g004
Figure 5. Annual precipitation at the Białowieża climatic station into summer and winter half-years (measured in hydrological years).
Forests 12 01744 g005
Figure 6. Annual precipitation at the Białowieża climatic station, with information on the precipitation classification of years according to the RPI criterion.
Forests 12 01744 g006
Figure 7. The average number of days with daily precipitation above 20 mm at the Białystok weather station, in 20-year periods.
Forests 12 01744 g007
Figure 8. Number of hot days (with temperatures above 30 degrees Celsius) at the Białystok weather station.
Forests 12 01744 g008
Figure 9. The minimum (NQ), maximum (WQ), and mean (SQ) annual flows (m3s−1) in the period of 1951–2020 at the Narewka gauging station.
Forests 12 01744 g009
Figure 10. The outflow (H) and value (P–H) (mm) in the period of 1951–2020 at the Narewka gauging station.
Forests 12 01744 g010
Figure 11. Runoff coefficient (c) in the period of 1951–2020 at the Narewka gauging station.
Forests 12 01744 g011
Figure 12. TPO changeability in the period of 1951–2020 at the Narewka gauging station.
Forests 12 01744 g012
Figure 13. Number of streamflow droughts in the hydrological years 1951–2020 in the Narewka River to Narewka gauging profile; Annotation: the streamflow drought of 1951 is considered to be a summer event.
Forests 12 01744 g013
Figure 14. Duration of streamflow droughts in the hydrological years 1951–2020 in the Narewka River to Narewka gauging profile; Annotation: the streamflow drought of 1951 is considered to be a summer event.
Forests 12 01744 g014
Figure 15. Deficit of streamflow droughts in the hydrological years 1951–2020 in the Narewka River to Narewka gauging profile; Annotation: the streamflow drought of 1951 is considered to be a summer event.
Forests 12 01744 g015
Figure 16. Maximum intensity of summer droughts and lowest discharge of summer droughts in the hydrological years 1951–2020 in the Narewka River to Narewka gauging profile.
Forests 12 01744 g016
Figure 17. Comparison of streamflow drought in 1951 to the summer streamflow droughts in the 1951*–2020 period at the Narewka gauging station; Annotation: the streamflow drought of 1951 is considered to be a summer event.
Forests 12 01744 g017
Figure 18. The number of days of low flows (Qn ≤ 0.79 m3s−1 for the 1951–2002 period) in the 1951–2020 period at the Narewka gauging station. The blue line marks the minimal number of days (10 days) when the streamflow droughts are defined. Annotation: The winter half-year of 1952 includes days (1 XI-23I) defined as being like the summer drought of 1951.
Forests 12 01744 g018
Figure 19. Hydrographs of 2020, 2019, 2015, and 1951 compared to daily flows over the periods of 1951–2002 and 1951–2020 in the Narewka at the Narewka gauging station.
Forests 12 01744 g019
Table 1. A summary of the Mann–Kendall test statistics for the selected climatic and hydrological factors at the 95% confidence level. S, Z = statistics of the Mann–Kendall test, p = significance level, h.y. = hydrological year. The number of annual values in the calculation is 70.
FactorRangeS-ValueZ-Valuep-ValueTrend
Total annual precipitation in Białystok365–935286.001.440.15No trend
Total annual precipitation in Białowieża426–933181.000.910.36No trend
Total annual precipitation in Białowieża (h.y.)435–898151.000.760.45No trend
Summer sum of precipitation in Białowieża (h.y.)240–722153.000.770.44No trend
Winter sum of precipitation in Białowieża (h.y.)160–380286.001.440.15No trend
Number of days with precipitation > 20 mm in Białowieża0–9−116.00−0.590.55No trend
Number of hot days in Białowieża0–17742.003.800.0001Increasing
Number of rainy days in Białowieża125–212250.001.260.21No trend
Average air temperature in Białowieża5.0–9.0920.004.660.000003Increasing
Average annual flow (h.y.)1.13–5.74−281.00−1.420.16No trend
Maximum annual flow (h.y.)3.0–50.7−414.00−2.090.04Decreasing
Minimum annual flow (h.y)0.23–1.13−200.00−1.010.31No trend
Outflow (h.y)56.2–285.0−281.00−1.420.16No trend
Runoff coefficient c9.49–38.48−425−2.150.03Decreasing
P–H330.57–717.333551.790.07No trend
TPO93–259572−2.900.0038Decreasing
Table 2. Characteristics of streamflow droughts in Narewka River in the period 1951–2020, and streamflow droughts in the years 1951, 2015, 2018, 2019, and 2020.
Characteristics of Droughts
Periods/
Year
Type of
Droughts
(-)(Days)(thous. m3)(m3·s−1)(%)
∑ niTav,nTmax,nVav,nVmax,nSQav,nNQmin,nIav,n
1951–2020S5152194907.795262.620.640.230.014
1951–2020W112773232.8775.010.700.390.09
∑ni Tn VnQav,nQmin,nIn
1951 *S1-194-5002.560.500.300.028
2015S1-133-3582.140.480.280.029
2018S1-148-326.460.530.390.024
2019S1-158-5262.620.400.230.036
2020S1-99-1876.970.570.330.020
* The streamflow drought of 1951 is considered to be a summer event, from 12 July 1951 to 23 January 1952; S: summer drought; W: winter drought; Σni: sum of events.
Table 3. A summary of the Mann–Kendall test statistics for the selected hydrological drought factors at 95% confidence level. S, Z = statistics of the Mann–Kendall test; p = significance level; h.y. = hydrological year. The number of annual values in the calculation is 70.
FactorRangeS-ValueZ-Valuep-ValueTrend
Sum of duration of summer droughts (days)0–194362.001.920.06No trend
Sum of deficits of summer droughts (th. m3)0–5262.62390.002.070.04Increasing
Intensity of summer droughts in percentage of average annual runoff0–0.04330.001.750.08No trend
Minimum discharge of summer droughts (m3s−1)0–0.76106.000.560.58No trend
Number of days with discharges ≤ Q90% in the summer half-year 0–148416.002.150.03Increasing
Sum of duration of winter droughts (days)0–73−149.00−1.290.20No trend
Sum of deficit of winter droughts (th.m3)0–775−161.00−1.400.16No trend
Number of days with discharges ≤ Q90% in the winter half-year 0–123−97.00−0.620.53No trend
Publisher’s Note: MDPI stays neutral with regard to jurisdictional claims in published maps and institutional affiliations.

