Article

Measuring the Damping Performance of Gradient-Structured Bamboo Using the Resonance Method

1
International Centre for Bamboo and Rattan, Beijing 100102, China
2
National Forestry and Grassland Administration/Beijing Co-Build Key Laboratory of Bamboo and Rattan Science Technology, Beijing 100102, China
*
Authors to whom correspondence should be addressed.
Forests 2021, 12(12), 1654; https://doi.org/10.3390/f12121654
Submission received: 28 October 2021 / Revised: 24 November 2021 / Accepted: 26 November 2021 / Published: 29 November 2021
(This article belongs to the Special Issue Protection and Modification of Wood and Bamboo Materials)

Abstract

:
Bamboo has natural damping properties, but, due to the obvious gradient differences in bamboo walls, the damping properties of different layers may vary. Using bamboo slivers as the research object, this study investigated the underlying mechanism of the effect of microstructural and chemical components on the damping properties (η, damping ratio) of bamboo using the resonance and nonresonance methods. The damping ratio decreased on L3 (inner layer), L2 (middle layer), and L1 (outer layer) due to lower microfibril angles, increased crystallinity of cellulose, and decreased hemicellulose content. All of these limited the motion of the bamboo’s molecular chains. The damping ratio successively increased in the oven-dried, air-dried, and water saturated states because water acted as a plasticizer. The damping ratio of L1, in the oven-dried state, was slightly higher than that of the air-dried state because L1 had the lowest water content. This allowed less water to escape during drying, which intensified the molecular distortion. The initial tan δ (tangent of the loss angle) decreased successively on the L3, L2, and L1 layers of the bamboo, and the tan δ of L3 was lower than that of L2 due to changes in the temperature sensitivity of hemicellulose.

1. Introduction

Bamboo is one of the fastest-growing plants and is widely distributed in subtropical areas globally [1]. Under normal circumstances, bamboo can become timber in 3–5 years, and its height can exceed 10 m [2,3]. Bamboo has a faster growth rate than most other woods, but its mechanical properties and chemical composition are similar and contains 40–48% cellulose, 22–27% hemicelluloses, and 25–30% lignin. Due to its rapid regeneration, low cost, high strength, and high rigidity, bamboo is an ideal material in the construction, textile, pulp and paper, and bioenergy fields [4,5,6].
To adapt to wind and rain during natural growth, bamboo forms a superior hollow multinodal structure and a gradient wall structure in the growth direction (Figure 1). Similarly to wood, bamboo also has natural excellent damping properties and can form high-performance and lightweight damping-functional materials by compounding with other materials [7]. Combined with bamboo wood veneer bonding, rubber spraying, and thermoplastic material-melt blending–molding, the excellent damping performance of bamboo can be fully utilized. Bamboo composite damping materials have several advantages, including a light weight, high strength, high-damping properties, and renewability. Consequently, bamboo can be widely used in the construction, transportation, and sports industries [8].
Bamboo is very sensitive to changes in ambient temperature and humidity when used as in outdoor materials (damper plates, springboard, skateboard etc.), and its damping characteristics are affected by its own characteristics and environmental factors [9,10]. Bamboo is a typical two-phase composite material that is mainly composed of vascular bundles and parenchyma cells. Habibi [11] found that the gradient distribution of parenchyma cells reduced bamboo’s viscoelasticity, which reduced its loss modulus and vibration-damping performance. Usually, the matrix parenchyma cells absorb energy via plastic deformation to improve the damping effect. The reinforcing fiber in the vascular bundle is the source of bamboo’s strength and stiffness. Different bamboo layers have different fiber and parenchyma cell ratios, which leads to different damping performances in different bamboo layers. Changes in the ambient temperature and humidity will aggravate changes in the damping performance of gradient-structured bamboo.
Vibrational damping occurs when an oscillation system or vibrating system converts mechanical vibration energy into consumable energy. The properties of vibration-damping materials are mainly investigated by the forced resonance, forced nonresonance, acoustic attenuation, and free vibration methods. The characterization parameters mainly include the damping ratio (η), tangent of loss angle (tan δ), and logarithmic decay rate (λ). The resonance method has been used for decades to evaluate the properties of wood and wood composites. Viens and Johnson [12] proved, in NASA 104629, that dynamic excitation can be used to characterize the elastic properties of composites without damaging their components. Dynamic mechanical analysis (DMA) can measure the mechanical response of materials under periodic stress and directly determine the storage modulus (E’), loss modulus (E’’), and tan δ of damping materials. DMA is sensitive to the molecular aggregation state and glass transition temperature of polymers; thus, it can be used to simultaneously investigate the effects of continuous temperature and frequency changes.
Among the viscoelastic properties of bamboo, the strength and modulus, which are related to the gradient distribution of bamboo’s vascular bundles, are the most widely studied; however, the internal mechanism of the bamboo gradient structure that affects the damping behavior has rarely been studied [13,14,15]. It is of great engineering significance to develop bamboo damping composite materials with a high specific strength and high specific modulus by utilizing the natural vibration damping properties of bamboo. According to the different damping properties of bamboo in the radial direction, bamboo damping materials have been compounded with different materials (e.g., rubbers or plastics) to meet different vibration resistance and noise-reduction requirements.
By analyzing the gradient structure changes of bamboo walls from the inside to the outside, this paper reveals the influencing mechanisms of bamboo’s microstructural and chemical components on its damping performance. This provides a theoretical basis for the preparation of high-performance and lightweight green, bamboo damping-functional materials in the future. The relationship between the different gradient microstructures of bamboo under different temperatures and humidity levels and its macro-damping behavior was determined. The different damping properties of bamboo in different layers were used to select the appropriate bamboo layer for damping composites in different use scenarios.

2. Materials and methods

2.1. Materials

Phyllostachys edulis was collected from Yibin City in Sichuan Province, and its age was determined to be 4 years. Bamboo samples were taken 2 m away from the root cut and from one bamboo culm section. Due to variations in the fiber volume fraction from the inside to the outside of the bamboo wall (Table 1), the bamboo stalk (H = 10 mm) was divided into three smooth layers of bamboo slivers close to the outer, middle, and inner layers (Figure 1). Three duplicate samples were taken from each layer and then designated as L1, L2, and L3. In accordance with ASTM E756-1993 and ASTM D7028-2007, the samples subjected to the cantilever resonance method and the DMA double-cantilever method, were cut into dimensions of 200 mm × 10 mm × 1 mm and 60 mm × 10 mm × 1 mm, respectively. Before the test was conducted, the samples were stored at 30 °C ± 2 °C and 65% relative humidity until a constant weight was reached. The samples were then pressed under an iron plate to prevent deformation.

2.2. Method

2.2.1. Determination of Fiber Volume Fraction

Under the assumption that the vascular bundles embedded in the parenchyma cells were straight and complete, a clear cross-sectional image of the sample was taken by optical microscopy (Infinity3–6URC), and the fiber area was calculated using the graphics processing software, Image-Pro Plus 6 (Media Cybernetics, Silver Spring, MD, USA). The total area and vascular bundle area were denoted as S and Sf, respectively. The fiber volume fraction (Vf) of each bamboo sliver was calculated using Equation (1) [14]:
V f = S f / S

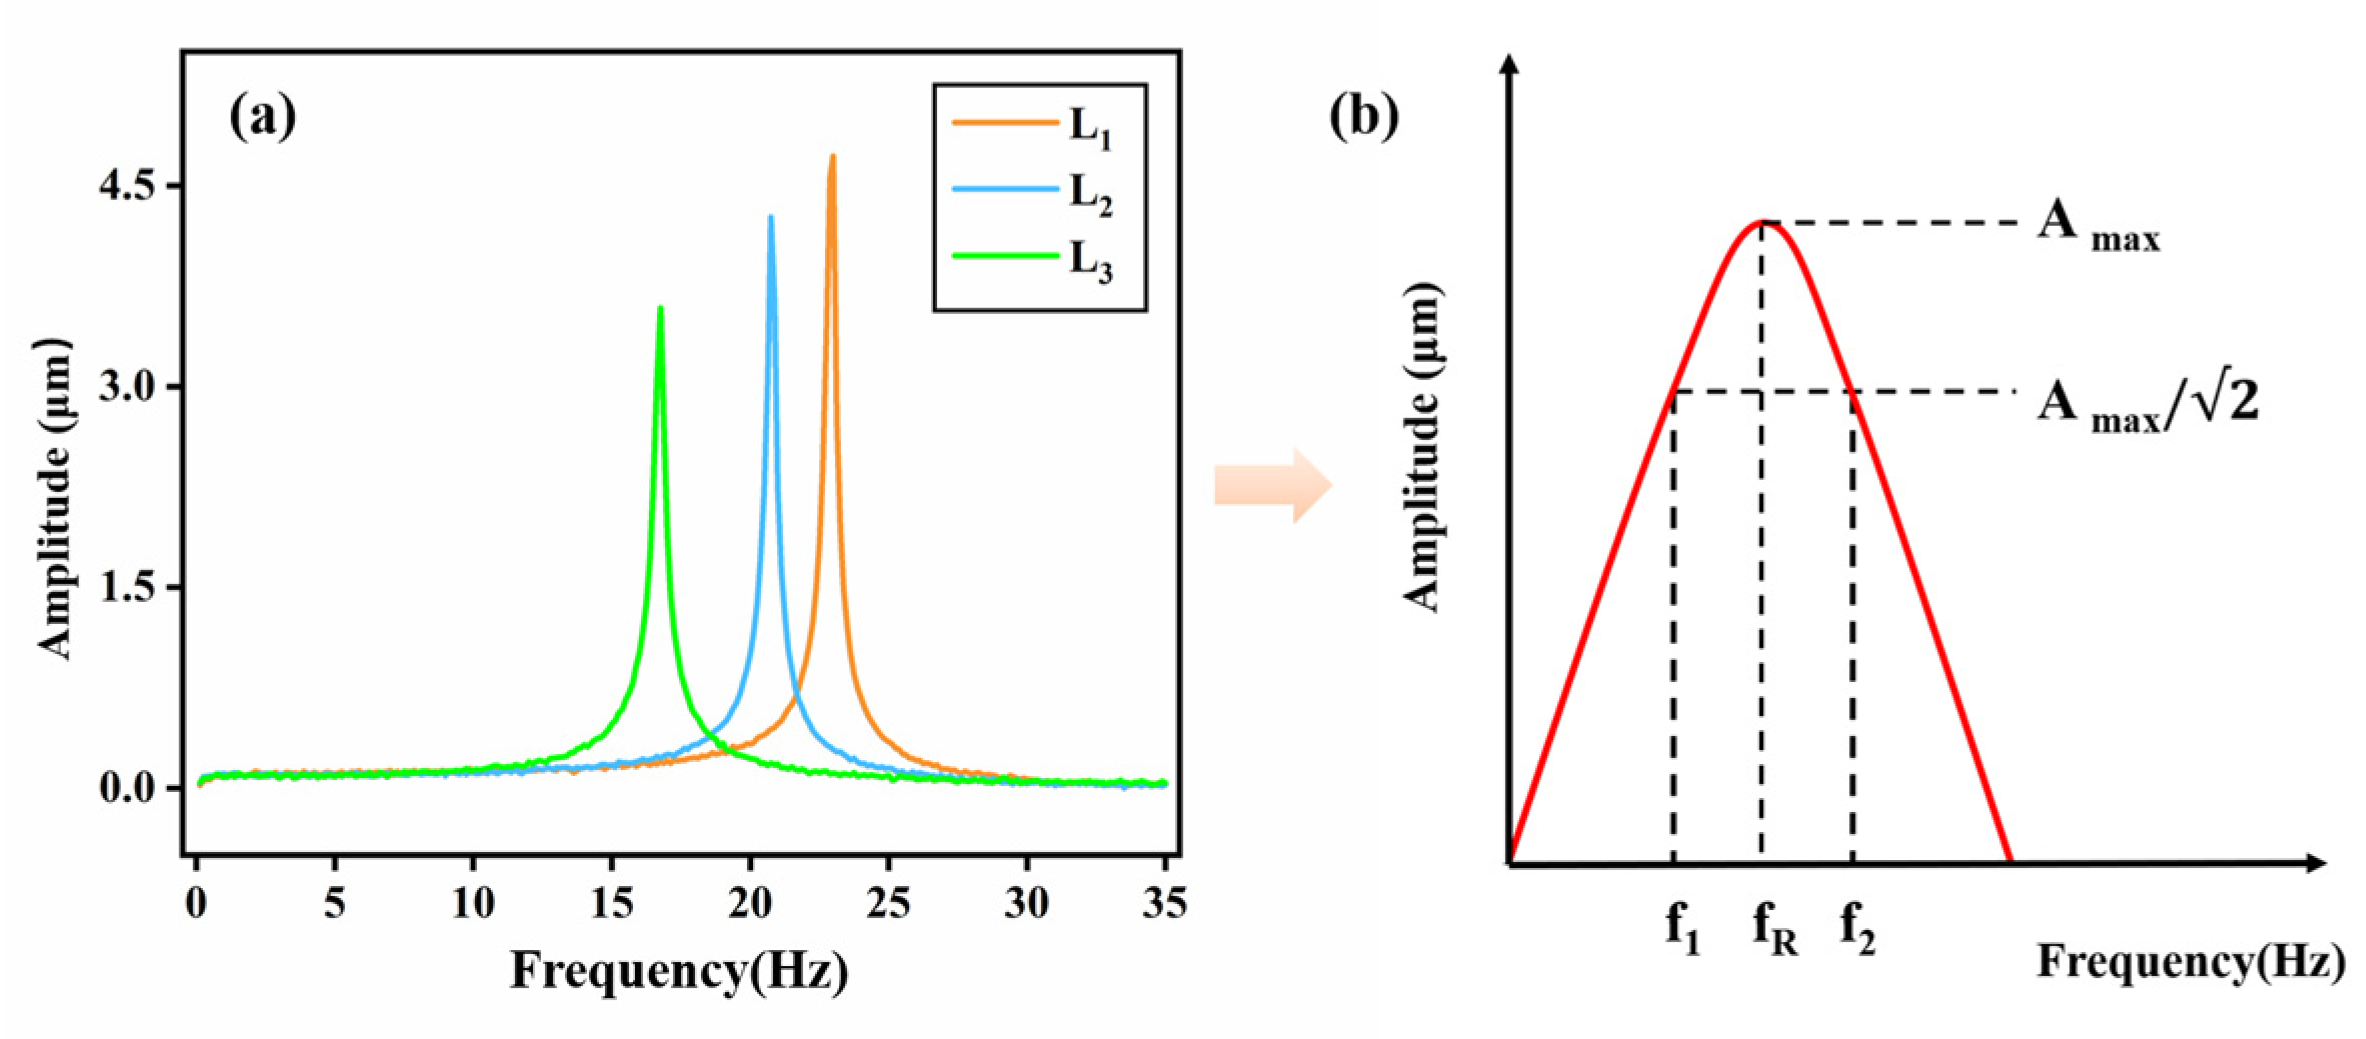
2.2.2. Damping Properties under the Resonance Method

The vibration characteristics of the bamboo slivers were evaluated using a DASP-V11 vibration analyzer (Dongfang Institute of Vibration and Noise, Beijing, China). The probe used a ZA-210500-30 eddy current displacement sensor with a sensitivity of 10 V/mm. An INV3062T dynamic acquisition system was used. The test device is presented in Figure 2 The bamboo sliver measuring 200 mm × 10 mm × 1 mm was first installed vertically. The upper end was then clamped, and the lower end was released. Then, the lower end of the bamboo sliver was knocked with an induction hammer. An instantaneous impact force was applied to the cantilever beam, and the pulse signal on the acquisition instrument was measured. Based on the measured resonant frequency and half-power bandwidth, the modulus and tan δ of the material were calculated. Tests were conducted at 30 °C ± 2 °C. The samples had three moisture content states: absolute dry, air dry (5.87–6.36%), and saturated (78.82–100.29%).

2.2.3. Damping Properties under the Nonresonance Method

The dynamic viscoelastic properties of the bamboo slivers were measured by dynamic mechanical analysis using a DMA Q800 instrument (TA Instruments, Milford, NJ, USA). The double-cantilever mode was adopted. Testing was performed under the following conditions: temperature: 32–250 °C; amplitude: 15 μm; heating rate: 2 °C/min; frequencies of 1, 2, 3, 5, and 10 Hz. The dimensions of the bamboo sliver were 60 mm × 10 mm × 1 mm. Before the tests, all test pieces were in the oven-dried state. They were then stored in a dryer with a silica gel desiccant. For each test, the length, width, and thickness of the bamboo slivers were measured at 30 °C ± 2 °C. The E’ (storage modulus), E’’ (loss modulus), and tan δ values of the bamboo slivers were recorded at different temperatures and operating frequencies.

2.2.4. Relative Crystallinity Test

The relative crystallinity of the bamboo slivers was measured by X-ray diffraction using an XRD-D8 Advance (Bruker, Karlsruhe, Germany) under the following conditions: X-ray tube, copper target; voltage: 40 kV; current: 40 mA; scanning speed: 0.300 s/step; step size: 0.1°. The bamboo powder (60 mesh) was pressed into thin slices at 30 °C ± 2 °C and then scanned from 5–50° in the reflection mode of the XRD. According to the peak intensities at 2θ = 22° and 18°, the relative crystallinity was calculated using Segal’s empirical method (Equation (2)) [16]:
C r I % = I 002 I a m I 002

2.2.5. Microfibril Angle Test

XRD patterns were obtained using an XRD-D8 Advance (Bruker, Karlsruhe, Germany). The microfibril angle of the bamboo sliver was evaluated. The conditions were as follows: voltage: 40 kV; current: 40 mA; scanning speed: 0.5 s/step; step size: 0.5°. The bamboo slivers were cut to dimensions of 50 mm × 10 mm × 1 mm, and the scanning angle range was 0–360° in the XRD transmission mode. Then, the obtained patterns were imported into Origin software, and the average microfibril angle of the bamboo was calculated by Gaussian function fitting (Equation (3)) [17]:
M F A ° = ( σ 1 + σ 2 ) 0.6
where σ1 and σ2 are the half-peak widths.

2.2.6. Pore Volume and Specific Surface-Area Tests

The mesopores of the cell wall in bamboo slivers were examined by automatic physicochemical gas adsorption analysis using an Auoysorb-1q2-c-tpx-vp device (Quantachrome, Boynton Beach, FL, USA). About 1 g of dried bamboo powder was dropped into a 6-mm ball tube and then dried at 90 °C.
Vacuum degassing was conducted at 90 °C for more than 8 h, and N2 with a purity > 99.999% was used as the adsorbent for the isothermal physical N2 adsorption-desorption tests at liquid-nitrogen temperature (77 K). The relative pressure of adsorption–desorption was P/P0 (where P is the adsorption pressure, and P0 is the saturated vapor pressure of nitrogen at 77 K). The adsorption isotherms were measured at 65 equidistant points between P/P0 10−7 and 0.998. The N2 adsorption isotherms were calculated using the quenched solid density functional theory equilibrium model to obtain the pore volume and specific surface area of the mesopores using the Barrett–Joyner–Halenda model [18].

2.2.7. Determination of Three Major Components

(1)
Holocellulose: About 2 g of the sample was weighed and dropped into a beaker. About 65 mL of deionized water was poured into the beaker and then thoroughly mixed with 0.6 g of sodium chlorite. The pH was adjusted to 4.0 using acetic acid, and the amount of acetic acid added was recorded. The beaker was heated in a water bath at 75 °C for 1 h, and 0.6 g of sodium chlorite was added to the reaction system, followed by acetic acid (the amount was one-half that of the previous amount of acetic acid) to adjust the pH. The system was allowed to react for 1 h, and the residue was filtered. The system was washed with a large amount of deionized water, placed in an oven at 60 °C for 24 h, and weighed [19].
(2)
Hemicellulose: 1 mL of the newly prepared aniline acetate solution was added to 100 mL of 12% HCI. The absence of a red pigment indicated that the distillation of furfural was complete. About 200 mL of the distillate was pipetted for determination [20].
(3)
Lignin: 1 g of the sample was weighed (accuracy: 0.0001 g) for benzene–alcohol extraction, hydrolyzed with sulfuric acid at the concentrations of 72% ± 0.1% and 33% successively, and allowed to stand until acid-insoluble lignin precipitated. The solution was filtered using a crude fiber tester, and the pH was measured with pH test strips until the solution was no longer acidic. The solution was then placed in an oven at 103 °C ± 2 °C to a constant weight for determination [21].

3. Results and Discussion

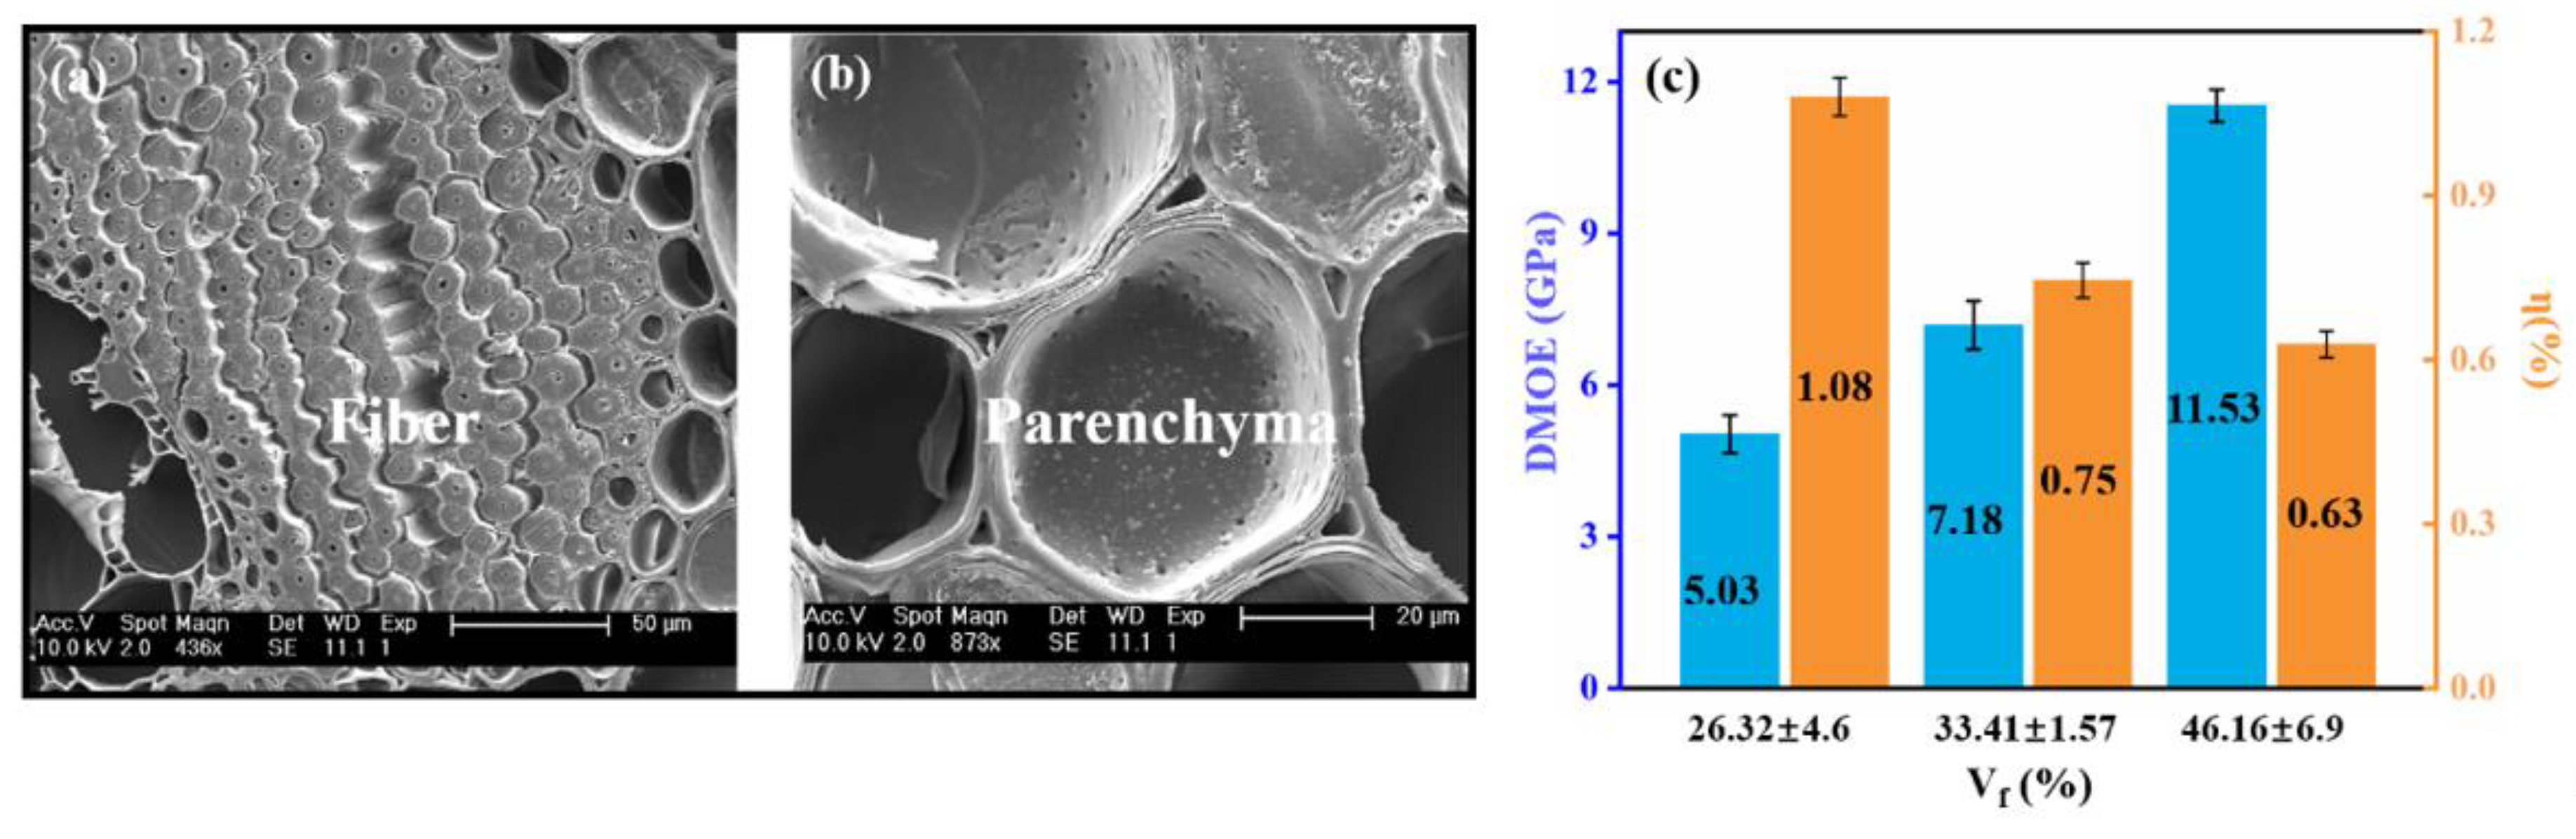
3.1. Effect of the Bamboo Structure on the Damping Ratio

The gradient distributions of the density and fiber volume of the bamboo in the radial direction are listed in Table 1. The volume fraction of bamboo fiber on L1 was 1.80 times higher than that on L3, and its density was 1.31 times that of L3. The lumens of the fiber cells were small, and the walls were thick, while the lumens of the parenchyma cells were large and the walls were thin (Figure 5a,b). Since the fibers were densely distributed on L1, i.e., the outer layer of the bamboo stalk, and were relatively loose on L3, i.e., the inner layer of the bamboo stalk (Figure 1), the higher fiber volume ratio increased the density on L1.
The structural acoustics of gradient bamboo can be divided into the time domain method and frequency domain method according to different analysis domains in resonance tests (Figure 3 and Figure 4) [22]. As shown in Figure 3, at the same vibration frequency, the attenuation rate of L1 was less than L3, and the degree of sound loss between adjacent wave peaks was low (Equations (4)–(6)) [22]. Due to the large amount of time domain method, the frequency domain method was mainly used in this experiment to analyze the different gradient bamboo damping ratios. Frequency domain analysis was used to change the signal into the frequency axis as the coordinate. The formulas for calculating the damping ratio are shown in Equations (7)–(9) [22]. The resonant frequency measured in the test was the natural frequency of the material, which was only affected by the stiffness and mass distribution (elastic properties) [23]; therefore, upon increasing the fiber volume ratio (Table 1), the resonant frequencies of L3, L2, and L1 increased (Figure 4).
λ = I n A 1 A 2 = I n A 2 A 3 = 1 n I n A 0 A n
t a n δ = λ / π
η = t a n δ / 2 = λ / 2 π = I n A 1 A 2 / 2 π = I n A 2 A 3 / 2 π = I n A 0 A n / 2 n π
where λ is the logarithmic decay rate; fr is the frequency corresponding to the formant; and f1 and f2 are the frequencies corresponding to the formant/√ 2 on the left and right sides, respectively.
t a n δ = f 2 f 1 f R = f f R
λ = π × t a n δ
η = t a n δ / 2   =   f 2 f 1 2 f R = f 2 f R
The damping ratio η and dynamic modulus of elasticity (DMOE, Equation (10)) of the bamboo slivers were calculated based on the frequency domain method [23]. They were both used as indicators to evaluate the vibration characteristics of the material and were often negatively correlated [24]. As shown in Figure 5c, upon increasing the fiber volume ratio, the DMOE of bamboo increased from 5.03 GPa to 11.53 GPa, while the damping ratio decreased from 1.08% to 0.63% [25].
E = 48 π 2 L 4 ρ f R 2 β 4 h 2
where l is the length of the resonance plate material (m), h is the thickness (m); ρ is the density (kg/m3); fR is the resonant frequency measured using the frequency domain method; β is the coefficient determined by the vibration order. The DMOE ignores shear forces and torque when the aspect ratio is sufficiently large [26].
The plant fiber η is affected by intercellular and intracellular wall friction, interchain and intrachain friction, and slips between fibers and matrices. Analysis of the cell structure indicated that the parenchyma cells and fibers were mainly composed of microfibrils, and their different orientations increased the damping ratio of the material by increasing the friction between fibrils [27]. The orientations of the microfibrils was affected by their components (amount of lignin and degree of lignification), and the pore distribution on the cell surface (such as pits) also affected the damping ratio by reducing microfibril arrangement homogeneity [28,29]. The microfibril angles of L3, L2, and L1, were 15.75°, 11.17°, and 10.51°, respectively. The fiber angle of L3 was the largest; thus, the vascular bundles were arranged irregularly. The greater the internal friction with other substances, the larger the internal friction modulus [29]. Crystallinity is another main reason for the different internal loss of gradient bamboo [30]. The crystallinity indices of L3, L2, and L1 cellulose were 44.46%, 48.21%, and 54.10% respectively. The crystallinity of L1 was the highest; thus, the cellulose molecular chains were arranged neatly and densely in the crystallization area, and many hydrogen bond grids formed inside. Consequently, molecular chain movement and contact with other substances were impeded, internal friction decreased, and the vibration damping performance of the material decreased [9,31].

3.2. Effect of Bamboo Chemical Composition on the Damping Performance

With respect to the chemical composition, the vibration-damping performance of bamboo is mainly derived from the cellulose crystallization zone, the amorphous components (lignin, hemicellulose, and extracts), and internal friction caused by the mutual friction of molecular chains within and between components. As shown in Figure 6, the hemicellulose content decreased on L3, L2, and L1, and the lignin remained unchanged. Hemicellulose and lignin are amorphous polymers that form a matrix that determines the viscous behavior of bamboo [32,33]. Thus, L3 had the largest damping. Akerholm et al. [34] showed the same result, in which the gradient distribution of bamboo’s chemical components significantly impacted its vibration-damping performance. The vibration-damping performance of the green side was better than that of the yellow side. Several extracted compounds can also change the damping performance, but the pectin and ash contents in bamboo are low, and different gradient layers are only slightly different, the further characterization of which is not within the scope of this study [35,36].

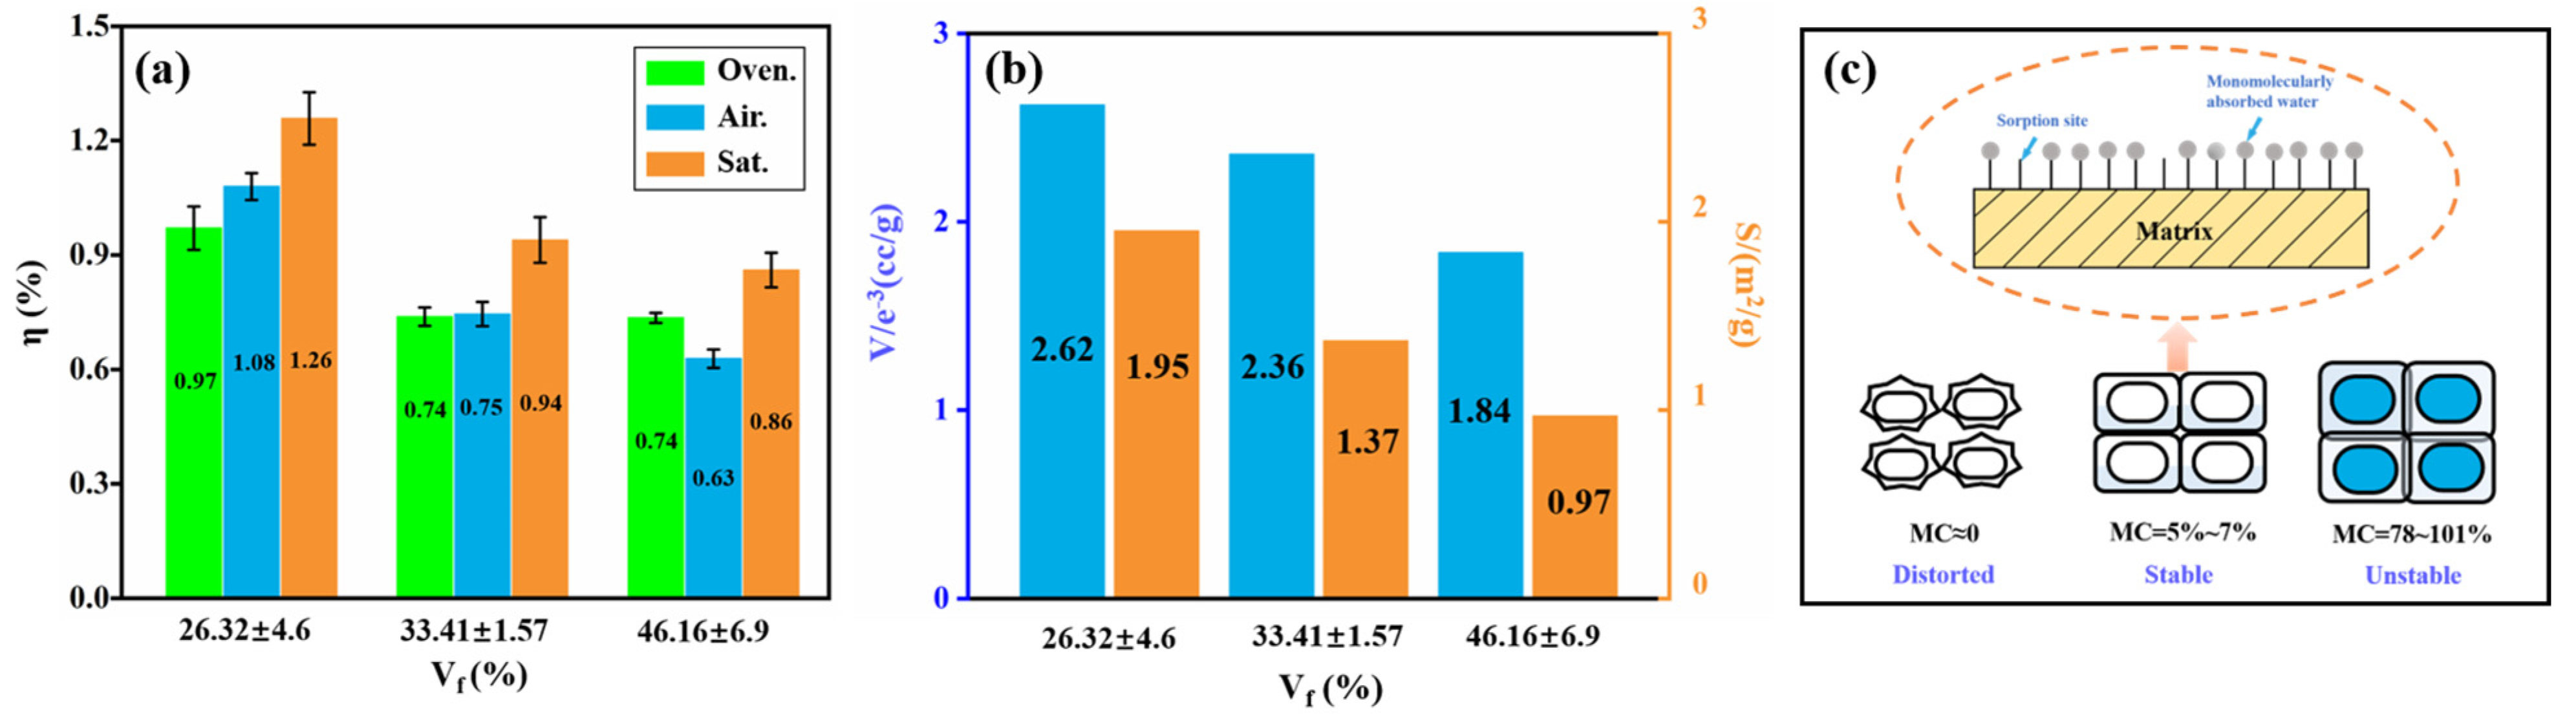
3.3. Effect of the Water Content on Damping Ratio

In this experiment, bamboo slivers were oven-dried, air-dried, and water-saturated, representing three typical water conditions in bamboo wood, i.e., chemically bonded water, adsorbed water, and free water. Figure 7a shows the damping of L3, L2, and L1 under different water content states. As shown in Figure 7a, the η of the bamboo slivers increased from the air-dried condition to the water-saturated condition. The reason for this is that, upon increasing the water content, water behaved as a plasticizer that permitted the motion of more molecular chains. Cohesion between molecules decreased, and the matrix expanded, which increased η [37]. Z. Liu [38] showed that, within the same temperature range, the loss factor of high-moisture-content bamboo is often higher than its low-moisture counterpart.
The moisture content of L3 was the highest in both the air-dried and water-saturated states [39]. This was related to the larger inner surface area and pore volume of L3. The pore volume of the cell wall was 2.62 × 10⁻³ μm3. The specific surface area was the largest, 1.95 m2/g (Figure 7b), so the cells on L3 exhibited the greatest water absorption. As can be seen from Table 2, from the air-dried to water-saturated state, the moisture of L1, L2, and L3 increased by 72.95%, 80.75%, and 93.93%, respectively. L3 had the highest moisture content, but the increase in the damping ratio was 0.232, 0.194, and 0.178, respectively. L3 had the lowest moisture content, which was mainly related to the form of the absorbed water.
The moisture content of the bamboo slivers used in the experiment ranged from 5.87 to 6.36% in the air-dried state. Due to the –OH, –O, and –COOH groups (especially the large number of –OH groups) of non-crystalline cellulose, hemicellulose, and lignin, the crystalline surface could form hydrogen bonds with water molecules. Thus, a monomolecular layer of water formed on the inner surface [40]. The η of the bamboo slivers was affected by the cell-wall level and was closely related to variations in the water content in the cell wall, especially the monolayer of adsorbed water. Changes in free water had little effect on the damping properties of bamboo slivers [41]. Therefore, although the overall water content of L3 increased the most, the water content of the cell wall increased the least; thus, the increase in the overall damping ratio was the lowest.
From the oven-dried to the air-dried conditions, the η of L3 increased by 11.3% upon increasing the moisture content of the cell wall; however, the damping ratio of L2 almost remained at the same η, and L1 decreased, which was caused by the deformation of the cell wall during drying. When monolayer water in the cell precipitated, the molecular chains in the amorphous region of the cell walls became prone to unnatural distortion, resulting in the formation of micropores, which increased the damping ratio (Figure 7c) [40,42]. The damping ratio increased slightly because the cell wall of L3 lost the least amount of water from the air-dried to the oven-dried states.

3.4. Effects of Temperature and Action on Damping Ratio

The modulus of a sample changed with temperature, and the resonant frequency changed with temperature during the cantilever resonance method; thus, the temperature spectrum at a fixed frequency could not be measured. DMA can more efficiently determine changes in the damping ratio of the bamboo slivers at continuous temperatures and under low-frequency conditions. The calculation principle is as follows:
t a n δ = E / E
where tan δ is the ratio of elasticity (E′) to viscosity (E″), which indicates the hysteresis of material strain to stress. As shown in Figure 8, under a frequency of 0.5 Hz, the initial storage modulus reached 56,859 MPa, the loss modulus was 473 MPa, and tan δ was 0.00832. Generally, in the range of 32–120 °C, the components are frozen, with low fluidity and low energy dissipation and, thus, a high storage modulus. When water dissipation was complete, the molecular chain movement intensified, and the structure of lignin constantly transformed. Hemicellulose softened, and the storage modulus decreased. Lignin, which mainly determines the glass transition temperature, began to slowly lose weight at this temperature [43,44]. During the activation of the molecular segment motion, when the molecular motion of the bamboo slivers coincided with mechanical deformation, maximum internal friction and inelastic deformation were achieved, causing the loss modulus to reach the maximum value [44], i.e., a glass transition temperature of 214.17 °C; therefore, tan δ reached the maximum at 220 °C and then entered the gradual growth stage.
The test results revealed that the tan δ of L3, L2, and L1 at 32 °C was 0.00786, 0.0101, and 0.01323, respectively (Figure 9a). The tan δ of the bamboo slivers increased slowly, from 32–130 °C. This was attributed to the low temperature and narrow movement range of the whole molecule. When the temperature exceeded 130 °C, tan δ increased rapidly, and movement of the molecular segments was significantly activated; however, the increase rate of tan δ on L3 was lower than that on L2. Experiments by Li Yanjun and others have shown that when the temperature of bamboo is lower than 160 °C, the branched chains and side groups move first. Hemicellulose, as a polymer with side chains composed of two or more sugar groups, first undergoes a depolymerization reaction. The hemicellulose contents in L3 and L2 were 23% and 21.46%, respectively (Figure 6); therefore, the growth rate of tan δ on L3 slowly decreased from 120 °C to 180 °C. This occurrence was potentially caused by the higher depolymerization degree of hemicellulose, which determined wood’s viscosity. When it coincided with mechanical deformation, the molecular motion of the bamboo slivers was transformed into maximum internal friction and inelastic deformation. Consequently, the loss modulus reached the maximum [45], i.e., the glass transition temperature.
As shown in Figure 9b, upon increasing the action frequency, tan δ gradually decreased [45], and the growth trend was similar. Upon increasing the frequency difference, the sensitivity of tan δ to frequency decreased, and the difference decreased.

4. Conclusions

Bamboo has a naturally porous and multi-scale cascade structure that shows good damping performance, strength, and toughness. It is an ideal natural raw material for high-performance biological damping materials. Significant damping in gradient bamboo was attributed to changes in the gradient structure of tissues and chemical components in the thickness direction of bamboo. This change led to changes in the sensitivity of L3, L2, and L1 to water and temperature, which intensified the difference in damping performance.
As the fiber volume fraction increased from the inside to the outside, the damping ratio of the bamboo slivers gradually decreased because the lower hemicellulose content and microfibril angle and higher crystallinity made molecular chain motion difficult, and the internal friction decreased.
The water content and shape of the cell walls had significant effects on the damping ratio. Water acted as a plasticizer and decreased the cohesion between molecules, so the damping ratio increased; however, the damping ratio of L1 in the oven-dried state was slightly higher than that in the air-dried state. The reason for this was that L1 exhibited poor moisture absorption, allowing less water to escape during drying and increasing the number of micropores produced by molecular distortion.
At first, the tan δ of L3, L2, and L1 successively decreased, and this trend was the same as that under the resonance method; however, due to the discrepancy in the sensitivity of the hemicellulose content to temperature, L3 exhibited a lower velocity than L2, especially from 110 °C to 180 °C.

Author Contributions

Materials, X.W.; sampling/trial/data analysis/Writing, X.C., L.D. and M.L.; writing/review/editing, G.W. and F.C.; design/funding support/project administration, G.W. All authors have read and agreed to the published version of the manuscript.

Funding

This research was funded by the National Natural Science Foundation of China (31770598).

Data Availability Statement

All results from the data analysis needed to evaluate this report are available in the main text or in the tables and figures.

Acknowledgments

Thanks to S. H. Gu for guiding some experiments. The authors are also thankful for H. Jiang’s help.

Conflicts of Interest

The authors declare no conflict of interest.

References

  1. Brito, B.; Pereira, F.V.; Putaux, J.L. Preparation, morphology and structure of cellulose nanocrystals from bamboo fibers. Cellulose 2012, 19, 1527–1536. [Google Scholar] [CrossRef]
  2. Hong, P.; Na, W.; Hu, Z.; Yu, Z.; Liu, Y.; Zhang, J. Physicochemical characterization of hemicelluloses from bamboo (Phyllostachys pubescens Mazel) stem. Ind. Crop. Prod. 2012, 37, 41–50. [Google Scholar] [CrossRef]
  3. Singh, L.; Sridharan, S.; Thul, S.T.; Kokate, P. Eco-rejuvenation of degraded land by microbe assisted bamboo plantation. Ind. Crop. Prod. 2020, 155, 112795. [Google Scholar] [CrossRef]
  4. Scurlock, J.M.; Dayton, D.C.; Hames, B. Bamboo: An overlooked biomass resource? Biomass Bioenergy 2000, 19, 229–244. [Google Scholar] [CrossRef] [Green Version]
  5. Rocky, B.P.; Thompson, A.J. Production of natural bamboo fibers-1: Experimental approaches to different processes and analyses. J. Text. Inititute 2018, 109, 1381–1391. [Google Scholar] [CrossRef]
  6. Rocky, B.P.; Thompson, A.J. Production and Modification of Natural Bamboo Fibers from Four Bamboo Species, and Their Prospects in Textile Manufacturing. Polymers 2020, 21, 2740–2752. [Google Scholar] [CrossRef]
  7. Ufodike, C.O.; Eze, V.O.; Ahmed, M.F.; Oluwalowo, A.; Park, J.G.; Liang, Z.; Wang, H. Investigation of molecular and supramolecular assemblies of cellulose and lignin of lignocellulosic materials by spectroscopy and thermal analysis. Int. J. Biol. Macromol. 2020, 146, 916–921. [Google Scholar] [CrossRef] [PubMed]
  8. Kumar, N.; Mireja, S.; Khandelwal, V.; Arun, B. Light-weight high-strength hollow glass microspheres and bamboo fiber based hybrid polypropylene composite A strength analysis and morphological study. Compos. Part B-Eng. 2017, 109, 277–285. [Google Scholar] [CrossRef]
  9. Wegst, U.G.K. Bamboo and Wood in Musical Instruments. Annu. Rev. Mater. Res. 2008, 38, 323–349. [Google Scholar] [CrossRef]
  10. Yu, H.; Liu, Y.; Liu, J. Overview of wood environmental studies at home and abroad. World For. Res. 2003, 6, 21–26. Available online: http://www.doc88.com/p-996353339669.html (accessed on 24 November 2021).
  11. Habibi, M.K.; Tam, L.H.; Lau, D.; Lu, Y. Viscoelastic damping behavior of structural bamboo material and its microstructural origins. Mech. Mater. 2016, 97, 184–198. [Google Scholar] [CrossRef]
  12. Viens, M.J.; Johnson, J.J. Determination of Elastic Moduli of Fiber-Resin Composites Using an Impulse Excitation Technique. 1996. Available online: https://www.grindosonic.com/pdf/GS0078.pdf (accessed on 24 November 2021).
  13. Dixon, P.G.; Gibson, L.J. The structure and mechanics of Moso bamboo material. J. R. Soc. Interface 2014, 11, 99. [Google Scholar] [CrossRef]
  14. Wei, X.; Zhou, H.; Chen, F.; Wang, G.J.M. Bending Flexibility of Moso Bamboo (Phyllostachys Edulis) with Functionally Graded Structure. Materials 2019, 12, 2007. [Google Scholar] [CrossRef] [PubMed] [Green Version]
  15. Chen, M.; Ye, L.; Wang, G.; Fang, C. Fracture modes of bamboo fiber bundles in three-point bending. Cellulose 2019, 26, 8101–8108. [Google Scholar] [CrossRef]
  16. Li, X.; Zhang, M. Study on the relationship between wood moisture content and crystallinity by X-ray diffraction. J. Northeast. For. Univ. 2014, 42, 97–99. [Google Scholar] [CrossRef]
  17. Yu, Y.; Wang, G.; Qian, D. Study on variation of microfibril angle of Moso Bamboo by X-ray diffraction. J. Northeast. For. Univ. 2007, 35, 28–29. [Google Scholar] [CrossRef]
  18. National Standards of UK, Determination of the Specific Surface Area of Solids by Gas Adsorption-BET Method. ISO 9277-2010. Available online: http://www.chinaios.com/BZ-shuju/standshow-isotwo-46936.html (accessed on 24 November 2021).
  19. National Standards of P. R. China, Fibrous Raw Material-Determination of Holocellulose. GB/T 2677.10-1995. Available online: https://max.book118.com/html/2019/0617/8117052124002030.shtm (accessed on 24 November 2021).
  20. National Standards of P. R. China, Pulps-Determination of Pentose. GB/T 745-2003. Available online: https://max.book118.com/html/2017/0404/98631167.shtm (accessed on 24 November 2021).
  21. National Standards of P. R. China, Fibrous Raw Material-Determination of Acid-Insoluble Lignin. GB/T2677.8-81. Available online: http://www.infoeach.com/goods-68084.html (accessed on 24 November 2021).
  22. Liu, Z.; Huang, Y. Vibration Characteristics of Wood for Resonance Plate and Acoustic Quality of National Musical Instruments. 2016. Available online: https://mtoou.info/5yuan/433964.html (accessed on 24 November 2021).
  23. Santoni, A.; Bonfiglio, P.; Mollica, F.; Fausti, P.; Pompoli, F.; Mazzanti, V. Vibro-acoustic optimisation of Wood Plastic Composite systems. Constr. Build. Mater. 2018, 174, 730–740. [Google Scholar] [CrossRef]
  24. Shen, J.; Tian, J. Study on the relationship between wood density and acoustic characteristic parameters of Picea. J. Huazhong Agric. Univ. 2001, 20, 181–184. [Google Scholar]
  25. Liu, T.; Butaud, P.; Placet, V. Damping behavior of plant fiber composites: A review. Compos. Struct. 2021, 275, 114392. [Google Scholar] [CrossRef]
  26. Gilani, M.S.; Pflaum, J.; Hartmann, S.; Kaufmann, R.; Baumgartner, M.; Schwarze, F.W.M.R. Relationship of vibro-mechanical properties and microstructure of wood and varnish interface in string instruments. Appl. Phys. A 2016, 122, 1–11. [Google Scholar] [CrossRef]
  27. Medeiros, E.; Agnelli, J.; Joseph, K.; Carvalho, L. Mechanical properties of phenolic composites reinforced with jute/cotton hybrid fabrics. Polym. Compos. 2005, 26, 1–11. [Google Scholar] [CrossRef]
  28. Thite, A.N.; Gerguri, S.; Coleman, F.; Doody, M.; Fisher, N. Development of an experimental methodology to evaluate the influence of a bamboo frame on the bicycle ride comfort %J Vehicle System Dynamics. Veh. Syst. Dyn. 2013, 51, 1287–1304. [Google Scholar] [CrossRef]
  29. Zhang, A.; Yu, G.; Ruan, J. Analysis of influencing factors of dynamic Young’s modulus of bamboo. J. Nanjing For. Univ. 2003, 27, 43–46. [Google Scholar]
  30. Kemp, C.; Scavone, G. Microstructure Contributions to Vibrational Damping and Identification of Damage Mechanisms in Arundo Donax L: Reed Cane for Woodwind Instruments. MRS Adv. 2017, 2, 1–20. [Google Scholar] [CrossRef]
  31. Muhammad, A.; Rahman, M.R.; Hamdan, S. Recent developments in bamboo fiber-based composites: A review. Polym. Bull. 2019, 76, 2655–2682. [Google Scholar] [CrossRef]
  32. Obataya, E.; Ono, T.; Norimoto, M. Vibrational properties of wood along the grain. J. Mater. Sci. 2000, 35, 2993–3001. [Google Scholar] [CrossRef]
  33. Olsson, A.M.; Salmén, L. Viscoelasticity of in situ lignin as affected by structure: Softwood vs. hardwood. Carbohyd. Polym. 1992, 489, 133–143. [Google Scholar] [CrossRef]
  34. Akerholm, M.; Salmen, L. The oriented structure of lignin and its viscoelastic properties studied by static and dynamic FTIR spectroscopy. Holzforschung 2003, 57, 459–465. [Google Scholar] [CrossRef]
  35. Bremaud, N.; Amusant, K.; Minato, J. Effect of extractives on vibrational properties of African Padauk (Pterocarpus soyauxii Taub.). Wood Sci. Technol. 2011, 45, 461–472. [Google Scholar] [CrossRef] [Green Version]
  36. Minato, K.; Konaka, Y.; Bremaud, I.; Suzuki, S.; Obataya, E. Extractives of muirapiranga (Brosimun sp.) and its effects on the vibrational properties of wood. J. Wood Sci. 2010, 56, 41–46. [Google Scholar] [CrossRef]
  37. Obataya, E.; Minato, K.; Tomita, B. Influence of moisture content on the vibrational properties of hematoxylin-impregnated wood. J. Wood Sci. 2001, 47, 317–321. [Google Scholar] [CrossRef]
  38. Liu, Z.; Jiang, Z.; Chen, Z. Dynamic mechanical thermal analysis of moso bamboo (Phyllostachys heterocycla) at different moisture content. Bioresources 2012, 7, 1548–1557. [Google Scholar] [CrossRef] [Green Version]
  39. Wei, X.; Wang, G.; Smith, L.M.; Jiang, H. The hygroscopicity of moso bamboo (Phyllostachys edulis) with a gradient fiber structure. J M R & T 2021, 15, 4309–4316. [Google Scholar] [CrossRef]
  40. Lu, J.; Jiang, J.; Wu, Y.; Li, X.; Cai, Z. Effect of Moisture Sorption State on Vibrational Properties of Wood. For. Prod. J. 2012, 62, 171–176. [Google Scholar] [CrossRef]
  41. Brémaud, I.; El Kaïm, Y.; Guibal, D.; Minato, K.; Thibaut, B.; Gril, J. Characterisation and categorisation of the diversity in viscoelastic vibrational properties between 98 wood types. Ann. For. Sci. 2012, 69, 373–386. [Google Scholar] [CrossRef]
  42. Obataya, E. Effects of natural and artificial ageing on the physical and acoustic properties of wood in musical instruments. Heritage 2016, 27, S63–S69. [Google Scholar] [CrossRef] [Green Version]
  43. Wegst, U.G.; Oberhoff, S.; Weller, M.; Ashby, M.F. Materials for violin bows. Int. J. Mater. Res. 2007, 98, 1230–1237. [Google Scholar] [CrossRef]
  44. Gken, J. Temperature-dependent damping of the tonewood spruce. J. Alloys. Compd. 2020, 856, 158182. [Google Scholar] [CrossRef]
  45. Chee, S.S.; Jawaid, M.; Sultan MT, H.; Alothman, O.Y.; Abdullah, L.C. Thermomechanical and dynamic mechanical properties of bamboo/woven kenaf mat reinforced epoxy hybrid composites. Compos. Part B-Eng. 2019, 163, 165–174. [Google Scholar] [CrossRef]
Figure 1. Preparation of samples.
Forests 12 01654 g001
Figure 2. Test method under cantilever resonance.
Forests 12 01654 g002
Figure 3. Time domain spectrum. (a) Comparison of the acoustic attenuation rates of L1 and L3. (b) Principle of calculating damping under the time domain method.
Forests 12 01654 g003
Figure 4. Frequency domain spectrum. (a) Resonant frequencies of L1, L2, and L3 using the frequency domain method. (b) Principle of calculating damping using the frequency domain method.
Forests 12 01654 g004
Figure 5. (a) Microstructures of fiber cells; (b) Microstructures of parenchyma cells; (c) η and DMOE of L3, L2, and L1.
Forests 12 01654 g005
Figure 6. Cellulose, hemicellulose, and lignin contents in L3, L2, and L1.
Forests 12 01654 g006
Figure 7. (a) η of L3, L2, and L1 with different moisture contents. (b) Pore volume and specific surface area of L3, L2, and L1. (c) Cellular morphology under different moisture contents.
Forests 12 01654 g007
Figure 8. DMA curves of tan δ, E′, and E″.
Forests 12 01654 g008
Figure 9. (a) tan δ of L1 and L3 of bamboo. (b) tan δ under different frequencies.
Forests 12 01654 g009
Table 1. Statical analysis of L1, L2, and L3.
LayerLength (mm)Width
(mm)
Thickness
(mm)
Weight
(g)
ρ
(kg/m3)
Vf
(%)
L1198.20 ± 0.11 b9.89 ± 0.30 a1.47 ± 0.03 b1.92 ± 0.07 a783.17 ± 39.14 a46.16 ± 6.90 a
L2200.38 ± 0.38 a9.66 ± 0.57 a1.55 ± 0.03 a1.92 ± 0.19 a698.00 ± 33.68 a33.41 ± 1.57 b
L3200.17 ± 0.06 a9.17 ± 0.53 a1.35 ± 0.05 c1.35 ± 0.05 b596.11 ± 40.71 b26.32 ± 4.60 c
Values are means ± SD (n = 5) Different letters within a column indicate significant difference at p < 0.05.
Table 2. η of L3, L2, and L1 at different moisture contents.
Layer Oven-DriedAir-DriedSaturated
L3η (%)0.971 ± 0.057 a1.080 ± 0.04 a1.258 ± 0.069 a
MC (%) 6.36 ± 0.42 a100.29 ± 1.16 a
L2η (%)0.738 ± 0.024 b0.745 ± 0.03 b0.939 ± 0.03 b
MC (%) 6.20 ± 0.18 a86.95 ± 0.10 b
L1η (%)0.735 ± 0.013 b0.628 ± 0.024 c0.860 ± 0.045 b
MC (%) 5.87 ± 0.08 a78.82 ± 0.37 c
Values are means ± SD (n = 5). Different letters within a column indicate a significant difference at p < 0.05.
Publisher’s Note: MDPI stays neutral with regard to jurisdictional claims in published maps and institutional affiliations.

