Article

The Relationship between Landscape Metrics and Facial Expressions in 18 Urban Forest Parks of Northern China

1
College of Forestry, Shenyang Agricultural University, Shenyang 110866, China
2
Environment and Resources College, Dalian Nationalities University, Dalian 116600, China
*
Authors to whom correspondence should be addressed.
These authors contributed equally to this work.
Forests 2021, 12(12), 1619; https://doi.org/10.3390/f12121619
Submission received: 8 November 2021 / Revised: 21 November 2021 / Accepted: 22 November 2021 / Published: 24 November 2021

Abstract

:
Urban forests are an important green infrastructure that positively impacts human well-being by improving emotions and reducing psychological stress. Questionnaires have been used frequently to study the influence of forest experiences on mental health; however, they have poor controllability and low accuracy for detecting immediate emotions. This study used the alternative approach of facial reading, detecting the facial expressions of urban forest visitors and their relationships with the landscape metrics. Using the microblogging site, Sina Weibo, we collected facial photos of 2031 people visiting 18 different forest parks across Northern China in 2020. We used satellite imagery analysis to assess the elevation and pattern sizes of green space and blue space areas. Age and location were taken as independent variables affecting facial expressions, which were categorized as happy or sad. With increases in green space and intact park areas, people showed a higher frequency of expressing happy scores. The results showed that the forest experience frequently elicited positive emotions, suggesting that creating and maintaining urban green spaces enhance people’s quality of life.

1. Introduction

More than half the world’s population lives in urban areas, which studies have shown can negatively affect mental health [1]. Studies have also shown that contact with beauty and nature has physical and mental health benefits, including stress reduction [2,3,4]. Forest Park sustainability and visitors’ park experiences and well-being depend on park managers’ correlative decisions and the parks’ locations [5]. People living in forest-rich areas have increased opportunities for stress-reducing experiences in natural settings [6]. Research has also shown that while age can affect park visitors’ emotions and forest experiencers [7], comfortable forest environments induce positive emotions and reduce anxiety in young adults [8], middle-aged and elderly visitors, and visitors with dementia [9]. Furthermore, short-term exposure to an urban forest environment has been shown to significantly lower the heart rates of middle-aged men with hypertension and older adults [10,11]. Most previous research has used quantitative physiological measures or qualitative descriptions (e.g., questionnaires, interviews) to analyse urban parks’ effects on mental health. This study tested the objectivity of previous studies’ results by using an alternative measure, facial expressions, detecting the emotional responses of different types of visitors to different urban forest environments.
Optimal combinations of natural landscape elements (e.g., water, plants, topography), characteristics (e.g., location, appearance, art, and cultural elements), and park dimensions provide restorative effects that induce resilience [12] and benefit physical and mental health [13,14,15]. Studies have found that urban residents with ready access to higher densities of green space and vegetation were less likely to suffer from heart disease [16] and mental illness [17]. The number, size, accessibility, vegetation, and features of public green spaces can dramatically affect residents’ mental health [18]. Especially conducive to relaxation are blue spaces—surface waterbodies (e.g., lakes, ponds, wetlands), surface watercourses (e.g., rivers, streams, estuaries), and other aquatic landscapes (e.g., beaches, coasts) [19]. A Finnish study found that people’s favourite restorative experiences involved exercise and activity in outdoor areas, waterside environments, and extensively managed natural settings [20]. Experiencing blue spaces can improve mental health and promote physical activity [21]. Natural environments with aquatic elements evoke more positive emotions than those without blue spaces [22]. To figure the mechanism for impacts of green space and blue space on public mental health is a requisite to compare their positive effects on mental well-being and are beneficial for better choices, such as the experience to touch the nature.
This study focused on urban parks, which provide opportunities for urban residents and visitors to engage in physical activity in managed natural settings in cities and enjoy the restorative effects of nature [23]. Parks located close to residences generally have more visitors [24]. Urban parks’ accessibility, area, size, and landscape style can influence visitors’ impressions, activities, and mental well-being [25,26]. Brown et al. [27] found that more frequent park use was associated with park size and suitability for physical activity. Even small parks and pocket parks can positively impact visitors’ mental health [28]. Parks’ terrain and altitude can affect visitors’ experiences. Shukitt and Bandaret reported that people’s behaviours and moods differ at different altitudes; they can become more argumentative and irritable or more euphoric at high altitudes [29]. Dudek found that the terrain’s slope was closely related to the aesthetics of forest landscapes; for example, tree species with high aesthetic landscape values mainly grow on high, concentrated slopes of 8–12° [30]. Thus, park visitors’ emotional states can vary depending on the parks’ accessibility, area, size, scale, landscape style, design features, elevation, and topography.
Geographic information systems (GIS) provide spatial decision support for forestry and park management and planning [31]. GIS data can provide valuable quantitative and timely information for mapping and assessing changes in landscapes and green spaces [32]. Stored satellite imagery can provide decades of consistent, precise, high-quality images [33] and detailed landscape pattern records at different temporal and spatial scales [34]. Data from the joint National Aeronautics and Space Administration (NASA) and United States Geological Survey (USGS) Landsat program have become increasingly critical of extensive studies on landscape dynamics [35]. The quantitative approach at a global scale relies on GIS, high-resolution digital elevation models (DEMs), and digital aerial imagery [36], which require neither public preferences nor large-scale research or measures [37] to identify and monitor precise locations over time.
Emotions can be observed through external physical expressions and monitored by measuring physiological changes and internal sensations [38]. Palermo and Rhodes wrote that “faces are probably the most biologically and socially significant visual stimuli in the human environment” [39] (p. 75), requiring us to rapidly detect, categorize, and interpret facial expressions as clues about others’ emotions, behaviours, and intentions. People’s facial expressions vary widely and can depend on many factors, including their emotions, social setting, environment, health, cultural background, and personality [40]. Emotional perception is usually expressed through multiple sensory channels, with crosstalk between the channels (e.g., sight, smell, touch, taste, hearing) [41]. For example, music can affect emotions (and thus facial expressions) through auditory, visual, and touch sensations [42]. Responses can be subjective, but pleasant smells induce positive emotions, and unpleasant smells induce negative emotions [43]. Therefore, perceptions of urban parks can be affected by numerous sensory perceptions, such as sights, sounds, smells, proprioception (body position), temperature, and humidity [44]. We posited that assessing park visitors’ facial expressions could better clarify the influence of urban forest environments on mental health and well-being.
Traditional research has relied primarily on self-reported scores to assess visitors’ emotions about the forest experience [45]. However, surveys require a significant time commitment from participants, and it can be challenging to recruit enough participants to validate the survey. We proposed an alternative method to test urban forest park visitors’ psychological responses: facial reading. This relatively new technique that uses a software algorithm trained to assess emotion expressions using visual records of human faces [46]. Our method of facial emotion recognition followed four steps: (1) detecting facial images; (2) processing the photos to ensure that they were clear and without excessive modification; (3) extracting facial features; and (4) classifying the facial expressions and scoring the expressions [47]. Previous studies have demonstrated that facial reading techniques can be used to assess people’s emotional states in urban forests. For example, Wei et al. [44] used facial reading technology to investigate the impact of forest experiences on visitors’ emotional states. Current facial recognition technology has achieved 87% accuracy in categorizing human facial expressions by emotion [48]. The use of facial reading technology significantly contributes to the real-time detection of park visitors’ facial expressions, providing a measure of their emotional responses to the park.
Our study analysed the relationship between visitors’ facial expressions and urban forest landscape metrics in Northern China. We calculated the metrics of green spaces, blue spaces, park features, and park elevations to test the relationship between three expressions—happy, sad, and neutral—and the positive response index. We hypothesized that an increase in the combined green space area, blue space area, overall park area, and park elevation would arouse higher positive emotions in visitors. This study’s findings will provide a useful reference for park visitors’ emotional responses to urban forests to inform the design and construction of future urban forest parks.

2. Materials and Methods
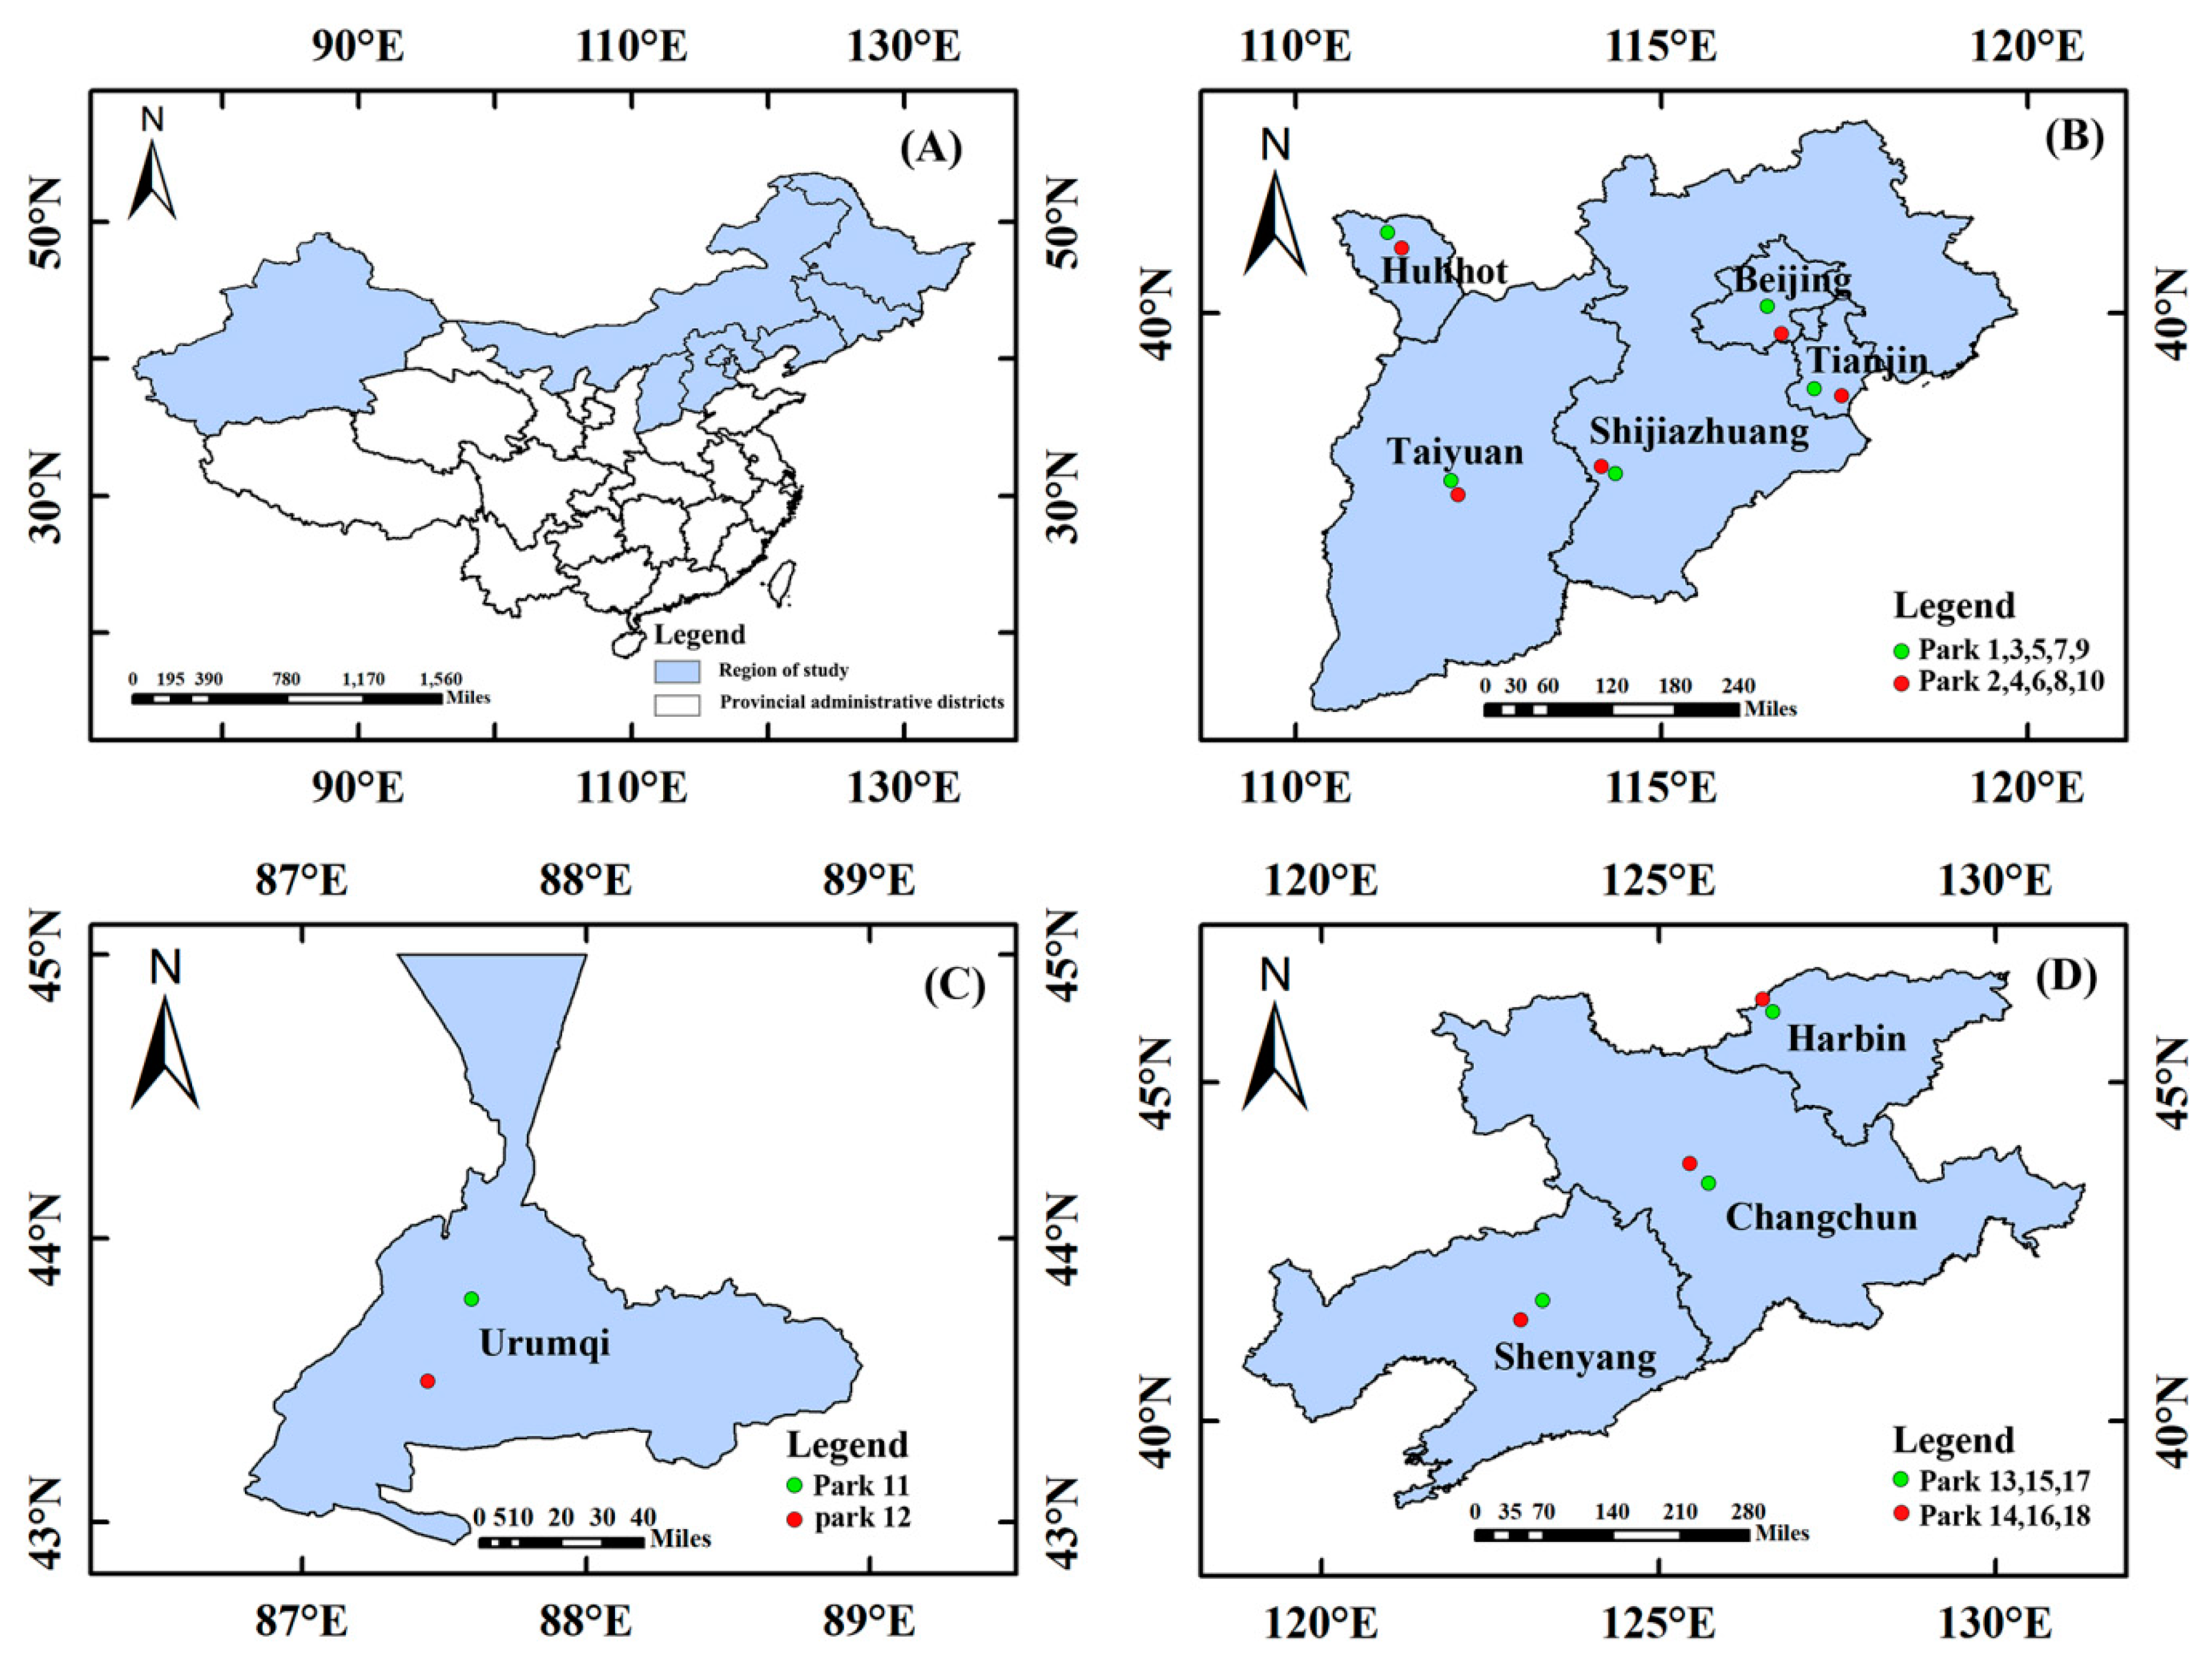
2.1. Study Sites

This study focused on nine cities located in Northern China (Table 1). As the centres of China’s provinces, provincial capitals have a high status and momentous influence on regional economic development, driving and promoting the development of local and neighbouring areas [49]. Hence, we selected two forest parks in nine provincial capital cities in Northern China as the research sites, randomly selecting two forest parks with different landscapes in each city. Figure 1 shows the specific geographical distribution of the studied forest locations.

2.2. Data Source

2.2.1. Photo Download and Treatment

We used the microblogging site Sina Weibo (Sina Corporation, Beijing, China) as the photo data source since the information was completely accessible to the public and the photos contained geolocation data [50]. Weibo is the largest social network service (SNS) platform in China, publishing the largest number of microblogs by Chinese users [51]. The study focused on visitors with typical oriental facial features, collecting 2031 photos to test the facial emotional expression of those visitors from 1 January to 31 December 2020, from 18 different urban forest parks. Our procedures and requirements for collecting photos for academic use were in full accordance with the ethical standards of the College of Forestry, Shenyang Agricultural University, China (CF-EC-2021-001). We used the data only to categorize the facial expressions as happy, sad, or neutral; this data could only be used for academic research, not any business initiative.
We downloaded and processed the photographs following these steps. First, we collected all the microblog photographs that showed oriental faces and contained check-in (geolocation) information relevant to one of the 18 urban forest parks between 1 January to 31 December 2020. Second, we screened the collected photos to select only photos where people’s facial elements (e.g., eyes, eyebrows, nose, mouth, ears) were clear and not overly decorated or covered. Third, we cropped the photos so that each photo contained only one face, with the nose axis perpendicular to the horizontal plane. Finally, we marked all the processed photos with the geolocation data, the date they were taken, and the person’s age (i.e., toddler, youth, adult, old).

2.2.2. Landscape Metric Collection and Treatment

We used the ArcGIS software to accurately outline the green spaces, blues spaces, and park boundaries in the Landsat image of each forest park. We then calculated the average elevation of the park. These processes required first performing projection conversion on the Landsat data so we could accurately outline of the green spaces, blue spaces, and park boundaries. We used DEM images to randomly select multiple points on the cropped park layer to calculate the average elevation of each forest park. Finally, we studied the green space, blue space, park area, and average park height as landscape metrics.

2.3. Facial Expression Analysis

We analysed the processed photos using the FireFACETM facial recognition software, Version 1.0 (Zhilunpudao Agricultural Science & Technique Inc., Changchun, China), assigning each face a happy, sad, or neutral expression score. We also used the positive response index (PRI) as a score to assess visitors’ net positive emotions [48]. We calculated this variable as the happy score minus the sad score, the visitors’ immediate net positive emotions [44]. We calibrated the FireFACETM software by training it with oriental faces with deliberately posed happy, sad, and neutral facial expressions. We considered the training complete when the software could correctly identify 80% of the happy or sad faces and 85% of the neutral faces [52]. These three expressions were the only expressions used in the study’s analyses because they had the highest accuracy after testing and could be matched reliably to the landscape metrics for analysis.

2.4. Statistical Analysis

We used IBM® SPSS® Statistics for Windows, Version 26.0 (IBM Corp., Armonk, NY, USA) for our data analysis. In the analysis of variance (ANOVA) on the expression scores, the following variables were fixed effects: age (toddler, youth, middle, old) and city (Huhhot, Taiyuan, Shijiazhuang, Beijing, Tianjin, Ürümqi, Shenyang, Changchun, and Harbin). When the data did not follow a normal distribution, we ranked the expression scores according to the order of variance to make them distribution-free. In the ANOVA analysis of the landscape metric, we tested the differences in the forest parks’ landscape metrics in the different cities, using the mean value ± standard deviation (SD) to express the results. When a significant effect was shown, we used the least significant difference (LSD) test with a significance level of 0.05 for comparison to prevent unevenness in the number of repetitions between the data groups. The original data used Spearman’s rank correlation coefficient analysis to evaluate the relationship between the landscape metrics (independent variables) and the happy, sad, and neutral expression scores and the well as PRI (dependent variables).

3. Results

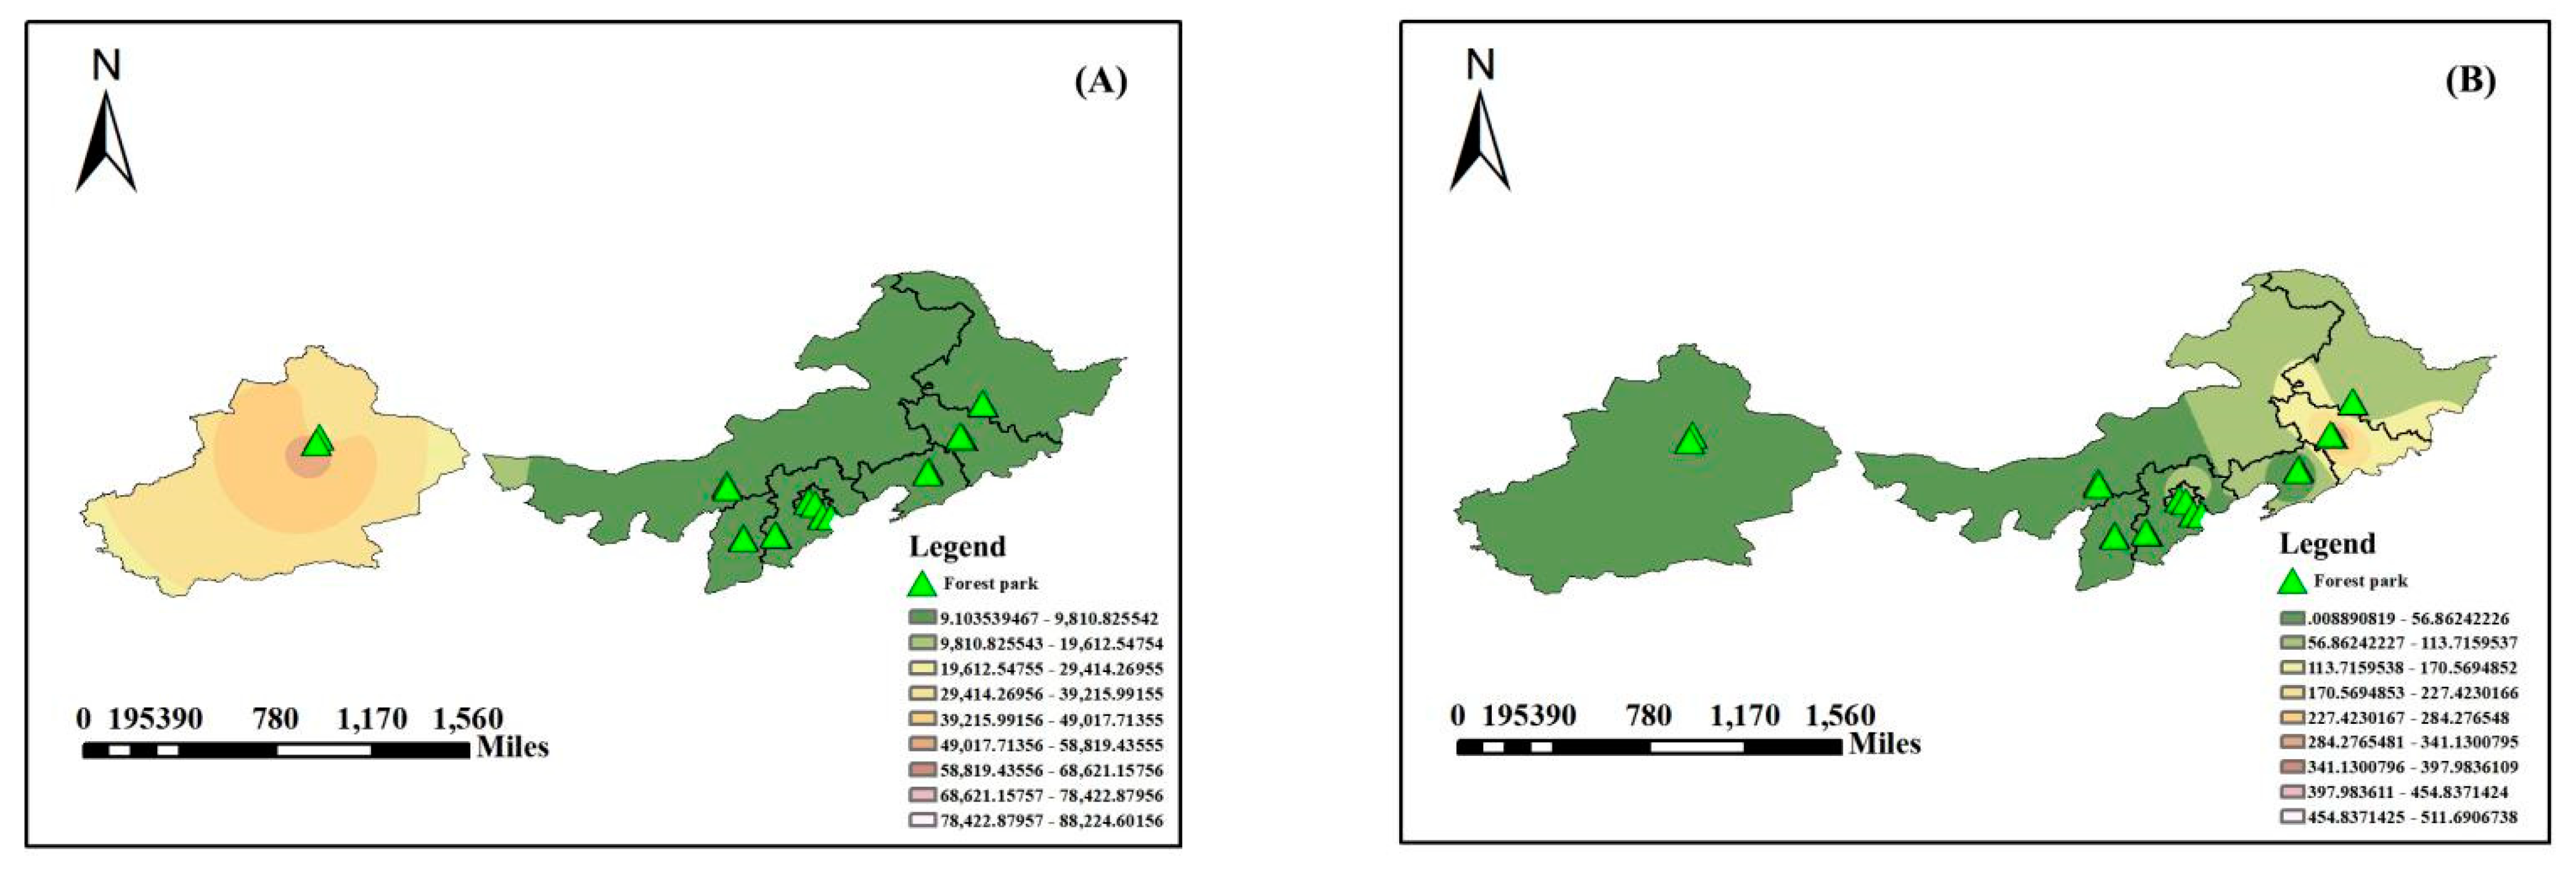
3.1. Landscape Metric among Different Northern Cities Analysis

Table 2 shows the landscape metrics of the 18 forest parks in the nine capital cities in Northern China, Figure 2 shows the mean distribution of the green spaces, blue spaces, park area, and average park elevation of each urban forest park.
We found significant differences in the green spaces, blue spaces, park area, and average park elevation among the nine cities (Table 3). The total green space in Ürümqi (53,073.25 ± 43,820.81 ha) was significantly higher than in the other cities. In terms of blue spaces, Changchun (307.94 ± 235.87 ha), Beijing (123.50 ± 59.13 ha), and Harbin (75.66 ± 45.48 ha) differed significantly from the other five cities. Changchun had the largest total blue space area, and Huhhot had the smallest (none). Ürümqi had the largest forest park area (61,895.76 ± 51,066.03 ha), and Shijiazhuang had the smallest area (45.35 ± 18.83 ha). Our calculations of the forest parks’ average elevation revealed that the average park elevations in Harbin (122.25 ± 11.37 m), Changchun (233.98 ± 22.96 m), Taiyuan (781.83 ± 4.68 m), Huhhot (1378.31 ± 331.90 m), and Ürümqi (1588.03 ± 592.87 m) differed from the other four cities, but there was no significant difference between Tianjin (4.94 ± 0.30 m), Beijing (17.60 ± 13.34 m), and Shenyang (35.00 ± 2.26 m).

3.2. Visitors’ Facial Expressions Analysis

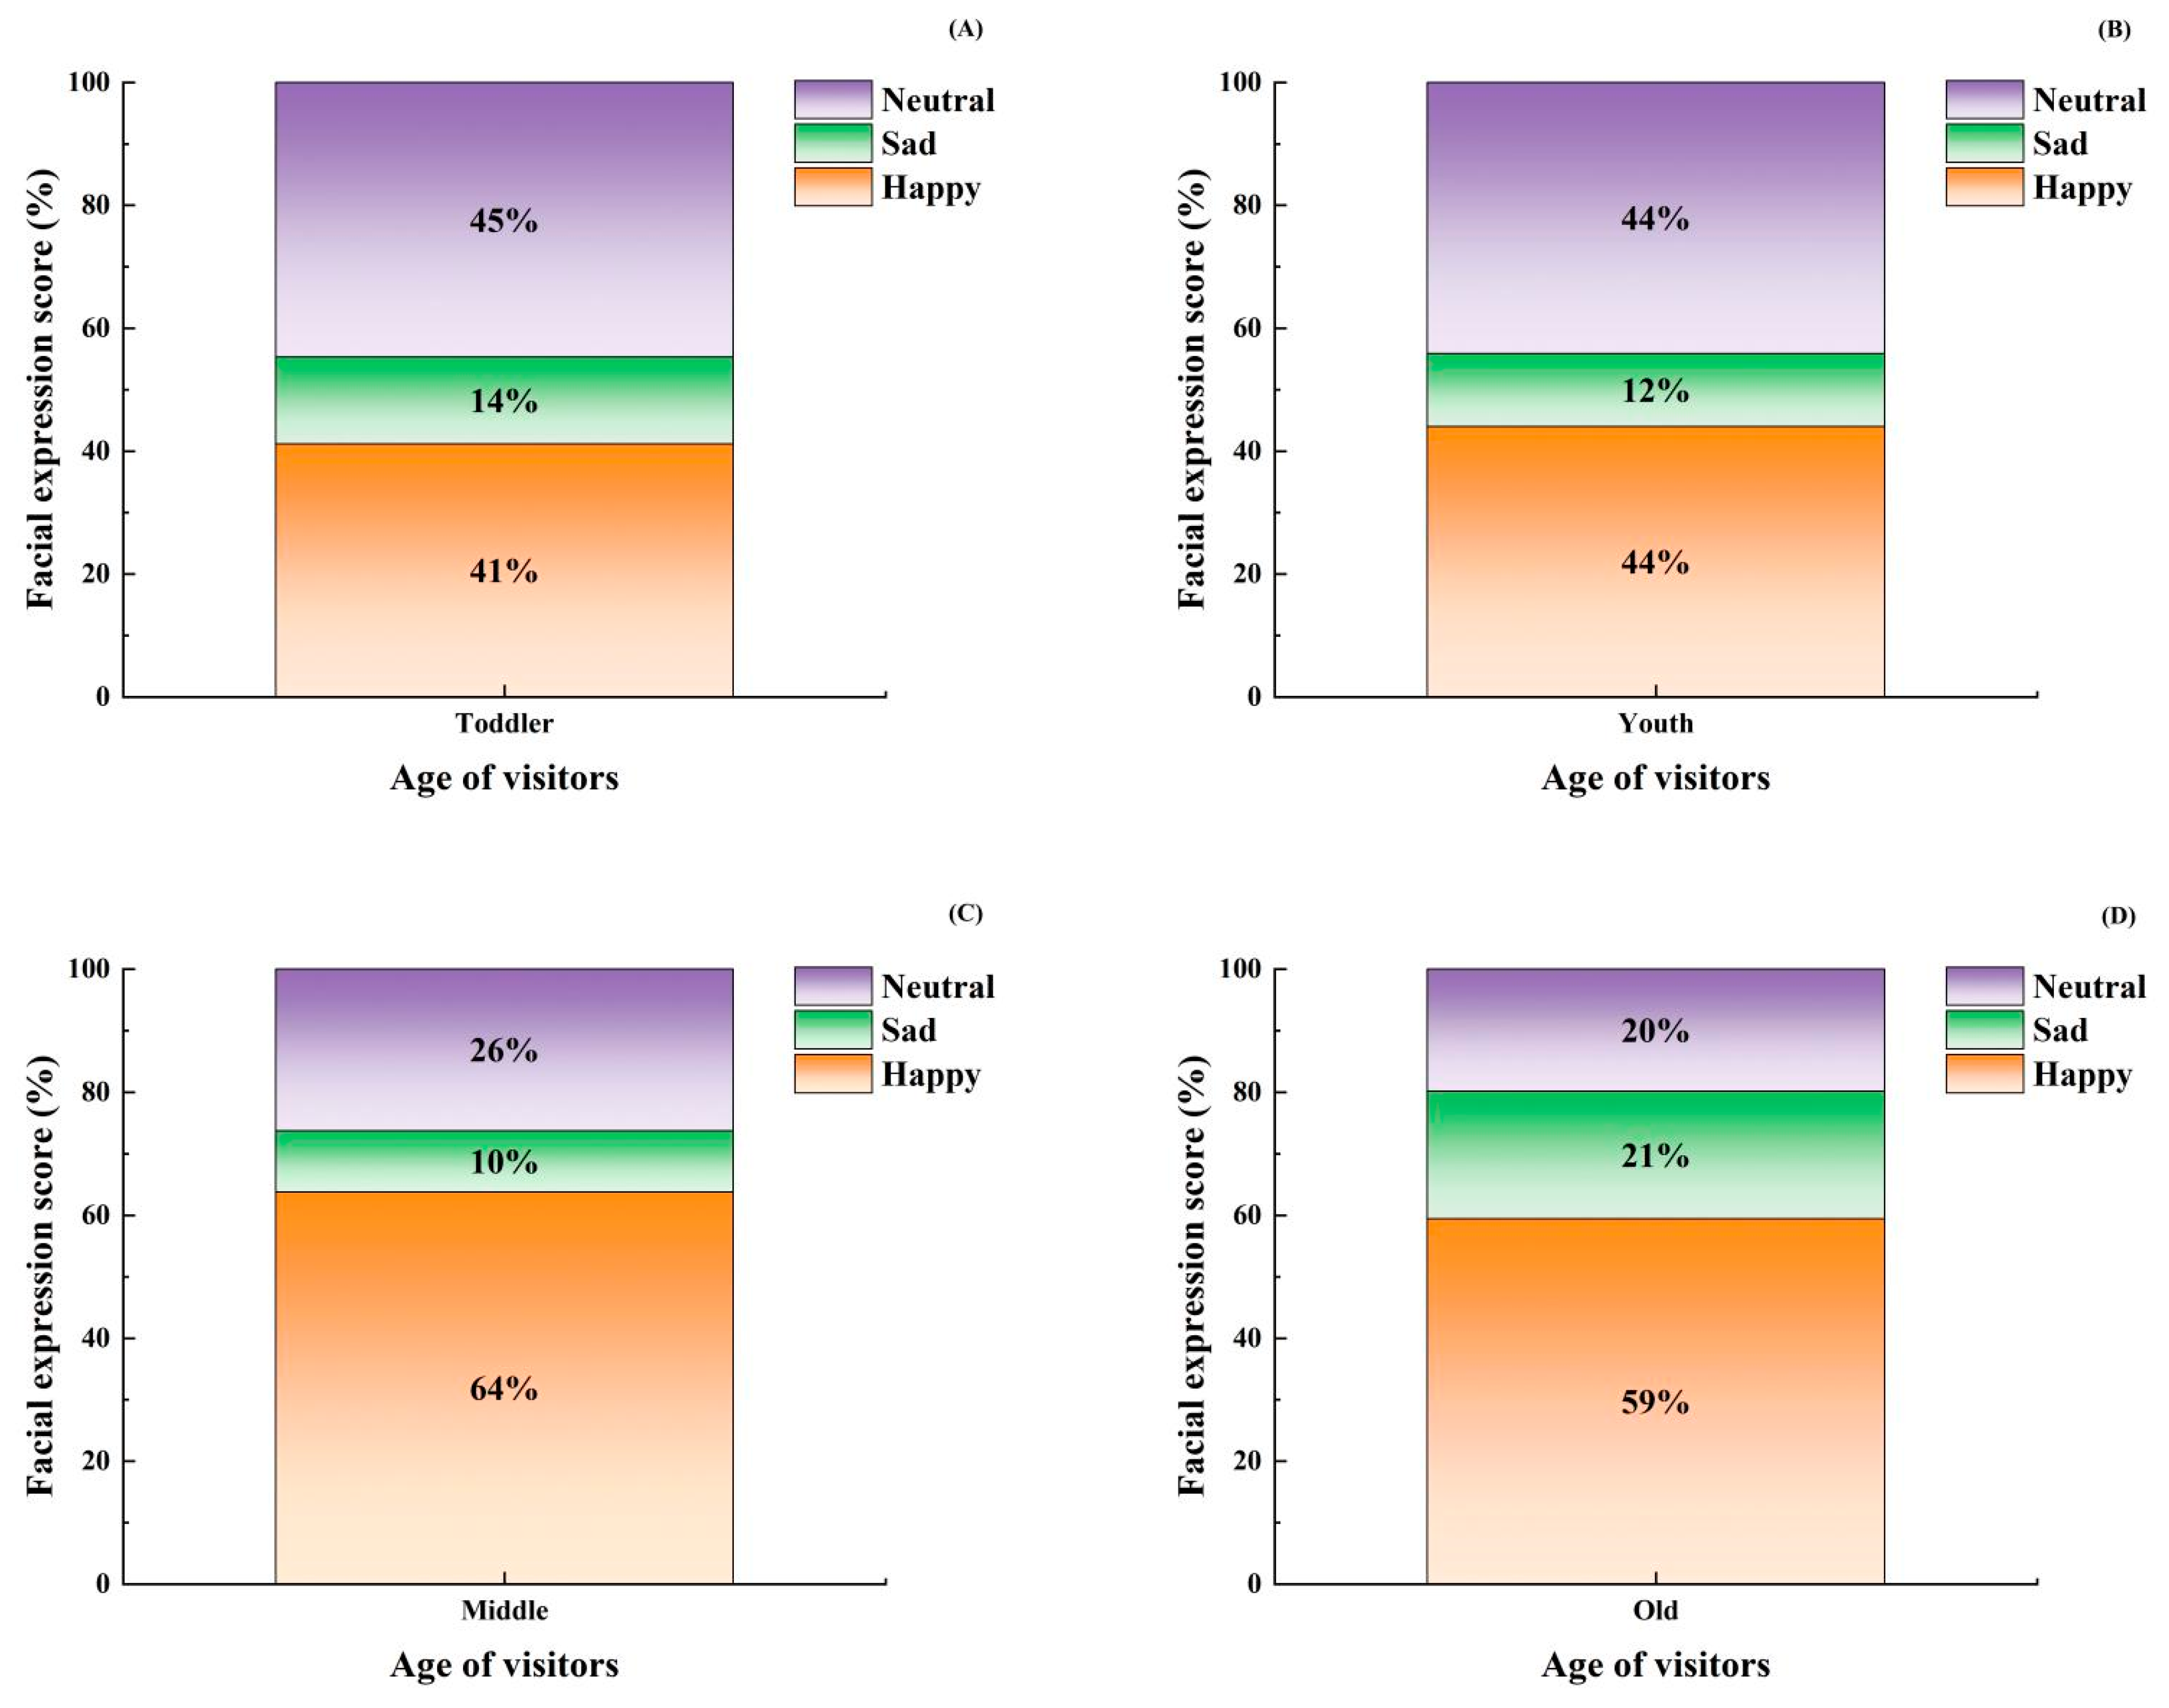
3.2.1. Different Ages of Visitors on Facial Expressions Analysis

We categorized the visitors as toddlers (0–5 years), youth (15–25 years), adult (30–60 years), and old (60+ years) based on their appearance and, when it was available, data were acquired from the Sina Weibo site. Table 4 shows the results of the ANOVA of all the visitors’ happy, sad, and neutral expressions. The happy expression scores of the adult and old visitors were significantly higher than for toddlers and youths. There were significantly more neutral facial expressions among the toddlers and youth than the adult and old visitors. There were significantly more sad facial expressions among the old visitors than the toddler, youth, and adult visitors (Figure 3).

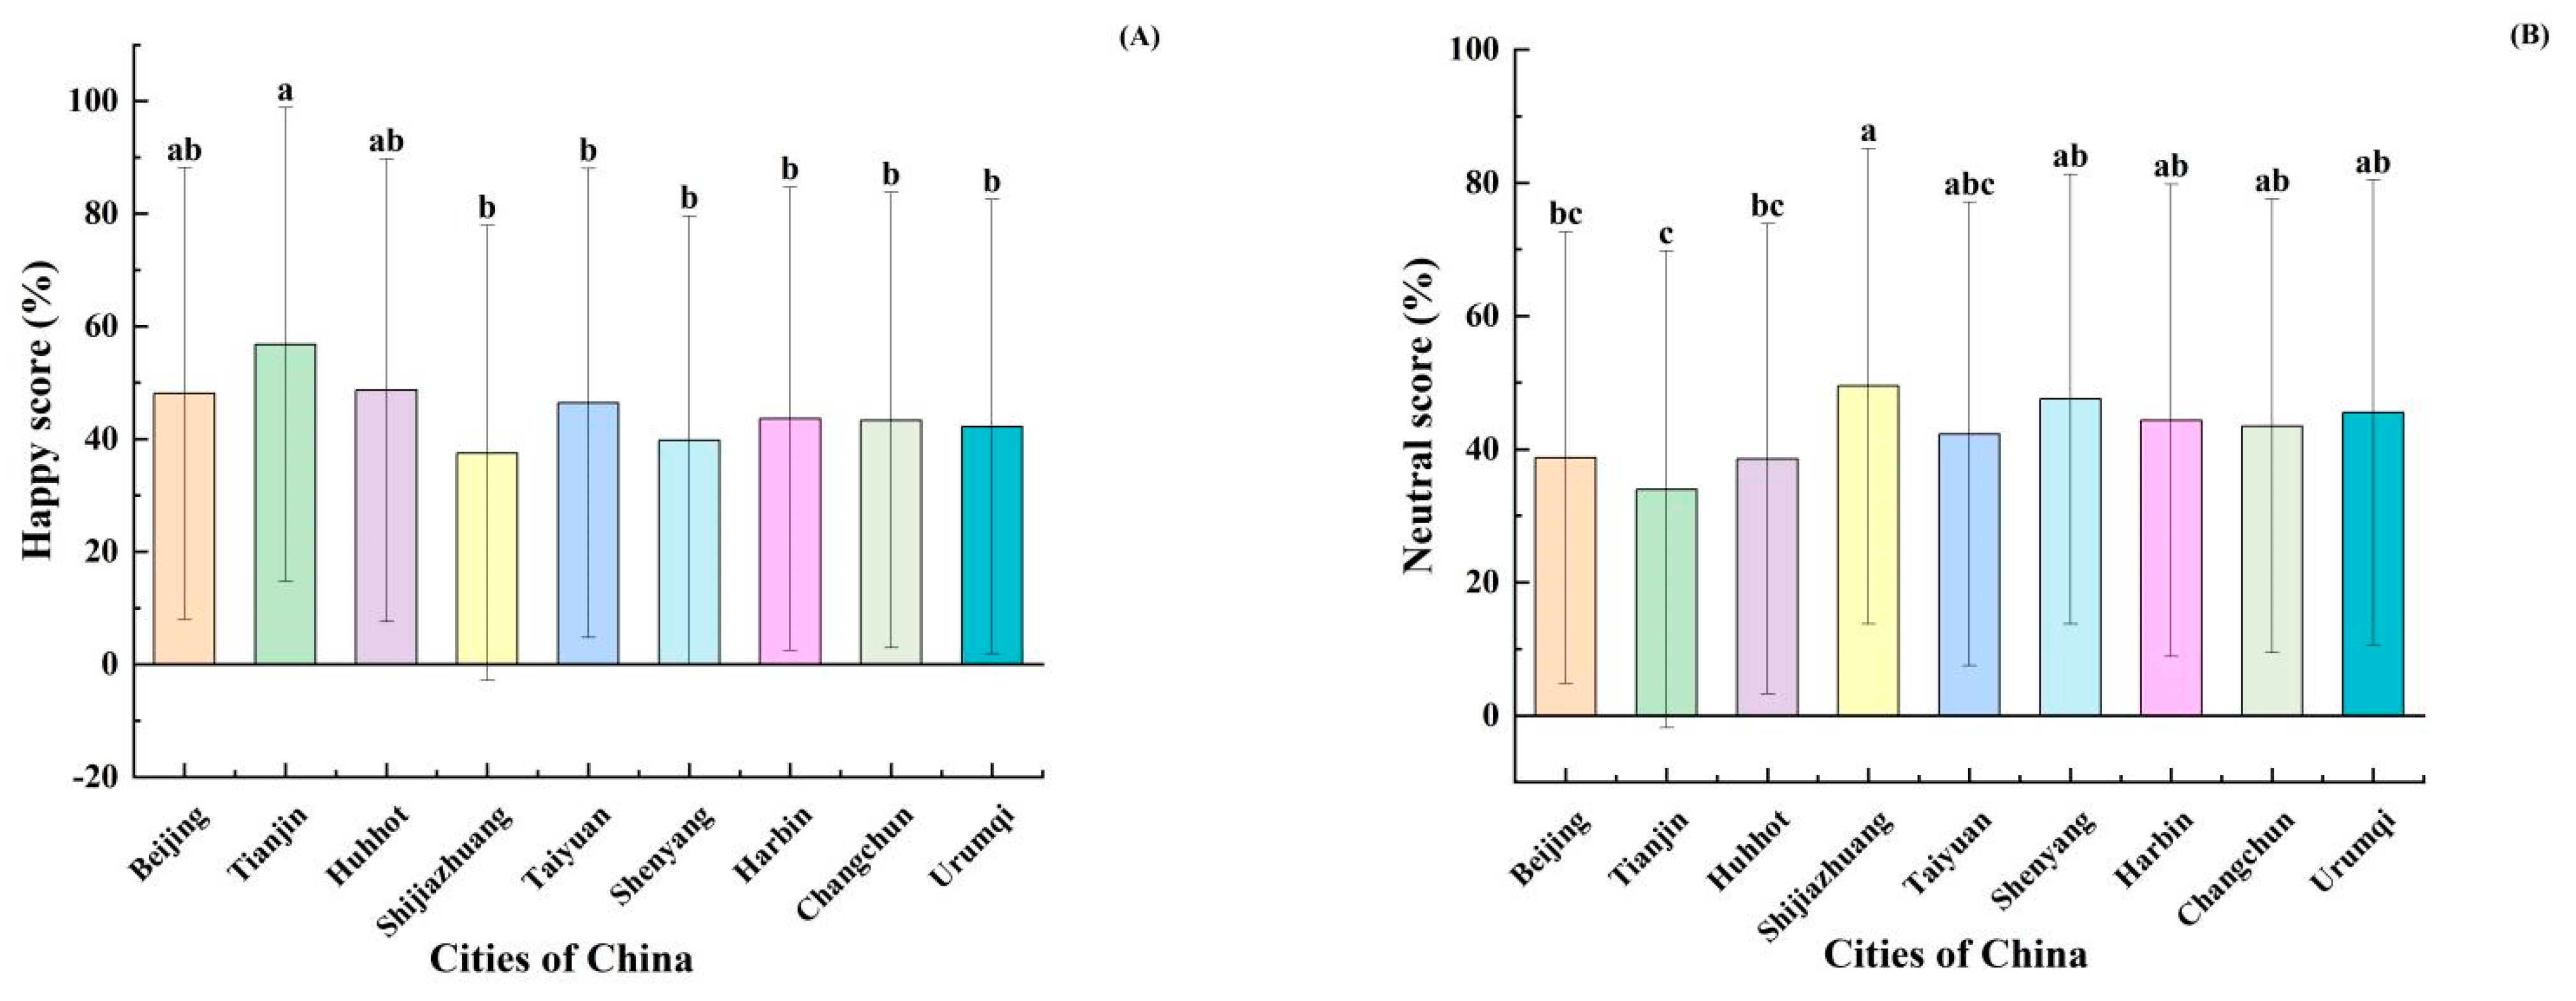
3.2.2. Different Cities of Visitors on Facial Expressions Analysis

We found significant differences in the happy and neutral scores of visitors’ expressions in China (Table 5). There were significantly higher happy expression scores in Tianjin than in Taiyuan, Harbin, Changchun, Ürümqi, Shenyang, and Shijiazhuang (Figure 4A). There were significantly higher neutral scores in Shijiazhuang than in Taiyuan, Beijing, Huhhot, and Tianjin (Figure 4B). There were no differences in the sadness scores between cities.

3.2.3. Cities and Ages Interaction Analysis

We found significant differences between the variables city and age and the visitors’ happy, sad, and neutral facial expressions. When the city variable interacted with age, only happiness and sadness were significantly different; however, there was no difference in the neutral expression (Table 6).

3.2.4. Positive Response Index Analysis

Adult visitors had higher PRI scores than toddlers and youth visitors (Figure 5A). The PRI scores of visitors in Tianjin were significantly higher than in Harbin, Changchun, Shenyang, Shijiazhuang, and Ürümqi (Figure 5B). The visitors’ PRI scores were positively correlated with park size (p = 0.011), indicating that people’s net positive emotion levels were significantly related to the size of the park (Table 7).

3.3. Landscape Metrics and Facial Expressions Correlation Analysis

The visitors’ happy scores were positively correlated with the green spaces (p = 0.019) and the park area (p = 0.001); we found the highest number of happy faces in the parks with the greenest space and overall park area (Table 7). However, there was no correlation between sad expressions and the four-landscape metrics, suggesting that visitors were not sadder because a park had less green space, blue space, or overall park area or a specific average park elevation. However, visitors’ neutral expressions were negatively correlated with a green space area (p = 0.017) and overall park area (p = 0.002). This suggested that increasing vegetation coverage would not necessarily cause the number of neutral expressions to have happy (or sad) expressions.

4. Discussion

4.1. The Age Effect on Facial Expressions

Thanks to the popularity of mobile devices with high-quality cameras, visitors upload more selfies than in the past [53]. More of our facial photographs originated with youths’ selfies than other visitors’ selfies. Artificial age assessments have also been used in studies of public sentiment during pandemics and to provide large-scale data [54]. Toddlers and youths scored relatively lower than adults and old people on happy expressions. The sadness scores were lower among adults than among the toddler, youth, and old visitors. These results suggest that the forest environments had a positive psychological effect on adult and old visitors, which is consistent with previous research [2]. Therefore, we concluded that the restorative effects of the urban forest experience extended to the elderly. The urban park activities provided opportunities for older adults to interact socially while enjoying the natural environment, enabling them to start and maintain friendships, which is known to benefit mental health [9]. Because we assessed the emotional expressions of different age groups during their urban forest park experiences using many sample photographs, our results provide empirical evidence for the improvement of mental health through urban parks.

4.2. The Discrepancy of Facial Expressions among Cities

Urbanization is the product of a combination of social, economic, and resource factors. The rapid development of cities should be based on the science of the human settlement environment to balance the environmental carrying capacity and urban development intensity [55]. In 1984, the World Health Organization (WHO) proposed establishing healthy cities to promote the healthy urban development [56]. The Healthy Cities program links cities’ living conditions to citizens’ health. Health and well-being are interrelated, and the environment of a healthy city can influence residents’ and visitors’ health and well-being. Therefore, psychological variables might be more significant for health than external variables [57]. Our results showed that parks in Tianjin, Beijing, and Harbin were strongly correlated with happy expressions; they were the highest in Tianjin. Shijiazhuang had the lowest happy expression scores. Our results suggest that visitors to northern urban forest parks showed a higher frequency of happy expressions than visitors to southern urban forest parks, which is consistent with Wei et al. [46]. Although we found no significant differences in sad expressions among the nine cities, we found the greatest number in Shijiazhuang was the most prominent.

4.3. Relationship between Landscape Metrics and Facial Expressions

Other studies have focused on specific forest landscape metrics [58]. According to Chen et al. [59], changes in the landscape scale can affect the visual quality of the visitor photos. People establish connections with the environment through psychological reactions [60]. Psychophysics quantitatively investigates the relationship between stimuli, the sensations they elicit, and the magnitude of changes in perceivable physical stimuli [12]. This study explored the impact of various urban forest park stimuli on visitors’ facial expressions from the perspective of landscape metrics. We found a significant positive correlation between green spaces and happy expressions. Similarly, Gozalo et al. [61] found that large green spaces were positively correlated with frequent strolling and relaxation among urban residents. Therefore, people’s urban forest park experiences might be influenced by lower normalized difference vegetation index (NDVI) scores; NVDI is a graphical indicator of the live green vegetation and tree cover density. Residents of communities with abundant green spaces tend to enjoy better mental health. One study in the Netherlands found that the positive correlation was most pronounced among senior citizens, homemakers, and those from lower socioeconomic groups [62]. More research is needed to verify the findings that green spaces induce positive emotions in visitors. Studies show that experiencing blue spaces helps reduce stress and promote social contact among the elderly [63]. Other studies support the health benefits of blue space environments [19,64]. In fact, Sonntag-Ostrom et al. [65] reported that blue spaces were the most restorative landscapes. Similarly, Nutsford et al. [66] indicated that people’s psychological stress decreased when they were within 15 km of visible outdoor blue spaces. In our study, there were three forest environments without water element landscape, which may lead to less happiness of visitors.
The area and average elevation of forest parks are also crucial factors affecting park visitors’ expressions. People usually prefer to visit large parks with specific facilities [67]. Another study found that a three-day trek in the highlands could improve children’s negative moods [68]. We found that the park scale was positively correlated with the PRI scores. Other studies have shown that humidity, terrain slope, and the vegetation are also important factors that affect visitors’ experiences [30]. Hence, when planning and constructing an urban forest park, designers should ensure that the size of the park meets the residents’ needs to stay active and exercise regularly. They should also consider the aesthetic value of the park to optimize the benefits of natural surroundings.

4.4. Limitation

We studied the facial expressions of visitors in urban forest parks in nine of China’s provincial capitals. Future studies should expand the scope of the target city selections and park locations to eliminate the influence of neighbourhood and inner group differences.
Second, we addressed the effect of the park environments on visitors’ facial expressions, but we did not set up any other urban environment as a control group for comparison. Future studies should consider additional urban variables to allow comparisons.
Third, people generally make happy expressions when they take selfies or have their photos taken by others, which might have affected the accuracy of our assessments; visitors might have worn sad or neutral faces until they were being photographed, which could have led to inaccuracies in our analyses. Therefore, future research should try to choose randomly captured candid photos for testing rather than selfies because the expressions would be more representative than posed photos.
Fourth, our age categorizations were guesses based primarily on people’s appearances. Liu et al.’s study [51] used visual assessments with the same age ranges: toddlers 0–5, youths 15–25, adults 30–60, and old people 60+; people who seemed to fall into the gaps were added to the nearest age group (e.g., someone seven years old would be classified with the toddlers). We might have misclassified the facial expressions because of the person’s age or the fluidity of expression; for example, a snapshot of what we classified as a toddler’s neutral expression might have been a transitional expression between happy and sad. However, there was no accurate indicator for distinguishing the visitors’ ages without additional information.
Finally, we selected only green spaces, blue spaces, park area, and average park elevation as the landscape metrics; we did not include hardscapes or structures. Future studies might follow the lead of Su [69], who divided forest landscapes into coniferous forest, broad-leaved forest, mixed forest, and static water landscape spaces. Su’s study found that people’s expressions of excitement and relaxation were more frequent in the mixed forests than in the other three groups. Therefore, our future studies will consider the influence of the different landscape elements on visitors’ facial expressions to confirm the connection between nature and benefits to mental health.

5. Conclusions

We screened and downloaded 2031 facial photographs from Sina Weibo of urban park visitors in nine provincial capitals in Northern China. We performed facial recognition on the processed photos using the FireFACETM ver 1.0 software to categorize the faces’ expressions as happy, sad, or neutral. The results showed that the urban parks with the greatest number of visitors with happy expressions were the parks with the greenest space and overall area. Thus, we recommend that future urban parks should feature a high percentage of vegetation to maximize residents’ experiences with managed natural spaces to improve their health and well-being.

Author Contributions

Conceptualization, P.L. and M.L.; methodology, P.L. and M.L.; software, M.L.; validation, P.L., M.L. and T.X.; formal analysis, P.L., M.L. and Y.W.; investigation, M.L. and T.X.; resources, P.L.; data curation, M.L. and T.X.; writing—original draft preparation, P.L. and M.L.; writing—review and editing, P.L. and M.L.; visualization, P.G.; supervision, Y.W.; project administration, P.L.; funding acquisition, P.L. All authors have read and agreed to the published version of the manuscript.

Funding

This research was funded by the Liaoning Key Research and Development Program (grant number: 2020JH2/10200033, 2021JH2/10200007), the National Natural Science Foundation of China (grant number: 31771695), and the Fundamental Research Funds for the Central Universities (Program for ecology research group) (grant number: 0901-110109).

Institutional Review Board Statement

The study was conducted according to the guidelines of the Declaration of Helsinki, and approved by The Ethic Committee of Human Studies, College of Forestry, Shenyang Agricultural University (protocol code: CF-EC-2021-001; date: 2 November 2021).

Informed Consent Statement

The study was approved by The Ethnic Committee of Human Studies, College of Forestry, Shenyang Agricultural University (protocol code: CF-EC-2021-001). All photos data for this study were obtained through Sina Weibo open source. Humans were informed when they uploaded photos on this open source platform. The Ethical Approval for Human Studies was submitted to the Forests submission system.

Data Availability Statement

Not applicable.

Acknowledgments

Authors acknowledge Lingquan Meng for photos treatment.

Conflicts of Interest

The authors declare no conflict of interest.

References

  1. McKenzie, K.; Murray, A.; Booth, T. Do urban environments increase the risk of anxiety, depression and psychosis? An epidemiological study. J. Affect. Disord. 2013, 150, 1019–1024. [Google Scholar] [CrossRef] [PubMed] [Green Version]
  2. Lee, J.; Park, B.-J.; Tsunetsugu, Y.; Ohira, T.; Kagawa, T.; Miyazaki, Y. Effect of forest bathing on physiological and psychological responses in young Japanese male subjects. Public Health 2011, 125, 93–100. [Google Scholar] [CrossRef]
  3. Shin, W.S.; Yeoun, P.S.; Yoo, R.W.; Shin, C.S. Forest experience and psychological health benefits: The state of the art and future prospect in Korea. Environ. Health Prev. Med. 2010, 15, 38–47. [Google Scholar] [CrossRef] [PubMed] [Green Version]
  4. Poulsen, D.V.; Stigsdotter, U.K.; Djernis, D.; Sidenius, U. ‘Everything just seems much more right in nature’: How veterans with post-traumatic stress disorder experience nature-based activities in a forest therapy garden. Health Psychol. Open 2016, 3, 3. [Google Scholar] [CrossRef] [PubMed] [Green Version]
  5. Carson, R.T.; DeShazo, J.; Schwabe, K.A.; Vincent, J.R.; Ahmad, I. Incorporating local visitor valuation information into the design of new recreation sites in tropical forests. Ecol. Econ. 2015, 120, 338–349. [Google Scholar] [CrossRef]
  6. Bahrini, F.; Bell, S.; Mokhtarzadeh, S. The relationship between the distribution and use patterns of parks and their spatial accessibility at the city level: A case study from Tehran, Iran. Urban For. Urban Green. 2017, 27, 332–342. [Google Scholar] [CrossRef] [Green Version]
  7. Hong, J.; Park, S.; An, M. Are Forest healing programs useful in promoting children’s emotional welfare? The Interpersonal relationships of children in foster care. Urban For. Urban Green. 2021, 59, 127034. [Google Scholar] [CrossRef]
  8. Bielinis, E.; Bielinis, L.; Krupińska-Szeluga, S.; Łukowski, A.; Takayama, N. The Effects of a Short Forest Recreation Program on Physiological and Psychological Relaxation in Young Polish Adults. Forests 2019, 10, 34. [Google Scholar] [CrossRef] [Green Version]
  9. Yu, C.-P.; Lin, C.-M.; Tsai, M.-J.; Tsai, Y.-C.; Chen, C.-Y. Effects of Short Forest Bathing Program on Autonomic Nervous System Activity and Mood States in Middle-Aged and Elderly Individuals. Int. J. Environ. Res. Public Health 2017, 14, 897. [Google Scholar] [CrossRef] [PubMed]
  10. Song, C.; Ikei, H.; Kobayashi, M.; Miura, T.; Li, Q.; Kagawa, T.; Kumeda, S.; Imai, M.; Miyazaki, Y. Effects of viewing forest landscape on middle-aged hypertensive men. Urban For. Urban Green. 2017, 21, 247–252. [Google Scholar] [CrossRef]
  11. Kabisch, N.; Püffel, C.; Masztalerz, O.; Hemmerling, J.; Kraemer, R. Physiological and psychological effects of visits to different urban green and street environments in older people: A field experiment in a dense inner-city area. Landsc. Urban Plan. 2021, 207, 103998. [Google Scholar] [CrossRef]
  12. Deng, L.; Li, X.; Luo, H.; Fu, E.-K.; Ma, J.; Sun, L.-X.; Huang, Z.; Cai, S.-Z.; Jia, Y. Empirical study of landscape types, landscape elements and landscape components of the urban park promoting physiological and psychological restoration. Urban For. Urban Green. 2020, 48, 126488. [Google Scholar] [CrossRef]
  13. Wang, R.; Zhao, J.; Meitner, M.J.; Hu, Y.; Xu, X. Characteristics of urban green spaces in relation to aesthetic preference and stress recovery. Urban For. Urban Green. 2019, 41, 6–13. [Google Scholar] [CrossRef]
  14. Li, Z.; Zhao, W.; Nie, M. Scale Characteristics and Optimization of Park Green Space in Megacities Based on the Fractal Measurement Model: A Case Study of Beijing, Shanghai, Guangzhou, and Shenzhen. Sustainability 2021, 13, 8554. [Google Scholar] [CrossRef]
  15. Grigsby-Toussaint, D.S.; Chi, S.-H.; Fiese, B.H. Where they live, how they play: Neighborhood greenness and outdoor physical activity among preschoolers. Int. J. Health Geogr. 2011, 10, 66. [Google Scholar] [CrossRef] [Green Version]
  16. Villeneuve, P.J.; Jerrett, M.; Su, J.G.; Burnett, R.T.; Chen, H.; Wheeler, A.; Goldberg, M.S. A cohort study relating urban green space with mortality in Ontario, Canada. Environ. Res. 2012, 115, 51–58. [Google Scholar] [CrossRef] [PubMed]
  17. Richardson, E.; Pearce, J.; Mitchell, R.; Kingham, S. Role of physical activity in the relationship between urban green space and health. Public Health 2013, 127, 318–324. [Google Scholar] [CrossRef] [Green Version]
  18. Wood, L.; Hooper, P.; Foster, S.; Bull, F. Public green spaces and positive mental health—investigating the relationship between access, quantity and types of parks and mental wellbeing. Health Place 2017, 48, 63–71. [Google Scholar] [CrossRef]
  19. Völker, S.; Kistemann, T. The impact of blue space on human health and well-being—Salutogenetic health effects of inland surface waters: A review. Int. J. Hyg. Environ. Health 2011, 214, 449–460. [Google Scholar] [CrossRef]
  20. Korpela, K.M.; Ylén, M.; Tyrväinen, L.; Silvennoinen, H. Favorite green, waterside and urban environments, restorative experiences and perceived health in Finland. Health Promot. Int. 2010, 25, 200–209. [Google Scholar] [CrossRef] [Green Version]
  21. Gascon, M.; Zijlema, W.; Vert, C.; White, M.P.; Nieuwenhuijsen, M. Outdoor blue spaces, human health and well-being: A systematic review of quantitative studies. Int. J. Hyg. Environ. Health 2017, 220, 1207–1221. [Google Scholar] [CrossRef] [PubMed]
  22. White, M.; Smith, A.; Humphryes, K.; Pahl, S.; Snelling, D.; Depledge, M. Blue space: The importance of water for preference, affect, and restorativeness ratings of natural and built scenes. J. Environ. Psychol. 2010, 30, 482–493. [Google Scholar] [CrossRef]
  23. Bedimo-Rung, A.L.; Mowen, A.J.; Cohen, D.A. The significance of parks to physical activity and public health: A conceptual model. Am. J. Prev. Med. 2005, 28, 159–168. [Google Scholar] [CrossRef]
  24. Giles-Corti, B.; Broomhall, M.H.; Knuiman, M.; Collins, C.; Douglas, K.; Ng, K.; Lange, A.; Donovan, R.J. Increasing walking: How important is distance to, attractiveness, and size of public open space? Am. J. Prev. Med. 2005, 28 (Suppl. 2), 169–176. [Google Scholar] [CrossRef]
  25. Maller, C.; Townsend, M.; Pryor, A.; Brown, P.; St Leger, L. Healthy nature healthy people: ‘contact with nature’ as an upstream health promotion intervention for populations. Health Promot. Int. 2006, 21, 45–54. [Google Scholar] [CrossRef] [PubMed] [Green Version]
  26. Sang, Å.O.; Knez, I.; Gunnarsson, B.; Hedblom, M. The effects of naturalness, gender, and age on how urban green space is perceived and used. Urban For. Urban Green. 2016, 18, 268–276. [Google Scholar] [CrossRef]
  27. Brown, G.; Schebella, M.; Weber, D. Using participatory GIS to measure physical activity and urban park benefits. Landsc. Urban Plan. 2014, 121, 34–44. [Google Scholar] [CrossRef]
  28. Peschardt, K.K.; Stigsdotter, U.K. Associations between park characteristics and perceived restorativeness of small public urban green spaces. Landsc. Urban Plan. 2013, 112, 26–39. [Google Scholar] [CrossRef]
  29. Shukitt, B.L.; Banderet, L.E. Mood states at 1600 and 4300 meters terrestrial altitude. Aviat. Space Environ. Med. 1988, 59, 530–532. [Google Scholar]
  30. Dudek, T. Influence of selected features of forests on forest landscape aesthetic value—Example of SE Poland. J. Environ. Eng. Landsc. Manag. 2018, 26, 275–284. [Google Scholar] [CrossRef] [Green Version]
  31. Hytönen, L.A.; Leskinen, P.; Store, R. A Spatial Approach to Participatory Planning in Forestry Decision Making. Scand. J. For. Res. 2002, 17, 62–71. [Google Scholar] [CrossRef]
  32. Michalowska, K.; Glowienka, E.; Hejmanowska, B. Temporal Satellite Images in The Process of Automatic Efficient Detection of Changes of the Baltic Sea Coastal Zone. IOP Conf. Ser. Earth Environ. Sci. 2016, 44, 042019. [Google Scholar] [CrossRef] [Green Version]
  33. Skole, D.; Tucker, C. Tropical Deforestation and Habitat Fragmentation in the Amazon: Satellite Data from 1978 to 1988. Science 1993, 260, 1905–1910. [Google Scholar] [CrossRef] [PubMed] [Green Version]
  34. Li, Y.; Liu, M.; Liu, X.; Yang, W.; Wang, W. Characterising three decades of evolution of forest spatial pattern in a major coal-energy province in northern China using annual Landsat time series. Int. J. Appl. Earth Obs. Geoinf. 2021, 95, 102254. [Google Scholar] [CrossRef]
  35. Hermosilla, T.; Wulder, M.; White, J.; Coops, N.C.; Pickell, P.D.; Bolton, D.K. Impact of time on interpretations of forest fragmentation: Three-decades of fragmentation dynamics over Canada. Remote. Sens. Environ. 2019, 222, 65–77. [Google Scholar] [CrossRef]
  36. Bohlin, J.; Wallerman, J.; Fransson, J.E.S. Forest variable estimation using photogrammetric matching of digital aerial images in combination with a high-resolution DEM. Scand. J. For. Res. 2012, 27, 692–699. [Google Scholar] [CrossRef]
  37. Cañas, I.; Ayuga, E.; Ayuga, F. A contribution to the assessment of scenic quality of landscapes based on preferences expressed by the public. Land Use Policy 2009, 26, 1173–1181. [Google Scholar] [CrossRef]
  38. Pal, S.; Mukhopadhyay, S.; Suryadevara, N. Development and Progress in Sensors and Technologies for Human Emotion Recognition. Sensors 2021, 21, 5554. [Google Scholar] [CrossRef]
  39. Palermo, R.; Rhodes, G. Are you always on my mind? A review of how face perception and attention interact. Neuropsycholgia 2007, 45, 75–92. [Google Scholar] [CrossRef]
  40. Mumenthaler, C.; Sander, D.; Manstead, A. Emotion Recognition in Simulated Social Interactions. IEEE Trans. Affect. Comput. 2018, 11, 1. [Google Scholar] [CrossRef] [Green Version]
  41. Li, D.; Jia, J.; Wang, X. Unpleasant Food Odors Modulate the Processing of Facial Expressions: An Event-Related Potential Study. Front. Neurosci. 2020, 14, 686. [Google Scholar] [CrossRef]
  42. Stock, J.V.D.; Peretz, I.; Grèzes, J.; de Gelder, B. Instrumental Music Influences Recognition of Emotional Body Language. Brain Topogr. 2009, 21, 216–220. [Google Scholar] [CrossRef] [PubMed] [Green Version]
  43. Robin, O.; Alaoui-Ismaïli, O.; Dittmar, A.; Vernet-Maury, E. Basic Emotions Evoked by Eugenol Odor Differ According to the Dental Experience. A Neurovegetative Analysis. Chem. Senses 1999, 24, 327–335. [Google Scholar] [CrossRef] [PubMed] [Green Version]
  44. Wei, H.; Ma, B.; Hauer, R.J.; Liu, C.; Chen, X.; He, X. Relationship between environmental factors and facial expressions of visitors during the urban forest experience. Urban For. Urban Green. 2020, 53, 126699. [Google Scholar] [CrossRef]
  45. Lee, J.; Tsunetsugu, Y.; Takayama, N.; Park, B.-J.; Li, Q.; Song, C.; Komatsu, M.; Ikei, H.; Tyrväinen, L.; Kagawa, T.; et al. Influence of Forest Therapy on Cardiovascular Relaxation in Young Adults. Evid. Based Complement. Altern. Med. 2014, 2014, 1–7. [Google Scholar] [CrossRef] [PubMed]
  46. Wei, H.; Hauer, R.J.; Chen, X.; He, X. Facial Expressions of Visitors in Forests along the Urbanization Gradient: What Can We Learn from Selfies on Social Networking Services? Forests 2019, 10, 1049. [Google Scholar] [CrossRef] [Green Version]
  47. Karbauskaitė, R.; Sakalauskas, L.; Dzemyda, G. Kriging Predictor for Facial Emotion Recognition Using Numerical Proximities of Human Emotions. Informatica 2020, 31, 249–275. [Google Scholar] [CrossRef]
  48. Kerrihard, A.L.; Khair, M.B.; Blumberg, R.; Feldman, C.H.; Wunderlich, S.M. The effects of acclimation to the United States and other demographic factors on responses to salt levels in foods: An examination utilizing face reader technology. Appetite 2017, 116, 315–322. [Google Scholar] [CrossRef]
  49. Wang, M.; Xu, J.-H.; Han, S.-R. A Study on the Economic Effects of Provincial Capital Bias and the Adjustment of Urban Development Strategy in China. In Proceedings of the 2018 International Conference on Management Science and Engineering (ICMSE), Frankfurt, Germany, 17–20 August 2018; pp. 390–405. [Google Scholar] [CrossRef]
  50. Dai, L.; Xue, T.; Wu, B.; Rong, X.; Xu, B. Spatiotemporal Structure Features of Network Check-in Activities of Urban Residents and Their Impacting Factors: A Case Study in Six Urban Districts of Beijing. J. Asian Arch. Build. Eng. 2017, 16, 131–138. [Google Scholar] [CrossRef] [Green Version]
  51. Liu, P.; Liu, M.; Xia, T.; Wang, Y.; Wei, H. Can Urban Forest Settings Evoke Positive Emotion? Evidence on Facial Expressions and Detection of Driving Factors. Sustainability 2021, 13, 8687. [Google Scholar] [CrossRef]
  52. Wei, H.; Hauer, R.J.; Zhai, X. The Relationship between the Facial Expression of People in University Campus and Host-City Variables. Appl. Sci. 2020, 10, 1474. [Google Scholar] [CrossRef] [Green Version]
  53. Shah, R.; Tewari, R. Demystifying ‘selfie’: A rampant social media activity. Behav. Inf. Technol. 2016, 35, 864–871. [Google Scholar] [CrossRef]
  54. Zhu, J.; Xu, C. Sina microblog sentiment in Beijing city parks as measure of demand for urban green space during the COVID-19. Urban For. Urban Green. 2021, 58, 126913. [Google Scholar] [CrossRef]
  55. Li, G.Y.; Chen, J.; Yu, F.F. Explore and Analyse of Urbanization Based on the Residential Environment Scientific Perspective. Adv. Mater. Res. 2011, 250–253, 2734–2739. [Google Scholar] [CrossRef]
  56. Nam, H.-E.; Lee, M.-R.; Kim, H.-S. The Study on the Relationship between Local Residents’ Perception of a Health-Cities and Personal Happiness. Korean J. Health Serv. Manag. 2014, 8, 175–185. [Google Scholar] [CrossRef] [Green Version]
  57. Lee, M.; Park, S.; Yoon, K. Do Health Promotion Programs Affect Local Residents’ Emotions? Int. J. Environ. Res. Public Heal. 2019, 16, 549. [Google Scholar] [CrossRef] [Green Version]
  58. Gong, L.; Zhang, Z.; Xu, C. Developing a Quality Assessment Index System for Scenic Forest Management: A Case Study from Xishan Mountain, Suburban Beijing. Forests 2015, 6, 225–243. [Google Scholar] [CrossRef] [Green Version]
  59. Chen, X.F.; Jia, L.M. Research on evaluation of in-forest landscapes in west Beijing mountain area. Sci. Silvae Sin. 2003, 39, 59–66. [Google Scholar]
  60. Bratman, G.N.; Hamilton, J.P.; Daily, G.C. The impacts of nature experience on human cognitive function and mental health. Ann. N. Y. Acad. Sci. 2012, 1249, 118–136. [Google Scholar] [CrossRef] [PubMed]
  61. Gozalo, G.R.; Morillas, J.M.B.; González, D.M. Perceptions and use of urban green spaces on the basis of size. Urban For. Urban Green. 2019, 46, 126470. [Google Scholar] [CrossRef]
  62. Maas, J.; Verheij, R.A.; Groenewegen, P.P.; de Vries, S.; Spreeuwenberg, P. Green space, urbanity, and health: How strong is the relation? J. Epidemiol. Community Health 2006, 60, 587–592. [Google Scholar] [CrossRef] [PubMed] [Green Version]
  63. Chen, Y.; Yuan, Y. The neighborhood effect of exposure to blue space on elderly individuals’ mental health: A case study in Guangzhou, China. Health Place 2020, 63, 102348. [Google Scholar] [CrossRef]
  64. Foley, R.; Kistemann, T. Blue space geographies: Enabling health in place. Health Place 2015, 35, 157–165. [Google Scholar] [CrossRef] [PubMed] [Green Version]
  65. Sonntag-Öström, E.; Stenlund, T.; Nordin, M.; Lundell, Y.; Ahlgren, C.; Fjellman-Wiklund, A.; Järvholm, L.S.; Dolling, A. “Nature’s effect on my mind”—Patients’ qualitative experiences of a forest-based rehabilitation programme. Urban For. Urban Green. 2015, 14, 607–614. [Google Scholar] [CrossRef] [Green Version]
  66. Nutsford, D.; Pearson, A.L.; Kingham, S.; Reitsma, F. Residential exposure to visible blue space (but not green space) associated with lower psychological distress in a capital city. Health Place 2016, 39, 70–78. [Google Scholar] [CrossRef]
  67. Bertram, C.; Meyerhoff, J.; Rehdanz, K.; Wüstemann, H. Differences in the recreational value of urban parks between weekdays and weekends: A discrete choice analysis. Landsc. Urban Plan. 2017, 159, 5–14. [Google Scholar] [CrossRef]
  68. Chao, C.-C.; Chen, L.H.; Lin, Y.-C.; Wang, S.-H.; Wu, S.-H.; Li, W.-C.; Huang, K.-F.; Chiu, T.-F.; Kuo, I.-C. Impact of a 3-Day High-Altitude Trek on Xue Mountain (3886 m), Taiwan, on the Emotional States of Children: A Prospective Observational Study. High Alt. Med. Biol. 2019, 20, 28–34. [Google Scholar] [CrossRef]
  69. Su, J.D. The Effect of Different Forest Landscape Spaces on the Physical and Mental Recovery of College Students; Shenyang Agriculture University: Shenyang, China, 2020. [Google Scholar] [CrossRef]
Figure 1. Distributions of study areas (A) in northern China. Forest park locations are labelled by green dots and red dots in north China (B), northwest China (C), and northeast China (D).
Forests 12 01619 g001
Figure 2. Mean distribution of the green area (A), water area (B), park area (C), and park average elevation (D) in northwest, north and northeast cities in 2020.
Forests 12 01619 g002aForests 12 01619 g002b
Figure 3. The neutral, sad, and happy expression scores of toddlers (A), youth (B), middle-aged (C) and old (D) visitors in northern forest parks.
Forests 12 01619 g003
Figure 4. Happy (A), and neutral (B) scores on visitors’ face in northern cities. Error bars stand for standard errors that stared from the columns (means). Different letters of a, b and c indicate significant differences of ranked scores according to LSD test at the 0.05 level.
Forests 12 01619 g004
Figure 5. PRI of different ages visitors (A) and PRI of visitors from different cities in China (B). Error bars stand for standard errors that stared from the columns (means). Different letters of a and b indicate significant differences of ranked scores according to an LSD test at the 0.05 level.
Forests 12 01619 g005
Table 1. Summary of information about forest parks and the number of photos in northern China in 2020.
CityForest ParkCoordinateNumber of Photos
Huhhot1. Hadamen National Forest Park 41°01′ N, 111°58′ E53
2. Daqingshan Wildlife Park40°88′ N, 111°62′ E100
Taiyuan3. Taiyuan Forest Park37°91′ N, 112°54′ E178
4. Wenying Park37°87′ N, 112°57′ E75
Shijiazhuang5. Century Park38°02′ N, 114°54′ E111
6. Xiushui Park38°09′ N, 114°39′ E86
Beijing7. Olympic Forest Park40°02′ N, 116°39′ E76
8. Grand Canal Forest Park39°88′ N, 116°74′ E142
Tianjin9. Pak Ning Park39°17′ N, 117°22′ E90
10. Tanggu Forest Park39°10′ N, 117°67′ E125
Urumqi11. People’s park43°80′ N, 87°61′ E91
12. Tianshan Canyon43°49′ N, 87°44′ E134
Shenyang13. Beiling Park41°85′ N, 123°43′ E133
14. Changbai Island Forest Park41°75′ N, 123°39′ E141
Changchun15. Jingyuetan Scentic Spot43°78′ N, 125°48′ E180
16. South Lake Park43°86′ N, 125°31′ E160
Harbin17. Heilongjiang Forest Botanical Garden45°71′ N, 126°65′ E43
18. Sun Island Park45°79′ N, 126°60′ E113
Table 2. Summary of information about forest parks landscape metrics in north of China in 2020.
CityForest ParkGreen Area (ha)Water Area (ha)Forest Park Area (ha)Forest Park Elevation (m)
HuhhotHadamen National Forest Park2970.00none3600.001832.73
Daqingshan Wildlife Park521.73none820.001137.47
TaiyuanTaiyuan Forest Park95.9025.73224.00778.59
Wenying Park3.373.9611.90788.83
ShijiazhuangCentury Park11.293.5328.8262.26
Xiushui Park38.2910.9066.7084.20
BeijingOlympic Forest Park404.2242.86680.0035.81
Grand Canal Forest Park546.66166.66713.337.86
TianjinPak Ning Park7.749.5557.874.58
Tanggu Forest Park117.7333.39460.005.20
UrumqiPeople’s park15.981.2230.15870.20
Tianshan Canyon89,104.68none103,848.542075.52
ShenyangBeiling Park233.9926.70356.7437.33
Changbai Island Forest Park25.954.1940.2532.81
ChangchunJingyuetan Scentic Spot6033.38530.009638.00255.61
South Lake Park86.5958.13222.34209.66
HarbinHeilongjiang Forest Botanical Garden86.342.16136.00140.63
Sun Island Park2126.38103.633800.76115.26
Table 3. Analysis of variance (ANOVA) of landscape metrics of green area, water area, park area and park average elevation among different northern cities.
VariableSum of SquaresDF 1Mean SquareSig. 2
Green areaCity Inter-group545,980,466,666.198.0068,247,558,333.270.000
City Intra-group433,477,010,268.792022.00214,380,321.60
Total979,457,476,934.992030.00
Water areaCity Intergroup24,308,520.108.003,038,565.010.000
City Intra-group20,032,288.712022.009907.17
Total44,340,808.812030.00
Forest-park areaCity Inter-group734,483,266,261.668.0091,810,408,282.710.000
City Intra-group592,347,112,110.872022.00292,951,094.02
Total1,326,830,378,372.532030.00
Forest-park elevationCity Inter-group642,193,245.868.0080,274,155.730.000
City Intra-group95,747,708.432022.0047,352.97
Total737,940,954.302030.00
Note: 1 DF, degree of freedom; 2 Sig, significance, the same below.
Table 4. Analysis of variance (ANOVA) of toddler, youth, middle-aged and old visitors on happy, sad, neutral facial expressions and positive response index in forest parks.
Source of VarianceSum of SquaresDF 1Mean SquareSig. 2
HappyAge Inter-group45,251.894315,083.9650.000
Age Intra-group3,360,420.58620271657.83
Total3,405,672.482030
SadAge Inter-group2938.0823979.3610.009
Age Intra-group518,526.2282027255.81
Total521,464.312030
NeutralAge Inter-group43,757.541314,585.8470.000
Age Intra-group2,437,688.96120271202.609
Total2,481,446.5022030
PRI 3Age Inter-group51,707.131317,235.710.000
Age Intra-group5,315,552.95620272622.374
Total5,367,260.0862030
Note: 1 DF, degree of freedom; 2 Sig, significance; 3 PRI, positive response index, the same below.
Table 5. Analysis of variance (ANOVA) of cities on happy, sad, neutral facial expressions and positive response index in forest parks.
Source of VarianceSum of SquaresDF 1Mean SquareSig. 2
HappyCity Inter-group55,801.98386975.2480.000
City Intra-group3,349,870.49720221656.711
Total3,405,672.482030
SadCity Inter-group2669.1268333.6410.239
City Intra-group518,795.1842022256.575
Total521,464.312030
NeutralCity Inter-group40,370.5285046.3150.000
City Intra-group2,441,075.98220221207.258
Total2,481,446.5022030
PRI 3City Inter-group74,121.69789265.2120.000
City Intra-group5,293,138.38920222617.774
Total5,367,260.0862030
Note: 1 DF, degree of freedom; 2 Sig, significance; 3 PRI, positive response index, the same below.
Table 6. Analysis of variance (ANOVA) with the mixed model of city, age, and their interaction on repeated measures of ranked scores about happy, sad, and neutral facial expression scores and the positive response index.
SourceVariableIII Sum of SquaresDF 1Mean SquaresSig. 2
ModelHappy147,640.354314762.5920.000
Sad19,413.10131626.2290.000
Neutral111,873.975313608.8380.000
PRI 3219,572.676317082.990.000
CityHappy38,955.39184869.4240.002
Sad9424.83381178.1040.000
Neutral20,564.95282570.6190.027
PRI 375,966.92589495.8660.000
AgeHappy26,088.06238696.0210.001
Sad2551.573850.5230.017
Neutral21,006.11837002.0390.001
PRI 336,141.331312,047.110.003
City × AgeHappy55,217.161202760.8580.028
Sad13,185.12520659.2560.000
Neutral36,484.372201824.2190.060
PRI 3100,695.677205034.7840.007
Note: 1 DF, degree of freedom; 2 Sig, significance; 3 PRI, positive response index, the same below.
Table 7. Coefficients from Spearman correlation between the landscape metric and three facial expressions and the positive response index of visitors therein in target forest park.
IndexHappySadNeutralPRI 1Green AreaWater AreaPark AreaPark Elevation
Happy1
Sad−0.731 **1
Neutral−0.886 **0.522 **1
PRI 10.936 **−0.882 **−0.768 **1
Green area0.052 *−0.001−0.053 *0.0391
Water area0.0140.012−0.020.0060.324 **1
Park area0.071 **−0.011−0.070 **0.056 *0.984 **0.319 **1
Park elevation−0.0260.0150.028−0.0270.286 **−0.422 **0.261 **1
Note: * and ** mean significant correlation at p < 0.05 and extremely significant correlation at p < 0.01, respectively. 1 PRI, positive response index.
Publisher’s Note: MDPI stays neutral with regard to jurisdictional claims in published maps and institutional affiliations.

