Article

Soil Organic Carbon Stocks in Afforested Agricultural Land in Lithuanian Hemiboreal Forest Zone

by
Iveta Varnagirytė-Kabašinskienė
*,
Povilas Žemaitis
,
Kęstutis Armolaitis
,
Vidas Stakėnas
and
Gintautas Urbaitis
Department of Silviculture and Ecology, Institute of Forestry, Lithuanian Research Centre for Agriculture and Forestry, Liepų St. 1, Girionys, LT-53101 Kaunas District, Lithuania
*
Author to whom correspondence should be addressed.
Forests 2021, 12(11), 1562; https://doi.org/10.3390/f12111562
Submission received: 9 October 2021 / Revised: 8 November 2021 / Accepted: 10 November 2021 / Published: 12 November 2021
(This article belongs to the Section Forest Soil)

Abstract

:
In the context of the specificity of soil organic carbon (SOC) storage in afforested land, nutrient-poor Arenosols and nutrient-rich Luvisols after afforestation with coniferous and deciduous tree species were studied in comparison to the same soils of croplands and grasslands. This study analysed the changes in SOC stock up to 30 years after afforestation of agricultural land in Lithuania, representing the cool temperate moist climate region of Europe. The SOC stocks were evaluated by applying the paired-site design. The mean mass and SOC stocks of the forest floor in afforested Arenosols increased more than in Luvisols. Almost twice as much forest floor mass was observed in coniferous than in deciduous stands 2–3 decades after afforestation. The mean bulk density of fine (<2 mm) soil in the 0–30 cm mineral topsoil layer of croplands was higher than in afforested sites and grasslands. The clear decreasing trend in mean bulk density due to forest stand age with the lowest values in the 21–30-year-old stands was found in afforested Luvisols. In contrast, the SOC concentrations in the 0–30 cm mineral topsoil layer, especially in Luvisols afforested with coniferous species, showed an increasing trend due to the influence of stand age. The mean SOC values in the 0–30 cm mineral topsoil layer of Arenosols and Luvisols during the 30 years after afforestation did not significantly differ from the adjacent croplands or grasslands. The mean SOC stock slightly increased with the forest stand age in Luvisols; however, the highest mean SOC stock was detected in the grasslands. In the Arenosols, there was higher SOC accumulation in the forest floor with increasing stand age than in the Luvisols, while the proportion of SOC stocks in mineral topsoil layers was similar and more comparable to grasslands. These findings suggest encouragement of afforestation of former agricultural land under the current climate and soil characteristics in the region, but the conversion of perennial grasslands to forest land should be done with caution.

1. Introduction

In recent decades, sustainable forest management, including afforestation of former agricultural land, has been identified as a cost-effective strategy for removing CO2, contributing to soil quality and protecting biodiversity [1,2,3,4,5,6,7,8,9,10]. It was previously observed that forest soil organic carbon (SOC) stocks are 1.5 times higher than organic carbon stocks in tree biomass [11]. Afforestation of former croplands and grasslands support carbon sequestration in forest plant biomass and soil. Ref. [12] found that agricultural soils contain 25–75% less SOC than forests and have a relatively high potential to sequester C from the atmosphere. Following afforestation, 25–30% of total C is sequestered in soils, while 70% is in biomass [2].
The recent studies have examined the effects of afforestation on SOC stocks in depth, which have been identified as decreased [13,14,15,16,17], increased [18,19,20,21,22,23,24] or unchanged [25,26,27,28] compared to the former land-use category such as pasture or arable land. For example, Ref. [20] found that SOC stocks in mineral soil increased by 18% after afforestation of former cropland. However, no differences in SOC stocks in the 0–30 cm mineral topsoil layer were obtained even 50 years after afforestation with Norway spruce [28].
Overall, afforestation positively affects the SOC balance on former agricultural land with low soil organic matter (SOM). Reduced tillage resulted in slower SOM mineralisation and more protected SOC [21,29]. In addition, the SOC accumulation highly depends on different drivers as local climate conditions, soil type and texture, and tree species composition. [30,31]. Different pathways of carbon accumulation due to land-use change were identified depending on the mentioned factors. In the short term, afforestation could decrease the SOC stocks (organic carbon mainly accumulates in above-ground tree biomass); then, after several years, SOC accumulation reaches the level of non-forest soil, and finally, the SOC stock begins to increase more intensively some decades after afforestation [1,4,26,32,33,34]. However, it takes a very long time to reach the SOC levels in natural forests [22,27]. Most intensive accumulation and significant increase of SOC content were observed approximately 30 years after afforestation [32], while the recent studies outlined that a significant increase in soil C stocks could be observed over 100 years [10].
Lithuania is implementing many international commitments to contribute to climate change mitigation goals. In line with the global efforts, the country prioritises increasing the forest cover for climate change mitigation and environmental protection issues, and afforestation of abandoned arable land is strongly encouraged [35]. The priority is given to lands unsuitable for farming with low productivity, which could increase the forest cover to 37–38%. Still, legal restrictions are linked with the afforestation of land that has relatively high productivity [36]. The modelling of the future development of land use in Lithuania revealed that carbon stocks in the land use, land-use change, and forestry (LULUCF) activities should increase mainly due to the accumulation of carbon in forests [37]. Therefore, increasing the area of forest land and grassland remains an important issue to achieve the set afforestation and agricultural targets contributing to greenhouse gas absorption in the next decade.
The present study explored soil organic carbon (SOC) stocks following afforestation of former agricultural land with deciduous and coniferous tree species. More specifically, this study evaluated SOC values in nutrient-poor Arenosols and nutrient-rich Luvisols in afforested land compared to cropland and grassland in Lithuania. The obtained national carbon stock values are planned to be included in national greenhouse gas inventory in LULUCF sector in the next submission [38].
This study hypothesised that the largest expected changes should be recorded in the forest floor, which begins to form soon after afforestation. The specific research questions include: what change in SOC stock could be observed 30 years after afforestation of agricultural land in Lithuania belonging to the European hemiboreal forest zone under the cool temperate moist climate region? What effect does afforestation with deciduous and coniferous species have on the accumulation of soil C in the forest floor and mineral topsoil of nutrient-poor Arenosols and nutrient-rich Luvisols?

2. Materials and Methods
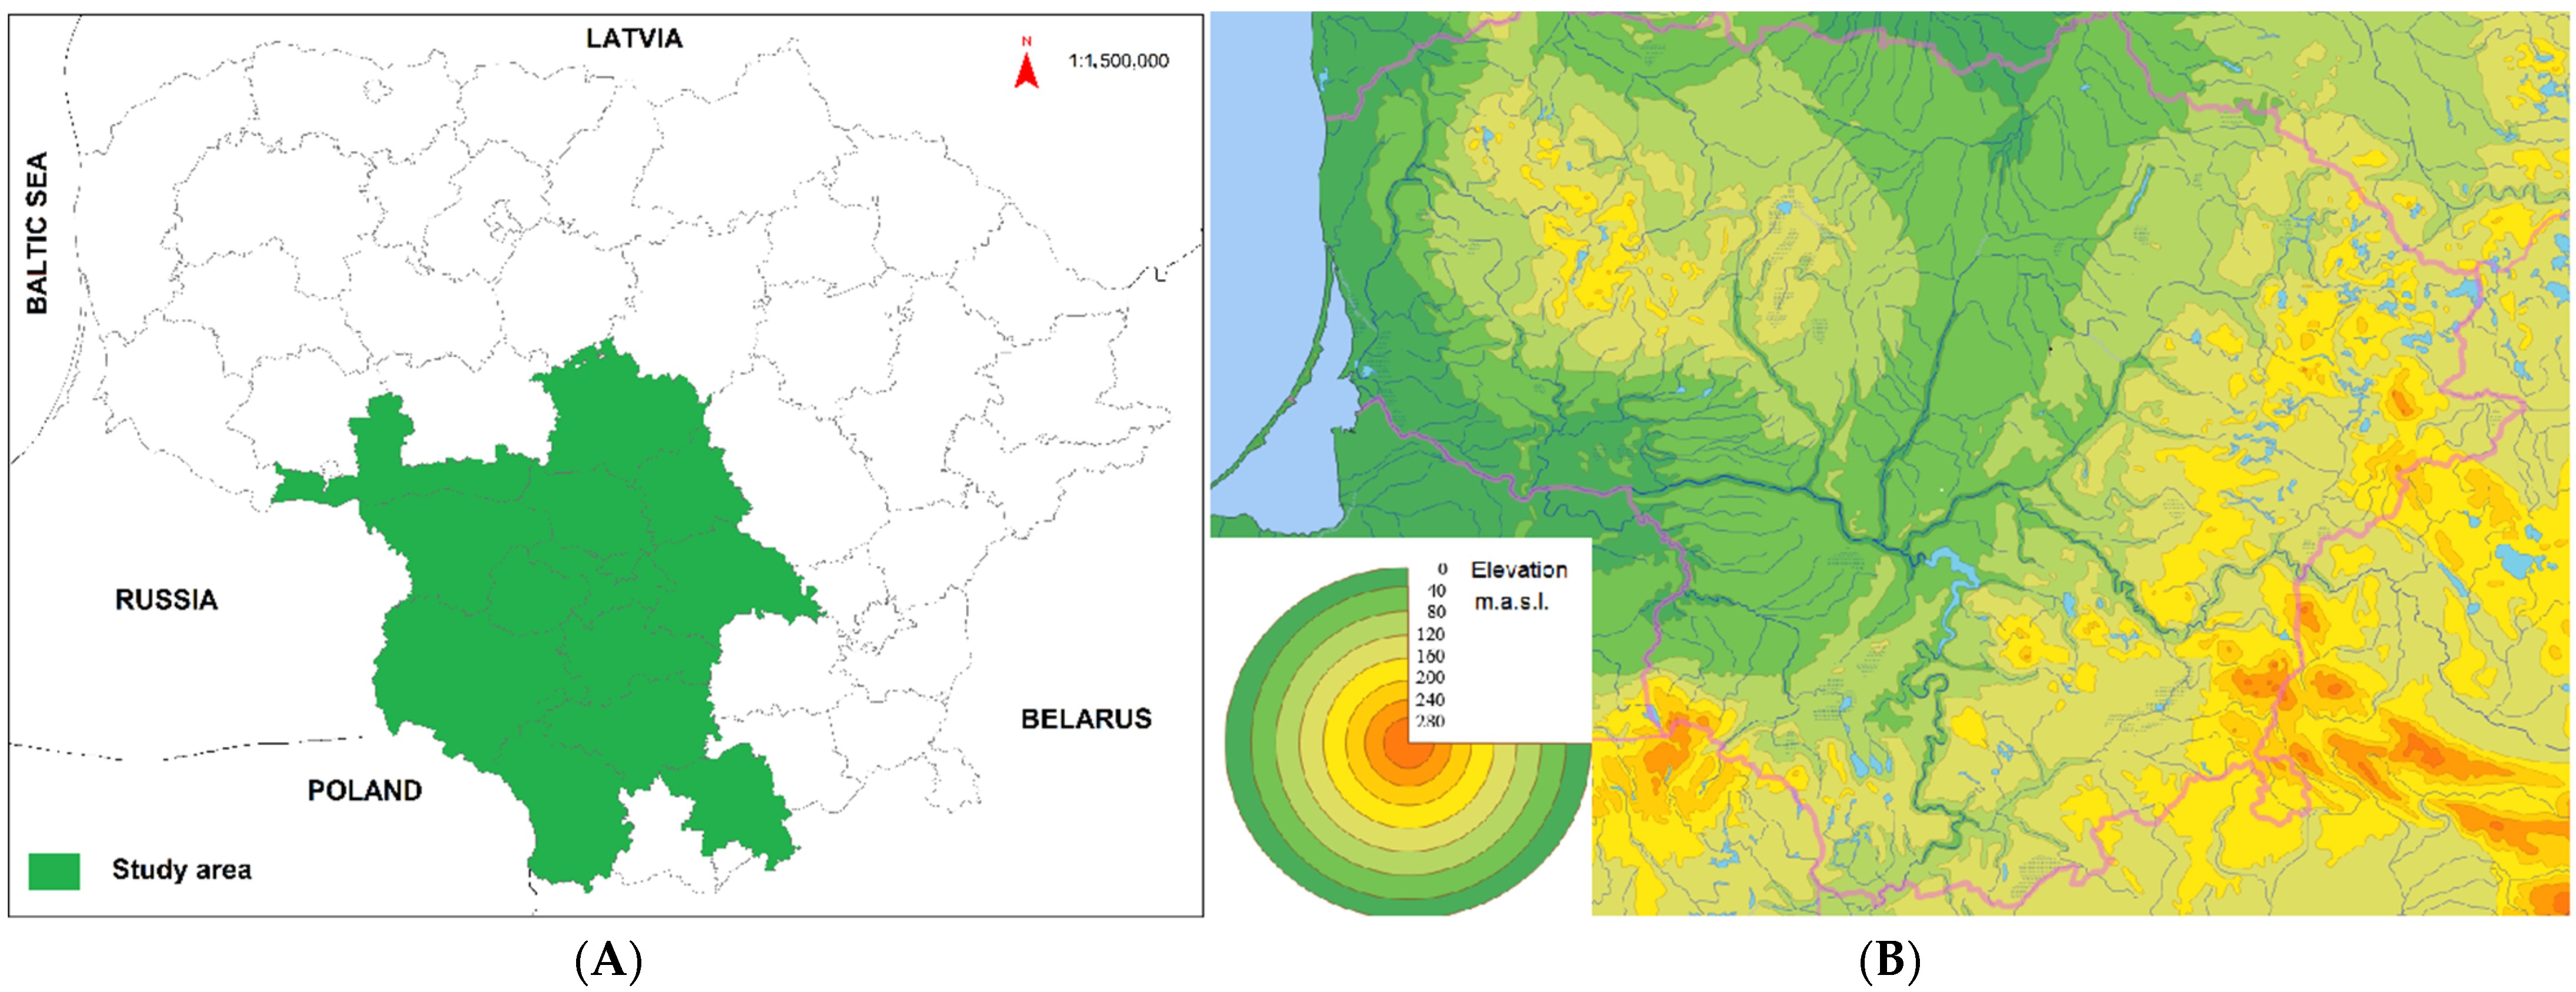
2.1. Study Sites

Lithuania, covering an area of 65,302 km2, is located at the shores of the Baltic Sea, between 53°54′–56°27′ N and 20°56′–26°51′ E. The country represents an alternation of moderate lowlands and highlands [39]. The study sites were selected in Central and Southern Lithuania, mainly on lowlands (up to 100 m a.s.l.), plains (100–150 m a.s.l.), and plateaus (150–200 m a.s.l.). Lithuanian territory lies in the northern part of the temperate climate zone and is assigned to the cool temperate moist climate region [40]. The mean air temperature was 6.9 °C, and the mean annual precipitation was 695 mm in 1981–2010 [39]. During the study period in May–September 2016, the air temperature exceeded the standard climatic normal by 1.2 °C, and rainfall was close to the standard climatic normal.
According to Ref. [41], 56% of the country is covered by medium sandy loam and/or silt loam (glacial moraine soils); 23% by fine silt loam and/or clay (glaciolacustrine soils); 18% by coarse sand and/or gravel (glaciofluvial soils); and 1% each by fine sand (aeolian soils), peat (organogenic soils), and other soils (marine/littoral, erosion, and karst). About 50% of Lithuania is suitable for agriculture [42], and 33.7% is covered by forests [43]. In croplands, the dominant crops are wheat (65.5%), barley (15.8%), mixed grains and triticale (9.6%), oats (5.0%), rye (3.1%), and corn (0.9%) [44]. The grasslands include naturalised or cultivated forages with indigenous or naturally occurring grasses and other herbaceous species and mainly represent highly fragmented but non-degraded, sustainably managed grasslands.
Lithuanian forests belong to the European hemiboreal forest zone with the prevalence of mixed deciduous and coniferous stands [45]. In 2019, coniferous stands prevailed in Lithuania, covering 55.6% of the forest stands area, followed by softwood (41.0%) and hardwood (3.3%) deciduous forests [43]. The dominant tree species are Scots pine (Pinus sylvestris L., 34.5%), Norway spruce (Picea abies (L.) Karst., 21.0%), and birch (Betula pendula Roth. and B. pubescens Ehrh., 22.0%).
The soil organic carbon (SOC) stocks in mineral Arenosols and Luvisols were evaluated in afforested agricultural land, grassland, and cropland. The paired sites of afforested land next to cropland or perennial grassland were selected in Central and Southern Lithuania, representing the territories of Dubrava, Kaunas, Kazlų Rūda, Jonava, Marijampolė, Alytus, Prienai, Varėna, Veisiejai, Ukmergė, Kėdainiai and Valkininkai regional divisions of State Forest Enterprise (Figure 1).
The selected sites represented afforested land established on former agricultural land (hereafter, afforested site) with typical tree species composition within the selected soil groups (according to the World Reference Base for Soil Resources by Refs. [46,47]).
In Lithuania, the Luvisols, among all other major soil groups, represent 29% of forest land, 53% of grassland and 51% of cropland, and the Arenosols represent 32%, 25% and 10%, respectively [48]. The distribution of the selected study sites reflected the cover of Luvisols and Arenosols within the country.

2.2. Soil Sampling and Analyses

In afforested land, the SOC stocks were analysed in the 1–10-, 11–20- and 21–30-year-old coniferous and deciduous forest stands, including the most common tree species in Lithuania (Table 1). The SOC was analysed in two soil groups—Arenosol and Luvisol, determined by morphogenetic diagnosis, according to the World Reference Base for Soil Resources [46,47].
The effect of the land-use change was investigated by applying the paired-site design, that is, by comparing SOC stocks in afforested sites (both planted and naturally regenerated forest) of former agricultural land with identical soil type but different land-use categories (the control—grassland or cropland/arable land) at the same moment in time.
Information from maps of former agricultural land was analysed to find the potential study plots: (1) the soil group was identified for each selected afforested site; and (2) the nearest adjacent cropland or grassland plot with identical soil characteristics was selected as a control. The soil was sampled from 254 plots, including 127 afforested sites. The soil was sampled from 67 afforested sites on Arenosols and 60 afforested sites on Luvisols. The control pairs were sampled from 62 sites on Arenosols (33 sites in cropland and 29 sites in grassland) and 65 sites on Luvisols (39 sites in cropland and 28 sites in grassland). The total number of grassland and cropland pairs was lower than the afforested sites because, in some cases, the same pair was used as a control for a few afforested sites. Shared control sites were used when afforested sites were less than 300–400 m apart from each other.
The control was selected in the adjacent cropland with different crops or the adjacent perennial grasslands with permanent meadows and pastures. The control plots were mainly selected 100–200 m from the afforested land. We assumed that all pairs of the selected sites had similar edaphic and climatic conditions; also, they had a similar land-use history before afforestation. The land-use history since 1990 was checked according to the agricultural land and crops declaration system used in Lithuania.
The study was performed in the selected temporary observation plots of 400 m2 in 2016. The study plots were allocated on each selected land-use category: afforested land and cropland or grassland, taken as a control. In each sample plot, the points for soil sampling were evenly allocated in two north-south transects with five sampling points in each transect: the distance between the two transects was 20 m, and the distance between the sample points was 5 m.
The SOC stocks were derived from field measurements in the forest floor (forest litter (OL) + fragmented litter (OF) + humified litter (OH)), and in the 0–30 cm (0–10 cm, 10–30 cm) mineral topsoil layers of Arenosols and Luvisols.
To determine the mass and SOC concentration, the forest floor and plant litter in perennial grassland were physically sampled within a 25 × 25 cm2 metallic frame. Sampling was done carefully to avoid contamination with mineral material. In the laboratory, forest floor samples were examined in detail, and herbaceous litter and remaining roots were removed. Composite samples were obtained for each plot from 5 subsamples (n = 5) of forest floor and plant litter of grassland, and the samples were oven-dried at 105 °C to a constant weight (ISO 10694:1995).
For the determination of bulk density (g cm−3) of fine (<2 mm) mineral soil, the composite samples of mineral topsoil (0–10 cm and 10–30 cm) were taken from five subsamples. In the field, an undisturbed flat horizontal surface in the middle of the required soil depth was prepared, and a metal cylinder (steel ring) was pressed into the soil to collect a sample. The cylinder was carefully removed, extracting an undisturbed sample of known volume. The soil was poured into the plastic bag and the bag was tightly closed, marking the date and location where the sample was taken. In the laboratory, the samples were passed through a 2-mm sieve to remove stones and gravel; and the fraction that did not pass through the sieve was weighed for the determination of coarse fragment content. The moist sample weight was recorded; and the samples were oven-dried at 105 °C to a constant weight and weighed again. The dry bulk density of soils was calculated from the mass and the volume of a soil sample (Bulk density (g cm−3) = Dry soil weight (g)/Soil volume (cm−3)) according to the Standard ISO 11272:1998.
The composite samples of mineral topsoil (0–10 cm and 10–30 cm) were sampled from 10 sub-samples to determine total SOC concentration. The SOC concentration was determined using a dry combustion method with a total carbon analyser Analytic Jena multi EA 4000 Germany, according to the Standard ISO 10694:1995. Only fine (<2 mm) mineral soil was used for SOC analysis.
All laboratory analyses were provided by Agrochemical Research Laboratory of Lithuanian Research Centre for Agriculture and Forestry.

2.3. Calculations and Statistical Analyses

The organic carbon stock values in nutrient-poor and nutrient-rich mineral soils were obtained as follows: (1) the values for the afforested land (forest stands on former agricultural land) were analysed in comparison to the values in cropland and grassland on Arenosol or Luvisol; (2) the values for the afforested land were grouped into deciduous or coniferous stands; these values were also analysed in comparison to the values in cropland and grassland on Arenosol or Luvisol; and (3) the values were given for the afforested land of the stands representing different stand age, that is, 1–10 years, 11–20 years, and 21–30 years of age compared to cropland or grassland on Arenosol or Luvisol.
The SOC stocks in forest floor and plant litter of perennial grassland were calculated by multiplying C concentrations with forest floor and plant litter mass. The SOC stocks in 0–30 cm mineral topsoil (0–10 cm and 10–30 cm) were calculated according to the following equation [49]:
S O C i = ρ i ( 1 δ i , 2 mm 100 ) d i C i × 10 1
where ρi is the bulk density of the <2 mm fraction in g cm−3, δi, 2 mm is the relative volume of the ≥2 mm fraction (%), di denotes the thickness of layer i in cm, Ci denotes the C concentration of layer i (mg g−1), and 10−1 is a unit factor (10−9 mg Mg−1 × 108 cm2 ha−1).
The SOC stock in the 0–30 cm mineral topsoil layer was calculated by summing the SOC stocks calculated for the individual 0–10 cm and 10–30 cm layers. Relationships between forest floor SOC stocks and stand age over 30 years were explored by simple linear regression, which was used to calculate the annual changes in forest floor SOC stocks. The data were analysed for differences in SOC stocks between the different land-use categories (afforested land, cropland, grassland) using one-way ANOVA followed by post hoc tests. All statistical analyses were carried out using the Statistica 12.0 software-package (Statsoft Inc. Tulsa, OH, USA) software, and the level of significance of p < 0.05 was used in all cases. Data are presented as means ± standard error (SE).

3. Results

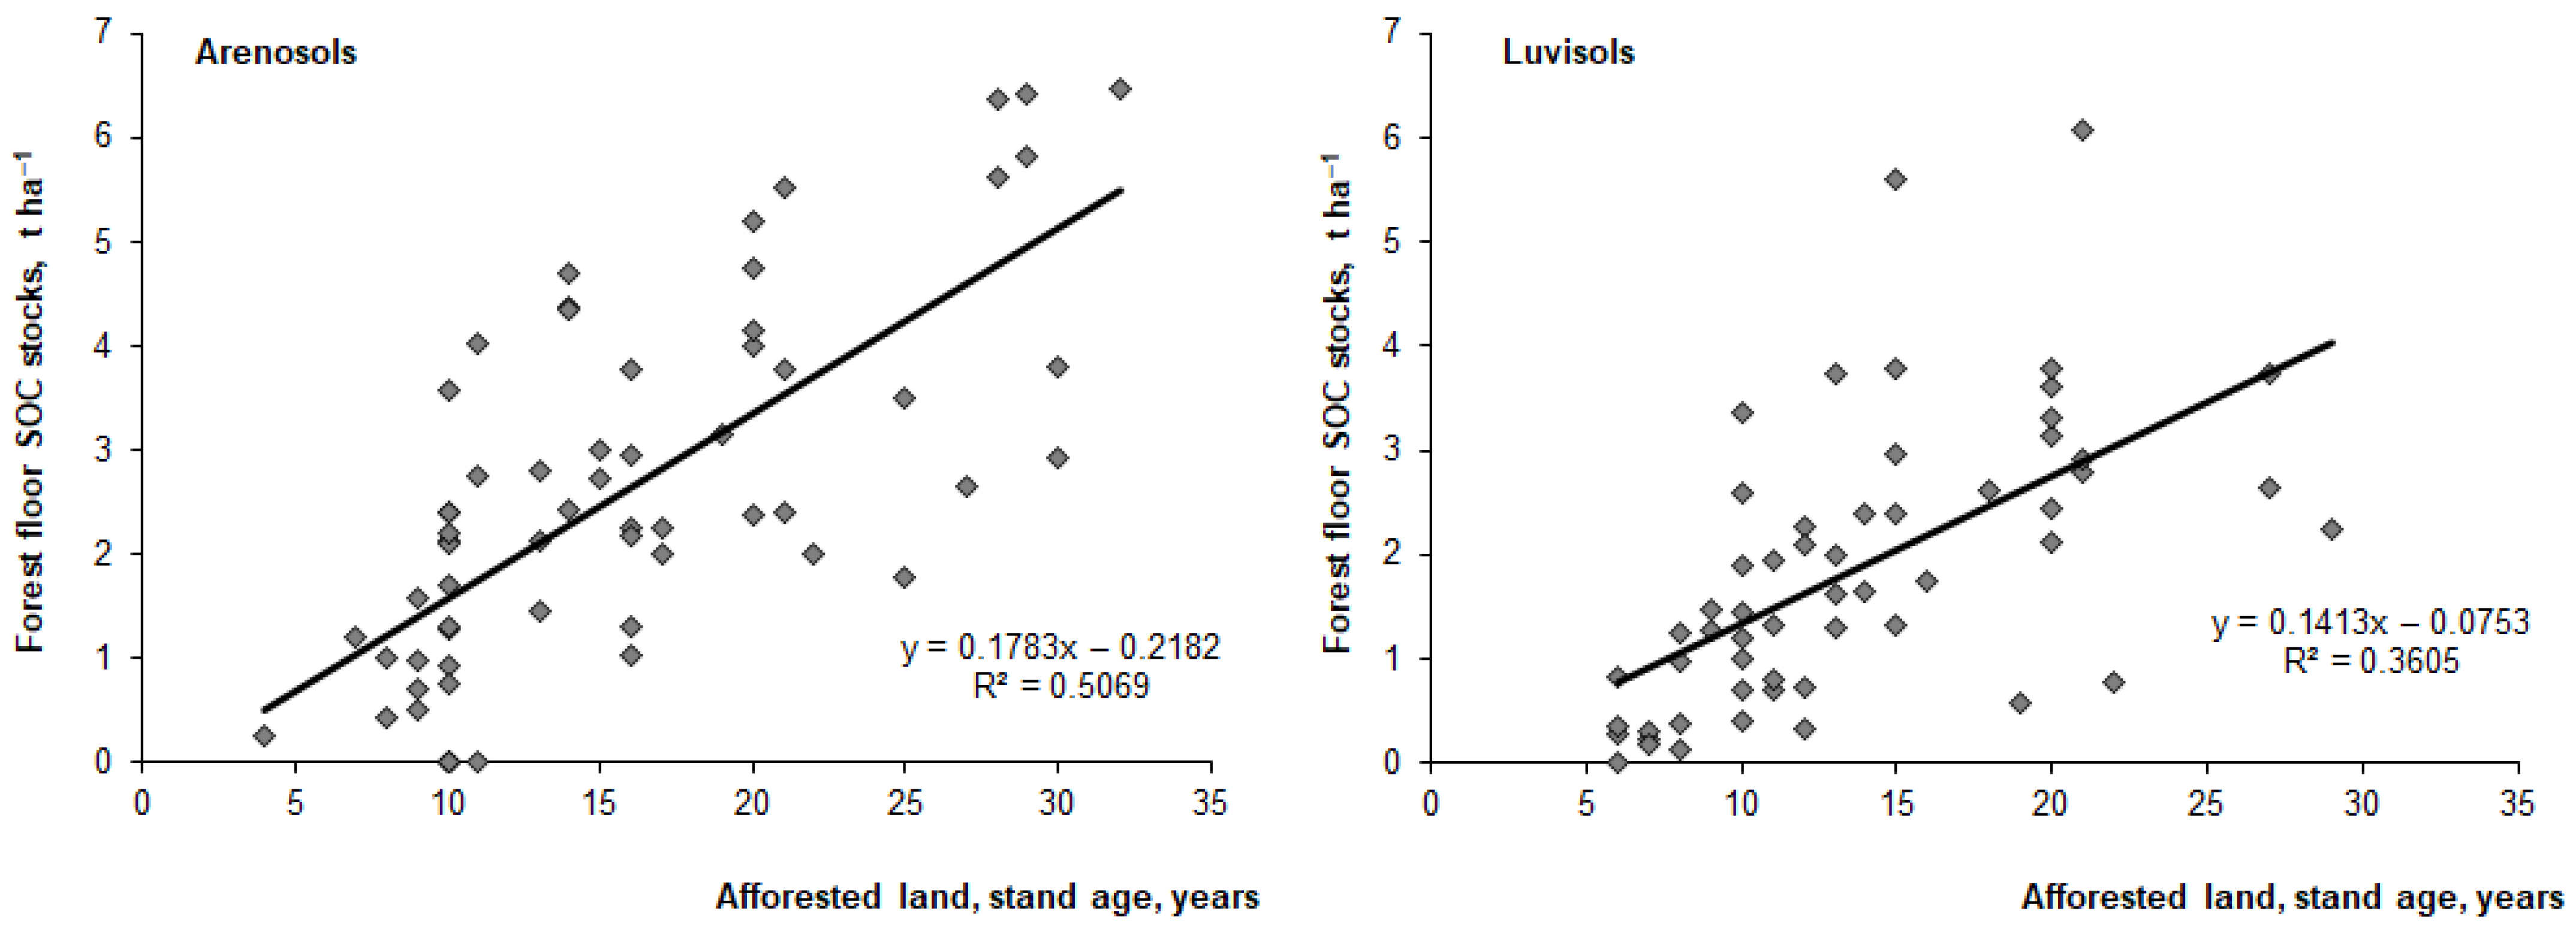
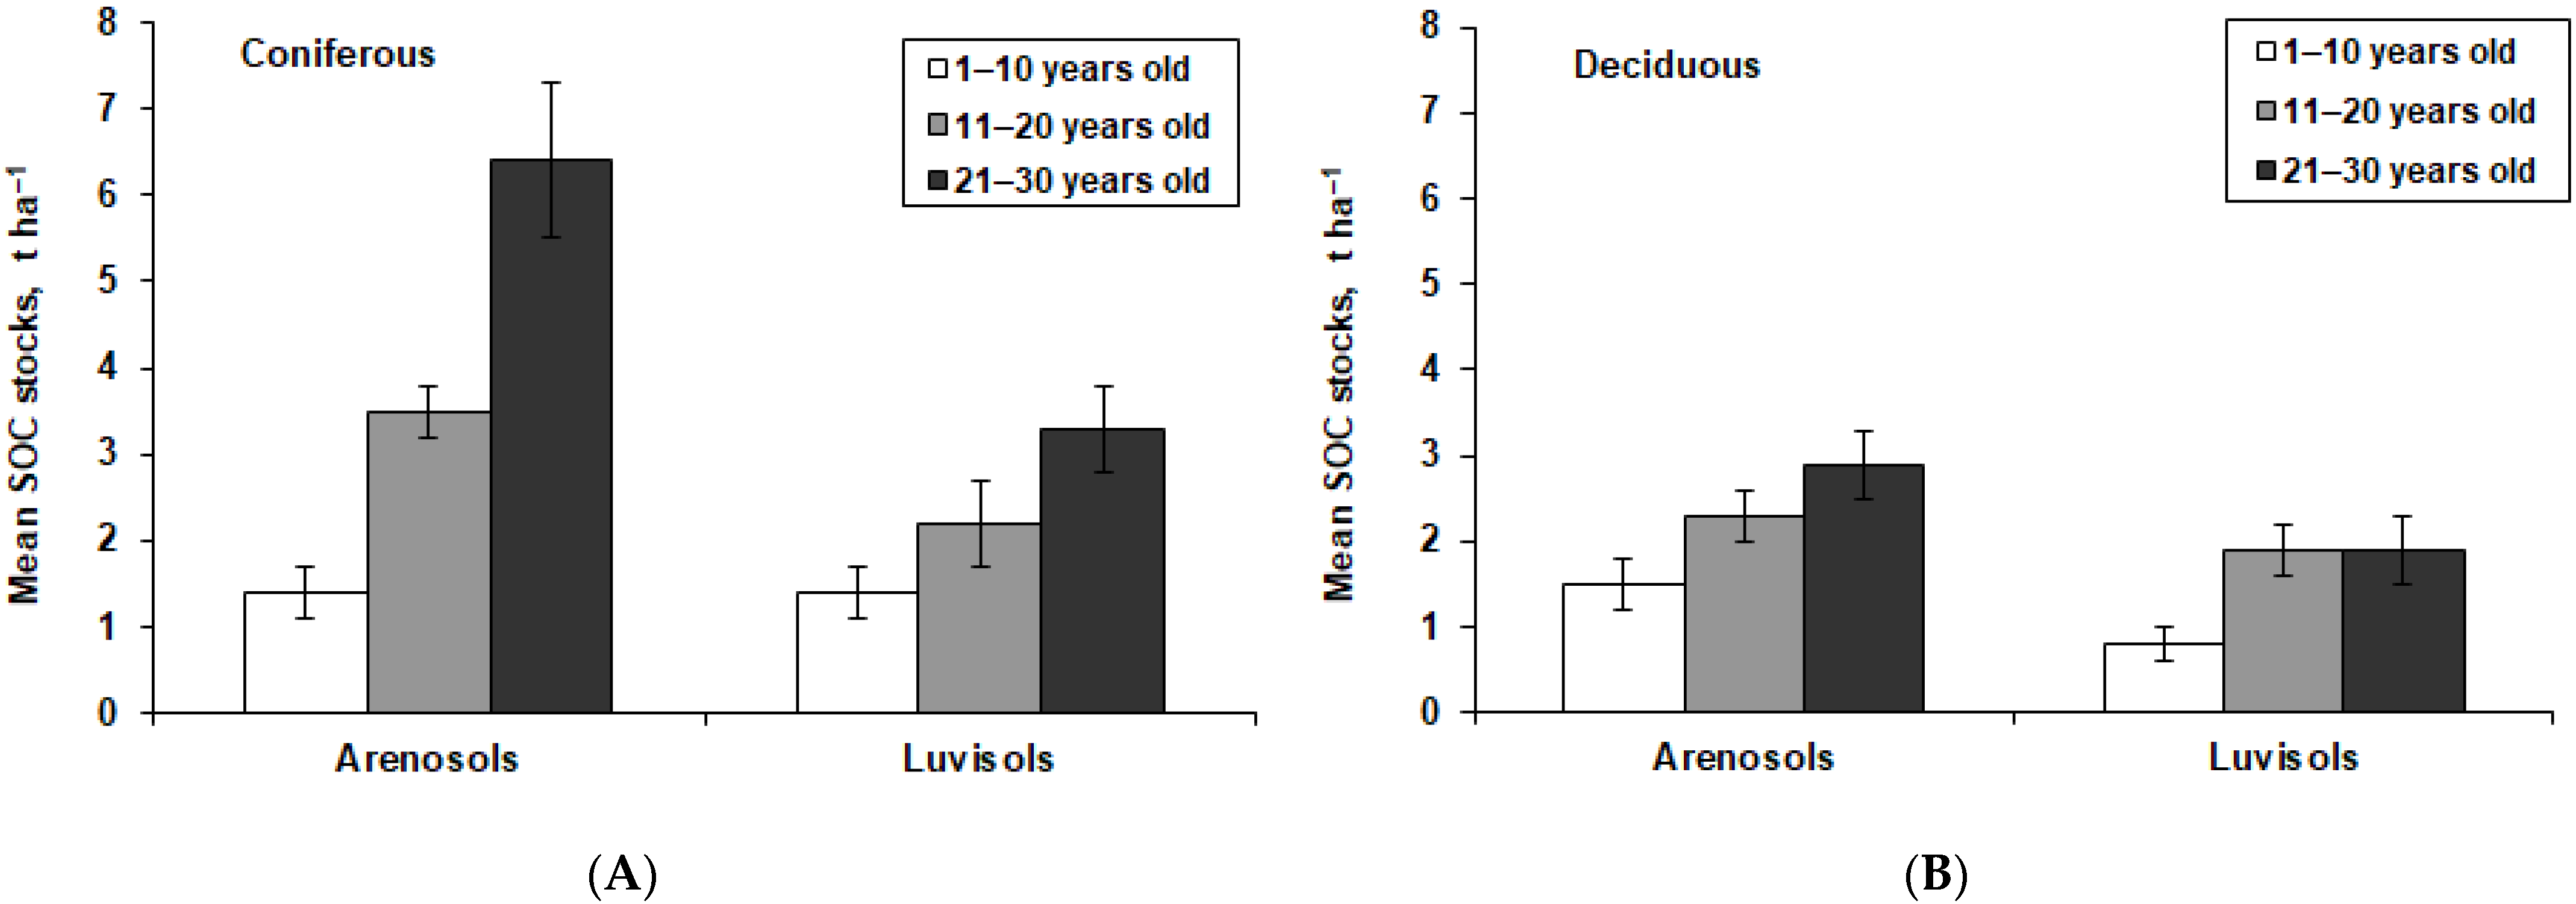
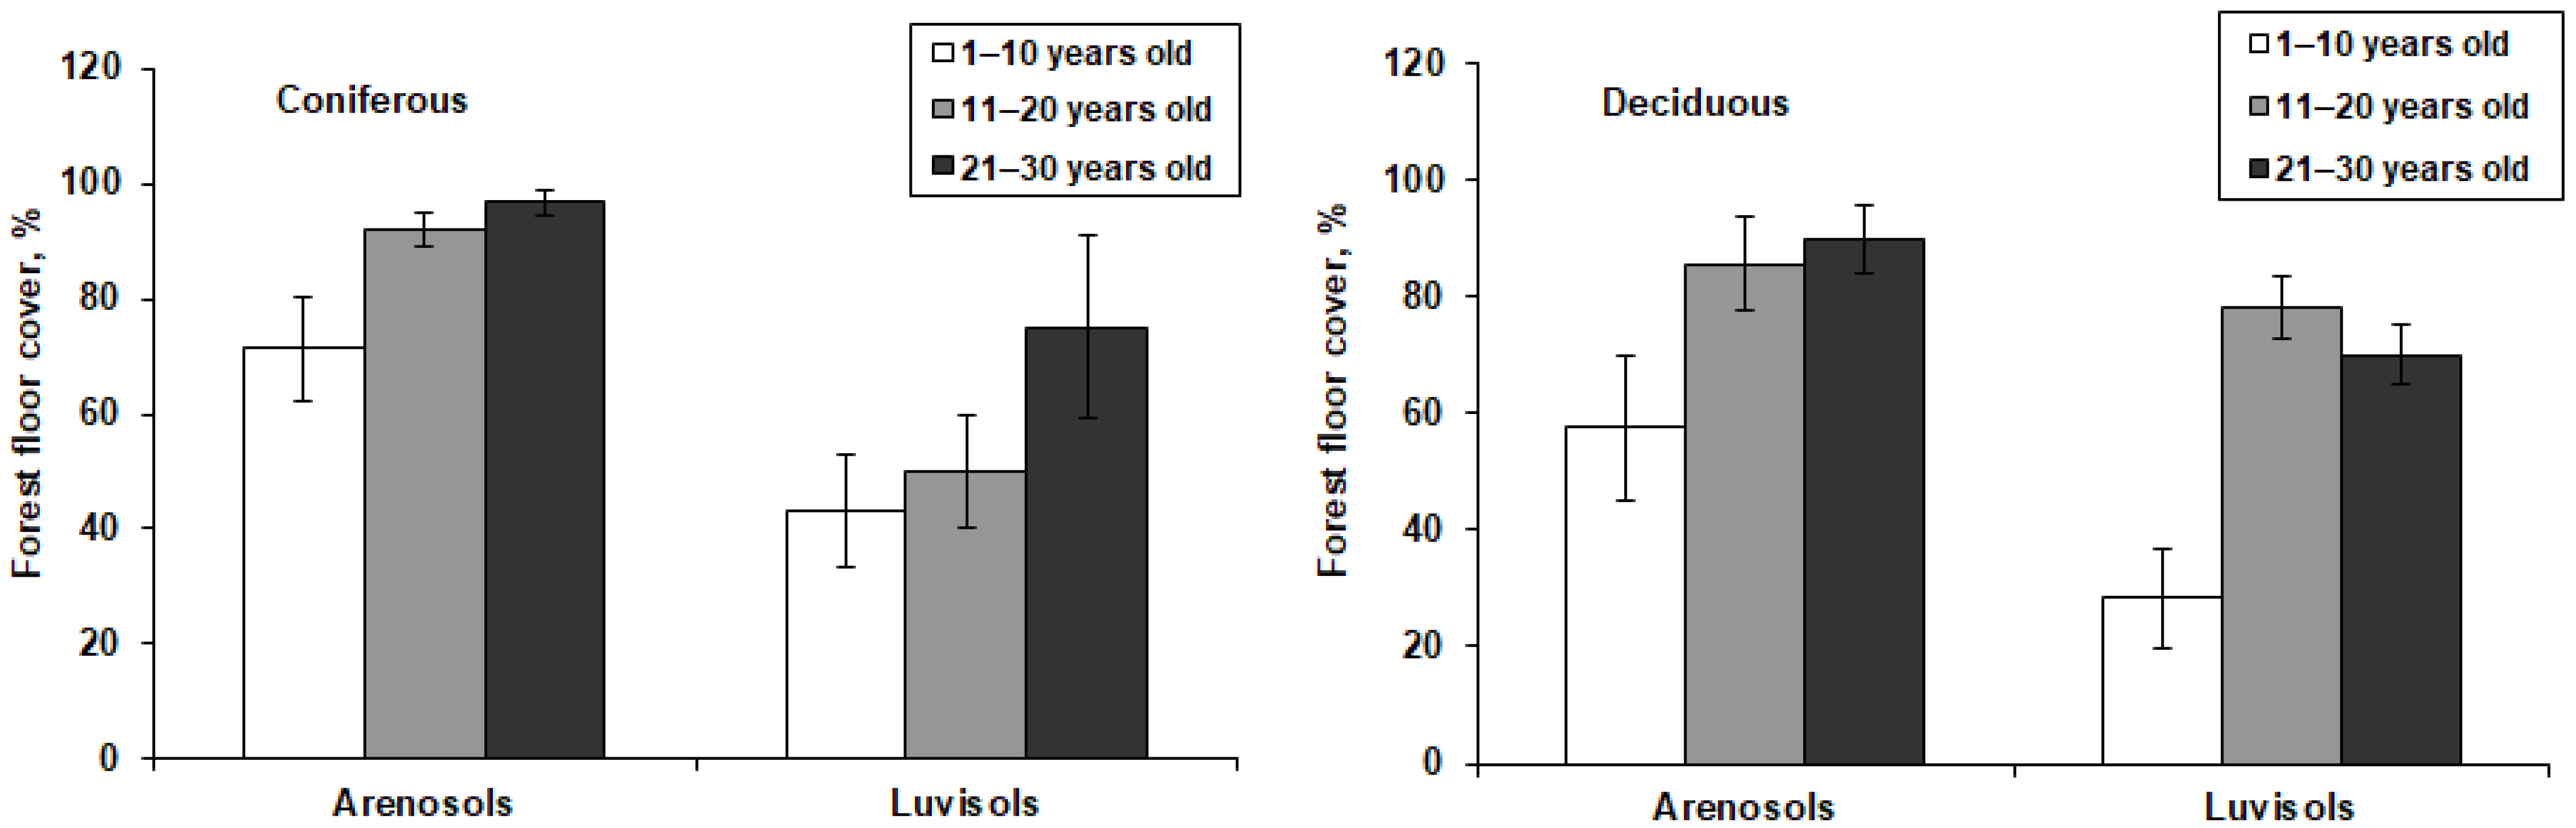
3.1. Organic Carbon Stocks in the Forest Floor of Afforested Land and Plant Litter of Grassland

For afforested land and grassland, the mean SOC concentration in the forest floor and plant litter varied within a relatively narrow range of 332–392 g kg−1 for Arenosols and 332–350 g kg−1 for Luvisols (Table 2). In the Arenosols and Luvisols afforested with deciduous species, the mean SOC concentration in the forest floor showed an increasing trend with the increase of the stand age.
Mean SOC stock in the forest floor of Arenosols and Luvisols increased following stand age in afforested land (Figure 2). For Arenosols, the obtained R2 equals 0.507 (p < 0.001), and it means that 50.7% of the variability of SOC stock values in forest floor is explained by stand age in afforested land. For Luvisols, the R2 equals 0.361 (p < 0.001), explaining 36% of the variability. Therefore, it could be assumed that the relationship between SOC stocks in forest floor and stand age is relatively strong.
The highest mean mass, percentage cover and SOC stocks of forest floor (OL + OF + OH) was accounted for afforested Arenosols and Luvisols representing the 21–30-year-old stands (Table 2; Figure 3). The mean mass and SOC stocks of forest floor almost doubled during each decade after afforestation. The mean mass of forest floor was 1.6–1.7 times higher in the 1–30-year-old deciduous stands than in the coniferous stands (Table 2). Arenosols were attributed to higher mean mass and SOC stocks of forest floor than Luvisols. The mean mass of forest floor in both afforested Arenosols and Luvisols (1–30 years old, coniferous, and deciduous) was significantly higher than litter mass of perennial grassland that developed due to sod formation. The mean plant litter mass of cropland was assumed to be zero.
Mean SOC stock in the forest floor of Arenosols and Luvisols increased following stand age in afforested land (Figure 3). The increase of SOC stock values in forest floors with stand age for coniferous stands was more intensive than for deciduous. The difference between SOC stocks in the forest floor of infertile Arenosols and fertile Luvisols soils gradually increased every decade after afforestation with coniferous species. The SOC stocks in the forest floor differed 1.8 and 2.5 times between two soil groups in 11–20-year-old and 21–30-year-old coniferous stands, respectively. For deciduous stands, the slight increase in SOC stocks in the forest floor was obtained only for Arenosols during the first 30 years after afforestation. Following the linear forest floor SOC accumulation over the 30 years, the mean annual accumulation rate was on average 0.18 t C ha−1 y−1 for afforested Arenosols and 0.14 t C ha−1 y−1 for afforested Luvisols.

3.2. Bulk Density and Organic Carbon Concentrations in Mineral Topsoil

Mean bulk density of fine (<2 mm) soil in the mineral 0–10 cm and 10–30 cm mineral topsoil layers was on average 0.1 g cm−3 higher in afforested Luvisols than in afforested Arenosols (Table 3). A higher variation of mean bulk density values between different land-use categories was obtained in the 0–10 cm mineral topsoil layer than in the 10–30 cm layer for both Arenosols and Luvisols. The decreasing trend in mean bulk density due to forest stand age was found in Luvisols with the lower values in the 21–30–year-old stands in the afforested land. However, no clear trend for bulk density changes due to stand age was obtained in afforested Arenosols. The older forest stand had a higher impact on the bulk density; that is, the differences between the values in afforested land and cropland increased with forest stand age. However, the bulk density did not significantly differ between afforested land and grassland.
An increase in SOC concentration was observed in older stands compared to the control at both soil layers, with a higher difference for the 0–10 cm mineral topsoil layer (Table 4). The SOC concentration increased by 6.0 g kg−1 and 3.4 g kg−1 in the 0–10 cm and 10–30 cm layers, respectively, in afforested Luvisols 21–30 years after afforestation compared to the control sites. This difference was much smaller in afforested nutrient-poor Arenosols than Luvisols. Meanwhile, no increase in SOC concentration was observed in 1–10-year-old stands.
The different changes in SOC concentration between the sites afforested with coniferous and deciduous species and the control sites of cropland or grassland were obtained (Table 4). Compared with the croplands, the SOC concentration increased 1.3 times in both 0–10 cm and 10–30 cm mineral topsoil layers of Arenosols 11–20-years after afforestation with deciduous species. In older stands, this difference was 1.4 and 1.7 times for the 0–10 cm and 10–30 cm topsoil layers, respectively.
For Luvisols afforested with coniferous species, 1.5, 1.7 and 2.2 times higher SOC concentration in 0–10 cm mineral topsoil layer was found after the first, the second and the third decades, respectively, after afforestation. No clear trends for deeper soil layers or deciduous sites were observed.

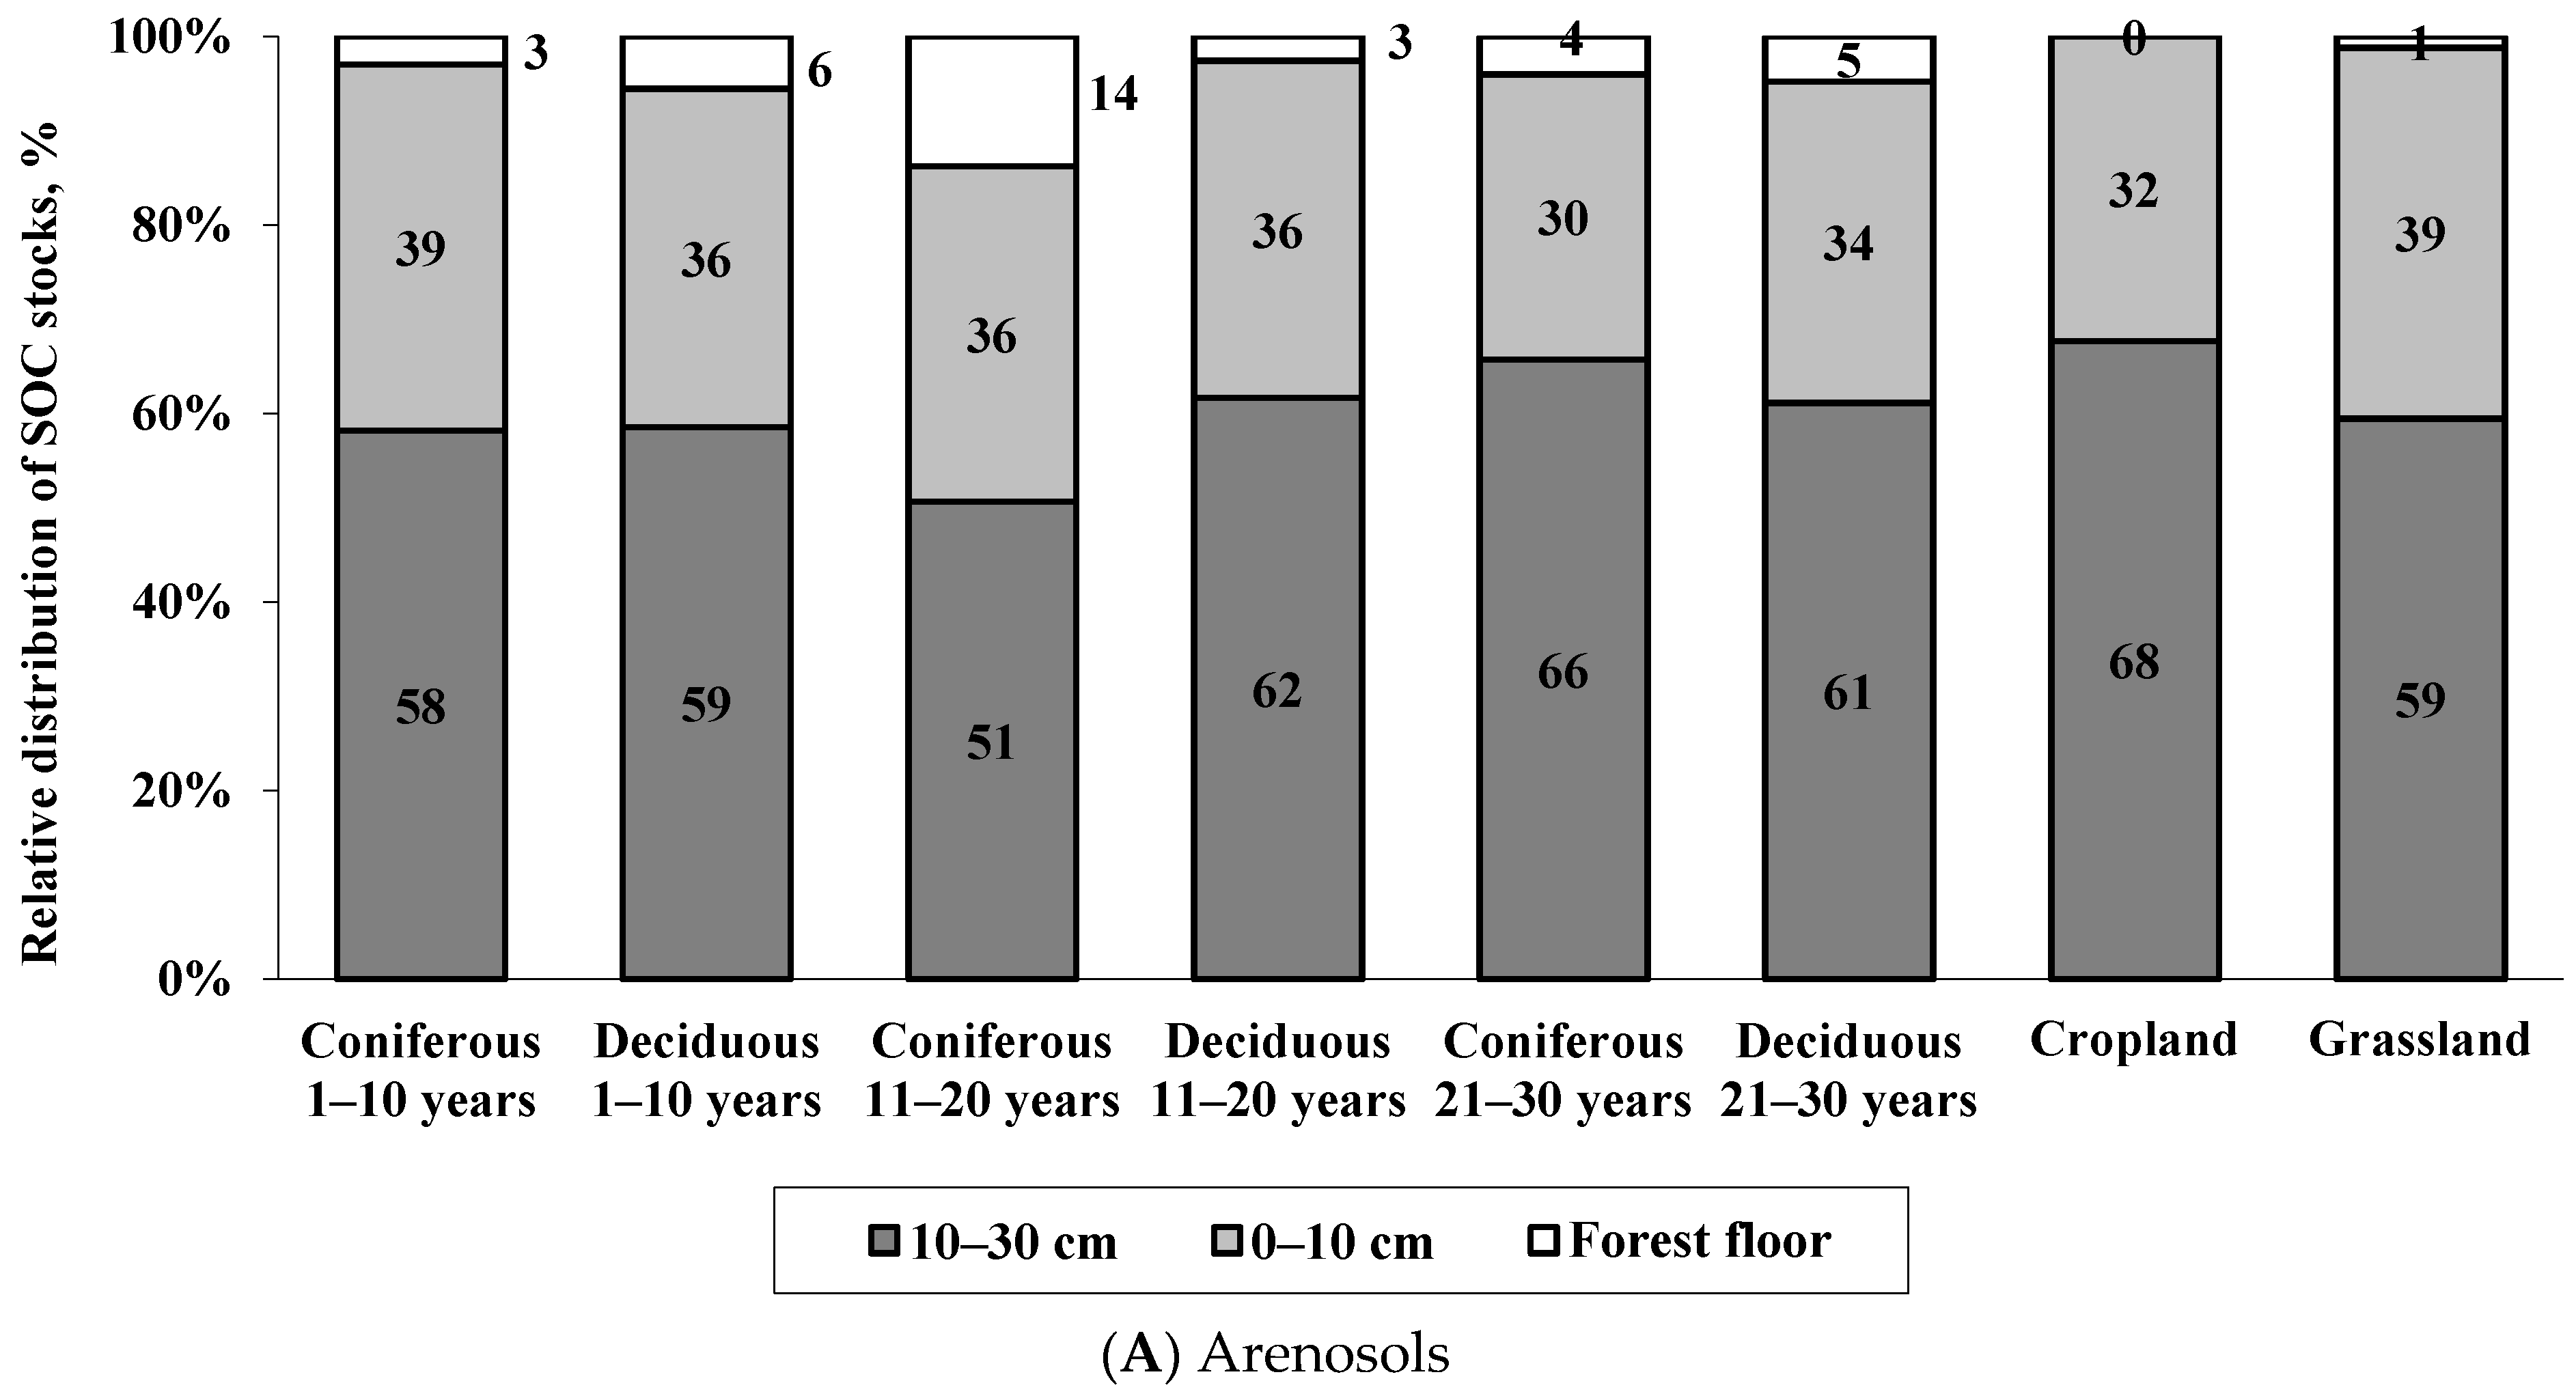
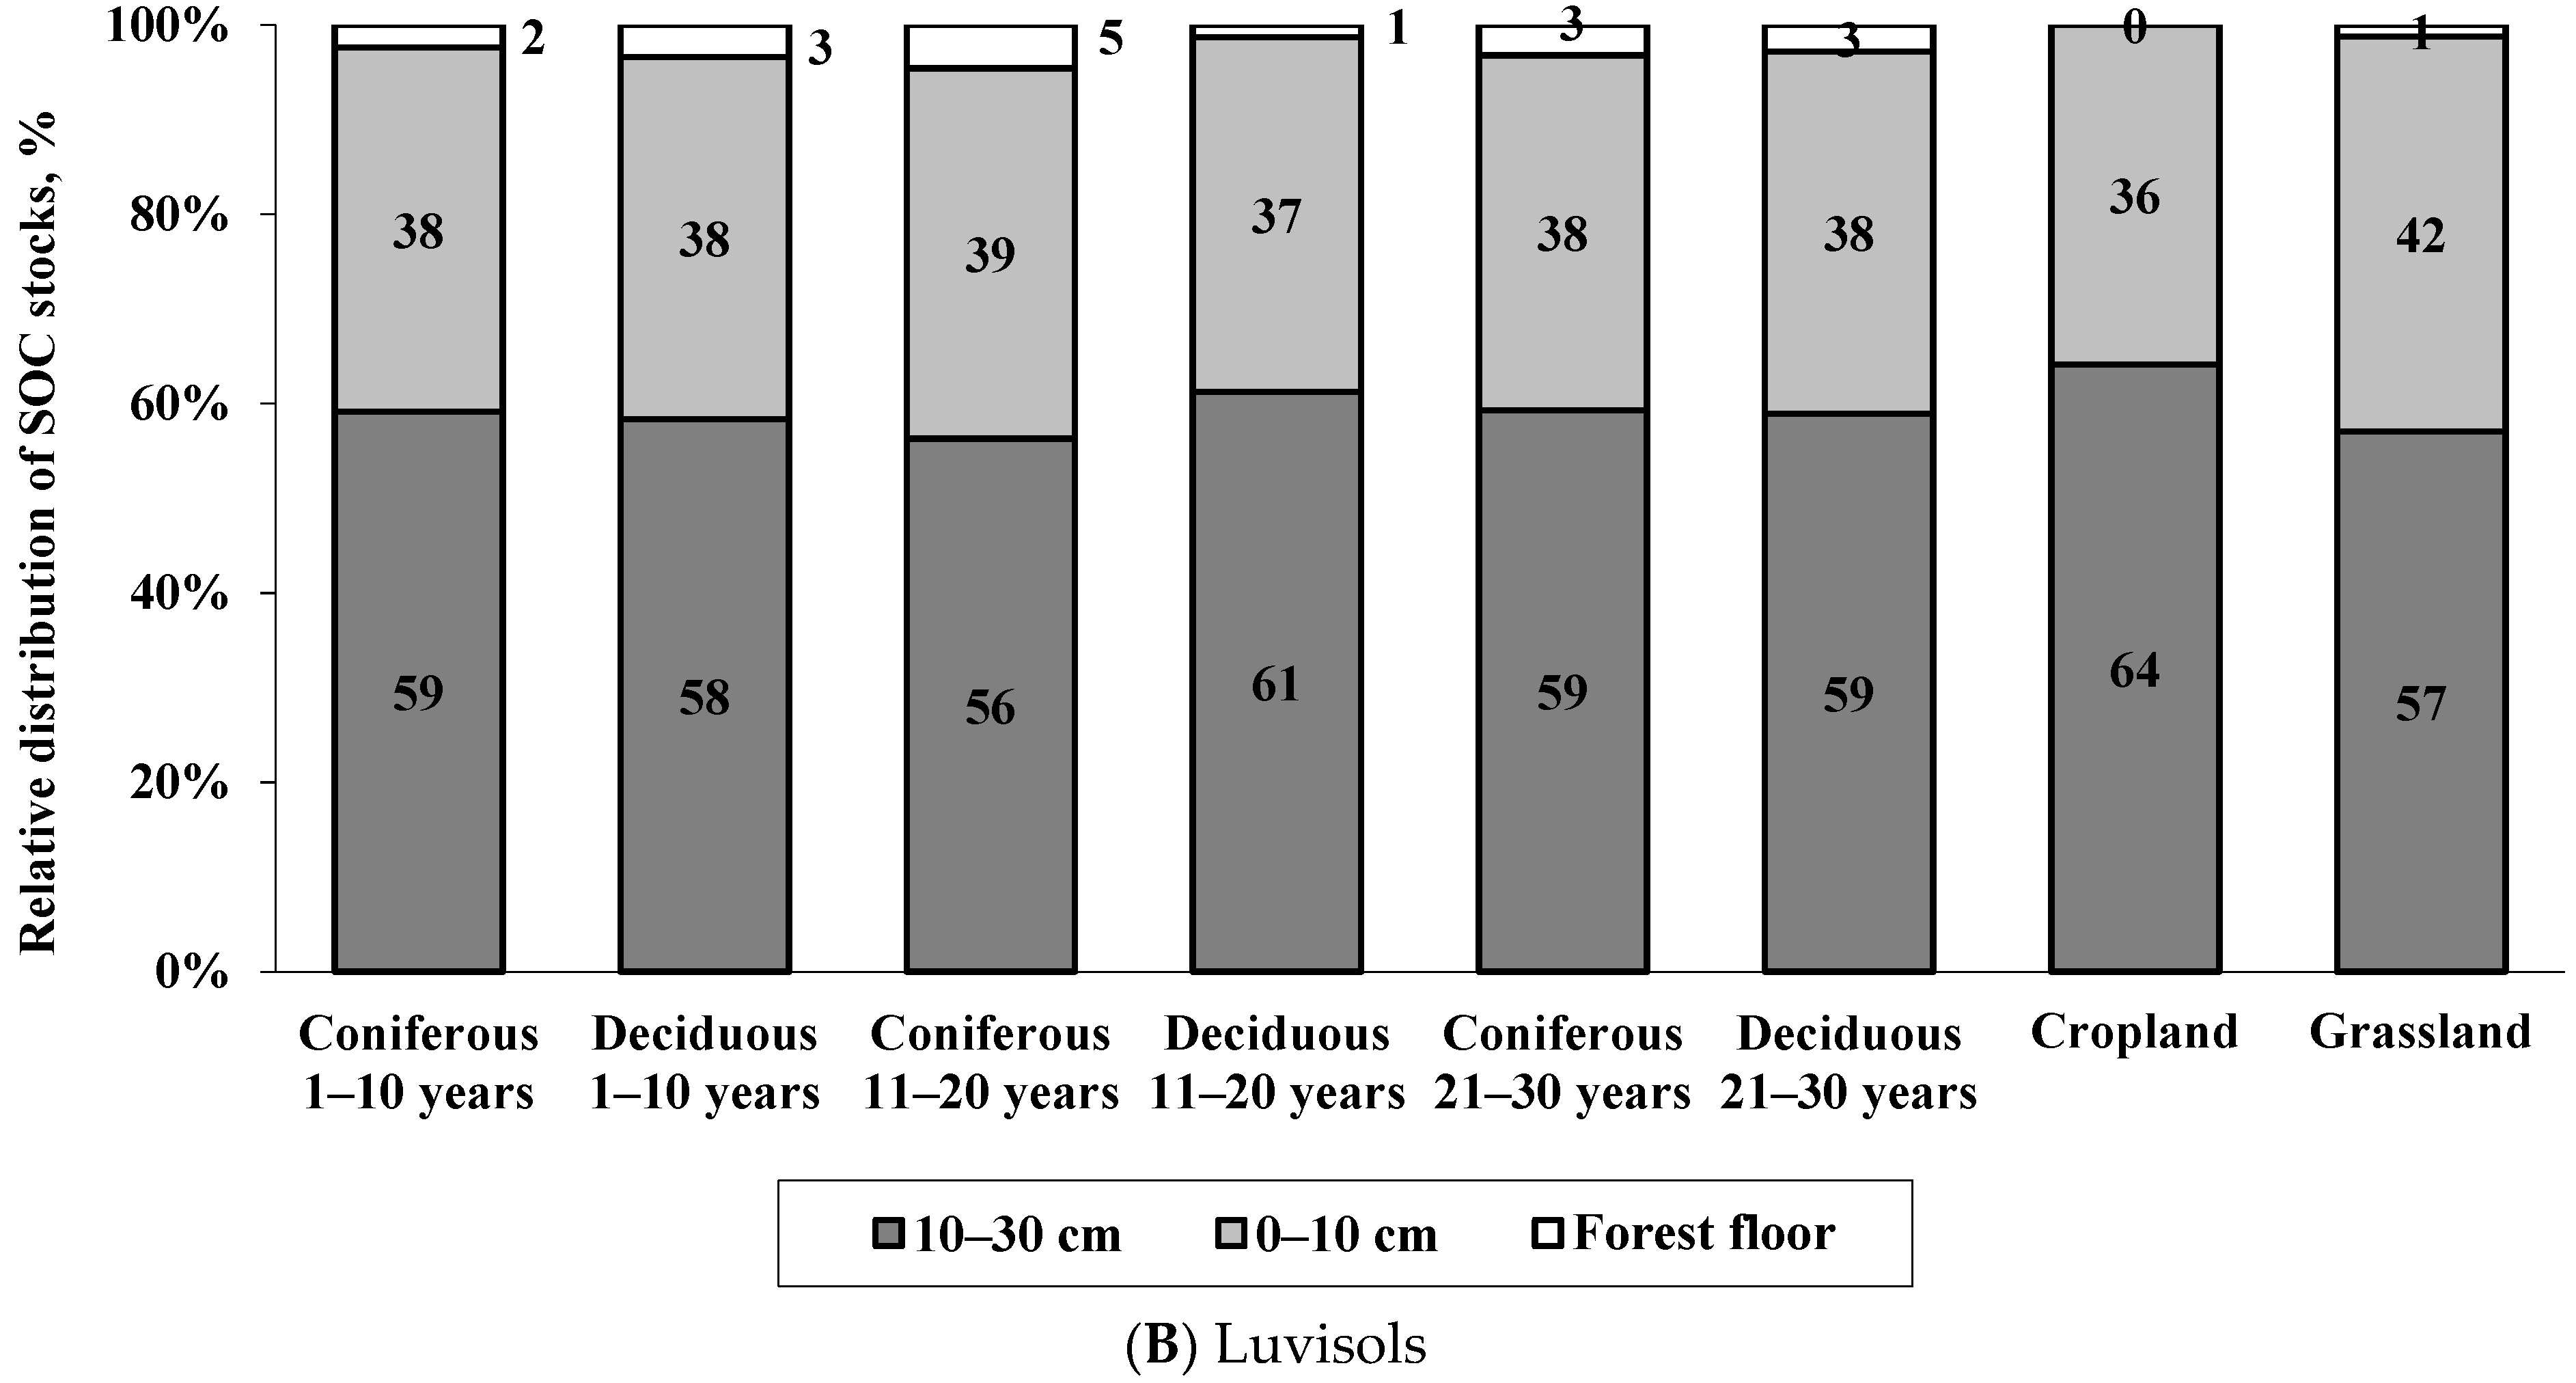
3.3. Soil Organic Carbon Stocks in Mineral Topsoil

The mean SOC stocks in the 0–30 cm mineral topsoil layer of afforested land were comparable to the mean SOC values in similar soil groups of cropland and perennial grasslands over the first three decades after afforestation (Table 5). During the 30 years since afforestation, the SOC stock in afforested Arenosols was 13–14% lower than in croplands and grasslands. In afforested Luvisols, the SOC stock was 10% higher than in croplands but remained 17% lower than in grasslands. Despite the mean SOC stocks slightly increasing with the forest stand age in Luvisols, the highest mean SOC stock was detected in the grasslands.
Relative distributions of mean SOC stocks in forest floor or grassland litter and mineral topsoil layers in afforested land, cropland and grassland were obtained for coniferous and deciduous stands in Arenosols and Luvisols (Figure 4). In nutrient-poor Arenosols, the SOC stocks in the forest floor have accumulated more rapidly with increasing stand age than in Luvisols. For Arenosols afforested with coniferous species, the SOC stock in forest floor represented 3%, 6% and 14% of the total SOC stock up to 30 cm depth in the 1–10-year-old, 11–20-year-old, and 21–30-year-old afforested sites, respectively. For Arenosols afforested with deciduous species, the SOC stock in forest floor comprised 3%, 3% and 5% of the total SOC stock in representative afforested sites. A low proportion of SOC in the forest floor was obtained in Luvisols afforested with both coniferous (2 to 5%) and deciduous (1 to 3%) species. For both studied soils, a relatively lower proportion of SOC accumulated in the 0–10 cm mineral topsoil layer than in the 10–30 topsoil layer following afforestation. The 0–10 cm topsoil layer of grassland represented a higher proportion of SOC than the 10–30 cm topsoil layer in cropland.

4. Discussion

4.1. Organic Carbon Stocks in the Forest Floor

The vegetation changes from annual to perennial, first initiating intensified accumulation of biomass carbon (C), subsequently result in the accumulation of soil C until a new equilibrium of soil C is reached according to the input and decomposition levels in afforested land. Afforestation is generally associated with positive effects on the C balance in the ecosystem, particularly if former agricultural land with low soil organic matter (SOM) content is afforested. For this balance, the SOC accumulation, C input and losses, and the affecting factors, including land-use change, should be assessed [19,20,32]. However, the C sequestration and dynamics due to afforestation could vary greatly due to specific climatic and environmental conditions, including tree species composition, vegetation productivity, soil type, former land use, and management [32,50]. Therefore, our study aimed to evaluate SOC stocks in the afforested land with deciduous and coniferous tree species, growing on nutrient-poor Arenosols and nutrient-rich Luvisols; cropland and grassland SOC values next to afforested land were compared by applying the paired-site design.
A forest floor is formed when abandoned agricultural land is afforested, and a forest stand is established [51,52,53]. It begins to accumulate 8 years after afforestation [1]. Our results also showed very low forest floor mass in the first years after afforestation. The litter layer, representing low mass and SOC stock as estimated in perennial grassland, was assumed as a reasonable layer of this land use. However, the current study found significantly higher forest floor mass than grassland litter, even in the first decade after afforestation.
The current study found that the mean annual accumulation rate for the forest floor was on average 0.18 t C ha−1 yr−1 for afforested Arenosols and 0.14 t C ha−1 y−1 for afforested Luvisols. The present results were comparable with the SOC accumulation rate obtained for both boreal and temperate climate zones, as the previously obtained values varied across a wide range. For example, 30 years after afforestation, a C accumulation in the forest floor of 0.08 t C ha−1 y−1 was found for common oak stands and 0.36 t C ha−1 y−1 for Norway spruce in Denmark [1]. A lower linear C accumulation rate in the forest floor of 0.08 t C ha−1 y−1 was obtained 50 years after afforestation with Norway spruce in the mid-boreal region [28]. For longer-term forest succession, forest floor C accumulation varied from 0.24 ha−1 y−1 to 0.38 t C ha−1 y−1 [52,54,55].
The SOC stocks in forest floor and mineral soil were related to tree species [1,56]. For example, higher SOC stocks are found in the forest floor of coniferous than deciduous species [57]. Coniferous tree species cause higher SOC stocks in the forest floor, but no clear relationships were revealed in mineral soils [31]. Ref. [20] indicated that the SOC stocks did not change when grassland was afforested with deciduous trees but decreased following afforestation with pine forest. Higher SOC stocks were found in pure Norway spruce stands than in mixed spruce-broadleaf stands [58].
The current study found almost twice as much forest floor mass for coniferous than for deciduous species 2–3 decades after afforestation. This finding was also reported by Ref. [50]. That study revealed that forest floor development was the main positive result following afforestation with coniferous species. Other studies also revealed the significant influence of tree species on the forest floor, while the SOC stocks in mineral soils responded insignificantly [59]. Ref. [2] demonstrated more intensive C sequestration, followed by increased SOC stocks, in the forest floor under spruce than oak. A study of seven tree species growing in soils of different fertility showed that the SOC stocks in forest floor were higher in lodgepole pine (Pinus contorta Dougl.) and spruce (Picea abies (L.) Karst., and Picea sitchensis (Bong.) Carr.) stands than in the stands of beech (Fagus sylvatica L.) and oak (Quercus robur L.) [60]. However, Ref. [11] presented SOC stocks in the stands of different tree species composition as follows: 62 t ha−1 in a Scots pine stand, 140 t ha−1 in Norway spruce stands, 147 t ha−1 in beech stands, and 102 t ha−1 in oak stands. The slower decomposition of pine litter explained these inequalities in SOC values. Many studies revealed that afforestation with pine reduced SOC stocks, but they increased after afforestation with deciduous trees [20,32,61].

4.2. Bulk Density and SOC Concentration in Mineral Topsoil

The current study found a slightly higher mean bulk density of fine (<2 mm) soil in the 0–30 cm mineral topsoil layer of nutrient-rich Luvisol than in Arenosol. Also, higher variations of mean bulk density values were observed in the 0–10 cm mineral topsoil layer. In afforested Luvisol, the mean bulk density was the lowest in the 21–30-year-old stands. The mean bulk density of croplands was higher than that of other land uses, which caused relatively high SOC stocks. In contrast to croplands, a clear decreasing trend in mean bulk density due to forest stand age was found in Luvisols and Arenosols, with the lowest values in the 21–30-year-old stands in the afforested land. The afforestation and stand age tend to decrease the soil bulk density and increase soil porosity [62,63]. The current study found that the mean bulk density after afforestation with coniferous species was similar to deciduous during the entire 30-year period. These results were consistent with the previous studies, which found no significant difference between coniferous and broadleaved stands for mineral soil horizons [56].
We found higher SOC concentrations in older afforested sites than in younger sites in the 0–30 cm mineral topsoil layer. It was especially evident for nutrient-rich Luvisols afforested with coniferous species. There are some similarities with previous studies; for example, the higher SOC sequestration in mineral soil was observed after the afforestation with deciduous tree species in the study by Ref. [50]. Also, in afforested land, the SOC stocks are transferred to deeper soil profile layers, from the forest floor to mineral soil, with increasing stand age [6,64]. The study by Ref. [1] showed that C input from tree biomass is relatively low after the afforestation of former agricultural land, and C input increases only after tree crown closure and when the tree root system is formed. The SOC concentration and stock increased in the 0–5 cm mineral topsoil but decreased in the 5–15 and 15–25 cm soil layers with increasing tree age [1].
Another important finding of the current study was that we found higher mean SOC concentration in nutrient-rich Luvisols than in nutrient-poor Arenosols. The SOC stocks in afforested Luvisols with 21–30-year-old forest stand and those in the control sites—cropland and grassland—differed more than in afforested Arenosols. Previous studies have drawn quite different conclusions on how SOC sequestration in mineral soils depends on the soil group. Nutrient-poor sandy soils responded with more intensive forest floor and total C sequestration following afforestation than nutrient-rich soils [2]. In infertile soils, spruce admixture increased soil SOC stocks more than in fertile soils [4]. In some cases, fertile and clay soils can store more SOC because the more intensive formation of organic-mineral complexes protects SOM from decomposition [65,66]. In other cases, it was indicated that infertile mineral soils store more carbon due to slower decomposition and the formation of specific complexes of organic molecules and metal ions [2]. In pure spruce and mixed spruce-broadleaf tree stands growing on infertile soils, SOC accumulation was positively correlated with aluminium, indicating slower SOM mineralisation in acidic soils [58].

4.3. SOC Stocks in Mineral Topsoil after Afforestation

Overall, we found no significant differences between SOC stocks in the afforested sites 30 years after afforestation and the values in cropland and grassland. During the 30 years since afforestation, the SOC stock in afforested Arenosols was 13–14% lower than in croplands and grasslands. In afforested Luvisols, the SOC stock was 10% higher than in croplands but remained 17% lower than in grasslands. We compared the obtained SOC stocks of afforested land with the national SOC values of similar soil groups [48] and found similar SOC values for forest Arenosols but lower for Luvisols (see Table 5). The previous study by Ref. [32] indicated that SOC stocks in 0–30 cm soil layer decreased following afforestation and finally recovered to the pre-afforestation level when the forest stand reached the age of 30 years. Following afforestation, SOC accumulates only in the forest floor and decreases in the deeper mineral soil layers [32]. Ref. [2] found that tree species composition slightly affected total soil C sequestration during the 30-year period. In this context, several questions remain unanswered, and longer-term data on afforested land are needed.
The response of SOC stock to afforestation was different for cropland and grassland [67,68]. Earlier studies demonstrated that afforestation of former perennial grasslands will not give significant results as grasslands have already accumulated large SOC stocks, and the mineral topsoil comprises abundant plant roots [20,68,69,70]. Meanwhile, the afforestation of cropland increased SOC stocks [20,32,34,50]. The SOC stocks in 0–10 cm, 10–20 cm, 20–40 cm, 40–60 cm and 60–80 cm soil layers were reduced following afforestation of grassland but not significantly (p > 0.05), while the afforestation of cropland significantly (p < 0.05) increased SOC for each soil layer up to 60 cm depth [67]. The reduced SOC stocks following afforestation could be explained by lower C input with litterfall in forest soil compared with former agricultural land due to SOM decomposition changes [1]. The afforestation with pine (Pinus halepensis Mill) of abandoned agricultural land in Southeastern Spain showed that the average SOC values in afforested land were higher (12.2 t ha−1) than in abandoned soils (9.5 t ha−1) and cropland (8.0 t ha−1) [71].

5. Conclusions

The mean forest floor mass showed an increasing trend due to the increase of the stand age, resulting in an increase of mean SOC stocks of the forest floor. The mean forest floor mass and mean SOC stocks in the forest floor increased more in afforested nutrient-poor Arenosols than in nutrient-rich Luvisols. Almost twice as much forest floor mass and SOC stocks were observed in coniferous than deciduous stands 2–3 decades after afforestation.
Significantly lower mean bulk density of fine (<2 mm) soil in the 0–30 cm mineral topsoil layer was obtained in afforested land, especially in the 21–30-year-old stands, compared to paired sites in cropland; and significantly higher SOC concentrations were obtained in afforested land. Despite the increase in mineral topsoil SOC concentration, the mean SOC stocks slightly increased only in Luvisols with the age of stand; low SOC stocks were mainly determined by decreasing the bulk density of the mineral topsoil with the age of the stand. In general, neither soil group nor stand species composition (deciduous vs coniferous) showed significant differences in SOC stocks in afforested sites. Overall, total SOC accumulation in afforested sites, obtained by summing the forest floor and mineral topsoil up to 30 cm depth, was higher due to forest floor formation.
This study has some limitations, such as the gaps in the C stocks of the above- and below-ground biomass in the assessed land-use categories, individual tree species influence on SOC stocks both in forest floor and mineral soil, and the limited 30-year period after afforestation. The obtained data suggest that under the current climate and soil characteristics in the region, afforestation of agricultural land should be encouraged. However, the conversion of perennial grasslands to forest land should be done with caution, at least until more detailed long-term data are available. Based on the LULUCF land uses, the afforestation of abandoned agricultural land is promoted through global and local recommendations; however, in line with the expansion of forest area, the negative effects on biodiversity, especially in natural grasslands, should also be a potential measure. The mentioned issues should be discussed and analysed in more detail in future studies.

Author Contributions

Conceptualisation, I.V.-K. and K.A.; formal analysis, I.V.-K., P.Ž. and K.A.; investigation, P.Ž., V.S. and G.U.; methodology, P.Ž., K.A. and V.S.; software, I.V.-K. and P.Ž.; visualisation, I.V.-K., P.Ž. and K.A.; supervision, I.V.-K.; writing—original draft preparation, I.V.-K.; writing—review and editing, P.Ž., K.A., V.S. and G.U. All authors have read and agreed to the published version of the manuscript.

Funding

The study was funded by the Ministry of Environment of the Republic of Lithuania in the frame of 2009–2014 European Economic Area or Norwegian Financial Mechanisms and Co-financing.

Data Availability Statement

The data is available on request from the corresponding author.

Acknowledgments

This paper partly presents the findings obtained through the Long-term Research Programme “Sustainable Forestry and Global Changes” implemented by the Lithuanian Research Centre for Agriculture and Forestry (LAMMC).This work was conducted within the framework of the CAR-ES (Centre of Advanced Research on Environmental Services from Nordic Forest Ecosystems) network for 2016–2020, funded by Nordic Forest Research. We thank the field and laboratory technicians and colleagues who contributed to this study. We also thank the three reviewers and editor for the effective feedback provided.

Conflicts of Interest

The authors declare no conflict of interest.

References

  1. Vesterdal, L.; Ritter, E.; Gundersen, P. Change in soil organic carbon following afforestation of former arable land. For. Ecol. Manag. 2002, 169, 137–147. [Google Scholar] [CrossRef]
  2. Vesterdal, L.; Rosenqvist, L.; van der Salm, C.; Groenenberg, B.-J.; Johansson, M.-B.; Hansen, K. Carbon sequestration in soil and biomass following afforestation: Experiences from oak and Norway spruce chronosequences in Denmark, Sweden, and the Netherlands. In Environmental Effects of Afforestation; Heil, G., Muys, B., Hansen, K., Eds.; Field Observations, Modelling and Spatial Decision Support; Springer: Berlin, Germany, 2007; pp. 19–51. [Google Scholar]
  3. Armolaitis, K.; Aleinikovienė, J.; Baniūnienė, A.; Lubytė, J.; Žėkaitė, V. Carbon sequestration and nitrogen status in Arenosols following afforestation or following abandonment of arable land. Balt. For. 2007, 13, 169–178. [Google Scholar]
  4. Jandl, R.; Lindner, M.; Vesterdal, L.; Bauwens, B.; Baritz, R.; Hagedorn, F.; Johnson, D.W.; Minkkinen, K.; Byrne, K.A. How strongly can forest management influence soil carbon sequestration? Geoderma 2007, 137, 253–268. [Google Scholar] [CrossRef]
  5. Ruskule, A.; Nikodemus, O.; Kasparinska, Z.; Kasparinskis, R.; Brumelis, G. Patterns of afforestation on abandoned agriculture land in Latvia. Agrofor. Syst. 2012, 85, 215–231. [Google Scholar] [CrossRef]
  6. Bárcena, T.G.; Gundersen, P.; Vesterdal, L. Afforestation effects on SOC in former cropland: Oak and spruce chronosequences resampled after 13 years. Glob. Chang. Biol. 2014, 20, 2938–2952. [Google Scholar] [CrossRef]
  7. Bárcena, T.G.; Kiær, L.P.; Vesterdal, L.; Stefánsdóttir, H.M.; Gundersen, P.; Sigurdsson, B.D. Soil carbon stock change following afforestation in Northern Europe: A meta-analysis. Glob. Chang. Biol. 2014, 20, 2393–2405. [Google Scholar] [CrossRef] [PubMed]
  8. Nave, L.E.; Domke, G.M.; Hofmeister, K.L.; Mishra, U.; Perry, C.H.; Walters, B.F.; Swanston, C.W. Reforestation can sequester two petagrams of carbon in US topsoils in a century. Proc. Natl. Acad. Sci. USA 2018, 115, 2776–2781. [Google Scholar] [CrossRef] [PubMed] [Green Version]
  9. Nave, L.E.; Walters, B.F.; Hofmeister, K.L.; Perry, C.H.; Mishra, U.; Domke, G.M.; Swanston, C.W. The role of reforestation in carbon sequestration. New For. 2019, 50, 115–137. [Google Scholar] [CrossRef]
  10. Mayer, M.; Prescott, C.E.; Abaker, W.E.A.; Augusto, L.; Cécillon, L.; Ferreira, G.W.D.; James, J.; Jandl, R.; Katzensteiner, K.; Laclau, J.P.; et al. Tamm Review: Influence of forest management activities on soil organic carbon stocks: A knowledge synthesis. For. Ecol. Manag. 2020, 466, 118127. [Google Scholar] [CrossRef]
  11. De Vries, W.; Reinds, G.J.; Posch, M.; Sanz, M.; Krause, G.; Calatyud, V.; Dupouey, J.; Sterba, H.; Gundersen, P.; Voogd, J.; et al. Intensive Monitoring of Forest Ecosystems in Europe; Technical Report; European Commission UN/ECE: Brussels, Belgium, 2003. [Google Scholar]
  12. Lal, R. Forest soils and carbon sequestration. For. Ecol. Manag. 2005, 220, 242–258. [Google Scholar] [CrossRef]
  13. Parfitt, R.L.; Percival, H.J.; Dahlgren, R.A.; Hill, L.F. Soil and solution chemistry under pasture and radiata pine in New Zealand. Plant. Soil. 1997, 191, 279–290. [Google Scholar] [CrossRef]
  14. Ross, D.J.; Tate, K.R.; Scott, N.A.; Feltham, C.W. Land-use change: Effects on soil carbon, nitrogen and phosphorus pools and fluxes in three adjacent ecosystems. Soil Biol. Biochem. 1999, 31, 803–813. [Google Scholar] [CrossRef]
  15. Farley, K.A.; Kelly, E.F.; Hofstede, R.G.M. Soil organic carbon and water retention following conversion of grasslands to pine plantations in the Ecuadoran Andes. Ecosystems 2004, 7, 729–739. [Google Scholar] [CrossRef]
  16. Zhao, Q.; Zeng, D.H.; Lee, D.K.; He, X.Y.; Fan, Z.P.; Jin, Y.H. Effects of Pinus sylvestris var. mongolica afforestation on soil phosphorus status of the Keerqin sandy lands in China. J. Arid Environ. 2007, 69, 569–582. [Google Scholar] [CrossRef]
  17. Mao, R.; Zeng, D.-H. Changes in soil particulate organic matter, microbial biomass, and activity following afforestation of marginal agricultural lands in a semi-arid area of Northeast China. Environ. Manag. 2010, 46, 110–116. [Google Scholar] [CrossRef] [PubMed]
  18. De Kovel, C.G.F.; Van Mierlo, A.J.E.M.; Wilms, Y.J.O.; Berendese, F. Carbon and nitrogen in soil and vegetation at sites differing in successional age. Plant. Ecol. 2000, 149, 43–50. [Google Scholar] [CrossRef]
  19. Post, W.; Kwon, K. Soil carbon sequestration and land-use change: Processes and potential. Glob. Chang. Biol. 2000, 6, 317–327. [Google Scholar] [CrossRef] [Green Version]
  20. Guo, L.; Gifford, R. Soil carbon stocks and land use change: A meta-analysis. Glob. Chang. Biol. 2002, 8, 345–360. [Google Scholar] [CrossRef]
  21. Del Galdo, I.; Six, J.; Peressotti, A.; Cotrufo, M.F. Assessing the impact of land-use change on soil C sequestration in agricultural soils by means of organic matter fractionation and stable C isotopes. Glob. Chang. Biol. 2003, 9, 1204–1213. [Google Scholar] [CrossRef]
  22. DeGryze, S.; Six, J.; Paustian, K.; Morris, S.J.; Paul, E.A.; Merckx, R. Soil organic carbon pool changes following land-use conversions. Glob. Chang. Biol. 2004, 10, 1120–1132. [Google Scholar] [CrossRef] [Green Version]
  23. Grünzweig, J.M.; Gelfand, I.; Fried, Y.; Yakir, D. Biogeochemical factors contributing to enhanced carbon storage following afforestation of a semi-arid shrubland. Biogeosciences 2007, 4, 891–904. [Google Scholar] [CrossRef] [Green Version]
  24. Hernandez-Ramirez, G.; Sauer, T.J.; Cambardella, C.A.; Brandle, J.R.; James, D.E. Carbon sources and dynamics in afforested and cultivated US Corn Belt soils. Soil Sci. Soc. Am. J. 2011, 75, 216–225. [Google Scholar] [CrossRef] [Green Version]
  25. Davis, M. Soil properties under pine forest and pasture at two hill country sites in Canterbury. N. Z. J. For. Sci. 2001, 31, 3–17. [Google Scholar]
  26. Davis, M.; Nordmeyer, A.; Henley, D.; Watt, M. Ecosystem carbon accretion 10 years after afforestation of depleted subhumid grassland planted with three densities of Pinus nigra. Glob. Chang. Biol. 2007, 13, 1414–1422. [Google Scholar] [CrossRef]
  27. Smal, H.; Olszewska, M. The effect of afforestation with Scots pine (Pinus silvestris L.) of sandy post-arable soils on their selected properties. II. Reaction, carbon, nitrogen and phosphorus. Plant. Soil 2008, 305, 171–187. [Google Scholar] [CrossRef]
  28. Strand, L.T.; Fjellstad, W.; Jackson-Blake, L.; De Wit, H.A. Afforestation of a pasture in Norway did not result in higher soil carbon, 50 years after planting. Landsc. Urban. Plan. 2021, 207, 104007. [Google Scholar] [CrossRef]
  29. Six, J.; Elliott, E.T.; Paustian, K. Soil macroaggregate turnover and microaggregate formation: A mechanism for C sequestration under no-tillage agriculture. Soil Biol. Biochem. 2000, 32, 2099–2103. [Google Scholar] [CrossRef]
  30. Hooker, T.D.; Compton, J.E. Forest ecosystem carbon and nitrogen accumulation during the first century after agricultural abandonment. Ecol. Appl. 2003, 13, 299–313. [Google Scholar] [CrossRef]
  31. Vesterdal, L.; Clarke, N.; Sigurdsson, B.D.; Gundersen, P. Do tree species influence soil carbon stocks in temperate and boreal forests? For. Ecol. Manag. 2013, 309, 4–18. [Google Scholar] [CrossRef]
  32. Paul, K.I.; Polglase, P.J.; Nyakuengama, J.G.; Khanna, P.K. Change in soil carbon following afforestation. For. Ecol. Manag. 2002, 168, 241–257. [Google Scholar] [CrossRef]
  33. Huang, M.; Ji, J.J.; Li, K.R.; Liu, Y.F.; Yang, F.T.; Tao, B. The ecosystem carbon accumulation after conversion of grasslands to pine plantations in subtropical red soil of south China. Tellus B Chem. Phys. Meteorol. 2007, 59, 439–448. [Google Scholar] [CrossRef]
  34. Li, D.; Niu, S.; Luo, Y. Global patterns of the dynamics of soil carbon and nitrogen stocks following afforestation: A meta-analysis. New Phytol. 2012, 195, 172–181. [Google Scholar] [CrossRef]
  35. Ministry of Agriculture of the Republic of Lithuania. Lithuanian Rural Development Programme. In Investments in Development of Forest Areas and Improvement of Forest Viability; Legal Act No. 3D-142, No. 4182; Ministry of Agriculture of the Republic of Lithuania: Vilnius, Lithuania, 2021. [Google Scholar]
  36. Ministry of Agriculture and Ministry of Environment of the Republic of Lithuania. Order for Afforestation in Non-Forest Land; Ministry of Agriculture and Ministry of Environment of the Republic of Lithuania: Vilnius, Lithuania, 2004; Updated 2016, No. 3D-130/D1-144. [Google Scholar]
  37. Mozgeris, G.; Juknelienė, D. Modeling Future Land Use Development: A Lithuanian Case. Land 2021, 10, 360. [Google Scholar] [CrossRef]
  38. Information on LULUCF Actions in Lithuania. Progress Report under Requirements of Article 10 of the EU Decision No. 529/2013/EU Submission to the European Commission. 2021. Available online: https://am.lrv.lt/uploads/am/documents/files/KLIMATO%20KAITA/%C5%A0ESD%20apskaitos%20ir%20kt%20ataskaitos/Information%20on%20LULUCF%20actions%20in%20Lithuania%202021.pdf (accessed on 11 November 2021).
  39. Lithuanian Hydrometeorological Service under the Ministry of Environment. Climate Atlas of Lithuania; Lithuanian Hydrometeorological Service under the Ministry of Environment: Vilnius, Lithuania, 2013. [Google Scholar]
  40. Eggleston, H.S.; Miwa, K.; Srivastava, N.; Tanabe, K. (Eds.) National Greenhouse Gas Inventories Programme. In IPCC Guidelines for National Greenhouse Gas. Inventories–A Primer; IGES: Hayama, Japan, 2006. [Google Scholar]
  41. Ring, E.; Andersson, E.; Armolaitis, K.; Eklöf, K.; Finér, L.; Gil, W.; Glazko, Z.; Janek, M.; Lībiete, Z.; Lode, E.; et al. Good Practices for Forest Buffers to Improve Surface Water Quality in the Baltic Sea Region. In ARBETSRAPPORT 995–2018; Rootsi Skogforsk: Uppsala, Sweden, 2018; Available online: https://converges.eu/wp-content/uploads/2020/10/ring_2018.pdf (accessed on 8 October 2021).
  42. FAO Global Forest Resources Assessment 2015 (FRA). Available online: http://www.fao.org/3/a-i4808e.pdf (accessed on 8 October 2021).
  43. Lithuanian Statistical Yearbook of Forestry 2019. Ministry of Environment, State Forest Service. Available online: http://www.amvmt.lt/index.php/leidiniai/misku-ukio-statistika/2019 (accessed on 25 July 2021).
  44. USDA Foreign Agricultural Service; Grain and Feed Annual–Lithuania 2017. GAIN Report (Global Agricultural International Network). Available online: https://gain.fas.usda.gov/Recent%20GAIN%20Publications/Grain%20and%20Feed%20Annual%20-%20Lithuania%202017_Warsaw_Lithuania_4-25-2017.pdf (accessed on 25 July 2021).
  45. Europe’s Biodiversity–Biogeographical Regions and Seas; EEA Report No 1/2002. Available online: https://www.eea.europa.eu/publications/report_2002_0524_154909 (accessed on 25 July 2021).
  46. Buivydaitė, V.; Vaičys, M.; Juodis, J.; Motuzas, A. Lithuanian Soil Classification; Mokslas: Vilnius, Lithuania, 2001; p. 137. (In Lithuanian) [Google Scholar]
  47. IUSS Working Group WRB. World Reference Base for Soil Resources 2014; International Soil Classification System for Naming Soils and Creating Legends for Soil Maps; World Soil Resources Reports No. 106; FAO: Rome, Italy, 2015; p. 192, Update 2015. [Google Scholar]
  48. Armolaitis, K.; Varnagirytė-Kabašinskienė, I.; Žemaitis, P.; Stakėnas, V.; Kulbokas, G.; Beniušis, R.; Urbaitis, G. Evaluation of organic carbon stocks in mineral and organic soils in Lithuania. Soil Use Manag. 2021. [Google Scholar] [CrossRef]
  49. Vesterdal, L.; Schmidt, I.K.; Callesen, I.; Nilsson, L.O.; Gundersen, P. Carbon and nitrogen in forest floor and mineral soil under six common European tree species. For. Ecol. Manag. 2008, 255, 35–48. [Google Scholar] [CrossRef]
  50. Laganière, J.; Angers, D.A.; Paré, D. Carbon accumulation in agricultural soils after afforestation: A meta-analysis. Glob. Chang. Biol. 2010, 16, 439–453. [Google Scholar] [CrossRef]
  51. Markewitz, D.; Sartori, F.; Craft, C. Soil change and carbon storage in longleaf pine stands planted on marginal agricultural lands. Ecol. Appl. 2002, 12, 1276–1285. [Google Scholar] [CrossRef]
  52. Thuille, A.; Schulze, E.-D. Carbon dynamics in successional and afforested spruce stands in Thuringia and the Alps. Glob. Chang. Biol. 2006, 12, 325–342. [Google Scholar] [CrossRef]
  53. Smal, H.; Ligȩza, S.; Pranagal, J.; Urban, D.; Pietruczyk-Popławska, D. Changes in the stocks of soil organic carbon, total nitrogen and phosphorus following afforestation of post-arable soils: A chronosequence study. For. Ecol. Manag. 2019, 451, 117536. [Google Scholar] [CrossRef]
  54. Thuille, A.; Buchmann, N.; Schulze, E.-D. Carbon stocks and soil respiration rates during deforestation, grassland use and subsequent Norway spruce afforestation in the Southern Alps, Italy. Tree Physiol. 2000, 20, 849–857. [Google Scholar] [CrossRef] [PubMed]
  55. Poeplau, C.; Don, A.; Vesterdal, L.; Leifeld, J.; Van Wesemael, B.; Schumacher, J.; Gensior, A. Temporal dynamics of soil organic carbon after land-use change in the temperate zone-carbon response functions as a model approach. Glob. Chang. Biol. 2011, 17, 2415–2427. [Google Scholar] [CrossRef]
  56. Schulp, C.; Nabuurs, G.-J.; Verburg, P.H.; de Waal, R.W. Effect of tree species on carbon stocks in forest floor and mineral soil and implications for soil carbon inventories. For. Ecol. Manag. 2008, 256, 482–490. [Google Scholar] [CrossRef]
  57. Augusto, L.; De Schrijver, A.; Vesterdal, L.; Smolander, A.; Prescott, C.; Ranger, J. Influences of evergreen gymnosperm and deciduous angiosperm tree species on the functioning of temperate and boreal forests. Biol. Rev. 2015, 90, 444–466. [Google Scholar] [CrossRef]
  58. Berger, T.; Neubauer, C.; Glatzel, G. Factors controlling soil carbon and nitrogen stores in pure stands of Norway spruce (Picea abies) and mixed species stands in Austria. For. Ecol. Manag. 2002, 159, 3–14. [Google Scholar] [CrossRef]
  59. De Vos, B.; Cools, N.; Ilvesniemi, H.; Vesterdal, L.; Vanguelova, E.; Camicelli, S. Benchmark values for forest soil carbon stocks in Europe: Results from a large scale forest soil survey. Geoderma 2015, 251, 33–46. [Google Scholar] [CrossRef]
  60. Vesterdal, L.; Raulund-Rasmussen, K. Forest floor chemistry under seven tree species along a soil fertility gradient. Can. J. For. Res. 1998, 28, 1636–1647. [Google Scholar] [CrossRef]
  61. Berthrong, S.; Jobbagy, E.; Jackson, R. A global meta-analysis of soil exchangeable cations, pH, carbon and nitrogen with afforestation. Ecol. Appl. 2009, 19, 2228–2241. [Google Scholar] [CrossRef] [PubMed] [Green Version]
  62. Podrázský, V.; Holubík, O.; Vopravil, J.; Khel, T.; Moser, W.K.; Prknová, H. Effects of afforestation on soil structure formation in two climatic regions of the Czech Republic. J. For. Sci. 2015, 61, 225–234. [Google Scholar] [CrossRef] [Green Version]
  63. Guo, Y.; Abdalla, M.; Espenberg, M.; Hastings, A.; Hallett, P.; Smith, P. A systematic analysis and review of the impacts of afforestation on soil quality indicators as modified by climate zone, forest type and age. Sci. Total Environ. 2021, 757, 143824. [Google Scholar] [CrossRef]
  64. Rumpel, C.; Kogel-Knabner, I.; Bruhn, F. Vertical distribution, age, and chemical composition of organic carbon in two forest soils of different pedogenesis. Org. Geochem. 2002, 33, 1131–1142. [Google Scholar] [CrossRef]
  65. Liski, J. Variation in soil organic carbon and thickness of soil horizons within a boreal forest stand–effect of trees and implications for sampling. Silva Fenn. 1995, 29, 255–266. [Google Scholar] [CrossRef] [Green Version]
  66. Vogt, K.; Vogt, D.; Brown, S.; Tilley, J.; Edmonds, R.; Silver, W.; Siccama, T. Dynamics of Forest Floor and Soil Organic Matter Accumulation in Boreal, Temperate, and Tropical Forests. In Soil Management and Greenhouse Effect, Advances in Soil Science; Lal, R., Kimble, J., Levine, E., Stewart, B., Eds.; CRC Press: Boca Raton, FL, USA, 1995; pp. 159–178. [Google Scholar]
  67. Shi, S.; Zhang, W.; Zhang, P.; Yu, Y.; Ding, F. A synthesis of change in deep soil organic carbon stores with afforestation of agricultural soils. For. Ecol. Manag. 2013, 296, 53–63. [Google Scholar] [CrossRef]
  68. Wellock, M.; Rafique, R.; LaPerle, C.M.; Peichl, M.; Kiely, G. Changes in ecosystem carbon stocks in a grassland ash (Fraxinus excelsior L.) afforestation chronosequence in Ireland. J. Plant. Ecol. 2014, 7, 429–438. [Google Scholar] [CrossRef] [Green Version]
  69. Römkens, P.; van der Pflicht, J.; Hassink, J. Soil organic matter dynamics after the conversion of arable land to pasture. Biol. Fertil. Soils 1999, 28, 277–284. [Google Scholar] [CrossRef] [Green Version]
  70. Murty, D.; Kirschbaum, M.U.F.; McMurtrie, R.E.; McGilvray, A. Does conversion of forest to agricultural land change soil carbon and nitrogen? A review of the literature. Glob. Chang. Biol. 2002, 8, 105–123. [Google Scholar] [CrossRef]
  71. Segura, C.; Jiménez, M.N.; Nieto, O.; Navarro, F.B.; Fernández-Ondoñoa, E. Changes in soil organic carbon over 20 years after afforestation in semiarid SE Spain. For. Ecol. Manag. 2016, 381, 268–278. [Google Scholar] [CrossRef]
Figure 1. The map (A) illustrates the specific study area, covering the regional divisions of State Forest Enterprise in Lithuania where the study plots were selected in 2016, and the map (B) is a topographic map of the country.
Forests 12 01562 g001
Figure 2. Mean soil organic carbon (SOC) stock in the forest floor of Arenosols and Luvisols in relation to the stand age in afforested land (the values are given for the sites afforested by deciduous and coniferous species).
Forests 12 01562 g002
Figure 3. Mean forest floor cover (%) and mean soil organic carbon (SOC) stocks (t ha−1) in the forest floor of afforested Arenosols and Luvisols in the coniferous (A) and deciduous (B) stands of different age.
Forests 12 01562 g003aForests 12 01562 g003b
Figure 4. Relative distribution (%) of mean stocks of soil organic carbon (SOC) in forest floor/litter of perennial grassland, 0–10 cm, and 10–30 cm mineral topsoil layers in nutrient-poor Arenosol (A) and nutrient-rich Luvisol (B) in the 1–10-year-old, 11–20-year-old and 21–30-year-old coniferous and deciduous stands, cropland, and grassland.
Forests 12 01562 g004aForests 12 01562 g004b
Table 1. Number of study plots selected for different coniferous and deciduous tree species.
SpeciesNumber of Plots
ArenosolsLuvisols
Coniferous tree species *3928
Norway spruce (Picea abies (L.) Karst.)721
Scots pine (Pinus sylvestris L.)323
European larch (Larix decidua Mill.)-4
Deciduous tree species2833
Silver birch (Betula pendula Roth.)2013
Grey alder (Alnus incana (L.) Moench.)22
Pedunculate oak (Quercus robur L.)-9
Black alder (Alnus glutinosa (L.) Gaertn.)27
European aspen (Populus tremula L.)41
Small-leaved lime (Tilia cordata Mill.)-1
* The tree species of the division Pinophyta, class Pinopsida were assigned to the coniferous tree species group.
Table 2. Mean mass of forest floor (OL + OF + OH) and plant litter in perennial grassland and mean soil organic carbon (SOC) concentrations in afforested land and grassland of Arenosols and Luvisols [47]. Bold values denote statistical significance between the values in afforested land, coniferous or deciduous and the values in grasslands at the p < 0.05 level.
Land-Use CategoryArenosolsLuvisols
Mean Mass
(t ha−1)
Mean SOC Concentrations (g kg−1)Mean Mass
(t ha−1)
Mean SOC Concentrations (g kg−1)
Afforested land, 1–10 years old a5.0 ± 0.6349.6 ± 16.13.1 ± 0.6342.8 ± 11.5
Grassland b2.2 ± 0.5378.4 ± 15.90.0 ± 0.0n.d. c
Coniferous, 1–10 years old5.6 ± 1.0374.2 ± 18.44.0 ± 1.1350.0 ± 13.6
Grassland2.4 ± 0.0357.1 ± 0.00.0 ± 0.0n.d.
Deciduous, 1–10 years old4.3 ± 0.7331.6 ± 23.72.2 ± 0.5336.2 ± 18.6
Grassland2.1 ± 0.9389.0 ± 20.50.0 ± 0.0n.d.
Afforested land, 11–20 years old8.4 ± 0.8354.3 ± 9.76.3 ± 0.8337.7 ± 11.4
Grassland1.7 ± 0.7391.7 ± 12.12.6 ± 0.5354.2 ± 4.7
Coniferous, 11–20 years old10.3 ± 0.9338.4 ± 9.36.8 ± 1.4332.4 ± 13.9
Grassland1.7 ± 0.7391.7 ± 12.13.4 ± 0.0358.9 ± 0.0
Deciduous, 11–20 years old6.2 ± 0.8375.0 ± 17.35.7 ± 0.8343.0 ± 18.7
Grassland0.0 ± 0.0n.d.2.4 ± 0.5354.2 ± 4.7
Afforested land, 21–30 years old13.5 ± 1.7387.1 ± 8.47.3 ± 0.9343.0 ± 10.4
Grassland1.22 ± 0.0368.5 ± 0.00.0 ± 0.0n.d.
Coniferous, 21–30 years old16.3 ± 2.0387.1 ± 10.910.0 ± 1.2337.2 ± 16.0
Grassland0.0 ± 0.0n.d.0.0 ± 0.0n.d.
Deciduous, 21–30 years old7.4 ± 1.1387.1 ± 13.35.4 ± 1.1347.2 ± 15.0
Grassland1.2 ± 0.0368.5 ± 0.00.0 ± 0.0n.d.
a Afforested land—the values are given as the means of coniferous and deciduous sites. b Different values for grasslands are given because of the chosen methodology, see the paired-site design description in the Materials and Methods. c n.d. means ‘not determined’, no litter layer was found in the grasslands.
Table 3. Mean bulk density (g cm−3) of fine (<2 mm) soil in mineral topsoil of Arenosols and Luvisols [47]. Different letters a and b indicate significant differences between the means of different land uses within one topsoil layer of each Arenosol and Luvisol at p < 0.05.
Land-Use CategoryBulk Density (g cm−3)
ArenosolsLuvisols
0–10 cm10–30 cm0–10 cm10–30 cm
Afforested land, 1–10 years old a1.20 ± 0.031.35 ± 0.031.31 ± 0.031.50 ± 0.02
Control b1.21 ± 0.031.35 ± 0.021.32 ± 0.031.49 ± 0.02
Coniferous, 1–10 years old1.21 ± 0.04 a1.31 ± 0.04 a1.31 ± 0.04 ab1.48 ± 0.03 a
Cropland1.17 ± 0.05 a1.35 ± 0.02 a1.37 ± 0.07 b1.52 ± 0.04 a
Grassland1.30 ± 0.05 b1.37 ± 0.04 a1.25 ± 0.06 a1.44 ± 0.06 a
Deciduous, 1–10 years old1.20 ± 0.06 a1.38 ± 0.05 a1.32 ± 0.04 ab1.51 ± 0.02 a
Cropland1.21 ± 0.08 a1.38 ± 0.04 a1.42 ± 0.05 b1.50 ± 0.03 a
Grassland1.14 ± 0.05 a1.30 ± 0.05 a1.23 ± 0.05 a1.50 ± 0.04 a
Afforested land, 11–20 years old1.11 ± 0.021.27 ± 0.031.19 ± 0.021.41 ± 0.03
Control1.18 ± 0.031.31 ± 0.031.36 ± 0.041.53 ± 0.02
Coniferous, 11–20 years old1.09 ± 0.03 a1.25 ± 0.03 a1.19 ± 0.04 a1.45 ± 0.04 a
Cropland1.14 ± 0.04 b1.26 ± 0.03 a1.48 ± 0.02 b1.61 ± 0.05 b
Grassland1.08 ± 0.07 a1.26 ± 0.07 a1.26 ± 0.12 a1.54 ± 0.03 ab
Deciduous, 11–20 years old1.14 ± 0.03 a1.30 ± 0.04 a1.18 ± 0.02 a1.37 ± 0.03 a
Cropland1.35 ± 0.06 b1.42 ± 0.05 a1.46 ± 0.03 b1.47 ± 0.04 a
Grassland1.17 ± 0.06 a1.33 ± 0.05 a1.27 ± 0.05 a1.48 ± 0.05 a
Afforested land, 21–30 years old1.14 ± 0.031.29 ± 0.021.20 ± 0.041.37 ± 0.03
Control1.30 ± 0.031.40 ± 0.021.41 ± 0.021.52 ± 0.03
Coniferous, 21–30 years old1.19 ± 0.03 a1.31 ± 0.03 a1.17 ± 0.07 a1.38 ± 0.06 a
Cropland1.27 ± 0.03 ab1.39 ± 0.03 a1.45 ± 0.01 b1.52 ± 0.02 a
Grassland1.34 ± 0.05 b1.44 ± 0.03 a1.37 ± 0.03 b1.46 ± 0.07 a
Deciduous, 21–30 years old1.07 ± 0.04 a1.26 ± 0.041.22 ± 0.041.37 ± 0.04
Cropland1.33 ± 0.04 b1.42 ± 0.041.41 ± 0.021.56 ± 0.04
Grassland1.05 a1.24n.d. cn.d.
a Afforested land—the values are given as means of coniferous and deciduous sites. b Control includes the means of the values obtained in grasslands and croplands of coniferous and deciduous stands. n.d. means “not determined”.
Table 4. Mean concentrations (g kg−1) of soil organic carbon (SOC) in mineral topsoil of Arenosols and Luvisols [47]. Different letters a and b indicate significant differences between the means of different land uses within one topsoil layer of each Arenosol and Luvisol at p < 0.05.
Land-Use CategoryMean SOC Concentration (g kg−1)
ArenosolsLuvisols
0–10 cm10–30 cm0–10 cm10–30 cm
Afforested land, 1–10 years old a16.8 ± 2.012.7 ± 1.617.9 ± 1.712.2 ± 1.0
Control b19.1 ± 2.115.4 ± 2.120.7 ± 3.614.8 ± 2.8
Coniferous, 1–10 years old15.1 ± 2.9 a11.7 ± 2.4 a17.8 ± 2.8 a11.8 ± 1.5 a
Cropland13.9 ± 4.1 a17.2 ± 5.7 a12.1 ± 2.7 a11.2 ± 1.5 a
Grassland14.4 ± 3.1 a11.6 ± 3.2 a33.8 ± 12.3 b23.8 ± 12.8 b
Deciduous, 1–10 years old18.3 ± 2.9 a13.6 ± 2.2 a18.0 ± 2.2 a12.6 ± 1.3 a
Cropland21.6 ± 3.9 a20.2 ± 5.7 a11.5 ± 3.0 a12.2 ± 1.8 a
Grassland26.0 ± 3.9 a13.8 ± 2.2 a28.2 ± 5.0 b13.6 ± 1.8 a
Afforested land, 11–20 years old18.9 ± 1.715.1 ± 1.720.5 ± 2.013.4 ± 1.2
Control19.8 ± 2.016.5 ± 1.723.4 ± 4.315.0 ± 2.9
Coniferous, 11–20 years old21.3 ± 2.0 a15.2 ± 2.0 a21.8 ± 3.3 a13.6 ± 2.1 a
Cropland20.9 ± 3.0 a18.5 ± 3.2 a12.6 ± 1.3 a9.0 ± 1.4 a
Grassland28.6 ± 4.5 b20.1 ± 3.4 a21.1 ± 3.2 a11.7 ± 2.3 a
Deciduous, 11–20 years old15.8 ± 2.7 a15.0 ± 3.2 a19.2 ± 2.3 a13.2 ± 1.5 a
Cropland12.2 ± 1.4 a11.5 ± 1.7 a17.9 ± 4.5 a15.9 ± 3.1 a
Grassland16.8 ± 3.6 a14.9 ± 4.6 a28.3 ± 8.5 b21.6 ± 8.5 b
Afforested land, 21–30 years old17.3 ± 2.412.1 ± 1.823.1 ± 2.315.3 ± 2.3
Control14.8 ± 1.811.4 ± 1.317.1 ± 2.611.9 ± 1.6
Coniferous, 21–30 years old15.3 ± 2.6 a9.8 ± 1.5 a25.3 ± 4.6 b15.4 ± 2.1 a
Cropland12.6 ± 2.5 a13.1 ± 2.4 a11.3 ± 1.1 a17.3 ± 1.8 a
Grassland15.5 ± 3.3 a8.6 ± 2.6 a22.5 ± 5.6 b14.9 ± 2.1 a
Deciduous, 21–30 years old21.0 ± 4.7 a16.4 ± 3.821.6 ± 3.215.3 ± 3.5
Cropland14.5 ± 3.4 a9.8 ± 0.416.4 ± 3.87.3 ± 1.5
Grassland31.2 b22.4n.d.n.d.
a Afforested land—the values are given as means of coniferous and deciduous sites. b Control includes the means of the values obtained in grasslands and croplands of coniferous and deciduous stands. c n.d. means “no data”.
Table 5. Mean stocks (t ha−1) of soil organic carbon (SOC) in 0–30 cm topsoil layers of Arenosols and Luvisols [47] in afforested land, cropland and grassland. Different letters a and b indicate significant differences between the land-use categories within each stand age decade for Arenosols and Luvisols at the p < 0.05.
Land-Use CategoryArenosolsLuvisols
nMean SOC
Stocks (t ha−1)
National SOC
Values (t ha−1) b
nMean SOC
Stocks (t ha−1)
National SOC
Values (t ha−1) b,c
Afforested land, 1–10 years old a2350.9 ± 4.6 a-2259.1 ± 4.0 ab-
Cropland1069.8 ± 11.9 a-1351.2 ± 5.5 a-
Grassland955.5 ± 6.4 a-969.6 ± 7.8 b-
Afforested land, 11–20 years old2257.5 ± 4.9 a-2160.3 ± 4.8 ab-
Cropland1260.5 ± 6.5 a-1258.1 ± 7.7 a-
Grassland1168.1 ± 8.9 a-1071.8 ± 8.8 b-
Afforested land, 21–30 years old2246.3 ± 5.1 a-1861.4 ± 4.3 ab-
Cropland1149.4 ± 5.7 a-1453.3 ± 6.4 a-
Grassland951.5 ± 11.5 a-873.5 ± 12.1 b-
Afforested land, 1–30 years old6751.8 ± 2.8 a55.7 d6160.2 ± 2.5 ab96.2 d
Cropland3358.8 ± 4.6 a62.03954.1 ± 3.7 a67.0
Grassland2959.1 ± 4.8 a55.32670.2 ± 5.1 b77.4
a Afforested land—the values are given as the means of coniferous and deciduous sites; b National Lithuanian values of soil organic carbon (SOC) stocks in 0–30 cm topsoil of major soil groups [WRB 2014 (2015)] in forests, grassland and cropland (Table 5 of Ref. [48]); c The SOC values were given for Luvisols together with Retisols [48]; d The SOC values were given for forest land [48].
Publisher’s Note: MDPI stays neutral with regard to jurisdictional claims in published maps and institutional affiliations.

