Article

Effects of Forest Changes on Summer Surface Temperature in Changbai Mountain, China

1
Northeast Institute of Geography and Agroecology, Chinese Academy of Sciences, Changchun 130102, China
2
University of Chinese Academy of Sciences, Beijing 100049, China
*
Author to whom correspondence should be addressed.
Forests 2021, 12(11), 1551; https://doi.org/10.3390/f12111551
Submission received: 15 October 2021 / Revised: 1 November 2021 / Accepted: 5 November 2021 / Published: 10 November 2021
(This article belongs to the Section Forest Inventory, Modeling and Remote Sensing)

Abstract

:
The area and vegetation coverage of forests in Changbai Mountain of China have changed significantly during the past decades. Understanding the effects of forests and forest coverage change on regional climate is important for predicting climate change in Changbai Mountain. Based on the satellite-derived land surface temperature (LST), albedo, evapotranspiration, leaf area index, and land-use data, this study analyzed the influences of forests and forest coverage changes on summer LST in Changbai Mountain. Results showed that the area and vegetation coverage of forests increased in Changbai Mountain from 2003 to 2017. Compared with open land, forests could decrease the summer daytime LST (LSTD) and nighttime LST (LSTN) by 1.10 °C and 0.07 °C, respectively. The increase in forest coverage could decrease the summer LSTD and LSTN by 0.66 °C and 0.04 °C, respectively. The forests and increasing forest coverage had cooling effects on summer temperature, mainly by decreasing daytime temperature in Changbai Mountain. The daytime cooling effect is mainly related to the increased latent heat flux caused by increasing evapotranspiration. Our results suggest that the effects of forest coverage change on climate should be considered in climate models for accurately simulating regional climate change in Changbai Mountain of China.

1. Introduction

Forest ecosystems are important terrestrial ecosystems. They can protect biodiversity, maintain ecological balance, and play a significant role in the global carbon balance [1]. During the past decades, global forests have experienced significant changes due to the effects of human activities and climate changes. These changes can regulate the regional climate through biogeophysical processes (albedo and evapotranspiration) [2,3] and biogeochemical processes (carbon sequestration). Because of spatial heterogeneity, biophysical effects are more complex and, sometimes, even exceed biogeochemical processes [4,5,6,7]. Previous studies have shown that afforestation reduces global warming through biogeochemical processes (carbon sequestration) [8]; however, some studies have found that the warming effect of the carbon cycle caused by deforestation is offset by the net cooling interrelated to changes in albedo and evapotranspiration [6]. In different regions, climates are impacted differently by forests. In tropical regions, the evaporative cooling effect is dominant, which results in some cooling within the regions. However, at high latitudes, the heating effect caused by the decline in albedo is dominant and increases the temperature in the regions [9,10,11,12,13,14,15,16,17,18,19]. Previous studies have shown that forests impact climate differently during different seasons. Temperate forests increase the surface temperature during the winter, decrease the surface temperature during the summer [2], and mainly affect the summer daytime surface temperature [20]. Conversion between forests and different land-use types impacts climates differently. The summer temperature of forests in the eastern United States is higher than that of crops because of low albedo [21]; however, some studies have shown that when farmland is transformed into forests, the temperature decreases during the daytime and increases at night [22]. The conversion from grassland/shrub to forests has a cooling effect on the surface temperature [23]. In the context of global change [24,25], understanding the impacts of forest changes on climate in different regions and seasons is significant for predicting regional or global climate change.
Changbai Mountain is an important ecological functional region in China, which has the most typical mountain forest ecosystem in East Asia [26]. Since 1949, wood production has been the focus of economic development in Changbai Mountain. Moreover, natural forests were the main source of wood production. Due to the unreasonable utilization of forest resources, forests in Changbai Mountain have been seriously damaged. Beginning in 1998, the government implemented the Natural Forest Conservation Program, which emphasized the expansion of natural forests and the ecological restoration of natural forests in sensitive regions [27]. After a series of policies and protection measures, forest resources from Changbai Mountain were restored to a certain extent. Although forests of Changbai Mountain have changed significantly during the past decades, the effects of forest changes on regional climate are unclear. In addition, under the background of global warming and carbon deposition, the forest coverage of Changbai Mountain has increased in recent decades [28]. However, it is not clear whether the forest coverage change in Changbai Mountain can have some effects on regional climate. Previous studies have shown that forest changes in different mountainous areas have different effects on regional climate. For example, mountain birch forest expansion is reported to have a net warming climate feedback in south-central Norway [29]; the forests of the northwest in the Russian Altay Mountains have a cooling effect on the daytime and nighttime temperatures [30]; the increasing forest coverage has a cooling effect on the daytime temperature but has a warming effect on the nighttime temperature in the mountainous catchments of Czech Republic [31]. Considering the unique natural conditions in Changbai Mountain, it is necessary to explore the impact of forests and forest coverage changes on climate in this mountain area, for the purpose of accurately simulating and predicting climate change in East Asia.
Using the satellite-derived land surface temperature (LST), albedo, evapotranspiration (ET), leaf area index (LAI), and land-use data, this study quantified, for the first time, the effects of both forest existence and forest coverage changes on summer surface temperatures in Changbai Mountain. Clarifying the impacts of forests and forest coverage changes on regional climate can not only contribute to predict the future regional climate but also provide a scientific basis for the adaptive management of forests in Changbai Mountain.

2. Materials and Methods

2.1. Study Area

Changbai Mountain is located at 38°46′–47°30′ N and 121°08′–134° E (Figure 1). The study area is the source of the Tumen, Songhua, and Yalu rivers in Northeast China. The climate of Changbai Mountain is humid during the summer and cold and windy during the winter [32]. The climate is affected by the temperate continental monsoon [33,34]. The annual and daily variations of temperatures in Changbai Mountain area are very large [26]. The minimum temperature in the coldest month was −29.9 to −20.9 °C, and maximum temperature in the hottest month ranged from 24.6 to 29.6 °C [35]. The Changbai Mountain region has almost all of the primitive forest types of Eurasia, from the middle temperate zone to the cold zone. The main species are coniferous–latifoliate mixed forests, dark coniferous forests (Picea koraiensis Nakai and Picea jezoensis (Siebold & Zucc.) Carrière), subalpine betulaermanii forests, etc. [36].

2.2. Data

According to previous studies [37,38,39], this study used the MCD12C1 land-use data to analyze the distribution of forests in Changbai Mountain. Based on two images of MCD12C1 land-use data from 2003 and 2017, we extracted the distribution of unchanged forest, open land (grassland and farmland), and the transformation between forest and open land in the study area. The MCD12C1 dataset includes 17 main land cover types, such as forest, shrub, grassland, farmland, etc., with a spatial resolution of 0.05° × 0.05°. The monthly LST dataset of MYD11C3 from 2003 to 2017 was used to explore the effects of forests on the surface temperature. According to the quality control methods, we processed these surface temperature data [40]. The MYD11C3 and MCD12C1 datasets were downloaded from the National Aeronautics and Space Administration (http://www.resdc.cn, accessed on 11 January 2021). The leaf area index data from 2003 to 2017 was used to explain the change in forest coverage, and ET and albedo data were used to further analyze the effect of forest coverage changes on climates in Changbai Mountain. The value of the ET data is divided by 100 and then multiplied by 0.03527 to convert to true value [41]. We selected “the white sky albedo in shortwave band” to obtain the albedo data in this study [42]. The GLASS products (LAI, ET, and albedo) were downloaded from the National Earth System Science Data Center, National Science & Technology Infrastructure of China (http://www.geodata.cn, accessed on 10 January 2021). The spatial resolution of the GLASS products used in this study was 0.05°, and the temporal resolution of these data was eight days. These GLASS products have good performance and have been widely used in the study of the impact of vegetation change on climates [43,44].

2.3. Methods

Using the arithmetic average, we calculated the ET, LAI, and albedo data with a time resolution of eight days as the monthly values based on ArcGIS 10.5 software. Then, we calculated the average values of ET, LST, albedo, and LAI in June, July, and August as the summer averages. The mean daily LST is the average value of the daytime surface temperature (LSTD) and nighttime surface temperature (LSTN). To analyze the impact of forest vegetation change on climates, we first masked the distribution of unchanged forest (belonging to the type of forest in both 2003 and 2017) and unchanged open land (belonging to the type of open land in both 2003 and 2017) in Changbai Mountain. We calculated the variable differences of LAI, albedo, LST, and ET in each 0.25 × 0.25° grid to exclude the influence of regional climatic differences on the results of this study [2,45]. The potential influence of forests on surface temperature can be determined by subtracting the long-term averaged LST difference (ΔLST) of nearby open land from forest, as shown in Formula (1):
ΔLST = ΔLSTforests − ΔLSTopenland
where ΔLSTforest and ΔLSTopenland are the long-term averaged LST of forest and nearby open land from 2003 to 2017, respectively. The distance for nearby open land to forest was within 0.25°. A positive (negative) ΔLST indicates that the forests have a warming (cooling) effect. Open land is a representative of non-forest land, which is the result of deforestation or land suitable for reforestation and afforestation in the future [2].
By calculating the long-term averaged LST differences (ΔLST) between high- and low-coverage forest, we can quantify the potential impact of forest coverage changes on surface temperature, as shown in Formula (2):
ΔLST = ΔLSThigh − ΔLSTlow
where ΔLSThigh and ΔLSTlow are the long-term averaged LSTs of high- and low-coverage forest from 2003 to 2017, respectively. Positive (negative) ΔLST shows that the increase in forest coverage has a warming (cooling) effect.
The formula for calculating the differences in LAILAI), ET (ΔET), and albedo (ΔAlbedo) between forest and open land was similar to Formula 1. The formula for calculating the long-term averaged LAI, ET, and albedo differences between high- and low-coverage forest was similar to Formula 2.
In this study, the definition method of high- and low-coverage forest is as follows: First, we calculated the average value in each grid. If the actual value was larger than the average value, the value of the grid was defined as high-coverage forest. If the actual value was smaller than the average value, it was defined as low-coverage forest. To reduce the effect of elevation on the study results, we only analyzed the grid with height difference between high- and low-coverage forest (or between forest and open land) within 100 m. In addition, a grid with more than two pixels in each grid is selected for analysis, which can avoid affecting the accuracy of the research results due to too few pixels in the grid. Finally, there were 101 grid points used for analysis in this study. The changes of forest vegetation LAI in Changbai Mountain from 2003 to 2017 were analyzed by simple linear regression. The trend of LAI is calculated as follows [28]:
L A I slope = ( n × i = 1 n i × L A I i ) ( i = 1 n i i = 1 n L A I i ) n × i = 1 n i 2 ( i = 1 n i ) 2
where n is the number of years analyzed, i.e., 15 years for this study; i is serial number of the year, and LAIi is summer LAI during the i year; LAIslope is the trend of LAI for each pixel; if LAIslope is negative, it means the change of LAI is a decreasing trend, otherwise it is an increasing trend. To further explain the effects of forest changes on surface temperatures, we calculated the correlations between LAI and LST, LSTD, LSTN, ET, and albedo differences between high- and low-coverage forest in Changbai Mountain using SPSS (version 10.0) software.

3. Results

3.1. Changes of Forests and Forest Coverage in Changbai Mountain

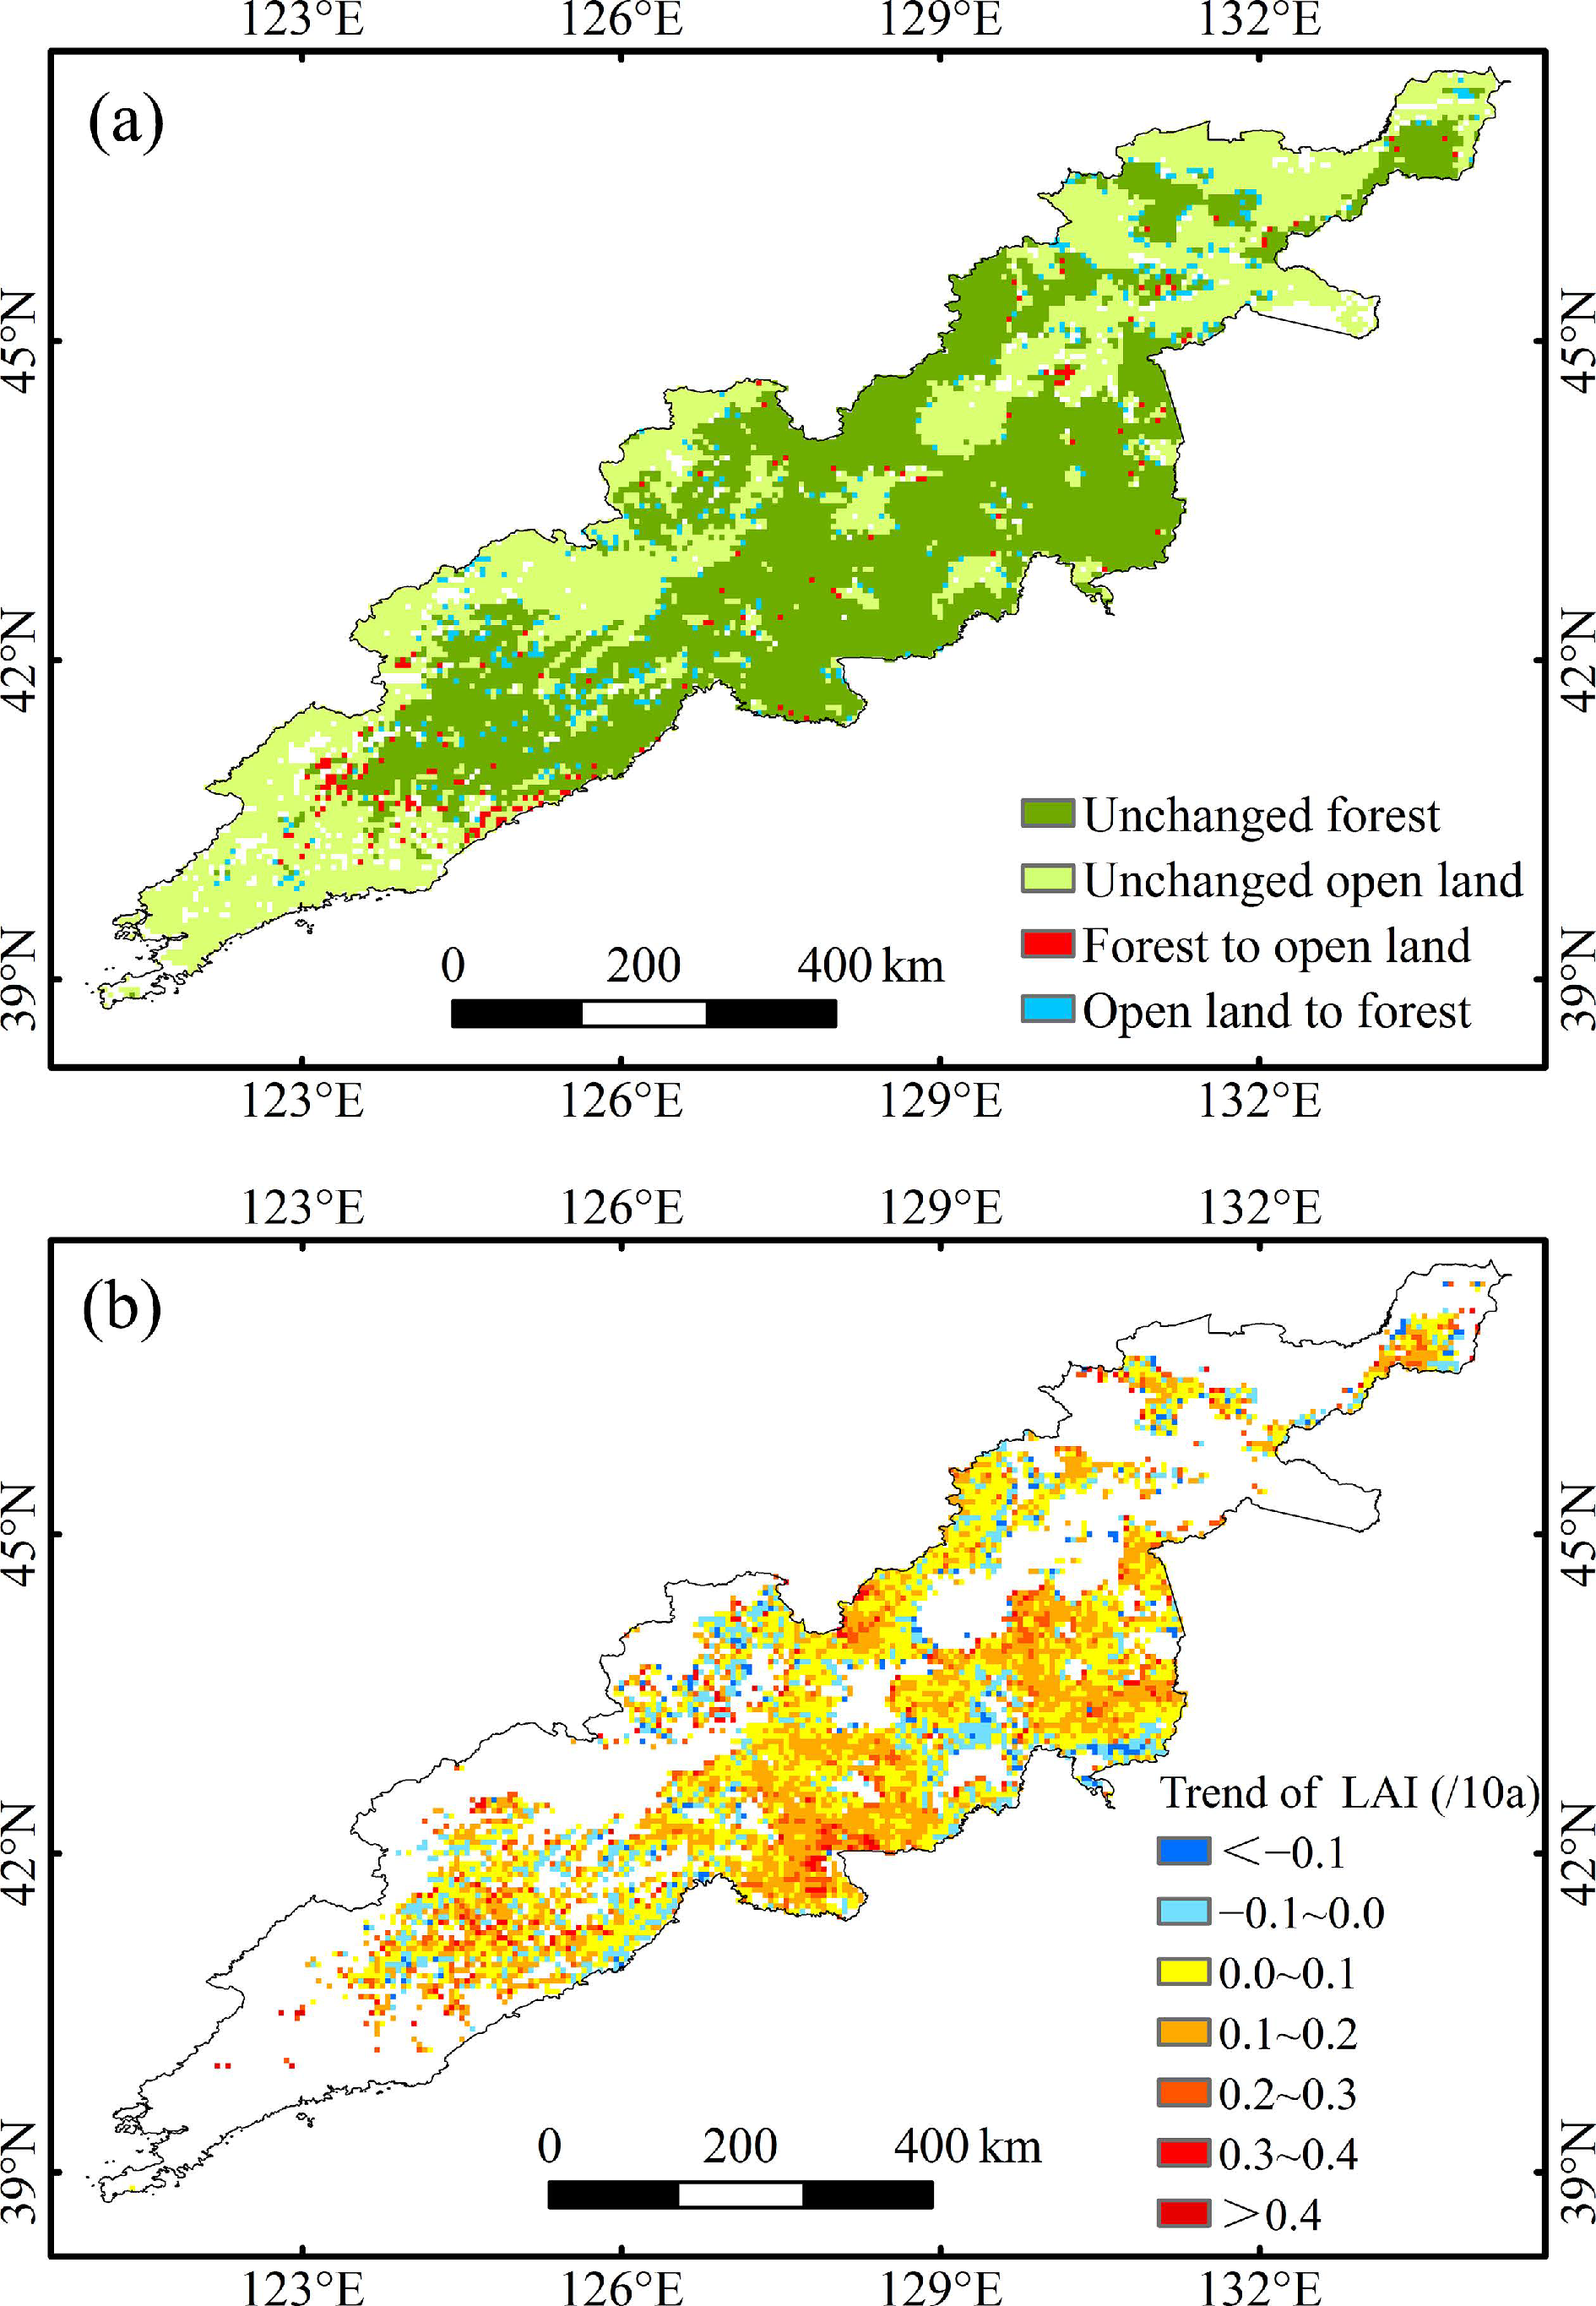
The forests were mainly distributed in the center region of Changbai Mountain (Figure 2a). From 2003 to 2017, the distribution area of forests in Changbai Mountain increased. The increased forest was mainly transformed from open land (grassland and farmland) (Figure 2a), and the transformed area accounted for 1.90% of the Changbai Mountain area. Spatially, the region of conversion from open land to forest was mainly distributed in the northeast and central southwest Changbai Mountain (Figure 2a). Forest conversion to open land (1.48%) was mainly distributed in the southwest Changbai Mountain (Figure 2a). In addition to analyzing the distribution of forests, we also explored changes in unchanged forest coverage in Changbai Mountain. The results showed that the LAI of forests in Changbai Mountain showed an increasing trend (0.01/decade) from 2003 to 2017 (Figure 2b). Spatially, the area with increasing LAI of forests accounted for 82.91% of the total unchanged forest area. The increasing LAI of forests was mainly distributed in the southwest region of Changbai Mountain (Figure 2b). The decreasing LAI of forests was mainly distributed in the center region of Changbai Mountain (Figure 2b).

3.2. Effects of Forests and Forest Coverage Changes on Summer Surface Temperatures in Changbai Mountain

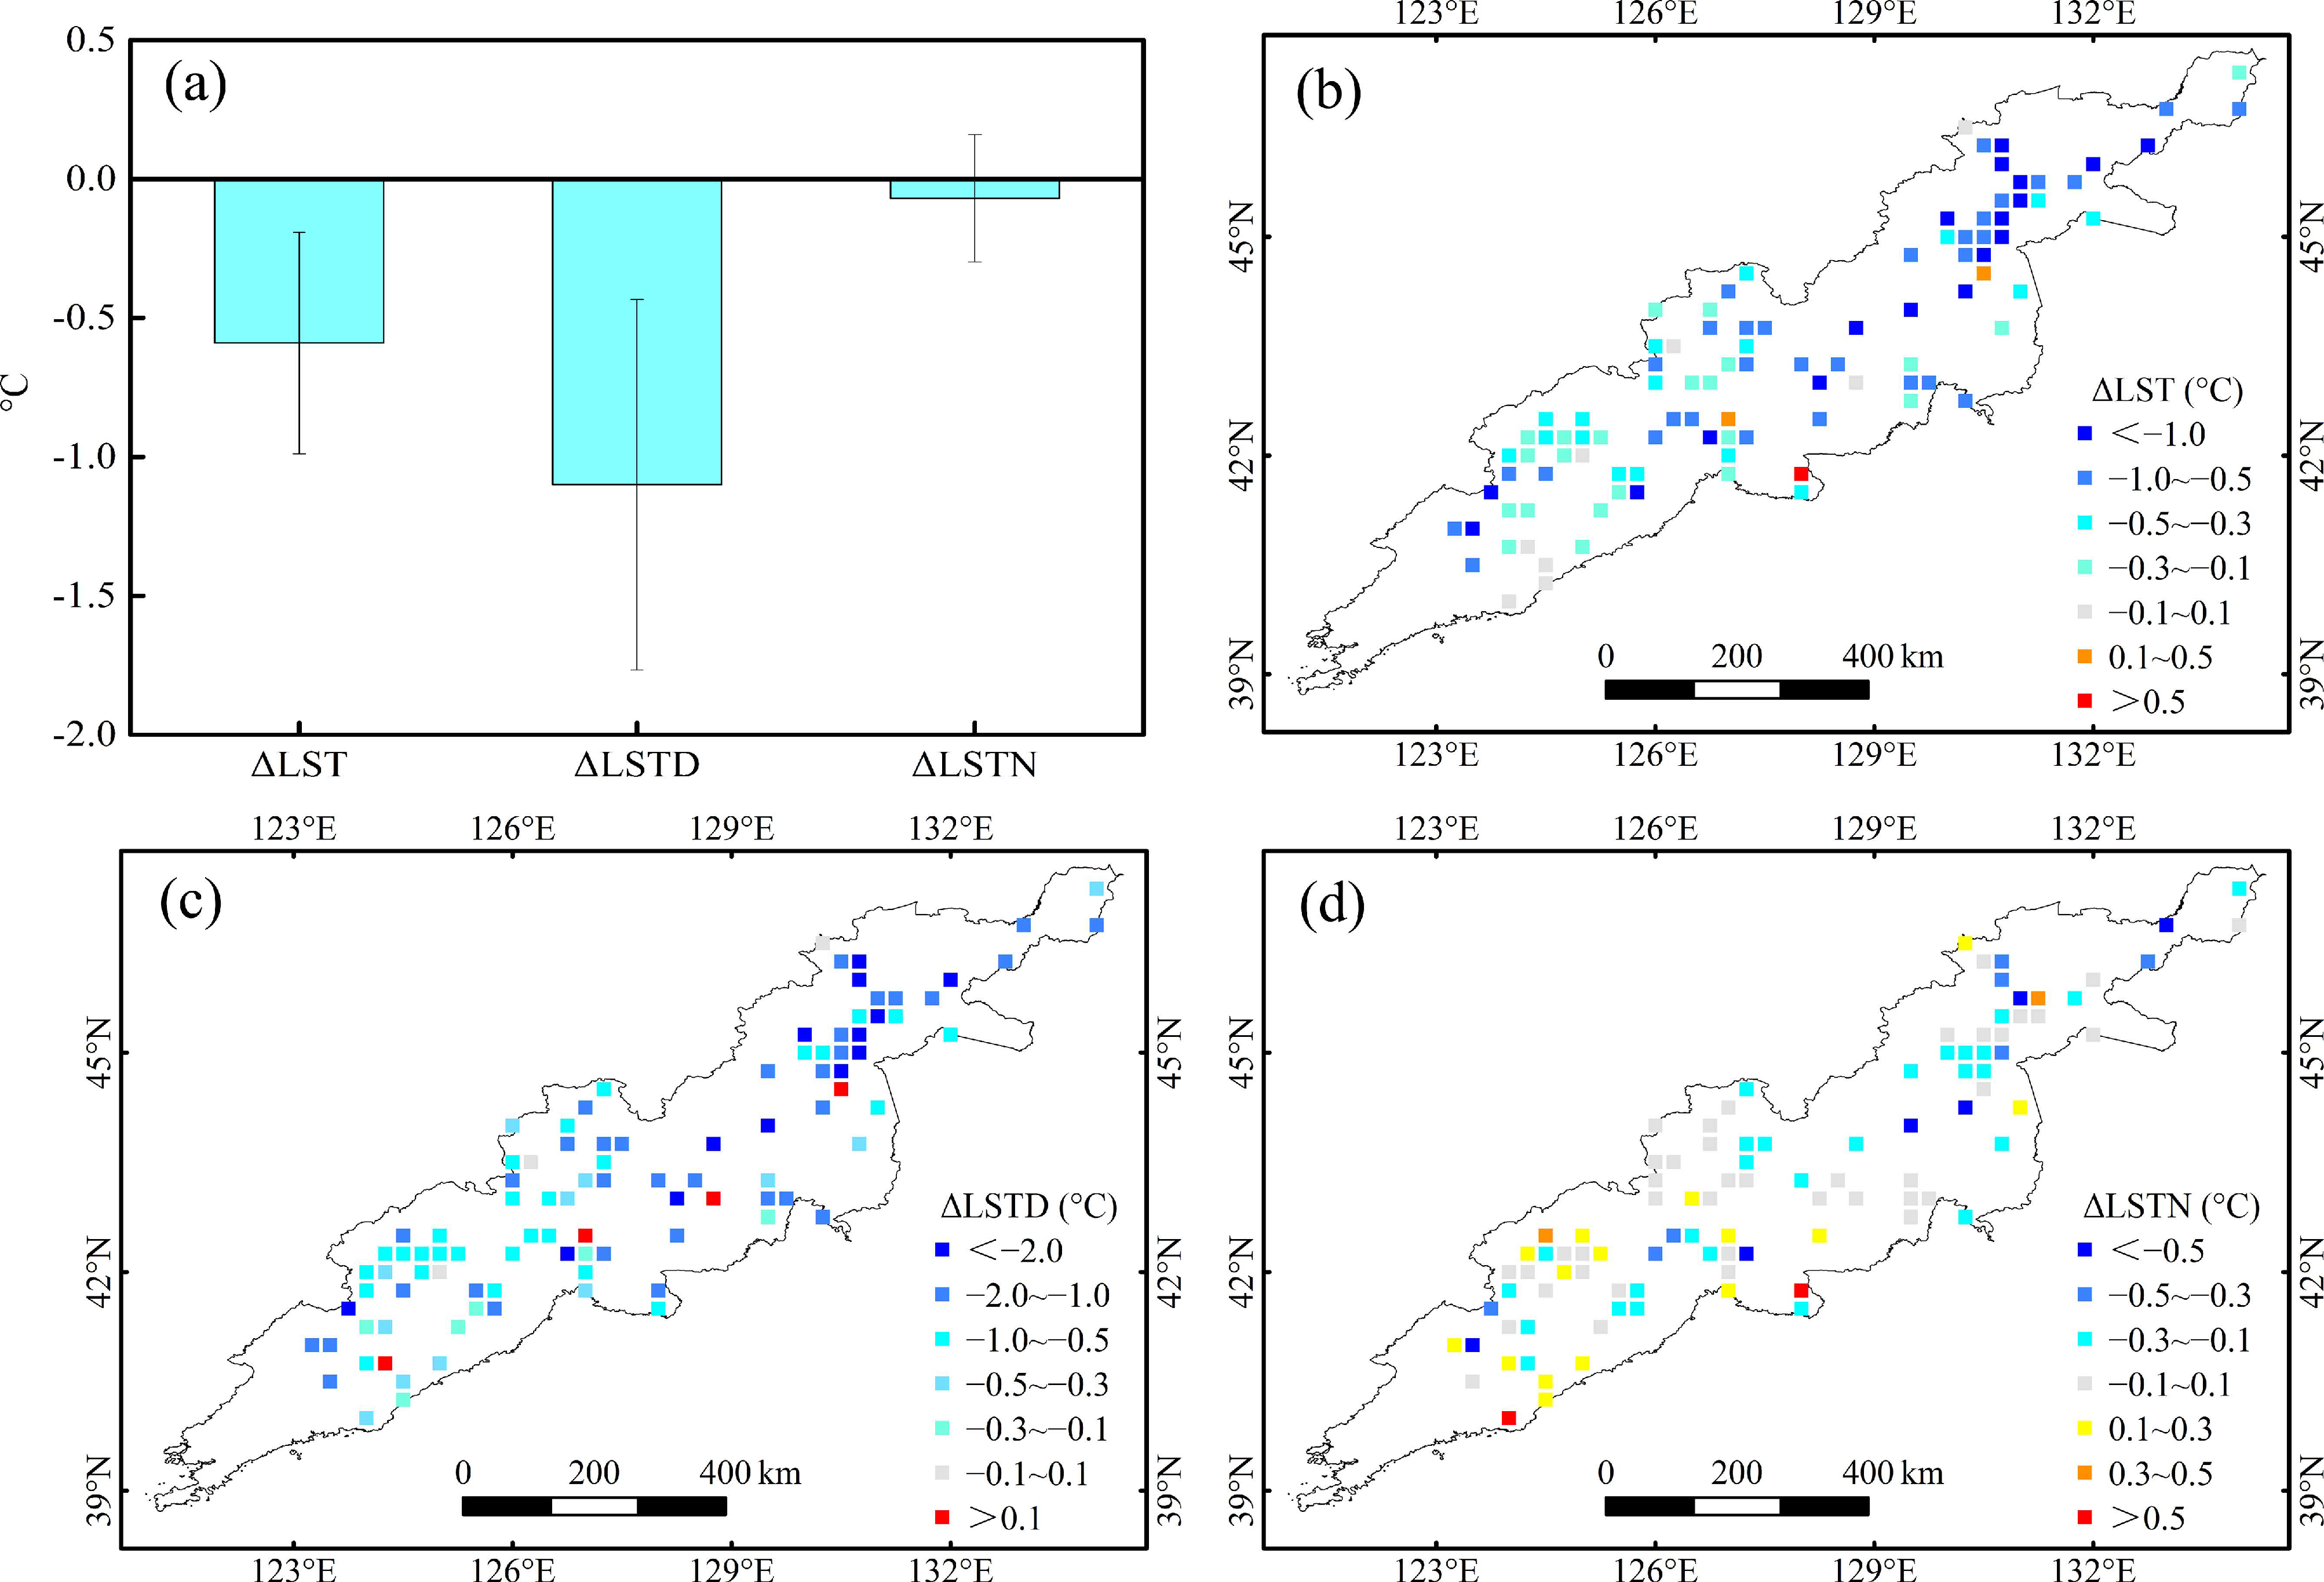
There are two types of forest changes: forest change (conversion between forest and open land) and forest coverage change. In this study, we explored the impact of forests and forest coverage changes on summer surface temperature. The results showed that the summer ΔLSTD and ΔLSTN of open land minus forest were −1.10 ± 0.67 °C and −0.07 ± 0.23 °C, and the average daily mean ΔLST was also negative (−0.59 ± 0.40 °C) in Changbai Mountain from 2003 to 2017 (Figure 3a). Spatially, the ΔLST, ΔLSTD, and ΔLSTN of the conversion from open land to forest were negative in more than 92%, 94%, and 59% of the grid cells, respectively. The negative values of ΔLST, ΔLSTD, and ΔLSTN were the smallest in the northeast region of Changbai Mountain (Figure 3b–d).
From 2003 to 2017, the ΔLSTD, ΔLSTN, and ΔLST between high- and low-coverage forest were negative (−0.66 ± 0.44 °C, −0.04 ± 0.26 °C, and −0.35 ± 0.22 °C, respectively) in Changbai Mountain during the summer (Figure 4a). The long-term averaged LST and LSTD differences between high- and low-coverage forest were statistically significant (p < 0.05), while the LSTN difference between high- and low-coverage forest was not significant. Spatially, the ΔLST, ΔLSTD, and ΔLSTN between high- and low-coverage forest were negative in more than 98%, 92%, and 55% of the grid cells, respectively. The negative values of ΔLST, ΔLSTD, and ΔLSTN were the smallest in the northeast region of Changbai Mountain (Figure 4b–d).

4. Discussion

4.1. Changes of Forests in Changbai Mountain

The results showed that the distribution of forests in Changbai Mountain had increased over the past 20 years. This may be related to the implementation of the Natural Forest Protection Project (NFCP) in Changbai Mountain since 1998 [27,46]. In the past 20 years, the forest coverage in Changbai Mountain showed an increasing trend. This result is consistent with a previous study finding that the vegetation coverage of Changbai Mountain showed an increasing trend over the past decade [47]. The reason may be that global climate warming promotes vegetation photosynthesis and is conducive to the growth of forest vegetation [28]. The most significant increase in forest vegetation coverage was mainly distributed in the Changbai Mountain Nature Reserve. Due to manmade protection, the forest vegetation coverage in these regions shows an increasing trend [47].

4.2. Effects of Forest Changes on Summer Surface Temperatures in Changbai Mountain

The change in vegetation can affect the surface temperature by affecting the two biogeophysical factors of ET and albedo [2]. Forests and increasing forest coverage generally increased evapotranspiration and reduced albedo. With the increase in ET, the latent heat flux increases and results in a decrease in the surface temperature. The albedo decreases, and the absorbed shortwave radiation increases, which increases the surface temperature [48]. The net effect of vegetation change on the surface temperature is the balance of the effects between two competing biophysical effects, ET and albedo, on the surface temperature [8,48,49]. During the summer, the evapotranspiration of vegetation is strong, and the cooling effect of increased evapotranspiration may exceed the warming effect of reduced albedo [50].
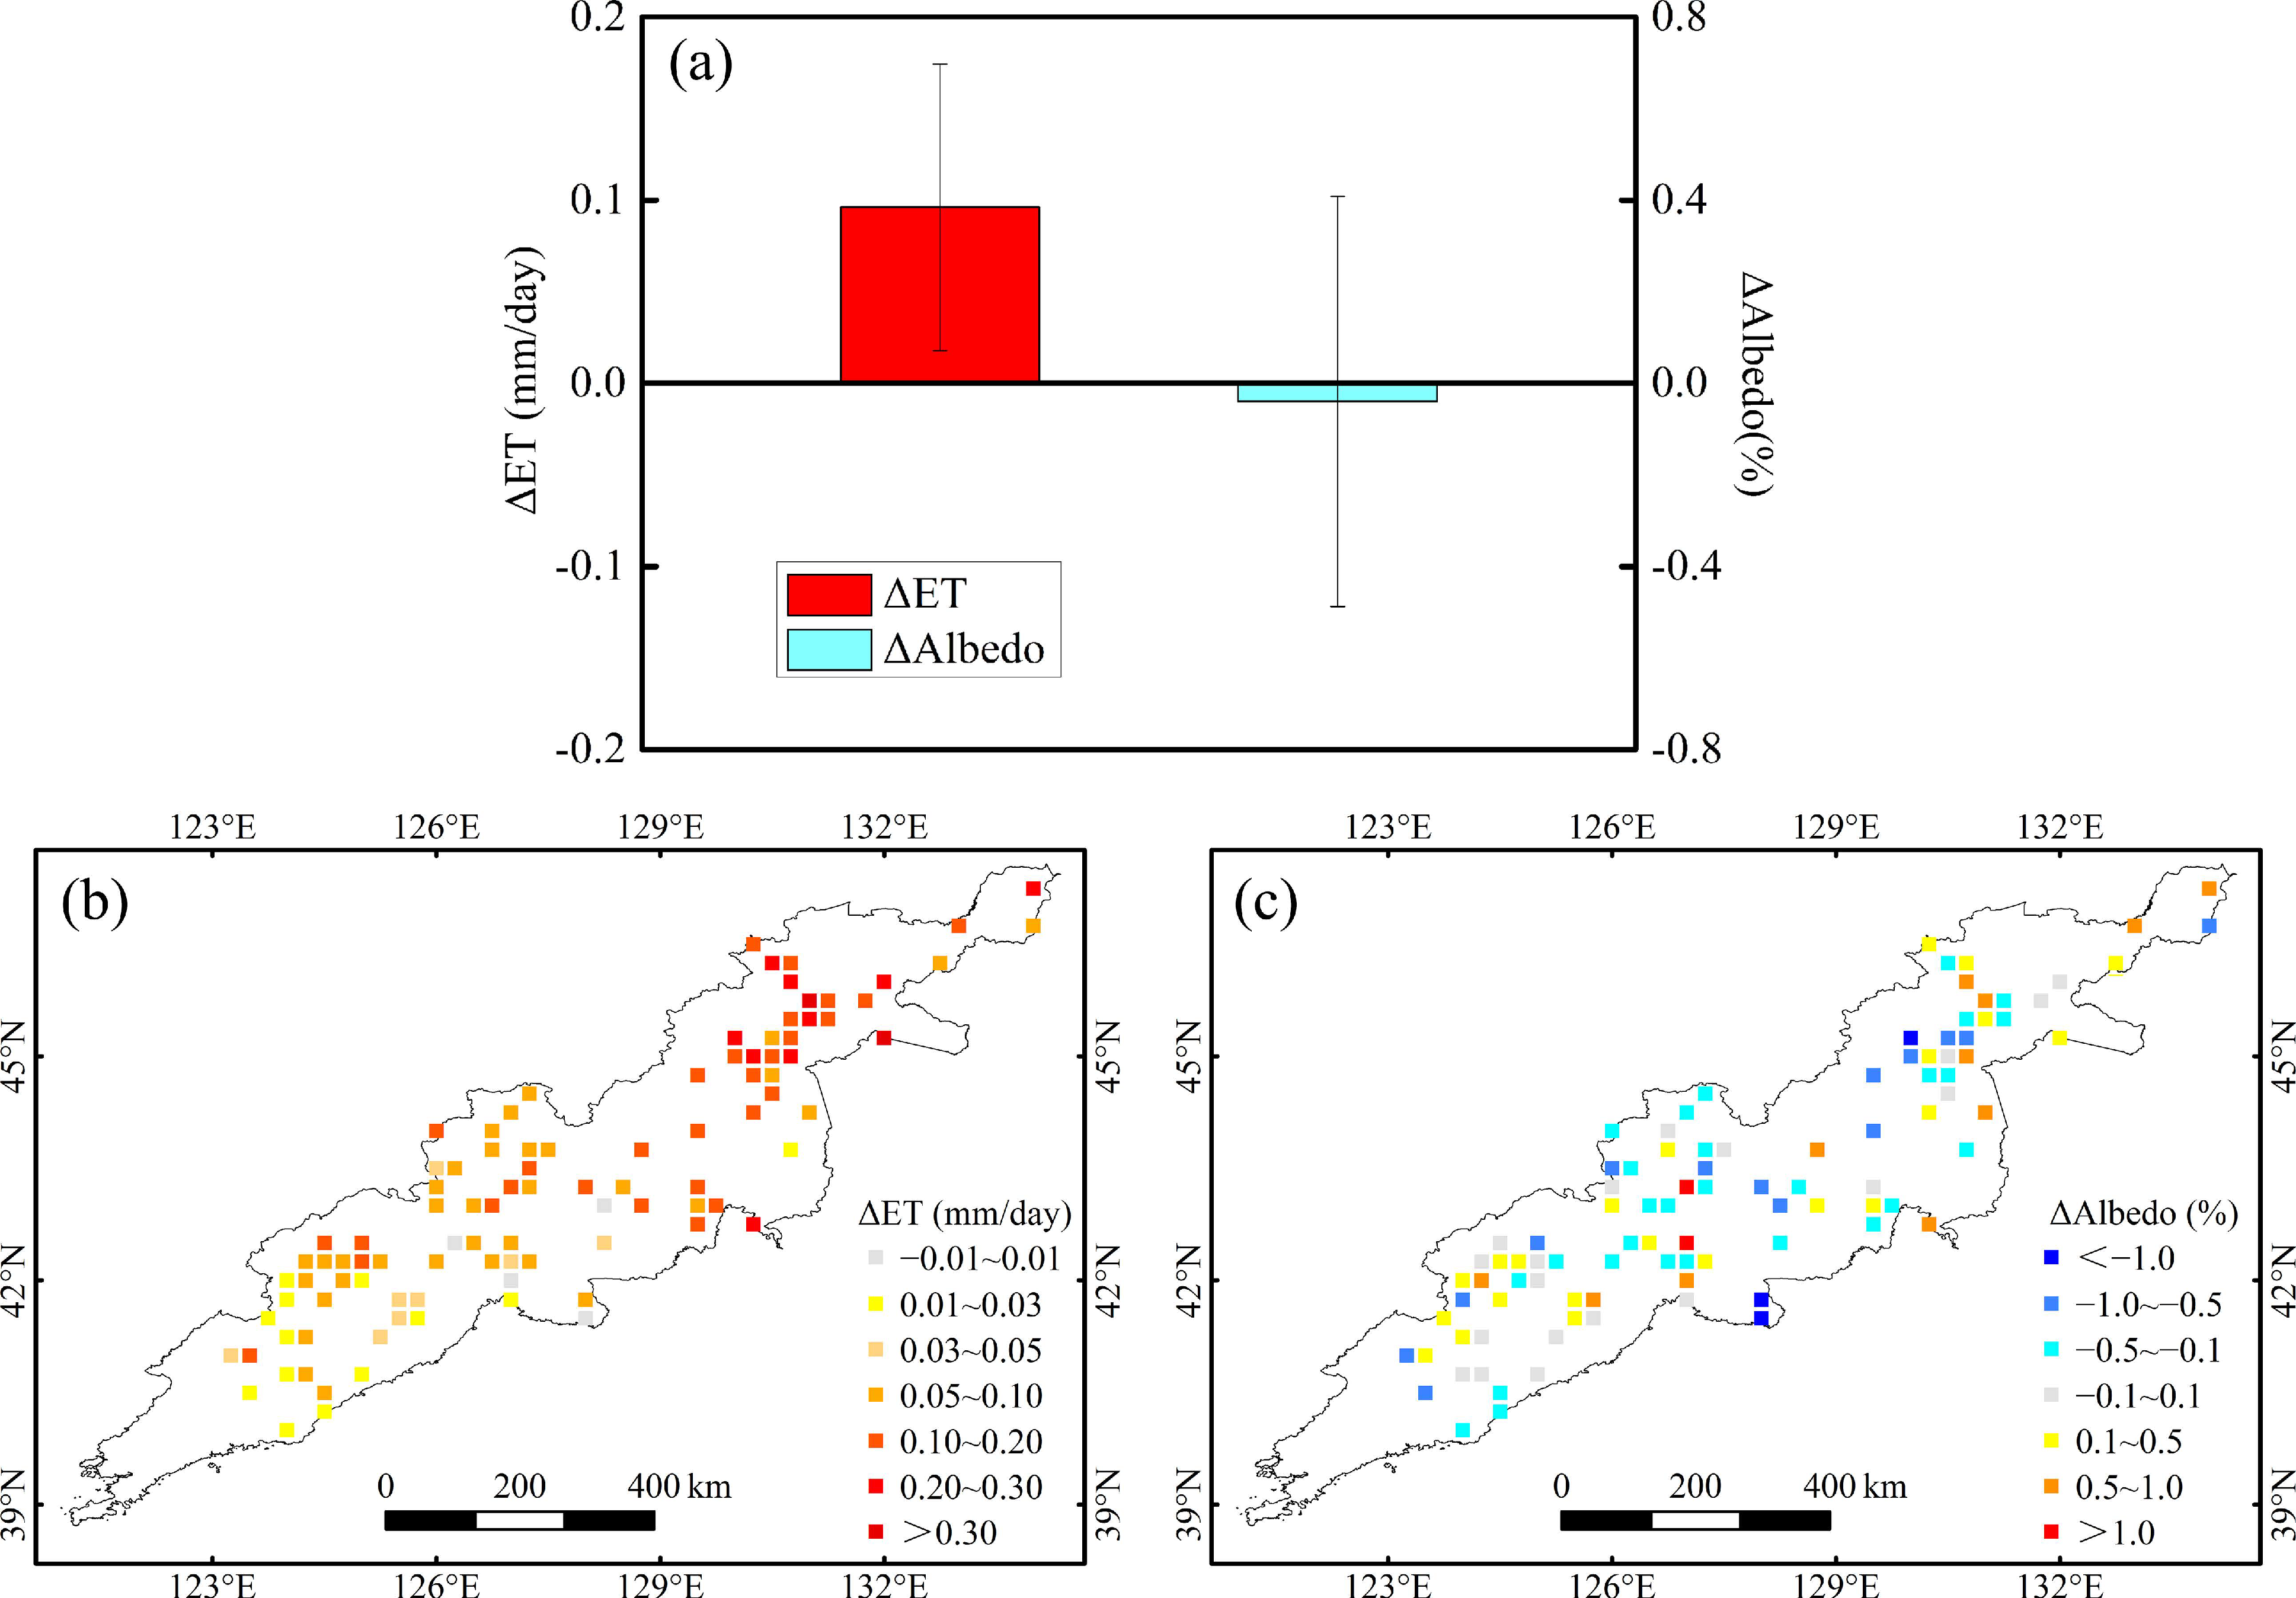
To understand how vegetation change affects surface temperature, we further analyzed ΔAlbedo and ΔET of forests and forest coverage changes. The results showed that the summer ΔAlbedo between forest and nearby open land was negative (−0.04 ± 0.45%) and ΔET was positive (0.10 ± 0.08 mm/day) in Changbai Mountain from 2003 to 2017 (Figure 5a). This illustrates that the average albedo in the forest was lower than that in the open land, and the summer ET of forest was higher than that of open land (Figure 5b,c). Our results indicate that conversion from open land to forest decreased the summer daytime and nighttime surface temperatures in Changbai Mountain, and the cooling effect of forests on temperature during the daytime was larger than that on temperature at night. Therefore, forests decrease the average temperature mainly by decreasing the daytime temperature. Forests (lower albedo) can absorb more shortwave radiation during the daytime [6,8,51,52,53], which may lead to a warming effect [48]. However, the evaporative cooling effect mainly occurs during the daytime [49], and the strong evapotranspiration of forests can lead to a greater latent heat loss, which offsets this net energy gain [2]. Therefore, forests have a strong cooling effect during the daytime. In general, land surface absorbs and stores solar energy during the daytime and releases energy during the nighttime. Therefore, nighttime surface temperature is closely related to the temperature during the daytime [53]. During the summer, the evaporative cooling effect is strong during the daytime [50], and the decrease of temperature during the daytime can be extended to nighttime [49,53]. In addition, forests can prevent long-wave radiation from escaping into the air during the nighttime and play a certain role in warming nighttime temperature [52,54,55]. Therefore, we can conclude that the weak nighttime warming of the forests does not offset the cooling effect extended from the daytime, resulting in a weak cooling effect of forests on nighttime temperature in Changbai Mountain.
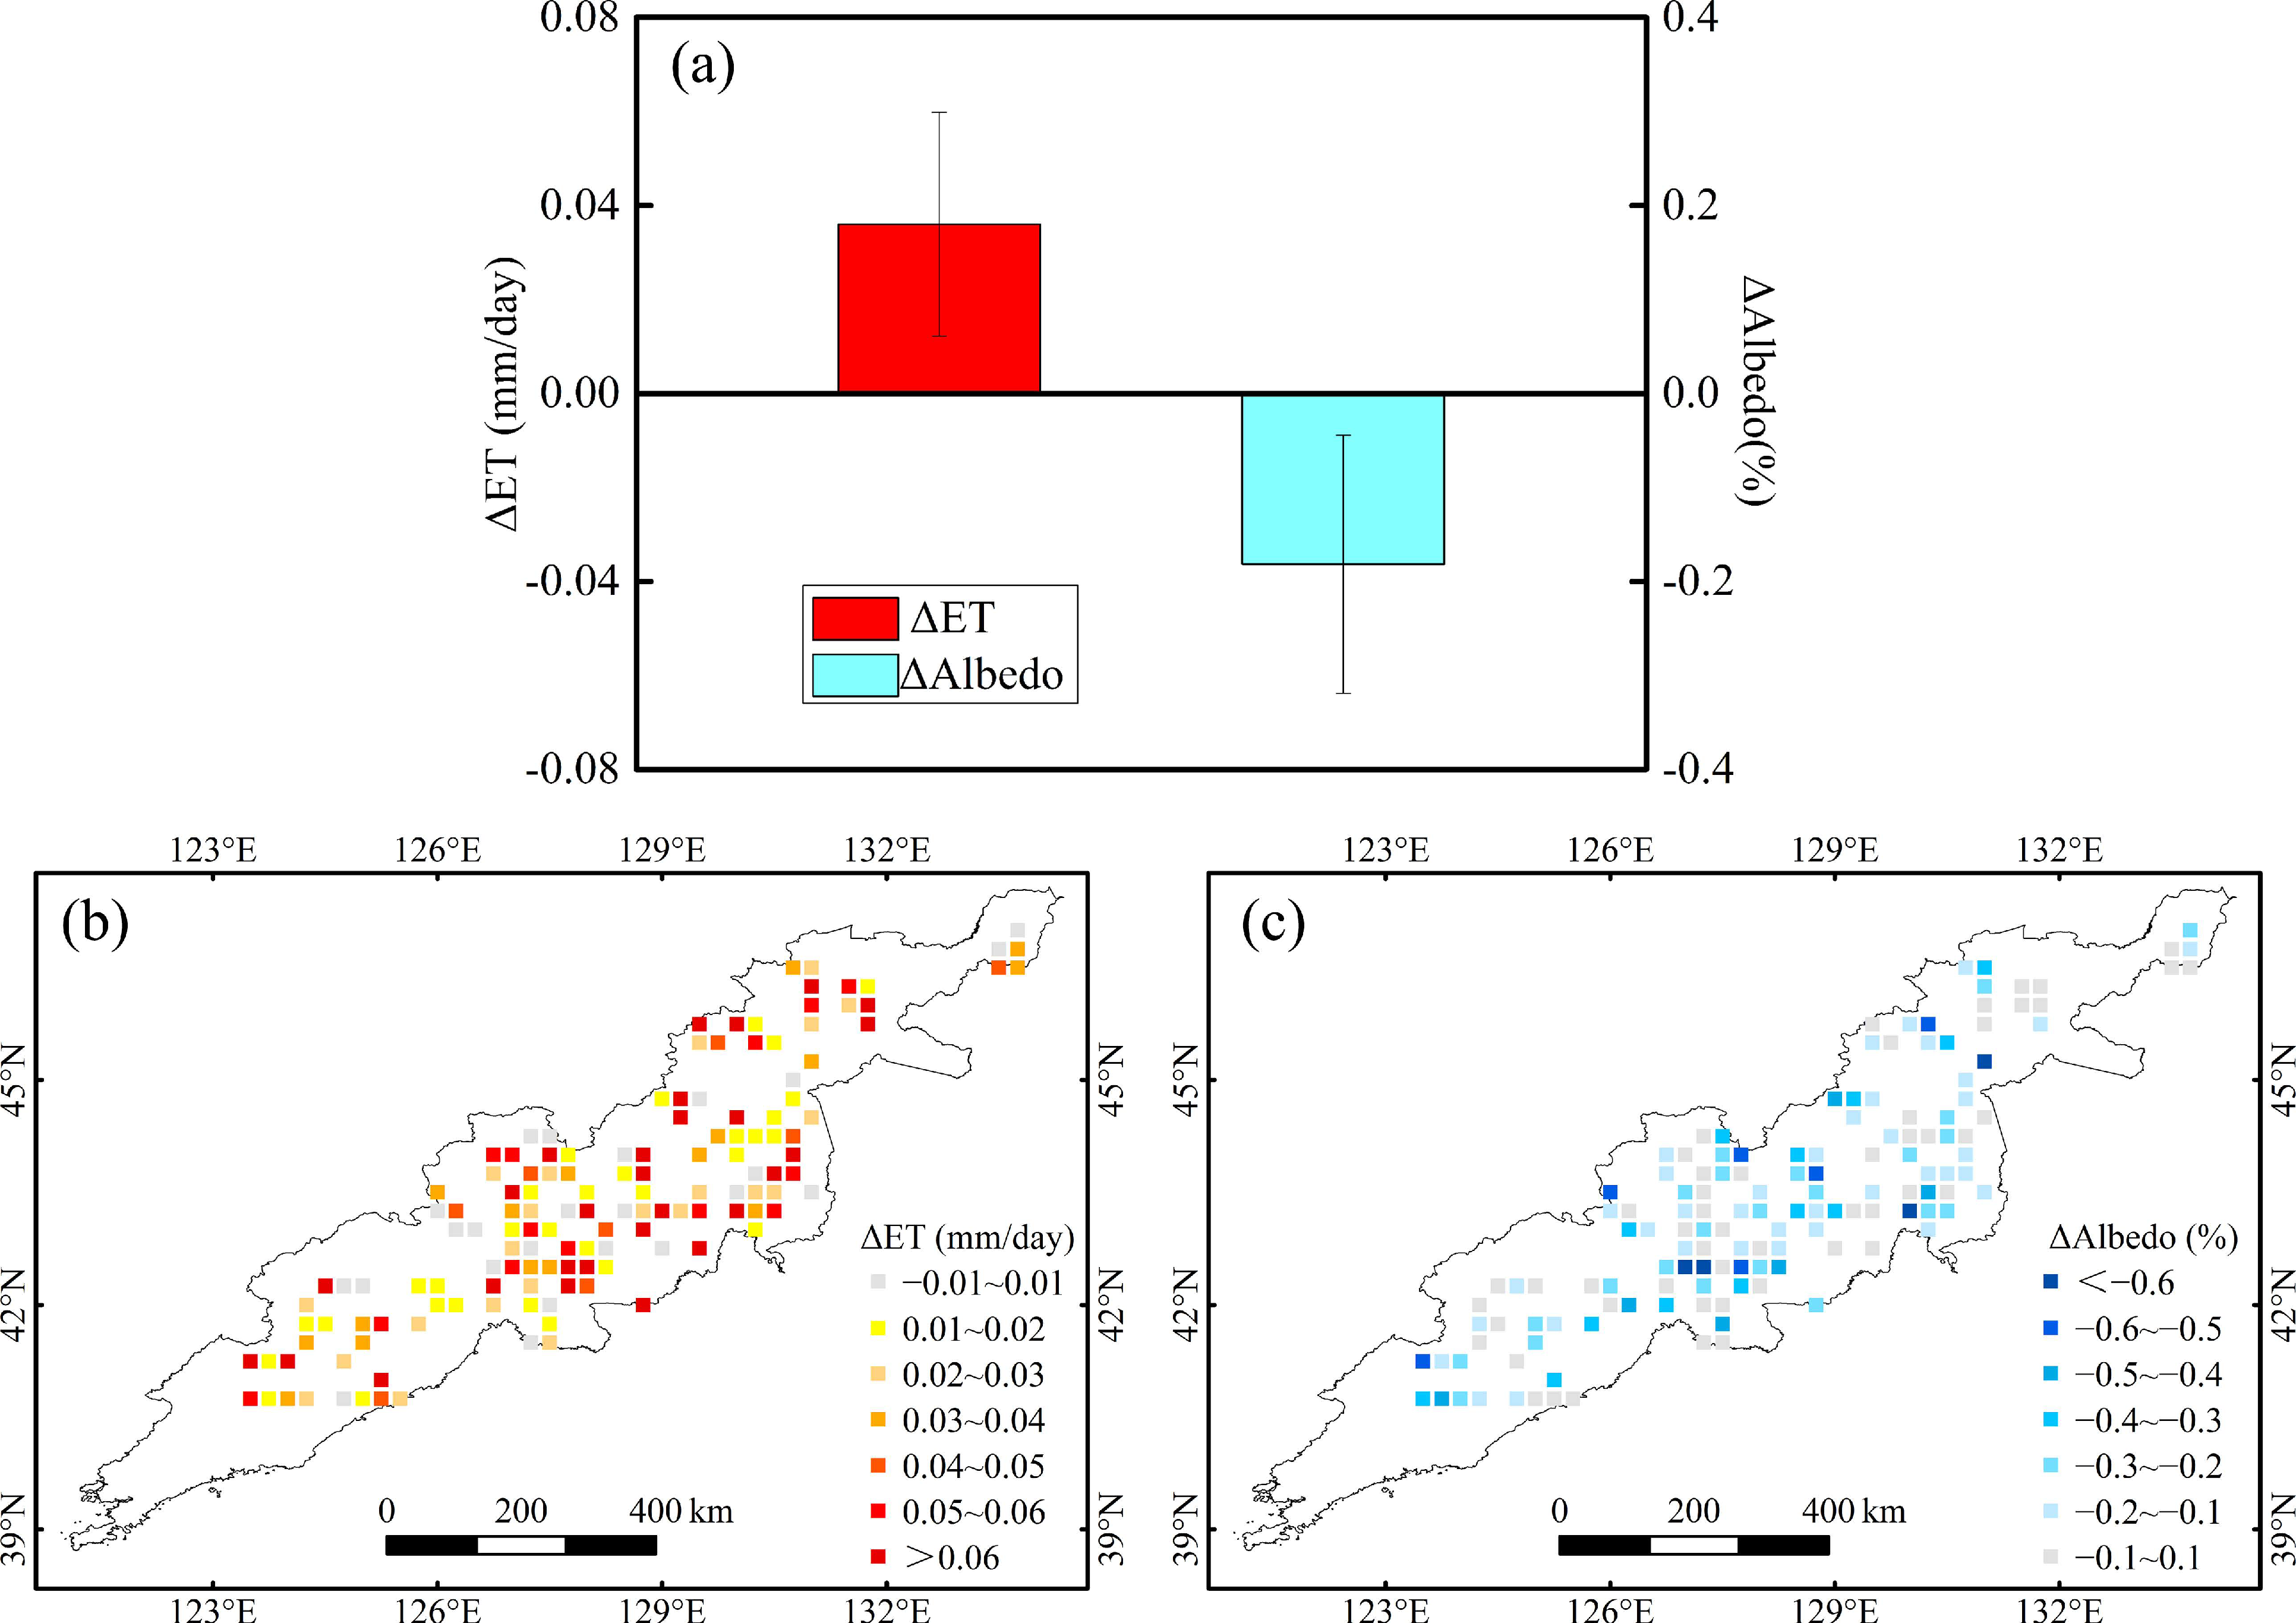
Our results also suggest that the increase in forest coverage had a significant cooling effect on the surface temperature during the daytime but had a weak cooling effect on the surface temperature during the nighttime in Changbai Mountain. The increase in forest coverage was related to a decrease in ΔAlbedo and an increase in ΔET by −0.18 ± 0.14% and 0.04 ± 0.02 mm/day in Changbai Mountain from 2003 to 2017 (Figure 6a). We found that the average albedo of high-coverage forest was less than that of low-coverage forest (Figure 6b), potentially leading to a warming effect [48]. However, during the daytime, summer ET of high coverage forest is greater than that of low-coverage forest (Figure 6c). The cooling effect caused by the increase in evapotranspiration offsets the warming effect caused by a decrease in albedo [18,19]. Therefore, the net impact of the increase in forest coverage on daytime surface temperature has a strong cooling effect. Evapotranspiration at night was negligible [49,56]. High forest coverage prevents more long-wave radiation from escaping into the air than low forest coverage. Therefore, the increase of forest coverage could have a warming effect on night surface temperature [52,54,55]. However, as the cooling effect on summer temperature due to increased evapotranspiration is strong during the daytime, the decrease of temperature during daytime can be extended to nighttime [49,53], which offsets the warming effect of increased forest coverage on nighttime temperature [50]. Therefore, the increase in forest coverage has a weak cooling effect on the nighttime temperature in most regions of Changbai Mountain (Figure 4). Because the increase of forest vegetation coverage can significantly reduce the surface temperature during the daytime, it has an obvious cooling effect on the average surface temperature in Changbai Mountain. This confirms the previous finding that forest coverage changes affect the local climate mainly by changing the temperature during the daytime [20,49]. Spatially, we found that the difference of LST between high- and low-coverage forest was larger in the northeast of Changbai Mountain (low elevation region), but smaller in the central region with high elevation (Figure 1 and Figure 4). It indicates that the effect of forest vegetation changes on the LST decreases with the increase of elevation. The reason may be that the regions with higher elevation have a lower temperature and the evaporation change caused by forest vegetation change is smaller [57]. Therefore, the cooling effect of increased forest coverage on the LST declines with the increase of elevation.
We calculated the correlation between LAI and LST, LSTD, LSTN, ET, and albedo differences between high- and low-coverage forest in Changbai Mountain. According to the correlation results, ΔLAI had a significant positive correlation with ΔET (p < 0.05) and a significant negative correlation with ΔLST and ΔLSTD (p < 0.05) (Figure 7). These results further confirm that with the increase in forest coverage, ET shows an increasing trend [58], while daytime surface temperature shows a decreasing trend.
There are some uncertainties in this study. Firstly, the remote sensing data (including LST, ET, LAI, and albedo) from satellites could contain some uncertainties [58,59,60,61], which may have some impact on the current research results. Second, because each pixel may not accurately reflect the actual land-use type in the 0.05° × 0.05° region, the uncertainty of land-use data may cause uncertainty in the results. Third, this study only considers the biophysical process of forests on the surface temperature. In the future, it is necessary to further analyze the impact of forest biochemical processes on the surface temperature [2].

5. Conclusions

This study analyzed the changes of forests and quantified, for the first time, the effects of both forest existence and forest coverage changes on summer surface temperatures in Changbai Mountain. The forest area and forest vegetation coverage increased in Changbai Mountain from 2003 to 2017. The increased forests were mainly transformed from open land, and the transformed area accounted for 1.90% of Changbai Mountain area. The increasing trend of summer LAI was about 0.01/decade in forests of Changbai Mountain. The forests and increasing forest coverage in Changbai Mountain had obvious cooling effects on summer surface temperature during the daytime. The strong increase in evapotranspiration during the daytime leads to the increase in latent heat flux, which accounts for the cooling effects. Because forests can prevent long-wave radiation from escaping into the air, and higher forest vegetation coverage can prevent more long-wave radiation than low forest vegetation coverage, the forests and increasing forest coverage could have some warming effects on temperature during the nighttime, offsetting part of the cooling effect extended from the daytime. Therefore, forests and increasing forest coverage had weak cooling effects on the night temperature in Changbai Mountain. Our results suggest that we should consider the effects of forest coverage change on climate in the models for accurately simulating regional climate change in Changbai Mountain. Future studies are still needed to combine the measured ground data and ecosystem process model to accurately quantify the effects of forest changes on regional climate in Changbai Mountain.

Author Contributions

Conceptualization, X.S., M.J. and X.L.; methodology, X.S.; formal analysis, J.Z.; data curation, J.Z. and Y.W.; writing—original draft preparation, J.Z.; writing—review and editing, X.S.; supervision, M.J. All authors have read and agreed to the published version of the manuscript.

Funding

This study was supported by National Key Research and Development Program of China (2019YFC0409101), National Natural Science Foundation of China (41971065), Natural Science Foundation of Jilin Province (20210101104JC), Youth Innovation Promotion Association, Chinese Academy of Sciences (2019235), and Key Research Program of Frontier Sciences, Chinese Academy of Sciences (ZDBS-LY-7019).

Data Availability Statement

Data are contained within the article.

Acknowledgments

The data presented in this paper are publicly available and can be downloaded from http://www.resdc.cn, accessed on 11 January 2021; http://www.geodata.cn, accessed on 10 January 2021.

Conflicts of Interest

The authors declare no conflict of interest. The funders had no role in the design of the study; in the collection, analyses, or interpretation of data; in the writing of the manuscript, or in the decision to publish the results.

References

  1. Zhang, Y.; Song, C. Impacts of afforestation, deforestation, and reforestation on forest cover in China from 1949 to 2003. J. For. 2006, 104, 383–387. [Google Scholar]
  2. Li, Y.; Zhao, M.; Motesharrei, S.; Mu, Q.; Kalnay, E.; Li, S. Local cooling and warming effects of forests based on satellite observations. Nat. Commun. 2015, 6, 6603. [Google Scholar] [CrossRef] [PubMed] [Green Version]
  3. Pang, G.; Chen, D.; Wang, X.; Lai, H. Spatiotemporal variations of land surface albedo and associated influencing factors on the Tibetan Plateau. Sci. Total Environ. 2022, 804, 150100. [Google Scholar] [CrossRef] [PubMed]
  4. Marland, G.; Pielke Sr., R.A.; Apps, M.; Avissar, R.; Betts, R.A.; Davis, K.J.; Xue, Y. The climatic impacts of land surface change and carbon management, and the implications for climate-change mitigation policy. Clim. Policy 2003, 3, 149–157. [Google Scholar] [CrossRef] [Green Version]
  5. Betts, R.A.; Falloon, P.D.; Goldewijk, K.K.; Ramankutty, N. Biogeophysical effects of land use on climate: Model simulations of radiative forcing and large-scale temperature change. Agric. For. Meteorol. 2007, 142, 216–233. [Google Scholar] [CrossRef]
  6. Bala, G.; Caldeira, K.; Wickett, M.; Phillips, T.J.; Lobell, D.B.; Delire, C.; Mirin, A. Combined climate and carbon-cycle effects of large-scale deforestation. Proc. Natl. Acad. Sci. USA 2007, 104, 6550–6555. [Google Scholar] [CrossRef] [PubMed] [Green Version]
  7. Anderson, R.G.; Canadell, J.G.; Randerson, J.T.; Jackson, R.B.; Hungate, B.A.; Baldocchi, D.D.; O’Halloran, T.L. Biophysical considerations in forestry for climate protection. Front. Ecol. Environ. 2011, 9, 174–182. [Google Scholar] [CrossRef] [Green Version]
  8. Bonan, G.B. Forests and climate change: Forcings, feedbacks, and the climate benefits of forests. Science 2008, 320, 1444–1449. [Google Scholar] [CrossRef] [PubMed] [Green Version]
  9. Betts, R.A. Offset of the potential carbon sink from boreal forestation by decreases in surface albedo. Nature 2000, 408, 187–190. [Google Scholar] [CrossRef]
  10. Notaro, M.; Liu, Z.Y. Observed vegetation-climate feedbacks in the United States. J. Clim. 2005, 19, 0260. [Google Scholar] [CrossRef] [Green Version]
  11. Feddema, J.J. The importance of land-cover change in simulating future climates. Science 2005, 310, 1674–1678. [Google Scholar] [CrossRef] [PubMed] [Green Version]
  12. Liu, Z.; Notaro, M.; Kutzbach, J.; Liu, N. Assessing global vegetation climate feedbacks from observations. J. Clim. 2006, 19, 787–814. [Google Scholar] [CrossRef]
  13. Lim, Y.K.; Cai, M.; Kalnay, E.; Zhou, L. Impact of vegetation types on surface temperature change. J. Appl. Meteorol. Clim. 2008, 47, 411–424. [Google Scholar] [CrossRef] [Green Version]
  14. Ban-Weiss, G.A.; Bala, G.; Cao, L.; Pongratz, J.; Caldeira, K. Climate forcing and response to idealized changes in surface latent and sensible heat. Environ. Res. Lett. 2011, 6, 034032. [Google Scholar] [CrossRef] [Green Version]
  15. Bateni, S.M.; Entekhabi, D. Relative efficiency of land surface energy balance components. Water Resour. Res. 2012, 48, 4510. [Google Scholar] [CrossRef]
  16. Yang, X.C.; Zhang, Y.L.; Ding, M.J.; Liu, L.S.; Wang, Z.F.; Gao, D.W. Observational evidence of the impact of vegetation cover on surface air temperature change in China. Chin. J. Geophys. 2013, 53, 261–269. [Google Scholar] [CrossRef]
  17. Li, Y.; Zhao, M.; Mildrexler, D.J.; Motesharrei, S.; Mu, Q.; Kalnay, E.; Wang, K. Potential and actual impacts of deforestation and afforestation on land surface temperature. J. Geophys. Res. Atmos. 2016, 121, 14–372. [Google Scholar] [CrossRef]
  18. Zeng, Z.; Piao, S.; Li, L.; Zhou, L.; Ciais, P.; Wang, T.; Li, Y.; Lian, X.; Wood, E.F.; Friedlingstein, P.; et al. Climate mitigation from vegetation biophysical feedbacks during the past three decades. Nat. Clim. Chang. 2017, 7, 432–436. [Google Scholar] [CrossRef]
  19. Forzieri, G.; Alkama, R.; Miralles, D.G.; Cescatti, A. Satellites reveal contrasting responses of regional climate to the widespread greening of Earth. Science 2017, 356, 1180–1184. [Google Scholar] [CrossRef] [Green Version]
  20. Alkama, R.; Cescatti, A. Biophysical climate impacts of recent changes in global forest cover. Science 2016, 351, 600–604. [Google Scholar] [CrossRef] [Green Version]
  21. Oleson, K.W.; Bonan, G.B.; Levis, S.; Vertenstein, M. Effects of land use change on North American climate: Impact of surface datasets and model biogeophysics. Clim. Dynam. 2004, 23, 117–132. [Google Scholar] [CrossRef]
  22. He, G.; Zhao, Y.; Wang, J.; Wang, Q.; Zhu, Y. Impact of large-scale vegetation restoration project on summer land surface temperature on the Loess Plateau, China. J. Arid Land 2018, 10, 892–904. [Google Scholar] [CrossRef] [Green Version]
  23. Fall, S.; Niyogi, D.; Gluhovsky, A.; Sr, R.; Kalnay, E.; Rochon, G. Impacts of land use land cover on temperature trends over the continental United States: Assessment using the North American Regional Reanalysis. Int. J. Climatol. 2010, 30, 1980–1993. [Google Scholar] [CrossRef] [Green Version]
  24. Wang, X.; Chen, D.; Pang, G.; Ou, T.; Yang, M.; Wang, M. A climatology of surface-air temperature difference over the Tibetan Plateau: Results from multi-source reanalyses. Int. J. Climatol. 2020, 40, 6080–6094. [Google Scholar] [CrossRef] [Green Version]
  25. Wang, X.; Chen, D.; Pang, G.; Anwar, S.; Ou, T.; Yang, M. Effects of cumulus parameterization and land-surface hydrology schemes on Tibetan Plateau climate simulation during the wet season: Insights from the RegCM4 model. Clim. Dyn. 2021, 57, 1853–1879. [Google Scholar] [CrossRef]
  26. Wu, G.; Xiao, H.; Zhao, J.; Shao, G.; Li, J. Forest ecosystem services of Changbai Mountain in China. Sci. China Ser. C Life Sci. 2002, 45, 21–32. [Google Scholar] [CrossRef] [PubMed]
  27. Zhang, P.; Shao, G.; Zhao, G.; Le Master, D.C.; Parker, G.R.; Dunning, J.B.; Li, Q. China’s forest policy for the 21st century. Science 2000, 288, 2135–2136. [Google Scholar] [CrossRef] [Green Version]
  28. Hou, G.; Zhang, H.; Wang, Y. Vegetation dynamics and its relationship with climatic factors in the Changbai Mountain natural reserve. J. Mt. Sci. 2011, 8, 865–875. [Google Scholar] [CrossRef]
  29. De Wit, H.A.; Bryn, A.; Hofgaard, A.; Karstensen, J.; Kvalevåg, M.M.; Peters, G.P. Climate warming feedback from mountain birch forest expansion: Reduced albedo dominates carbon uptake. Glob. Chang. Biol. 2014, 20, 2344–2355. [Google Scholar] [CrossRef]
  30. Van, D.K.R.; Lhermitte, S.; Veraverbeke, S.; Goossens, R. Spatio-temporal variability in remotely sensed land surface temperature, and its relationship with physiographic variables in the russian altay mountains. Int. J. Appl. Earth Obs. 2013, 20, 4–19. [Google Scholar]
  31. Tesař, M.; Šír, M.; Lichner, L.U.; Zelenková, E. Influence of vegetation cover on thermal regime of mountainous catchments. Biologia 2006, 61, S311–S314. [Google Scholar] [CrossRef] [Green Version]
  32. Shen, X.; Jiang, M.; Lu, X.; Liu, X.; Liu, B.; Zhang, J.; Wang, X.; Tong, S.; Lei, G.; Wang, S.; et al. Aboveground biomass and its spatial distribution pattern of herbaceous marsh vegetation in China. Sci. China Earth Sci. 2021, 64, 1115–1125. [Google Scholar] [CrossRef]
  33. Zhu, H.F.; Fang, X.Q.; Shao, X.M.; Yin, Z.Y. Tree ring-based February-April temperature reconstruction for Changbai Mountain in Northeast China and its implication for East Asian winter monsoon. Clim. Past 2009, 5, 661–666. [Google Scholar] [CrossRef] [Green Version]
  34. Jiang, Y.; Cao, Y.; Han, S.; Zhang, J.; Hao, L. Spatial Variation and Temporal Instability in the Growth/Climate Relationship of White Birch (Betula platyphylla Suk) in the Changbai Mountain, China. Forests 2021, 12, 589. [Google Scholar] [CrossRef]
  35. Gai, X.; Wang, S.; Zhou, L.; Wu, J.; Zhou, W.; Bi, J.; Yu, D. Spatiotemporal evidence of tree-growth resilience to climate variations for Yezo spruce (Picea jezoensis var. komarovii) on Changbai Mountain, Northeast China. J. For. Res. 2021, 31, 927–936. [Google Scholar] [CrossRef]
  36. Zhao, S. Biodiversity and conservation in Changbai Mountain biosphere reserve. Ambio 1999, 28, 639–641. [Google Scholar]
  37. Du, L.; Zhou, T.; Zou, Z.; Zhao, X.; Huang, K.; Wu, H. Mapping forest biomass using remote sensing and national forest inventory in China. Forests 2014, 5, 1267–1283. [Google Scholar] [CrossRef] [Green Version]
  38. Giardina, F.; Konings, A.G.; Kennedy, D.; Alemohammad, S.H.; Oliveira, R.S.; Uriarte, M.; Gentine, P. Tall Amazonian forests are less sensitive to precipitation variability. Nat. Geosci. 2018, 11, 405–409. [Google Scholar] [CrossRef]
  39. Xiong, T.; Zhang, H.; Zhao, J.; Zhang, Z.; Guo, X.; Zhu, Z.; Shan, Y. Diverse Responses of Vegetation Dynamics to Snow Cover Phenology over the Boreal Region. Forests 2019, 10, 376. [Google Scholar] [CrossRef] [Green Version]
  40. Zhou, J.; Liang, S.; Cheng, J.; Wang, Y.; Ma, J. The GLASS Land Surface Temperature Product. IEEE J. Sel. Top. Appl. Earth Obs. Remote. Sens. 2019, 12, 493–507. [Google Scholar] [CrossRef]
  41. Liang, S. The long-term Global LAnd Surface Satellite (GLASS) product suite and applications. In Proceedings of the AGU Fall Meeting Abstracts, Washington, DC, USA, 16 December 2015. GC34C-07. [Google Scholar]
  42. Qu, Y.; Liu, Q.; Liang, S.; Wang, L.; Liu, N.; Liu, S. Direct-estimation algorithm for mapping daily land-surface broadband albedo from MODIS data. IEEE Trans. Geosci. Remote. Sens. 2013, 52, 907–919. [Google Scholar] [CrossRef]
  43. Yao, Y.; Liang, S.; Li, X.; Chen, J.; Wang, K.; Jia, K.; Cheng, J.; Jiang, B.; Fisher, J.B.; Mu, Q.; et al. A satellite-based hybrid algorithm to determine the Priestley–Taylor parameter for global terrestrial latent heat flux estimation across multiple biomes. Remote Sens. Environ. 2015, 165, 216–233. [Google Scholar] [CrossRef] [Green Version]
  44. Xiao, Z.; Liang, S.; Wang, J.; Xiang, Y.; Zhao, X.; Song, J. Long-time-series global land surface satellite leaf area index product derived from MODIS and AVHRR surface reflectance. IEEE Trans. Geosci. Remote. Sens. 2016, 54, 5301–5318. [Google Scholar] [CrossRef]
  45. Li, Y.; Piao, S.; Li, L.Z.X.; Chen, A.; Wang, X.; Ciais, P.; Huang, L.; Lian, X.; Peng, S.; Zeng, Z.; et al. Divergent hydrological response to large-scale afforestation and vegetation greening in China. Sci. Adv. 2018, 4, eaar4182. [Google Scholar] [CrossRef] [PubMed] [Green Version]
  46. Wang, X.; Dai, L.; Qi, G.; Yang, W.; Wang, Q. Forest Biomass Dynamics in Typical Changbai Mountain Forest Area, Northeast of China. In Proceedings of the International Conference on Bioinformatics and Biomedical Engineering (iCBBE 2010), Chengdu, China, 18–20 June 2010; pp. 1–4. [Google Scholar]
  47. Liu, Z.F.; Nan, Y.; Hao, H.U.; Dong, Y.H.; Yang, Y.; Zhou, P.; Ji, Z. Vegetation cover changes in Changbai mountain from 2000 to 2008. Acta Bot. Boreal. Occident. Sin. 2010, 30, 391–398. (In Chinese) [Google Scholar]
  48. Piao, S.; Wang, X.; Park, T.; Chen, C.; Lian, X.; He, Y.; Bjerke, J.W.; Chen, A.; Ciais, P.; Tømmervik, H.; et al. Characteristics, drivers and feedbacks of global greening. Nat. Rev. Earth Environ. 2019, 1, 1–14. [Google Scholar]
  49. Lee, X.; Goulden, M.; Hollinger, D.; Barr, A.; Black, T.; Bohrer, G.; Bracho, R.; Drake, B.; Goldstein, A.; Gu, L.; et al. Observed increase in local cooling effect of deforestation at higher latitudes. Nature 2011, 479, 384–387. [Google Scholar] [CrossRef]
  50. Liu, Z.; Ballantyne, A.P.; Annie, C.L. Increases in land surface temperature in response to fire in siberian boreal forests and their attribution to biophysical processes. Geophys. Res. Lett. 2018, 45, 6485–6494. [Google Scholar] [CrossRef]
  51. Betts, R.A. Biogeophysical impacts of land use on present-day climate: Near-surface temperature change and radiative forcing. Atmos. Sci. Lett. 2001, 2, 39–51. [Google Scholar] [CrossRef]
  52. Peng, S.S.; Piao, S.; Zeng, Z.; Ciais, P.; Zeng, H. Afforestation in China cools local land surface temperature. Proc. Natl. Acad. Sci. USA 2014, 111, 2915–2919. [Google Scholar] [CrossRef] [Green Version]
  53. Shen, X.; Liu, B.; Jiang, M.; Lu, X. Marshland Loss Warms Local Land Surface Temperature in China. Geophys. Res. Lett. 2020, 47, e2020GL087648. [Google Scholar] [CrossRef] [Green Version]
  54. Michiles, A.; Gielow, R. Above-ground thermal energy storage rates, trunk heat fluxes and surface energy balance in a central amazonian rainforest. Agr. For. Meteorol. 2008, 148, 917–930. [Google Scholar] [CrossRef]
  55. D’Odorico, P.; He, Y.; Collins, S.; De Wekker, S.F.J.; Engel, V.; Fuentes, J.D. Vegetation–microclimate feedbacks in woodland–grassland ecotones. Glob. Ecol. Biogeogr. 2013, 22, 364–379. [Google Scholar] [CrossRef]
  56. Wan, Z. New refinements and validation of the modis land-surface temperature/emissivity products. Remote Sens. Environ. 2008, 112, 59–74. [Google Scholar] [CrossRef]
  57. He, J.; Zhao, W.; Li, A.; Wen, F.; Yu, D. The impact of the terrain effect on land surface temperature variation based on landsat-8 observations in mountainous areas. Int. J. Remote Sens. 2018, 40, 1–20. [Google Scholar] [CrossRef]
  58. Shen, X.; Liu, B.; Henderson, M.; Wang, L.; Wu, Z.; Wu, H.; Jiang, M.; Lu, X. Asymmetric effects of daytime and nighttime warming on spring phenology in the temperate grasslands of China. Agric. For. Meteorol. 2018, 259, 240–249. [Google Scholar] [CrossRef]
  59. Shen, X.; Liu, B.; Li, G.; Yu, P.; Zhou, D. Impacts of grassland types and vegetation cover changes on surface air temperature in the regions of temperate grassland of China. Theor. Appl. Climatol. 2016, 126, 141–150. [Google Scholar] [CrossRef]
  60. Shen, X.; Liu, B.; Xue, Z.; Jiang, M.; Lu, X.; Zhang, Q. Spatiotemporal variation in vegetation spring phenology and its response to climate change in freshwater marshes of Northeast China. Sci. Total Environ. 2019, 666, 1169–1177. [Google Scholar] [CrossRef] [PubMed]
  61. Wang, Y.; Shen, X.; Jiang, M.; Tong, S.; Lu, X. Spatiotemporal change of aboveground biomass and its response to climate change in marshes of the Tibetan Plateau. Int. J. Appl. Earth Obs. Geoinf. 2021, 102, 102385. [Google Scholar] [CrossRef]
Figure 1. The location and elevation of Changbai Mountain.
Forests 12 01551 g001
Figure 2. Changes of distribution (a) and vegetation coverage (b) of forests in Changbai Mountain from 2003 to 2017.
Forests 12 01551 g002
Figure 3. Regional average (a) and spatial distribution of differences in summer average surface temperature (ΔLST, °C) (b), daytime surface temperature (ΔLSTD, °C) (c), and nighttime surface temperature (ΔLSTN, °C) (d) between forest and open land in Changbai Mountain from 2003 to 2017.
Forests 12 01551 g003
Figure 4. Regional average (a) and spatial distribution of differences in summer average surface temperature (ΔLST, °C) (b), daytime surface temperature (ΔLSTD, °C) (c), and nighttime surface temperature (ΔLSTN, °C) (d) between high- and low-coverage forest in Changbai Mountain from 2003 to 2017.
Forests 12 01551 g004
Figure 5. Average value (a) and spatial distribution of differences in summer evapotranspiration (ΔET, mm/day) (b) and albedo (ΔAlbedo, %) (c) between forest and open land in Changbai Mountain from 2003 to 2017.
Forests 12 01551 g005
Figure 6. Average value (a) and spatial distribution of differences in summer evapotranspiration (ΔET, mm/day) (b) and albedo (ΔAlbedo, %) (c) between high- and low-coverage forest in Changbai Mountain from 2003 to 2017.
Forests 12 01551 g006
Figure 7. Spatial distribution of differences in leaf area index (ΔLAI) (a) and correlation coefficients (b) between differences in leaf area index (ΔLAI) and differences in summer average surface temperature (ΔLST), daytime surface temperature (ΔLSTD), and nighttime surface temperature (ΔLSTN), evapotranspiration (ΔET), and albedo (ΔAlbedo) between high- and low-coverage forest in Changbai Mountain from 2003 to 2017.
Forests 12 01551 g007
Publisher’s Note: MDPI stays neutral with regard to jurisdictional claims in published maps and institutional affiliations.