1. Introduction
With the rapid development of international freight transport containerization, the demand for container floors, as necessary parts of containers, developed synchronously, but they were subsequently improved, from the solid wood floor made of hardwood from a single tree species to plywood floors of hardwoods. Later, due to policy, the environment, cost and other reasons, a worldwide upsurge of the research and development of container floor replacement materials occurred. The mechanical properties of bamboo were explored to assess its usage as a structural material in place of wood [
1]. Comparisons of bamboo lamina with woods indicate that the average strength of bamboo laminae obtained under different loading conditions is better than softwoods and comparable with hardwoods [
2]. A bamboo–wood composite is formed by gluing bamboo and wood in the same or different structural unit forms [
3]. The bamboo–wood composite container floor (BWCCF) is widely used due to the advantages of abundance of resources, environmental characteristics, high mechanical properties, low cost, etc. It can be used as an ideal substitute for plywood floors of hardwood. As the main load-bearing part of container, the performance and quality of a BWCCF need to be assured, so it is necessary to effectively detect and control its mechanical properties.
A traditional test was used to investigate the mechanical properties of the materials. This traditional test is a kind of destructive test; the test pieces were damaged after detection and cannot be put into use, and the cost of the sample taken from the detection of the BWCCF was large, which resulted in waste. Instead, nondestructive testing offers rapid and effective results, which is the science of identifying the physical and mechanical properties of a piece of material without altering its end-use capabilities and then using this information to make decisions regarding appropriate applications [
4]. Therefore, different methods for the nondestructive testing of bamboo–wood composites have been studied. Francisco García Fernández [
5] established the artificial neural network (ANN) and regression models of the modulus of rupture (MOR) and the modulus of elasticity (MOE) by studying the effects of board thickness, moisture content, and the specific gravity of plywood boards; Fuming Chen et al. [
6] used a finite element simulation to optimize the design of laminated structures for bamboo bundle and wood veneer laminated composites (BWLVLs); Mohammad Arabi et al. [
7] used Buckingham’s p-theorem and predicted the MOR and MOE based on a multiple regression of particleboard.
Meanwhile, image processing technology has been widely available in the field of wood science due to its wide practicability, high flexibility and good reproducibility. Using the image feature extraction methods of fast Fourier transform (FFT), Gabor transform (GT), gray level co-occurrence matrix (GLCM), and wavelet transform (WT), several studies were conducted to identify and detect defects in wood materials. In the case of FFT method, a power spectrum is typically used to extract texture features and some works have used wood images [
8]. GT is mainly applied to achieve the frequency eigenvector of wood material images, which can be used to describe the effect of recognizing wood surface defects [
9,
10]. Regarding the application of GLCM, there are 14 texture characteristic parameters in GLCM applications and some scholars screened for the best combination of characteristic parameters by different methods to identify wood texture and wood species [
11,
12]. In addition, others have also used different combinations of parameters of GLCM to identify wood surface defects [
11,
13,
14,
15]. According to the WT method, most studies [
16,
17,
18] mainly used different wavelets to extract multiple characteristic parameters and combined other methods to not only identify wood-based materials’ textures and bark, but also nondestructively test the performance.
However, there is very limited research on predicting the mechanical properties of BWCCF using nondestructive testing. As a reliable substitute for hardwood floors, a BWCCF is a kind of multilayer material generally assembled by wood veneers and bamboo curtains or mats, which are interlaced and mixed, and bonded by pressing with structural adhesives. Fortunately, the cross and longitudinal sections of BWCCF conveys plentiful information, such as different positions, directions, layers, proportions of the wood and bamboo. Meanwhile, in order to achieve the best performance of BWCCF, the mechanical strength can be improved by an optimal design and changing the assembling pattern, such as the position, number of layers and direction of the bamboo curtain, compression ratio, species of raw materials and thickness of the veneer, etc. The mechanical properties are determined by its end configuration formed by the assembling factors, which are reflected in the end face. Consequently, the information on the cross and longitudinal sections is closely related to the performance of the BWCCF. For practical applications, the longitudinal mechanical strength of BWCCF is more stringent and can even be used to predict the transverse strength by using the empirical formula.
The objective of this study is to design the models that are capable of predicting the mechanics properties of BWCCF. In this study, four kinds of image processing methods, including FFT, GT, GLCM and WT, are employed to extract the characteristic parameters of the end face. Then, ANN and support vector machine (SVM) models are constructed to explore the nonlinear mapping relationship between the characteristic parameters of the section images and the mechanical properties (the short-span shear stress, MOR and MOE), so as to realize the nondestructive test and evaluation of the mechanical properties of BWCCF.
2. Materials and Methods
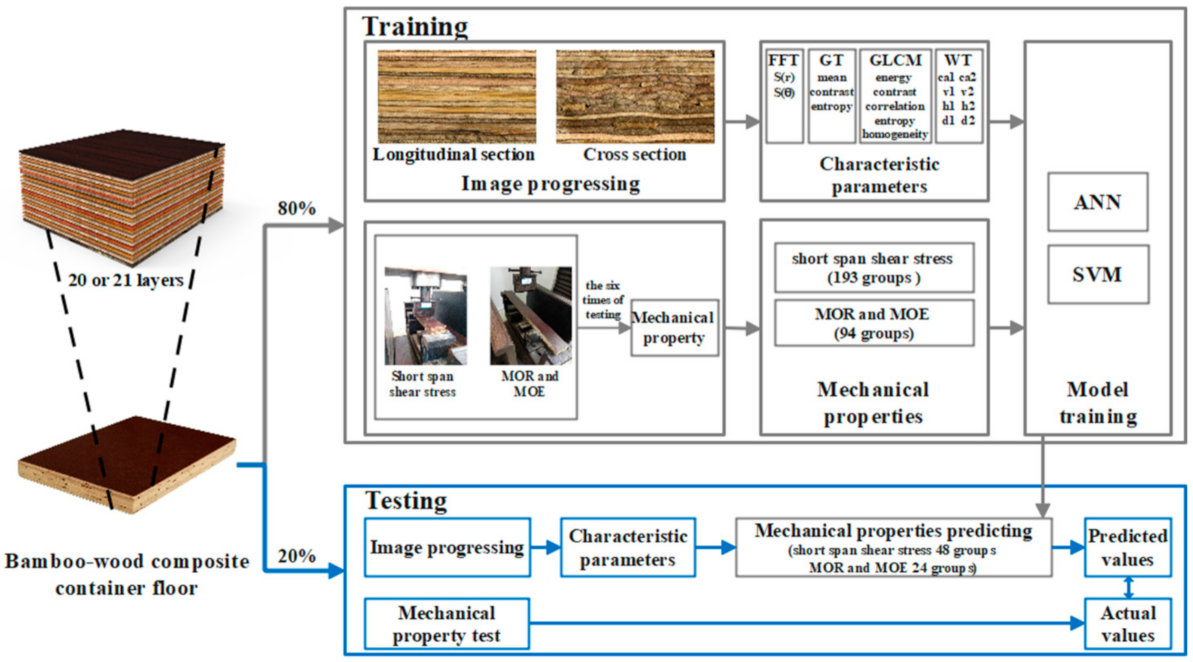
Figure 1 shows the flow chart of this experiment. First, the short-span shear stress, MOE and MOR of the BWCCF were tested and the test results served as the output of the ANN and SVM models. Second, in image processing, FFT, GT, GLCM and WT analysis were carried out and the results were taken as the input. Third, the models were trained and the generalization performance was verified by the input-output sample sets. Finally, the effective prediction models were obtained.
2.1. Materials
BWCCF is made by gluing 21 or 22 layers of raw materials together, including a bamboo curtain, eucalyptus, rubber wood, pine and other miscellaneous woods. The specifications were 1160 mm × 2400 mm × 28 mm, 1626 mm × 636 mm × 28 mm or 1160 mm × 1010 mm × 28 mm specimens. The first step was to treat raw materials. Bamboo curtains were subjected to a dipping process with a low-molecular weight phenol formaldehyde. The adhesive has a solid content of 48 ± 2%, a PH of 10 ± 1, a viscosity of 45–100 mPa·s, a specific gravity ≥1.18 and a moisture content ≤10%. During the process of double face glue spreading for wood veneers, the adhesive amount was 380 ± 20% and a phenolic aldehyde glue with a solid content of 48 ± 2%, a pH of 10 ± 1, viscosity of 50–180 mPa·s and specific gravity ≥1.18 was used as the glue. The second step was to carry out the process, which is the most important part. Finally, the assembled veneers were then compressed via cooling pressing for 20 min, with a pressure of 2.5–3.0 MPa and a cooling time of 20 ± 10 min. Then, they were subjected to hot pressing for 45 min at a temperature of 130 ± 5 °C and a glue spread of 320–360 g/m2.
2.2. Mechanical Property Test
The mechanical properties, such as the short-span shear stress, MOE and MOR, of the BWCCF were determined according to the procedure specified in the plywood standard of container floors (GB/T 19536-2015) and plywood performance standard of international freight container floors (IICL TB 001-2014). The samples were trimmed to dimensions of 305 mm × 50 mm × 28 mm for the short-span shear stress experiment and 610 mm × 50 mm × 28 mm for the MOR and MOE experiment. The mechanical properties were measured by using the universal wood-based panel tester (WDW-100E) controlled by the Smart Text software. The final mechanical properties are the average value of the six repetitions of the above measurement for further analysis.
2.3. Characteristic Parameter Extraction
Both longitudinal and cross section images of the BWCCF specimens were acquired by the flat-panel color scanner(Epson Expression 10000XL manufacted by Epson (China) Co Ltd. made in Beijing, China with a 600 dpi image resolution. By using the FFT [
19], GT [
20], GLCM [
14] and WT [
16] functions in MATLAB, the characteristic parameters of end face images were extracted. The features consist of the following four elements: (1) circular spectrum energy S(r) and radial spectrum energy S(θ), from FFT; (2) mean, contrast and entropy, from GT; (3) energy, contrast, correlation, entropy and homogeneity, from GLCM; and (4) eight parameters (low-frequency coefficient on scale 1 (ca1), horizontal high-frequency coefficient on scale 1 (h1), longitudinal high-frequency coefficient on scale 1 (v1), diagonal high-frequency coefficient on scale 1 (d1), low-frequency coefficient on scale 2 (ca2), horizontal high-frequency coefficient on scale 2 (h2), longitudinal high -frequency coefficient on scale 2 (v2), and diagonal high-frequency coefficient on scale 2 (d2)) from WT, which were collected from the two-layer decomposition of the specimen image.
In image processing, the fast-changing fine texture corresponds to the high-frequency component in the frequency domain in an image, while the slow-changing coarse texture corresponds to the low-frequency component [
21]. Therefore, the frequency component and frequency direction of the image frequency domain can reflect the roughness of the image texture and the change in texture density and direction. As a result, the frequency is also a measure of the image texture [
22]. FFT and GT extract the image frequency as the processing object and quantify the image features by taking the characteristic parameters. FFT is widely applied to signal analysis in industry [
23], which is a method of transforming images from the spatial domain to the frequency domain. It describes an accurate quantification of the signal through spectrum, including the amplitude spectrum, phase spectrum and power spectrum (also known as the energy spectrum) [
21]. Among these spectrums, the power spectrum is most often used to extract texture features. GT is formed by adding a window of a Gaussian function to a window of Fourier transform [
20] by introducing spatial parameters into a Fourier analysis. Texture analysis is used to locate the local space and analyze the specific texture details of images, while GT is used to analyze the global frequency contents of signals. A wavelet transform is also developed on the basis of Fourier transforms. Caselles [
24], Cohen [
25] and Daubechies [
26] studied the theory of wavelet analysis. They agreed that a Fourier transform does not have the ability to perform local analysis. Wavelet analysis theory is a multi-resolution analysis tool, which is widely used in nonlinear analysis, quantum mechanics, mechanical fault diagnosis, operator theory, signal analysis, computer recognition and other fields [
21]. In order to analyze wood texture characteristics, the characteristic parameters of wavelet energy values and the wavelet energy distribution proportion at different scales, frequencies and texture directions are obtained by decomposing wood texture images at multiple scales. Meanwhile, GLCM is a second-order statistical analysis method to assess texture, with a certain frequency of gray-level pairs of pixels with certain positional relationships in a statistical space [
27]. Different GLCM statistical characteristic parameters are used to describe the texture in detail from a number of perspectives. The pixels’ intervals, growth direction and gray level are the three elements that constitute GLCM, which affect the ability of feature parameters to describe texture [
21]. Among these different characteristics, the energy reflects the uniformity of the gray-scale distribution and texture thickness of the image; the contrast measures the distribution of the matrix values and local changes of images; the correlation describes the similarity of all elements in both horizontal and vertical directions and reflects the relevance and similarity of the image texture; the entropy represents the amount of information of the image and can represent the complexity of the texture; homogeneity is a measure of the local change of the image texture. When the whole texture of an image appears in a certain direction, the energy must also be concentrated in the same direction. From the energy point of view, the texture energy is concentrated in this direction. When texture does not have obvious directional features, the energy value is roughness in different directions, so the energy values of different levels and the frequency components obtained by wavelet decomposition can be used to analyze texture characteristics [
28].
2.4. Artificial Neural Network (ANN)
In this study, the proposed ANN models were designed using MATLAB (the MATLAB function of ANN). An ANN, simulating the functioning of the human brain, is a tool of great importance in forecasting and is made up of a combination of layers made of neurons. The most widely used type of ANN for forecasting is the multi-layer perceptron (MLP) [
29]. This method is particularly useful for dealing with nonlinearities and complexities, even if all mechanisms and principles are not clarified. Further, the network can be built directly from experimental data by using self-organizing capabilities without any prior assumptions [
30]. The training of an MLP usually adopts a backpropagation algorithm, which was first proposed by Rinehart and McClelland in 1986 [
31]. The neurons are the basic information-processing elements of the backpropagation artificial neural network (BP ANN) operation [
32], which interface with the outside world to receive information, called the input layer, and others communicate the prediction to the outside world, called the output layer. All the rest of the neurons connect the input layer to the output layer, called the hidden layers. The network function depends very much on the interconnections between neurons, which are nonlinear functions [
31]. There is no scientific and explicit method for determining the number of nodes, and thus the number of nodes in the hidden layer could be determined through experience and multiple periods of training [
33].
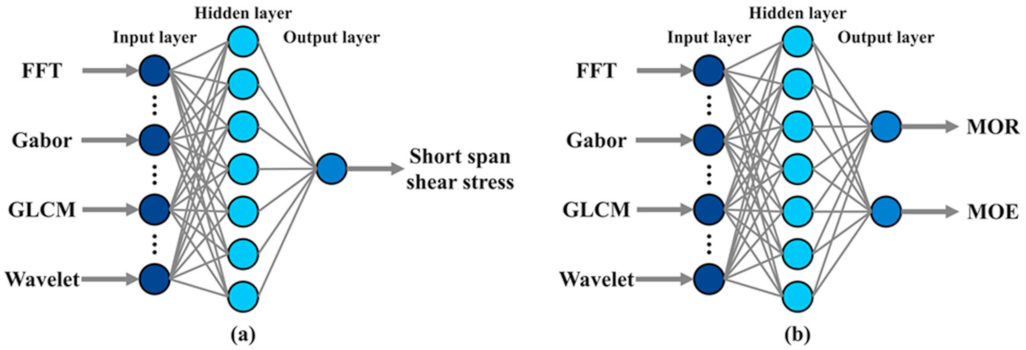
Two BP artificial neural network models are designed in this study, as shown in
Figure 2. The parameters, including 10 iterations, the log-sigmoid transfer function “logsig”, which is adopted between the input and hidden layer, the linear transfer function “purelin”, which is adopted between the hidden layer and the output layer, the Levenberg–Marquardt back propagation “trainlm”, which is considered as the training algorithm, are employed in both of the models. In the first model, the 36 characteristic parameters are considered as input variables and the short-span shear stress is used for the outputs, and the 36-7-1 neuron configuration is employed. The 241 groups of data are divided randomly into two parts during model construction: 193 groups of training sets (80% of the total) and 48 groups of test data (20%). In the other model, the MOR and MOE are used as outputs, and the 36-7-2 neuron configuration is designed. The 118 groups of data are divided randomly into two parts during model construction: 94 groups of training set (80%) and 24 groups of test data (20%).
2.5. Support Vector Machine (SVM)
As a supervised learning method, support vector machines (SVM) are often used for classification and regression [
34]. The basic idea of SVM application in regression analysis is to find an optimal classification surface so that all training samples have the minimum error from the optimal classification surface. Mathematically, it can be described as follows [
19]:
where
w and
b are the parameters of the linear support vector regression function and (
is the nonlinear mapping function. In order to simply calculate the nonlinear mapping function, the kernel function
would be applied to make the inner products, analyze the space, and evaluate the feature-separating space as the mathematical functions.
The coefficients
w and
b were estimated by minimizing the following function:
is the parameter prescribed, whereas
is the regularization constant. Thus, the approximate function was transformed into the equation below:
where
and
are Lagrange multipliers.
In this study, using MATLAB, three SVM models were established by the 36 characteristic parameters to predict the short-span shear stress, MOR and MOE, where the kernel function is the radial basis function (RBF).
2.6. Performance Measure
The error, mean absolute percent error (MAPE), root mean square error (RMSE), correlation coefficient (R) and determination coefficient (R
2) were used to evaluate the performance of the ANN. The equations of these performance criteria are given below:
where
shows the measured (actual) values,
represents the predicted values,
n is the total number of data and
is the average of the predicted values.
RMSE can amplify the value with a large prediction deviation and compare the stability of different prediction models. MAPE considers the error between the predicted and actual values and the ratio between the error and the actual value. The lower RMSE and MAPE values represent the more accurate prediction results. R is used to describe the degree of linear correlation between the predicted and actual values, which can reflect the positive or negative correlation between them. R2 means the correctness of model fitting. The higher values of R and R2 present greater similarities between the measured and predicted values. Combining these indicators to describe the model can more comprehensively analyze the model performance.
3. Results and Discussion
The mean and standard deviation of the measured mechanical properties of all datasets are depicted in
Table 1. As can be seen, the gap of the average and standard deviation between the training set and the testing one is negligible, which shows that the distributions of training sets and testing sets of all models are almost identical.
A BP artificial neural network is designed in this study. It makes use of the error gradient descent algorithm to minimize the mean square error between the output value of the network and the actual output value [
32], which can easily fall into the local optimum. SVM has a strict theoretical and mathematical foundation, based on the principle of structural risk minimization, and the algorithm has global optimality. In the application of predicting BWCCF mechanical properties, the training and generalization ability of SVM is better than the former. The MAPE, RMSE, R and R
2 values used to evaluate the performance of the ANN and SVM models constructed in this study are given in
Table 2. As seen from results, the R and R
2 of SVMs of training sets are greater than those of ANN, and the MAPE and RMSE of SVM are below those of ANNs. The resulting trend of the testing set is the same, which indicates that the SVM could be able to output more satisfying values than the ANNs when applied to unknown samples. Thus, the SVM model is more accurate than the ANN model at making predictions. Comparing the training and testing sets, the results are in similar range, indicating that the ANN and SVM models showed no tendency toward underfitting or overfitting.
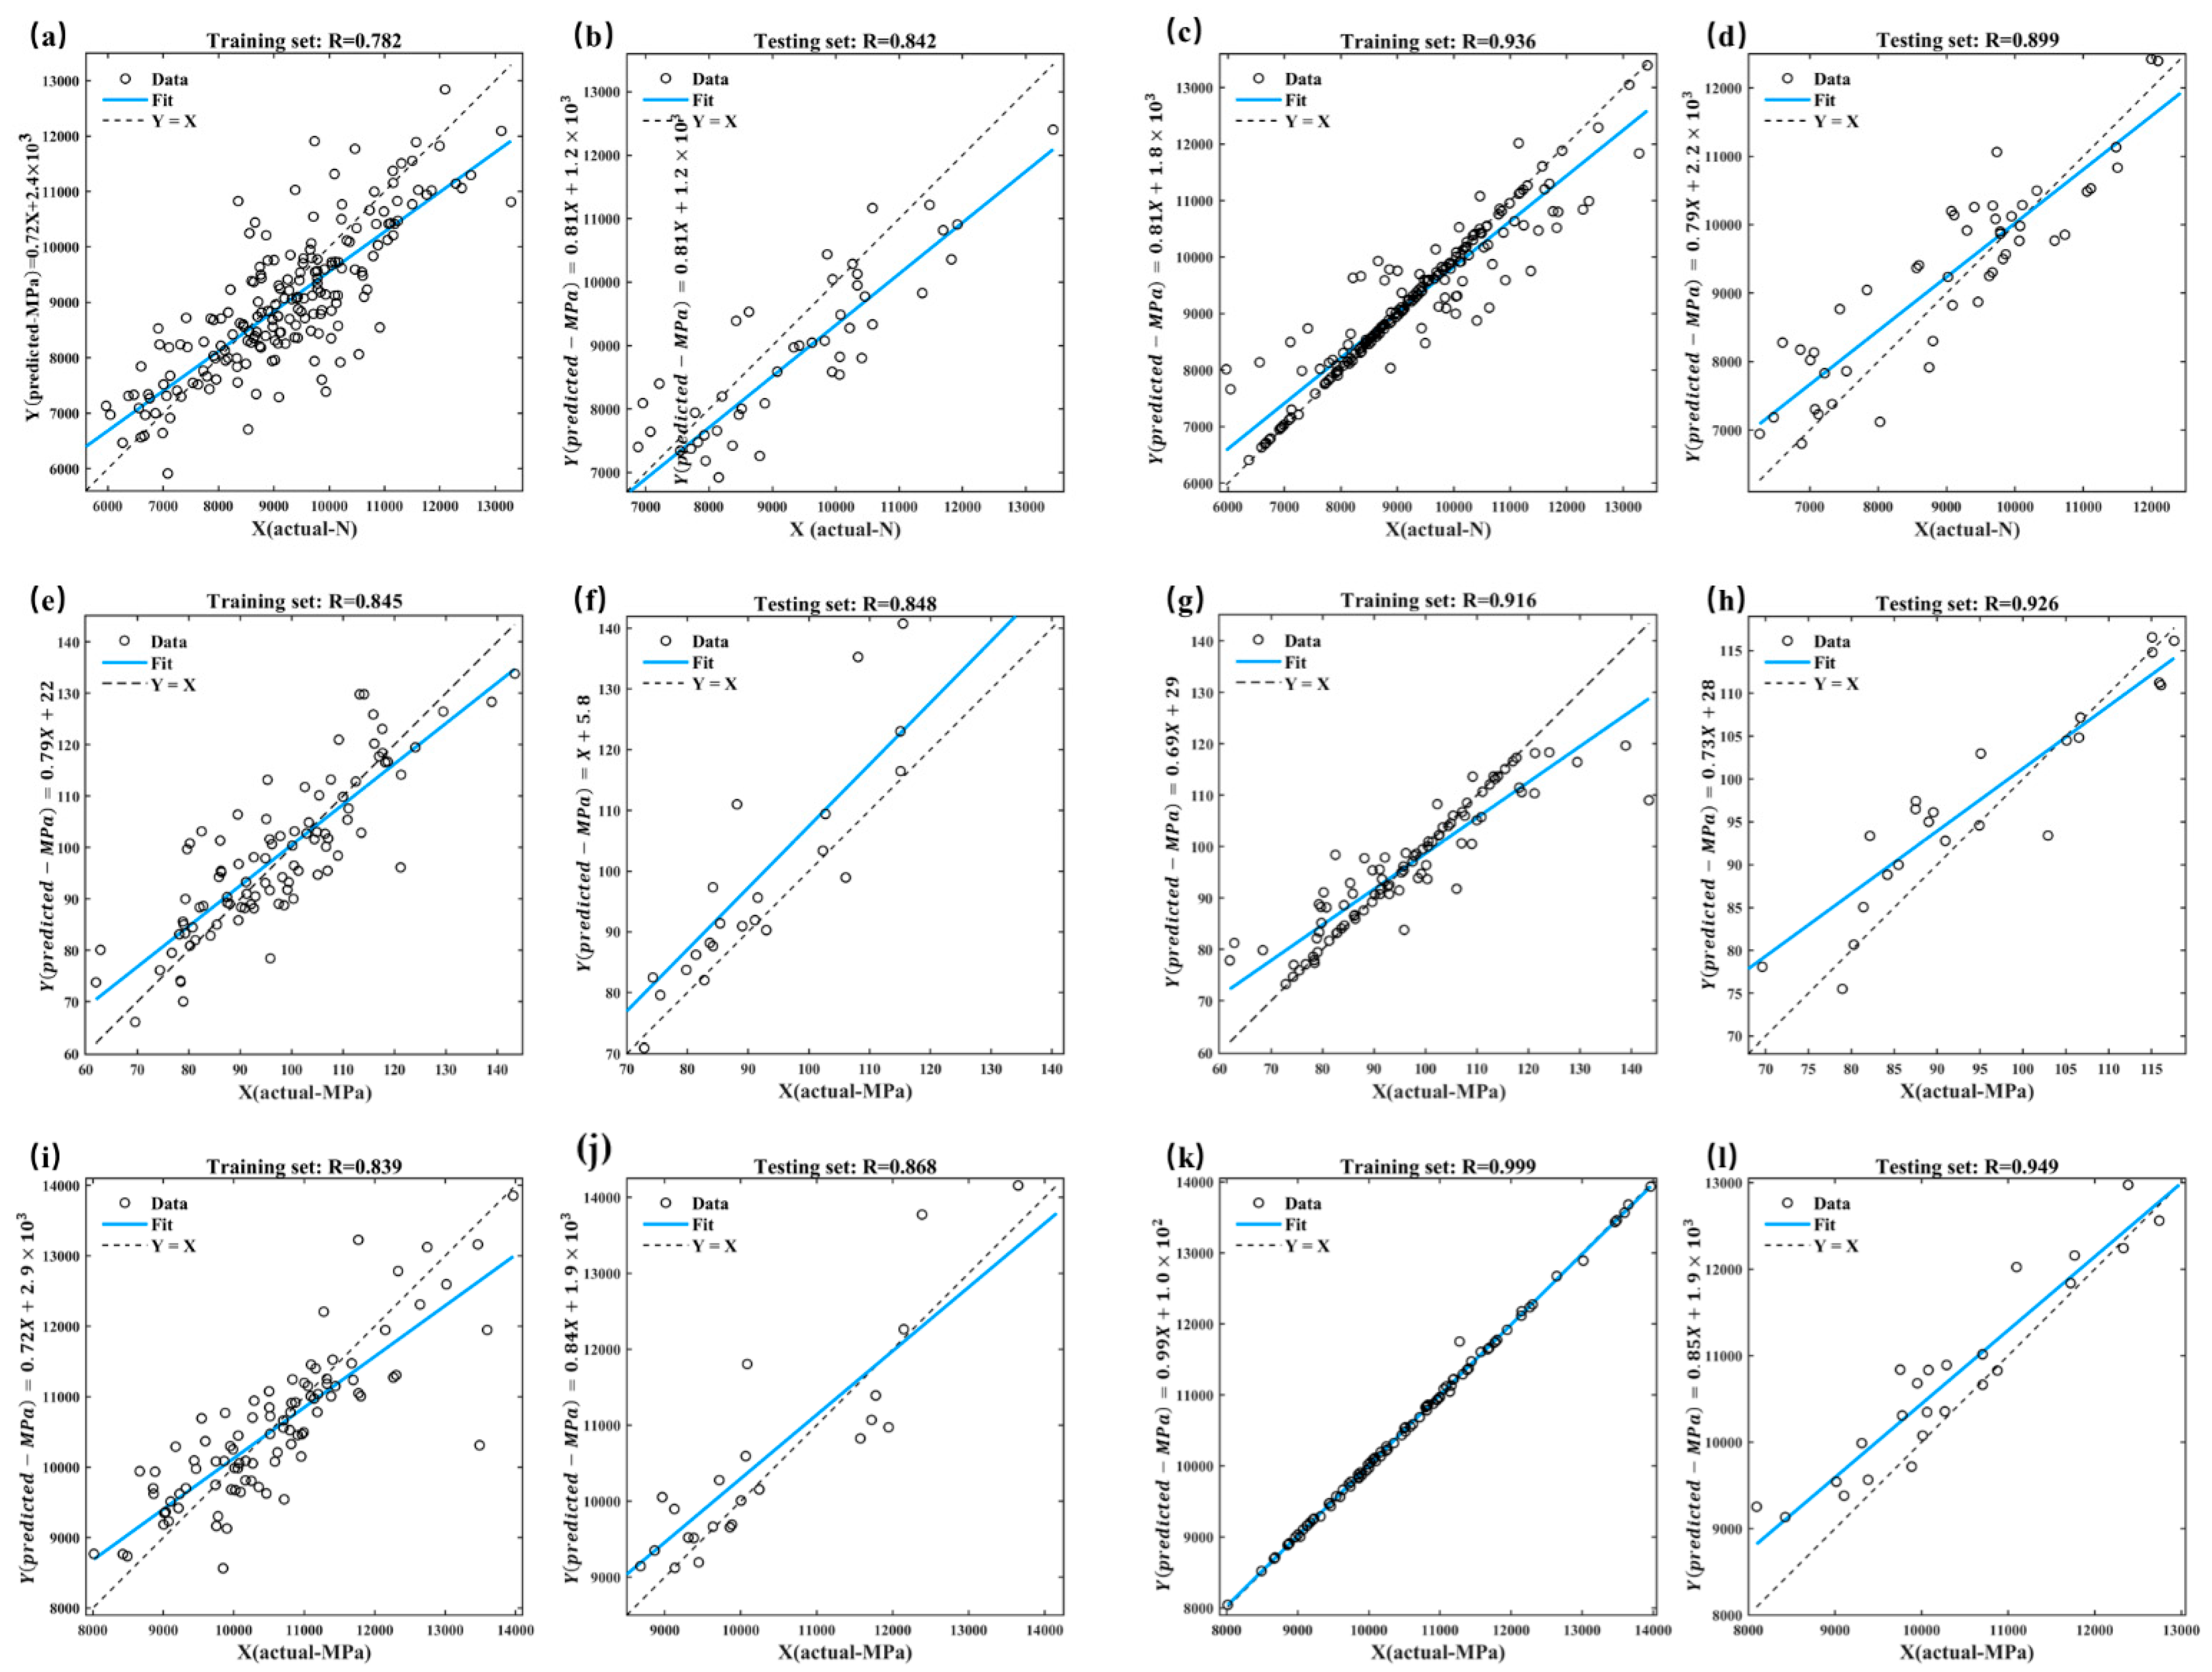
The goodness of fit values of all sets are discussed and compared.
Figure 3 illustrates the graphical presentation of all models found for each mechanical property, with the fit between the actual and predicted values of the short-span shear stress, MOR and MOE, and those calculated by the respective datasets for the training and testing sets. The actual values are plotted versus the predicted values as open circles. The best linear fit is indicated by a dashed line, whereas the blue solid line shows the linear fit of current models between the predicted values and actual values. The accuracy of the prediction models is proven with increasing the R values. As shown, there were significant correlations between the actual and predicted values in all datasets, which indicates that the models in both methods can be considered for predicting the mechanical properties of BWCCF. However, the SVM prediction models have better reliability than ANNs, since they have higher explanatory values. The R values of testing sets for the short-span shear stress, MOR and MOE were 0.899, 0.926, and 0.949, respectively.
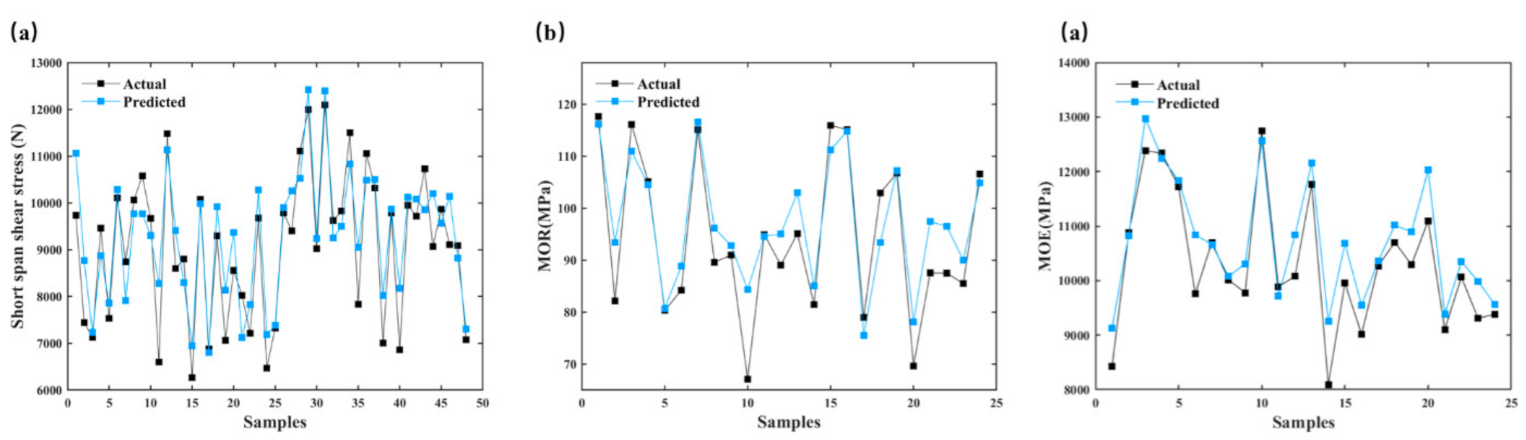
The comparison of actual and predicted values of testing sets for the short-span shear stress, MOR and MOE using SVM are illustrated in
Figure 4. As shown by the graphics presented in
Figure 4, it means that the predicted values are very close to the actual values.
According to the results of the testing sets (shown in
Table 2), the R
2 values of the short-span shear stress, MOR and MOE are 0.808, 0.858, and 0.900, respectively. Thus, the R
2 values with the SVM modeling approach are all greater than 0.800 in three datasets. This result implies that it is capable of explaining at least 80.8% of the measured values of the short-span shear stress. Additionally, for the prediction model of MOR and MOE, the results demonstrated that the prediction model achieved more than 85.8% and 90.0% success, respectively. Otherwise, the accuracy of the SVM prediction models for the short-span shear stress, MOR, and MOE is proven, with decreasing MAPE values, which are 6.983%, 5.873% and 4.474%.
The results obtained by the SVMs are satisfactory compared to those obtained by other authors upon applying machine learning to predict a variety of properties of wood and wood-based products. Sandhya Samarasinghe et al. [
35] acheieved an R
2 value of 0.62 in the determination of fracture toughness of Pinus radiata D. Don solid wood test pieces. Shawn D. Mansfield et al. [
36] obtained R
2 values from 0.45 to 0.76 when modeling the strength of Populus spp. clones, and the minimum MAPE was equal to 12.5%. Tat Thang Nguyen et al. [
37] constructed the model to predict the color change of heat-treated wood during artificial weathering and obtained a MAPE value of 9.85%. The generalization ability of the model in the study for the prediction of the mechanical properties of BWCCF is similar to some other models. In Zongying Fu et al.’s study [
38], the R
2 values for MOE and MOR of heat treatment radiata pine wood models were 0.904 and 0.783, respectively. Jiawei Zhang et al. [
39] obtained an R
2 value of 0.921 in the prediction of the lumber moisture content of cottonwood.
The predicted error of the model is not small, and the error may be due, firstly, to inevitable error limits in detection, and secondly, to the fact that the BWCCF is extremely sophisticated. According to
Table 1, the values of the standard deviation and coefficient of variation are large, which illustrates that the data of mechanical properties have great discreteness. The slightly insufficient generalization ability of the models is affected by the properties of the BWCCF itself. Compared with other studies, the BWCCF is more homogeneous. The BWCCF is a multi-layer composite material with a complex structure. On the other hand, there are many kinds of assembling patterns and raw materials. The extreme heterogeneity and uncontrollability of materials have a great influence on the generalization test of the models. In view of this, it provided a new approach to investigate the mechanical properties of BWCCF. It can also be clearly seen that a well-trained SVM model can be used to predict the mechanical properties of BWCCF accurately.
4. Conclusions
The characteristic parameters of the longitudinal section and the cross section of BWCCF were extracted by image processing, including a Fourier transform (S(r), S(θ)), Gabor transform (mean, contrast, entropy), GLCM (energy, contrast, correlation, entropy, homogeneity), and wavelet transform (ca1, h1, v1, d1, ca2, h2, v2 and d2), 36 characteristic parameters in total. In this study, the short-span shear stress, MOR, and MOE of BWCCF were predicted by ANNs and SVMs using characteristic parameters. Compared to the BP ANN models, the SVM models can obtain a higher accuracy in the prediction of the three mechanical properties (R = 0.899, 0.926, 0.949, and MAPE = 6.983%, 5.873%, 4.474%). The results can be regarded as good and demonstrate that the predicted outputs of SVMs are better fitted with the actual outputs than ANNs. The SVM model can satisfy values when being applied to unknown samples and is more suitable to assess the mechanical properties of the BWCCF. This study also opens up a new area of application for the prediction of mechanical properties of extremely heterogeneous wood composites by SVM. The developed methodology can be improved in several ways by future research. The algorithm can be optimized to adapt to wooden composites with complex structures, so as to improve the prediction accuracy. In addition to the BP ANN and SVM, there are other machine learning methods that can be explored and applied in the prediction of BWCCF’s mechanical properties. Furthermore, the image progressing can be applied to the real-time quality monitoring of production in order to realize the nondestructive testing of the BWCCF.


