Article

Soil Aggregate-Associated Carbon Fraction Dynamics during the Process of Tea (Camellia sinensis L.) Planting in Southern Guangxi, China

Forestry College, Guangxi University, Nanning 530004, China
*
Author to whom correspondence should be addressed.
Forests 2021, 12(11), 1530; https://doi.org/10.3390/f12111530
Submission received: 13 October 2021 / Revised: 2 November 2021 / Accepted: 4 November 2021 / Published: 6 November 2021
(This article belongs to the Section Forest Soil)

Abstract

:
Revealing the variation in soil aggregate-associated organic carbon (Corg) in tea plantations of various planting ages is crucial to shed more light on the accumulation and decomposition of soil Corg in the tea-planting period. This study measured the concentrations of soil Corg, active carbon (Cact), and recalcitrant carbon (Crec) in different-sized aggregates obtained from tea plantations of various planting ages (8, 17, 25, and 43 years old) at the soil depths of 0–20 and 20–40 cm in southern Guangxi, China. According to the wet-sieving approach, soil aggregates were classified as macro- (>0.25 mm) and micro- (<0.25 mm) aggregates, and the former were further divided into coarse (>2 mm), medium (2–1 mm), and fine (1–0.25 mm) fractions. Based on the mean weight diameter (MWD), the stability of soil aggregates was the highest in the 17-year-old tea plantations, and it was closely related to the concentration of soil Cact (0–20 cm: R2 = 0.9744, p < 0.05; 20–40 cm: R2 = 0.8951, p < 0.05), but not Corg (0–20 cm: R2 = 0.1532, p > 0.05; 20–40 cm: R2 = 0.4538, p > 0.05), during the tea-planting process. In the 0–20 and 20–40 cm soil layers, the coarse and medium macro-aggregates had higher concentrations of Corg, Cact, and Crec, regardless of the tea-planting age; meanwhile, the soil Cact/Crec ratio, indicating the Corg availability, increased as aggregate size increased, implying that the soil Corg was younger and more labile in coarse macro-aggregates relative to finer aggregates. Moreover, the tea-planting age significantly affected the Corg, Cact, and Crec reserves in both soil layers. To be specific, continuous tea planting facilitated the accumulation of soil Corg and Crec, but their reserves’ increase rates decreased over time; meanwhile, the soil Cact reserve increased during the early (from 8 to 17 years) tea-planting stage and later decreased. Therefore, during the middle (from 17 to 25 years) and late (from 25 to 43 years) tea-planting stages, maintaining the soil as an Cact pool plays a vital role in facilitating the formation and stabilization of soil aggregates in southern Guangxi, China.

1. Introduction

Tea (Camellia sinensis L.) [1], which is one of the crucial industrial crops among numerous developing countries, has been extensively grown in China, India, and Sri Lanka. China is the greatest tea producer worldwide, in which the tea plantation area takes up 3.17 million hectares as of 2020 and has been continuously increasing [1]. Guangxi, located in the subtropical zone, is a region with plenty of light, heat, and water resources, and it provides all the favorable conditions for the development of tea plantations. As a result, it is one of the important tea-producing areas in China [2]. According to the statistics, over 80% of tea plantations in Guangxi are located in poverty-stricken counties; meanwhile, tea planting has become the pillar industry for most of these poverty-stricken counties to get rid of poverty [2].
Maintenance of soil organic C (Corg) is important for the sustainable use of soil resources in tea plantations due to the multiple effects of Corg on soil nutrient status and structural stability [3]. Moreover, the global concern surrounding climate change has increased interest in promoting C sequestration in soils to mitigate the increasing CO2 level in the atmosphere [3]. Because most forest soils have experienced some degree of Corg depletion, elevating the soil Corg pool has been suggested as an important method to sequester CO2 from the atmosphere [4]. Soil represents a carbon sink or source, which is greatly determined by the balance between the accumulation and decomposition of soil Corg [4]. Soil aggregates serve as the basic soil structural units. On the one hand, aggregate composition can regulate the interactions between minerals and organic substances in numerous soil physical, chemical, and biological processes [5]. On the other hand, aggregate stability can be used to evaluate the soil structure dynamic [6]. Thus, it is essential to explore soil Corg change in aggregates so as to get more knowledge about the effects of soil management practices on the soil Corg accumulation and decomposition.
On the basis of hierarchy concept, soil aggregates are categorized either as macro- (>0.25 mm) or as micro- (<0.25 mm) aggregates [4]. During their formation processes, primary particles are merged to form micro-aggregates in the cementing action of persistent bindings (i.e., polyvalent metal cation complexes and humified organic matters) [7]; meanwhile, macro-aggregates are constituted by micro-aggregates in the aggregating action of temporary bindings (i.e., plant roots, fungal hyphae, plant- and microbial-derived polysaccharides) [8]. It should be noted that the decline of soil structure stability can lead to the disintegration of macro-aggregates and the release of micro-aggregates. Subsequently, micro-aggregates will become the building blocks for the later formation cycles of macro-aggregates [9].
Soil aggregation can provide physical protection for soil Corg through isolation from decomposers, thus increasing the residence time of soil Corg [10]. According to the residence time (RT), soil Corg is classified as active C (Cact) (RT < 2 years) and recalcitrant C (Crec) (RT > 2 years) [11]. So far, the distribution of Corg in soil aggregates is extensively reported. As suggested in some studies, Corg concentration was higher in micro-aggregates compared with macro-aggregates [7,12]. However, in other studies, higher Corg concentration was observed in macro-aggregates instead of micro-aggregates [8,9]. In short, soil aggregate-associated Corg concentration and availability are dependent on the size of aggregates. However, the composition of diverse sized aggregates is controlled by the human activities, among which land-use conversion exerts a vital part in the change of soil aggregate composition [13].
Over the past century, high population pressure and severe deforestation have resulted in land degradation and reduction in soil productivity. For the sake of restoring the degenerated ecosystem, the Grain for Green Program was put into effect by the Chinese government [14]. Since the 1960s, based on the unique geographical location and the specific climate conditions, the transformation of abandoned lands into tea plantations represents an important practical step in developing sustainable agriculture in southern Guangxi [15], which not only enhances the stability of soil aggregates but also increases the reserve of soil Corg [16,17]. However, it remains unclear as to how different chronosequence stages of tea planting impact the dynamics of soil Corg and its fractions (including Cact and Crec), in particular at the aggregate scale.
As a result, this study focused on examining the short- and long-term effects of land-use change from abandoned lands to tea plantations on (i) the composition and stability of soil aggregates, and (ii) the Corg, Cact, and Crec concentrations and reserves in soil aggregates. Furthermore, the hypotheses in this study were proposed as follows: (i) soil aggregate stability would be enhanced during the tea-planting process due to the accumulation of soil Corg over time and (ii) the change (increase or decrease) rates of soil Corg, Cact, and Crec reserves would be different among the different stages of tea planting because of the variations in litter quantity and quality during the natural aging process of tea plants.

2. Materials and Methods

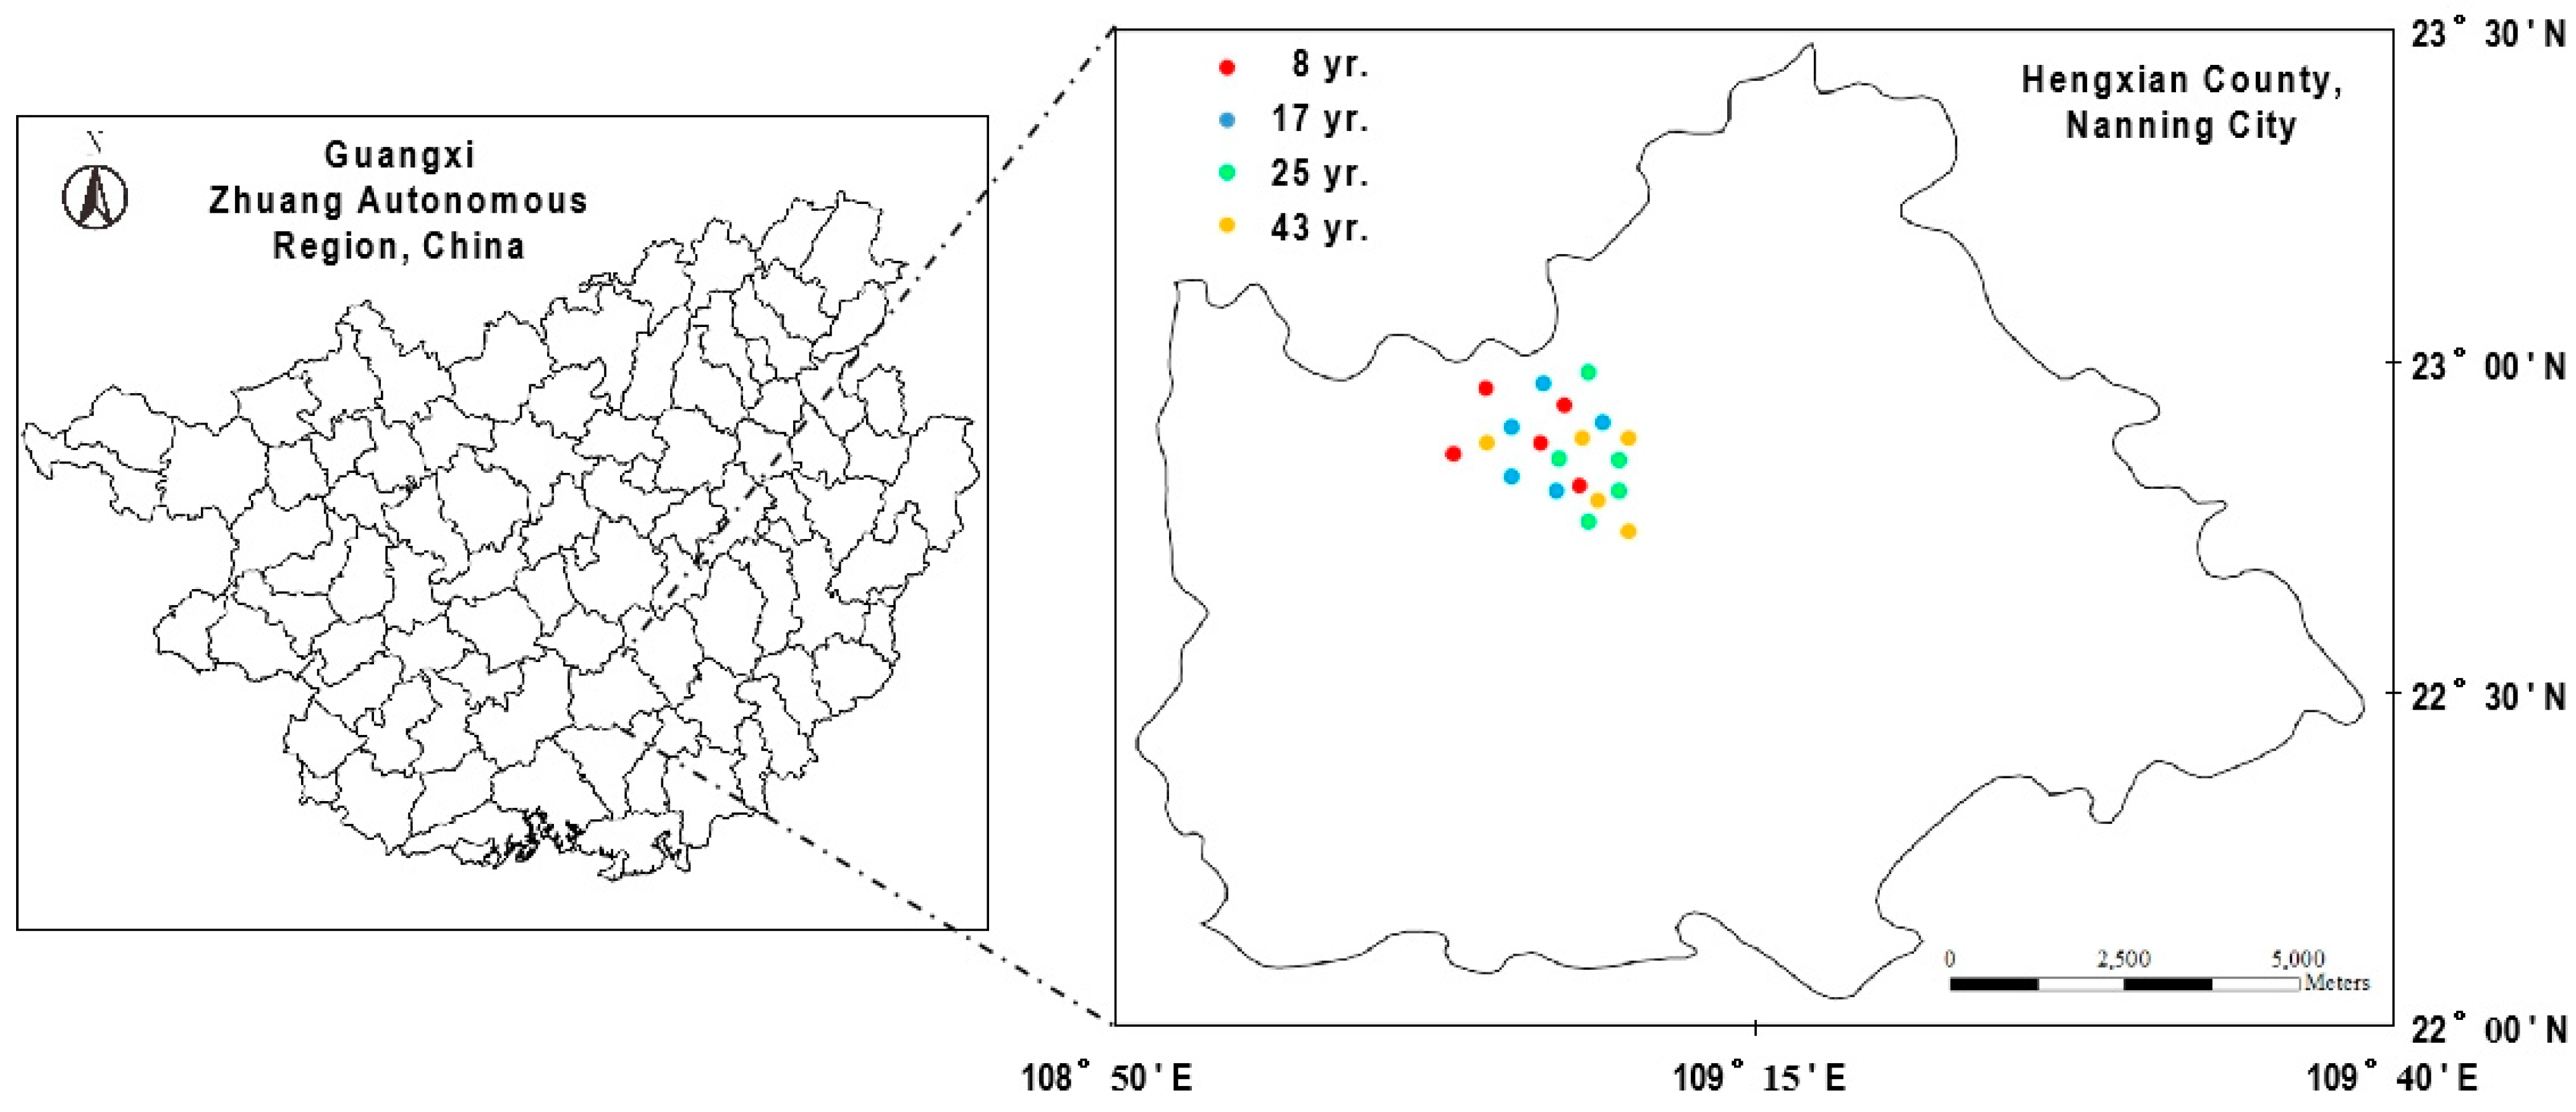
2.1. Location of the Experiment

This research was performed at the Hengxian agricultural center of Guangxi University (slope gradient, 13–15°; elevation, 557–563 m) (Figure 1). This region is dominated by the subtropical monsoon climate, with an average annual precipitation and temperature of 1304 mm and 21.6 °C, respectively. The exposed soil layer is mainly generated in the Mesozoic, with the latosol agrotype [18] and loamy clay texture. As early as the 1960s, large amounts of abandoned lands have been utilized to plant tea, because tea shows a relatively high economic value. In such areas, the “Baimao tea” (Camellia sinensis (L.) O. Kuntze var. Nanshanbaimao) is the main tea variety, and the planting ages are different among tea plantations. No-tillage is adopted as the cultivation practice, with a tea-planting density of about 6 × 10⁴ plants ha−1. The annual fertilizer regime since the initial land-use change was presented in our previous study [19], and there was no herbicide applied in the tea-planting period. Yellow viscous boards were covered on the tea plantations to prevent pests, because the yellow color can attract pests, which are later trapped on the boards. In September every year, each tea plant was slightly pruned and the tea residue was returned into soil.

2.2. Design of the Experiment

This research adopted the space-for-time replacement approach for exploring the impact of tea-planting age on the variations in soil aggregation as well as aggregate-associated Corg. In general, soil spatial variation may have potential confounding effects on the results from this study. To maximally reduce such effects, therefore, different-aged (8-, 17-, 25-, and 43-year-old) tea plantations (“Baimao tea”) were selected at alike geomorphologic units that had alike soil parent materials, slope gradient, and slope direction. Since each tea-planting age was replicated in quintuplicate, this research chose 20 tea plantations in total. The mutual distance of these tea plantations was set at 300–1500 m for avoiding pseudo-replication and minimizing spatial auto-correlation. For every tea plantation, we randomly established a plot (Ssquare = 20 m × 20 m) at >50 m from the edge of the tea plantation.

2.3. Sampling for Litter and Soil

For every plot, 5 litter samples were collected on the soil surface from 5 randomly selected sub-plots (Ssquare=1 m × 1 m), and then these litter samples were integrated to a mixed litter sample. All of the 20 mixed litter samples were dried at a temperature of 80 °C until a constant weight was obtained (Table 1). Afterwards, we measured the dry weight of these mixed litter samples as well as the concentrations of C [20] and N [21] (Table 1). To be specific, the quantity of tea litter was 821, 974, 786, and 648 g m2 in the 8-, 17-, 25-, and 43-year-old tea plantations, respectively. Meanwhile, the C/N ratio of tea litter was 14.23, 12.68, 17.32, and 21.37, respectively.
For every plot, 5 soil samples were collected from each layer (namely, 0–20 and 20–40 cm) in 5 sub-plots used for litter sampling, and then these soil samples in each layer were integrated to a mixed soil sample. All of the 40 mixed soil samples were carefully fragmented into the natural aggregates, and then these aggregates were filtered using the 5 mm sieve for removing soil fauna, plant roots, and stones. Afterwards, one part was adopted for the measurement of soil texture, pH, Corg, Cact, and Crec concentrations (Table 1) and the other part was adopted for the separation of soil aggregates. For every plot, 5 additional soil samples were randomly collected by cutting rings (Ø = 50.46 mm, depth = 50 mm, V = 100 cm−3) from each layer for assessing soil bulk density (Table 1).

2.4. Separation of Soil Aggregates

According to the wet-sieving process [22], 250 g of each mixed soil sample was successively filtered with the 2-, 1-, and 0.25-mm sieves. To be specific, we immersed mixed soil samples into distilled water for 15 min, and then we shook them perpendicularly for 15 min at a 1 s−1 oscillation rate and 5 cm amplitude. As a result, macro- (>0.25 mm) and micro- (<0.25 mm) aggregates were obtained, and the former included coarse (>2 mm), medium (2–1 mm), and fine (1–0.25 mm) fractions. All of the soil aggregates were dried and weighed, and then their Corg, Cact, and Crec concentrations were measured.

2.5. Analyses of Soil Physic-Chemical Properties

The oven was used to dry the soil samples at a temperature of 105 °C until they reached a constant weight for ascertaining the bulk density. Prior to the test of soil texture, pH, Corg, Cact, and Crec concentrations, soil samples were air-dried at indoor temperature. The hydrometer was used to measure soil texture. A glass electrode was used to measure soil pH. The acid dichromate wet oxidation approach was applied to determine Corg concentration [20]. The 18 N H2SO4 oxidation approach was applied to determine Cact concentration [12]. The Crec concentration was calculated by subtracting Cact concentration from Corg concentration [23].

2.6. Analyses of Calculations and Statistics

Soil aggregate stability was indicated by the mean weight diameter (MWD, mm) [24]:
MWD = i = 1 4 ( X i × M i )
where Xi denotes the ith size aggregates’ average diameter (mm) and Mi denotes the ith size aggregates’ proportion (% in weight).
Soil Corg reserve (CorgR, g m−2) was calculated by the following formula [25]:
C org R = i = 1 4 ( M i × C org   i ) × B d × H × 10
where Mi is the ith size aggregates’ proportion (% in weight), Corg i is the ith size aggregates’ Corg concentration (g kg−1), Bd is the soil bulk density (g cm−3), and H is the soil depth (cm). Similarly, soil Cact and Crec reserves were also obtained.
Pearson’s correlation analysis was adopted to detect the association between the stability of soil aggregates and concentrations of Corg, Cact, and Crec. One-way ANOVA was used for estimating the impact of tea-planting age on the characteristics of tea litter and bulk soil. A general linear model regarding the ANOVA formulated for the split-plot was used for estimating the impacts of aggregate size, as well as tea-planting age, on the aggregate composition and aggregate-associated Corg, Cact, and Crec dynamics.

3. Results

3.1. Composition and Stability of Soil Aggregates

In the 0–20 cm soil layer, the coarse macro-aggregates were dominant in soil aggregate composition, which accounted for an average proportion of 42.70% across the four tea plantations differing in age (Table 2). In the 20–40 cm soil layer, however, the primary fractions in soil aggregates were micro-aggregates, which accounted for an average proportion of 52.79%. This showed that the coarse macro-aggregate proportion decreased while the micro-aggregate proportion increased as the soil depth increased. In both soil layers, continuous tea planting significantly influenced the proportion of different-sized aggregates, except for fine and medium macro-aggregates. The coarse macro-aggregate proportion increased significantly up to the 17th year of tea planting and later decreased significantly. Nonetheless, the micro-aggregate proportion displayed an opposite trend during the tea-planting process. In each soil layer, the highest value of soil MWD was observed in the 17-year-old tea plantations (Figure 2).

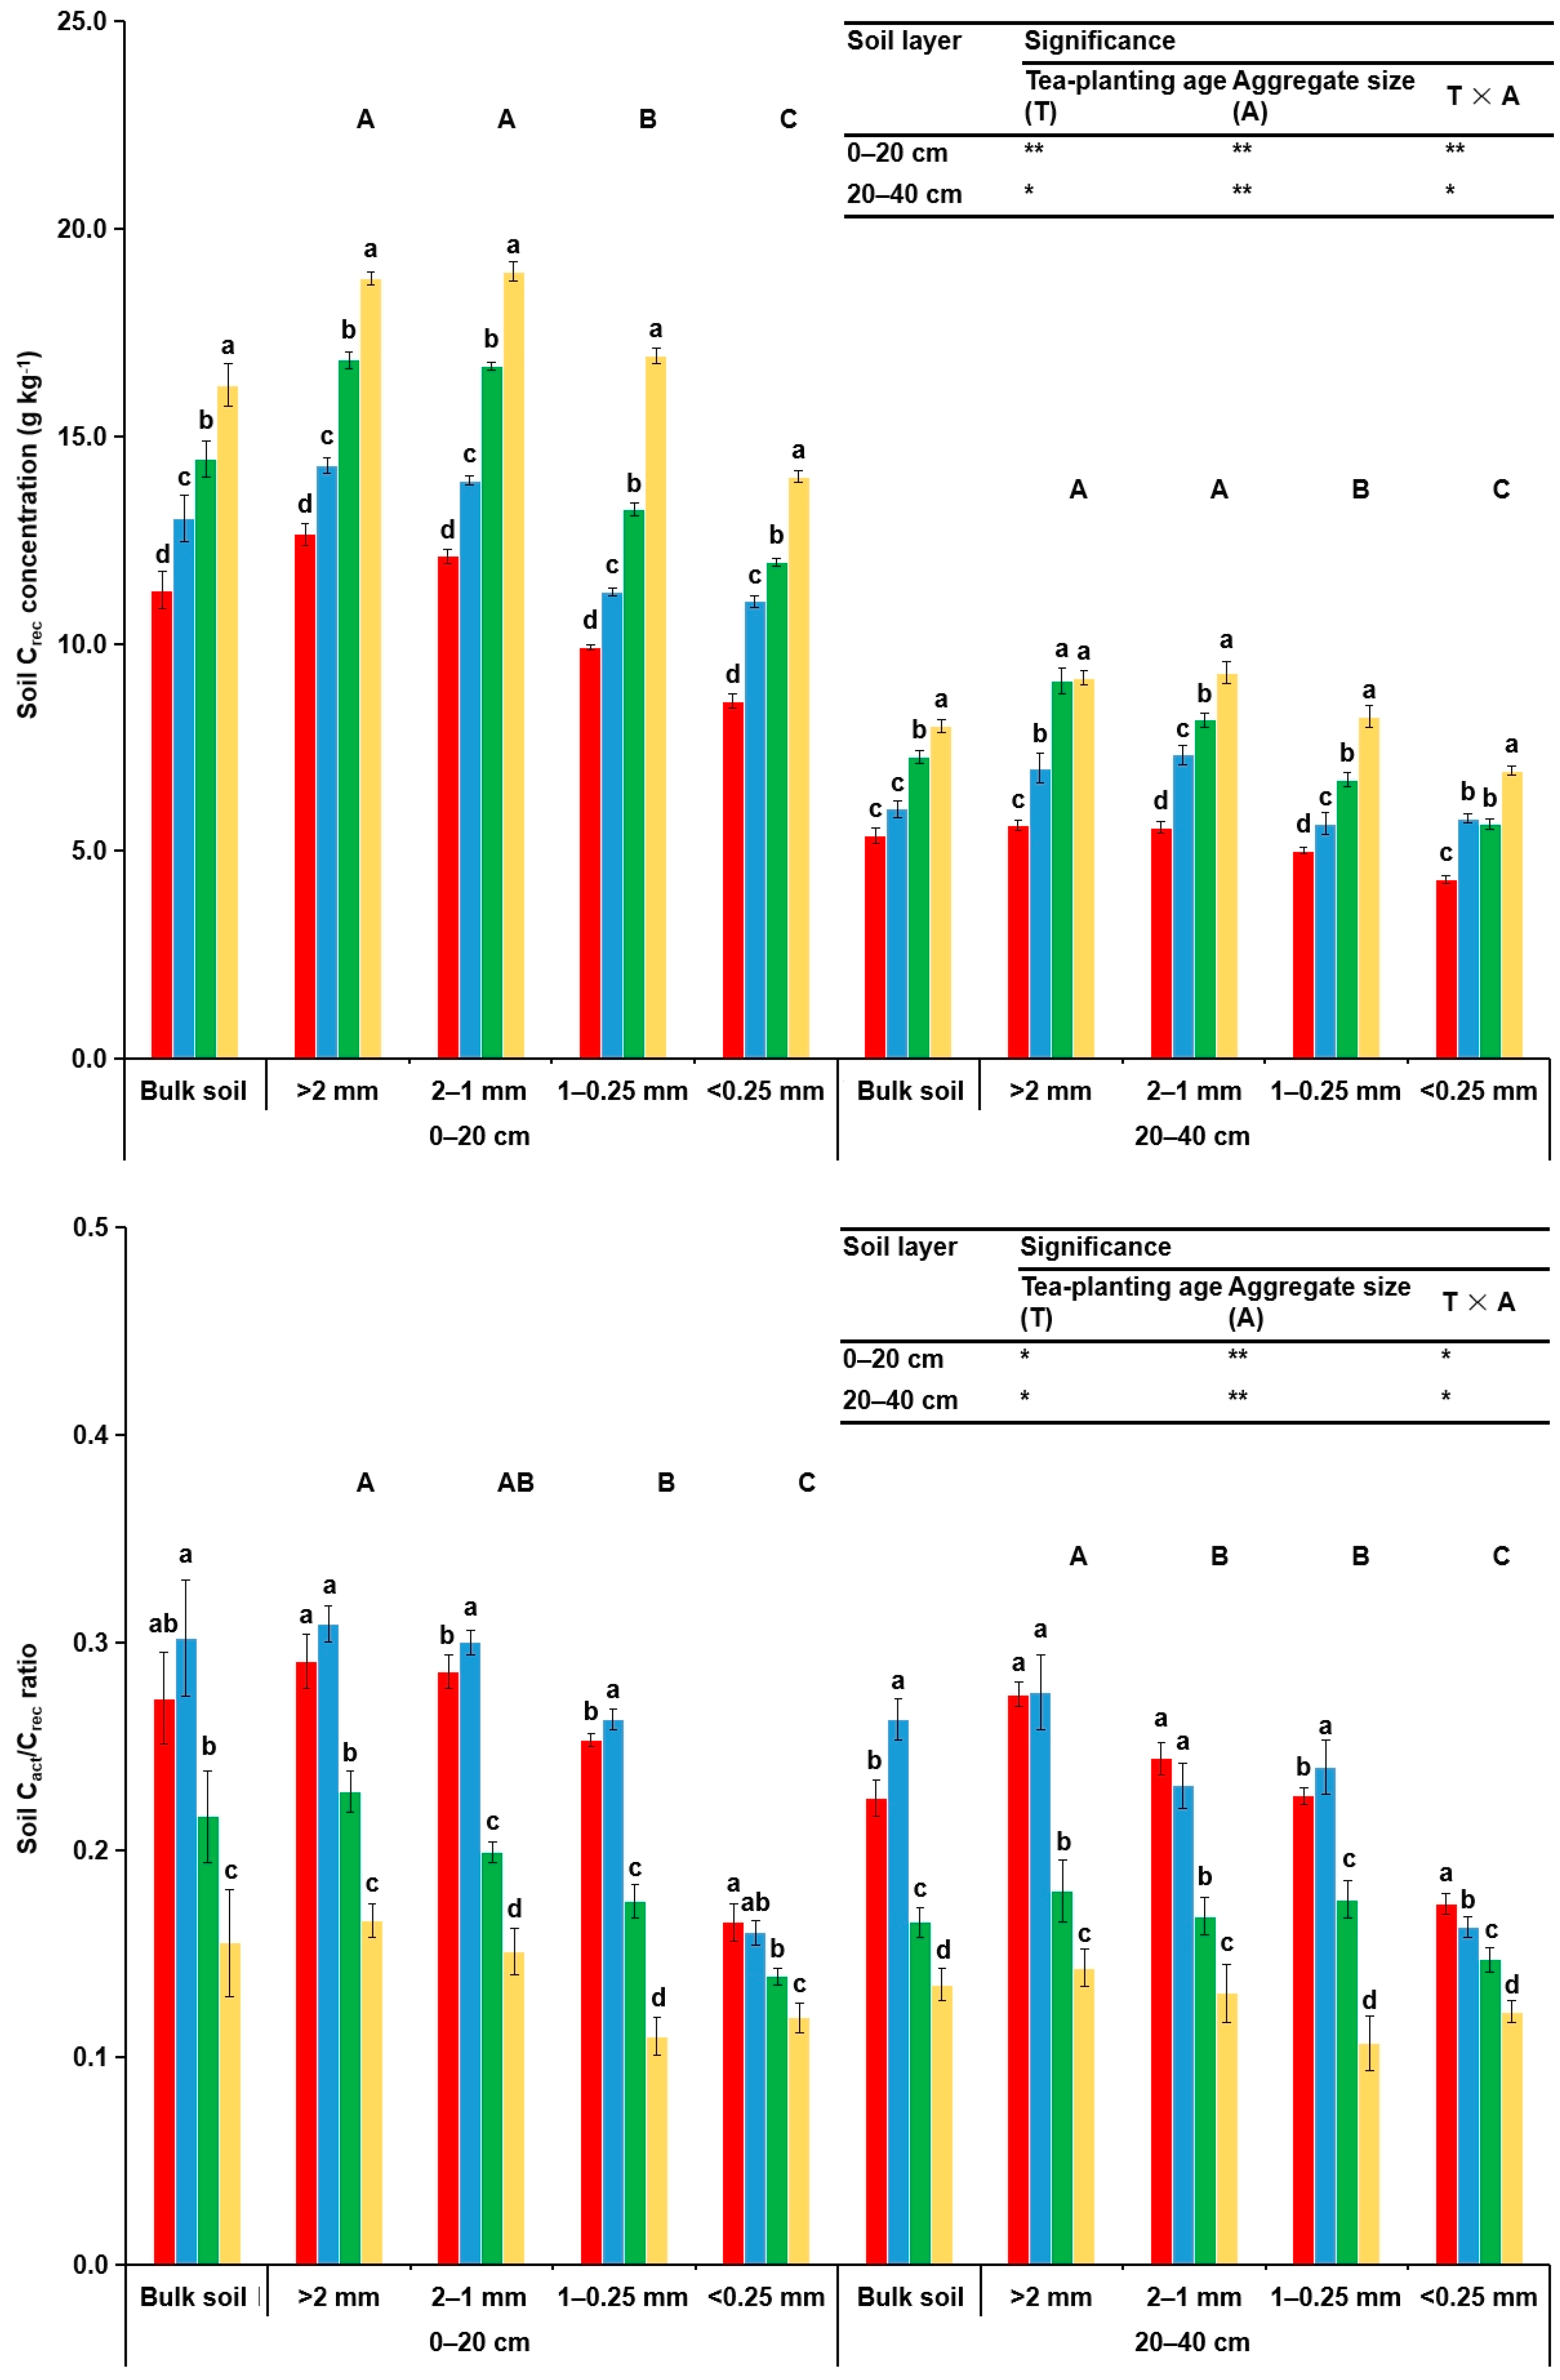
3.2. Concentrations of Corg and Its Fractions in Soil Aggregates

Soil aggregate-associated Corg, Cact, and Crec concentrations and the Cact/Crec ratio showed an increasing trend as aggregate size increased (Figure 3). To be specific, soil Corg, Cact, and Crec concentrations were significantly higher in coarse and medium macro-aggregates relative to finer aggregates. At the same time, te soil Cact/Crec ratio was the greatest in the coarse macro-aggregates, and the lowest ratio was observed in the micro-aggregates. For all tea plantations, soil aggregate-associated Corg, Cact, and Crec concentrations and the Cact/Crec ratio in the 0–20 cm soil layer were higher than those in the 20–40 cm soil layer. In both soil layers, aggregate-associated Corg and Crec concentrations elevated significantly during the tea-planting process. Differently, aggregate-associated Cact concentration and the Cact/Crec ratio showed an increasing trend initially and later declined over time, with the highest levels being detected in the 17-year-old tea plantations.

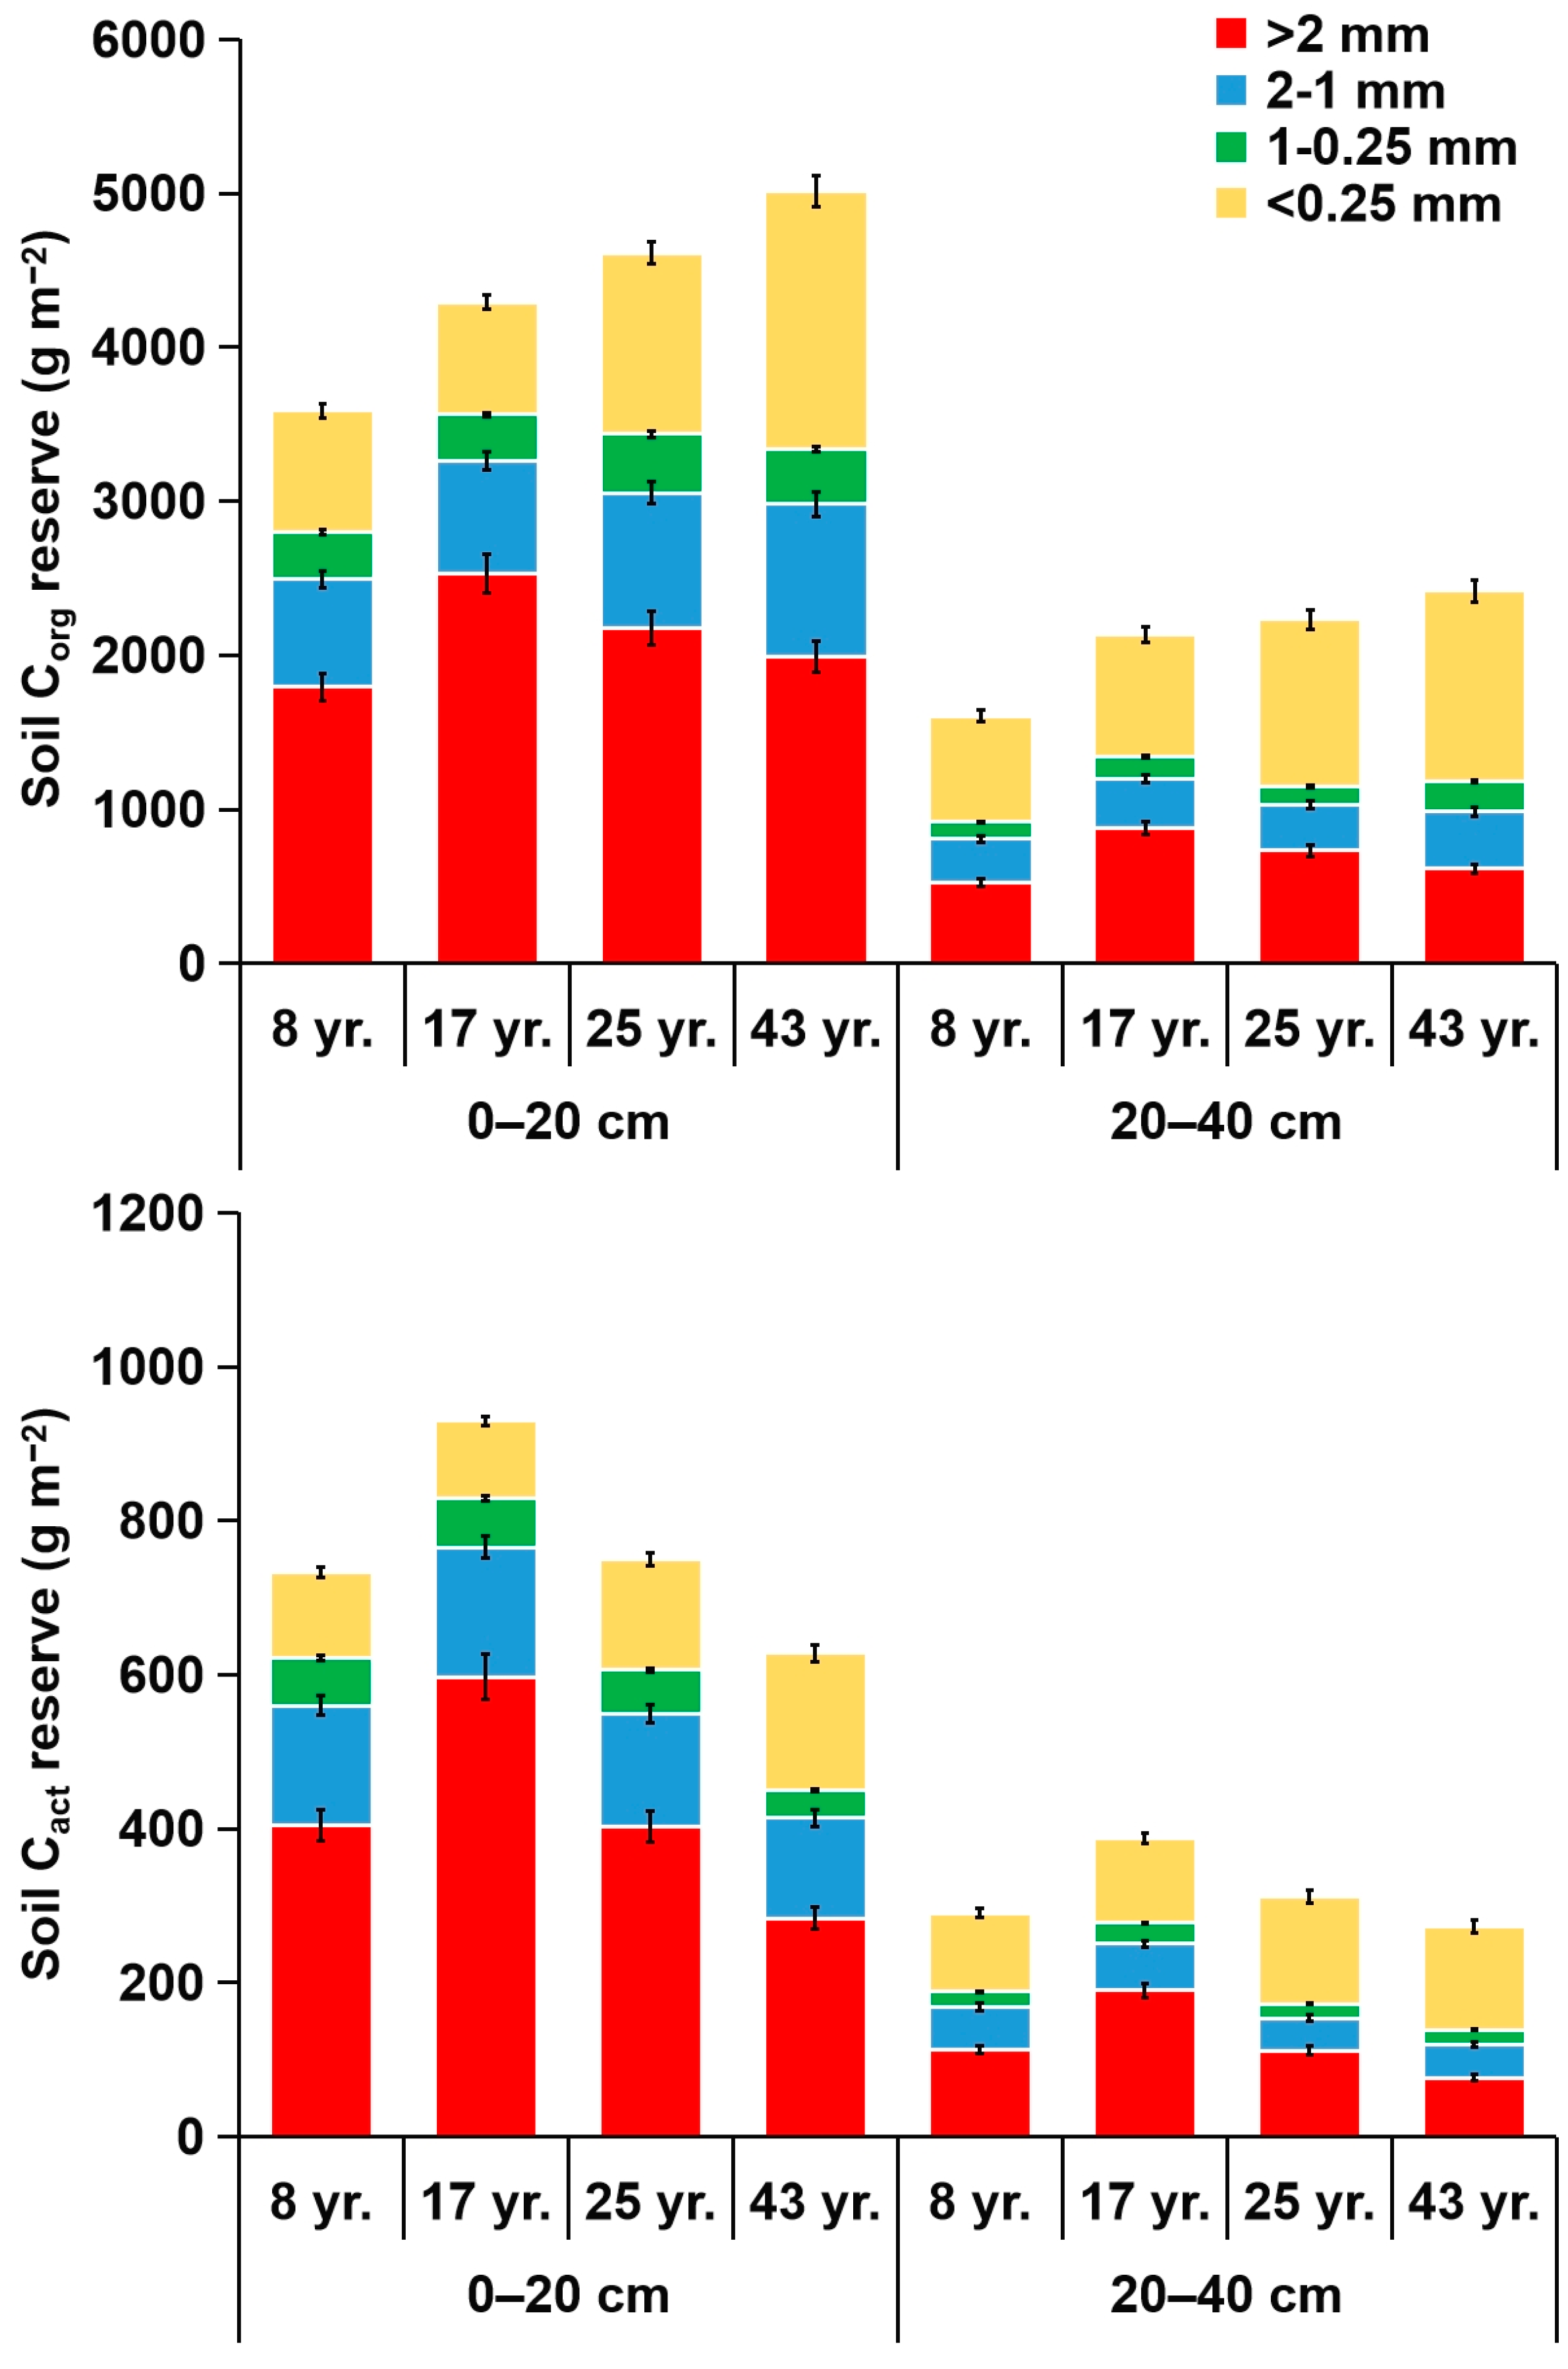
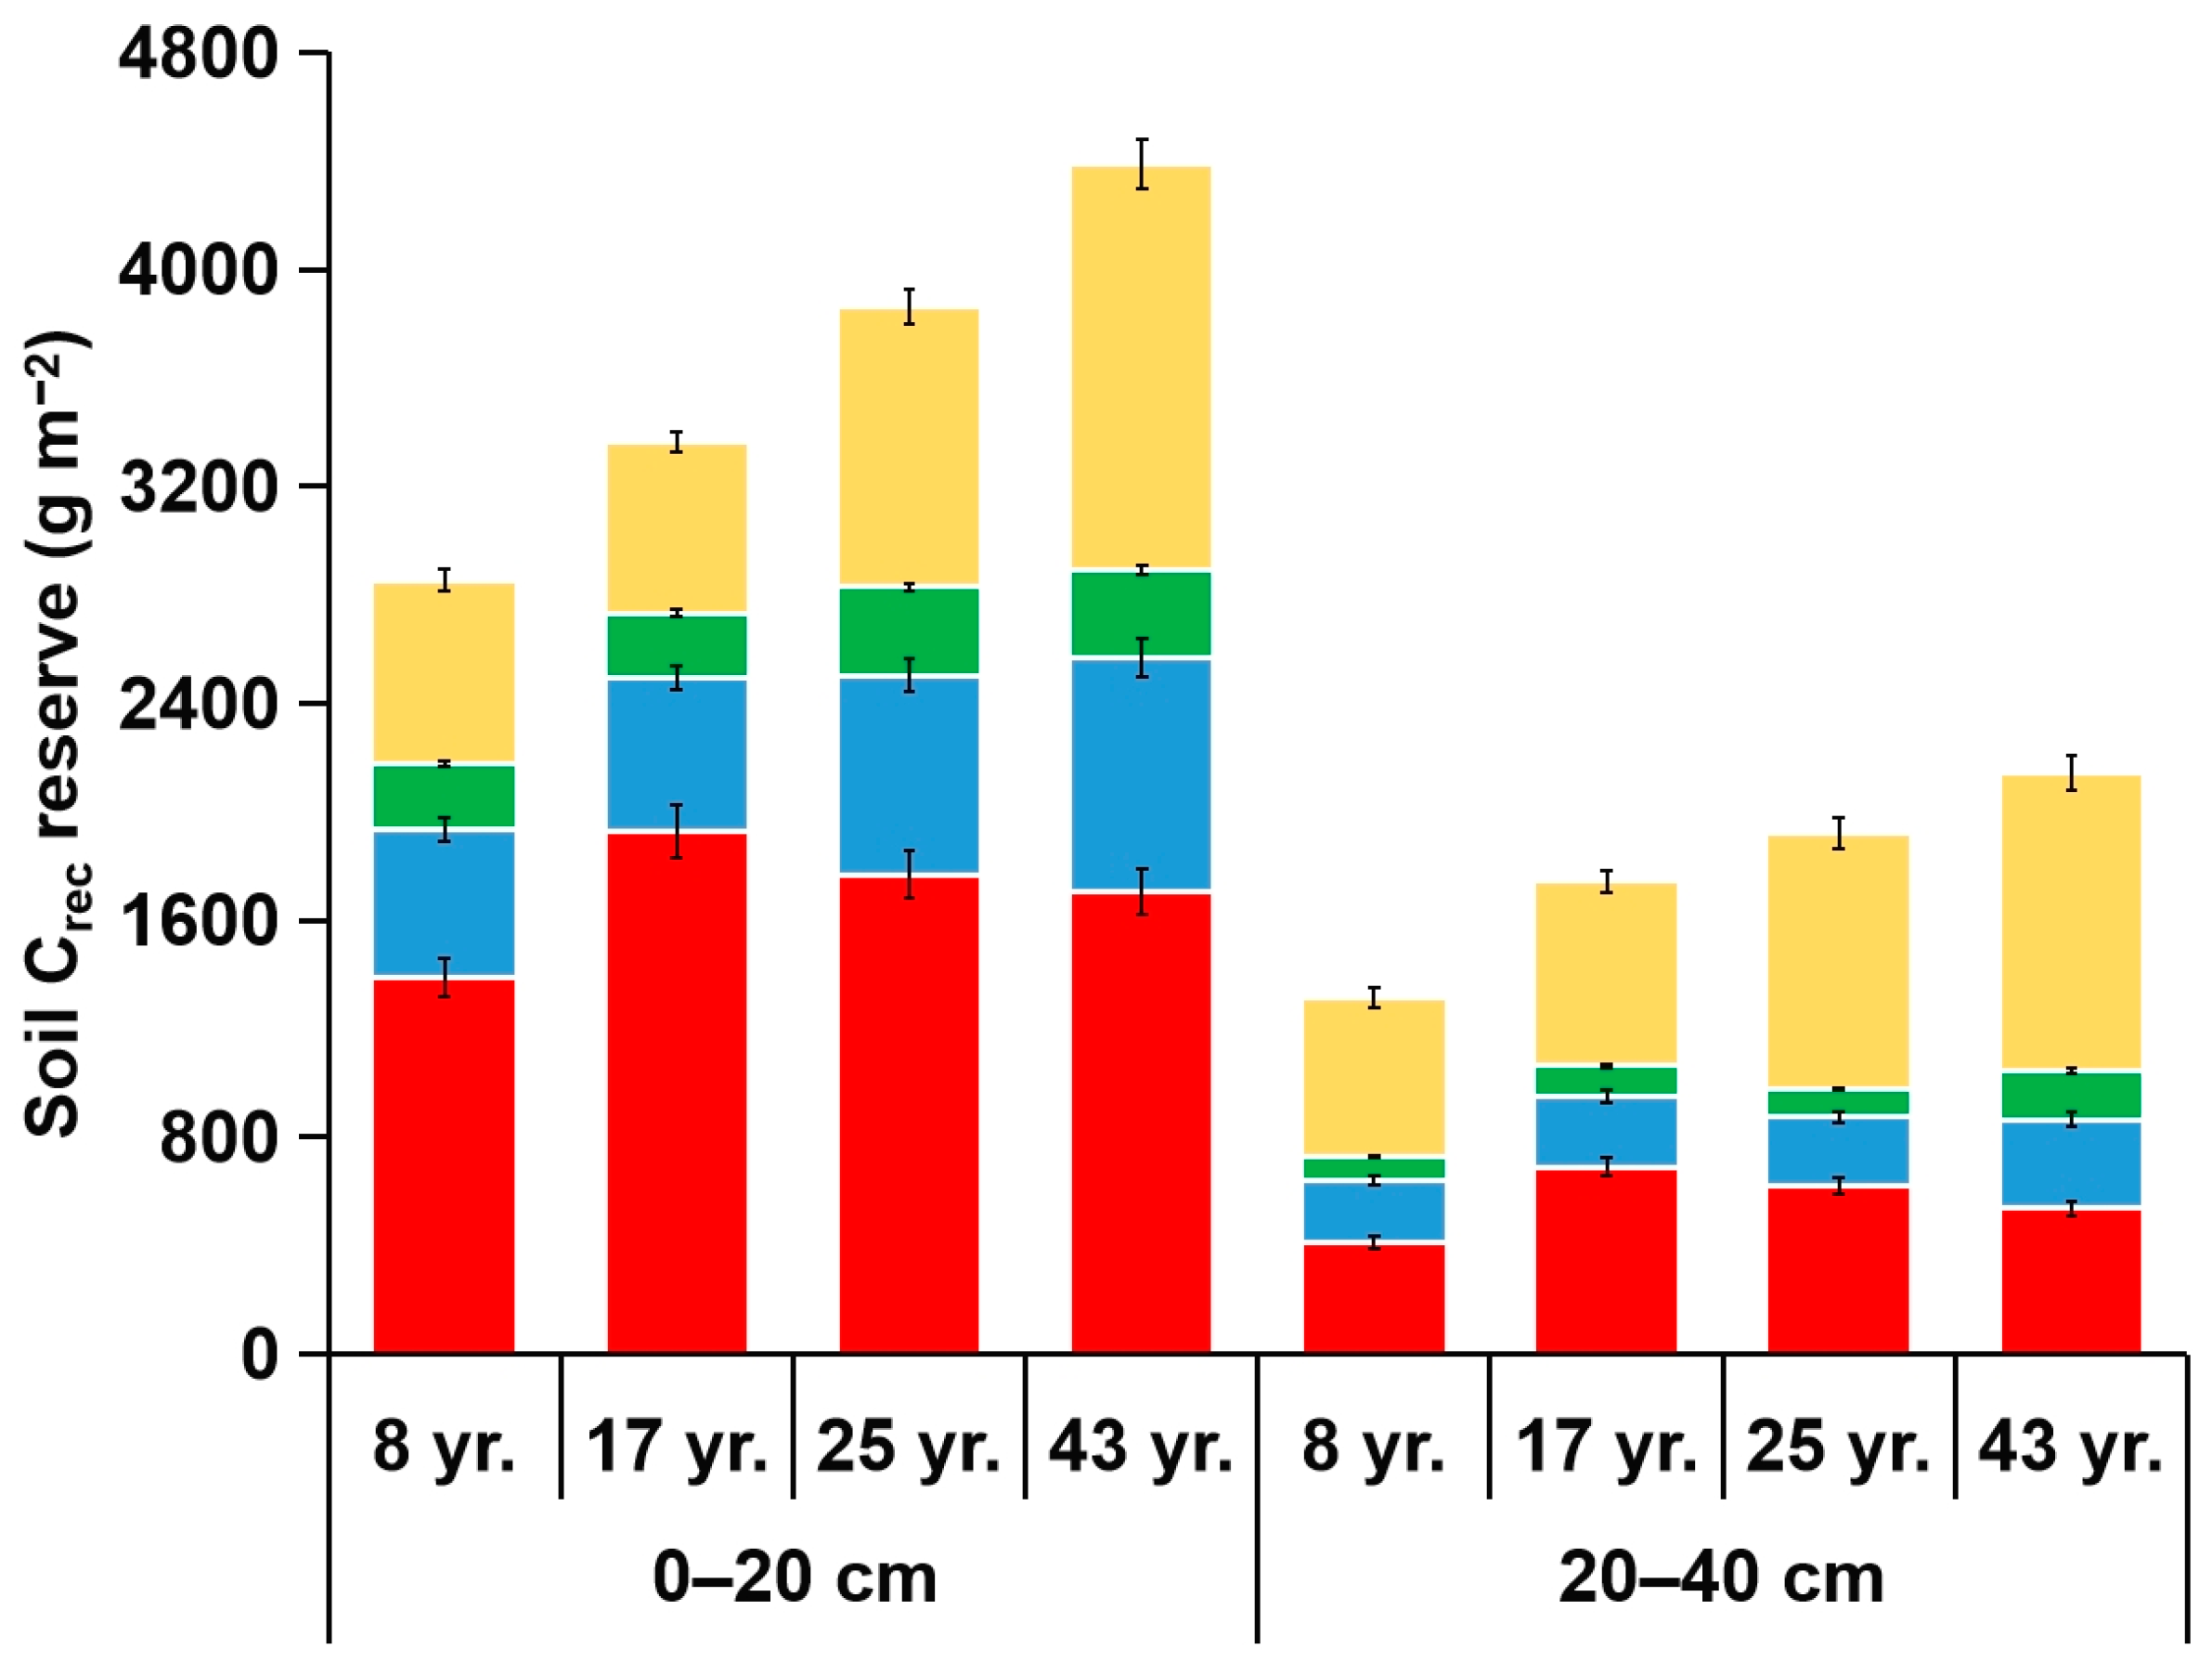
3.3. Reserves of Corg and Its Fractions in Soil Aggregates

In the tea-planting period, the reserves of soil Corg, Cact, and Crec were the highest in coarse macro-aggregates at the depth of 0–20 cm and in micro-aggregates at the depth of 20–40 cm (Figure 4). For instance, in the 0–20 cm soil layer, the soil Corg reserve across the four tea-planting ages was 1.79–2.53 kg m−2 in the coarse macro-aggregates, contributing to 39.65–58.87% of the soil Corg reserve (Table 3). In contrast, in the 20–40 cm soil layer, the soil Corg reserve was 0.69–1.23 kg m−2 in the micro-aggregates, contributing to 37.11–51.01% of the soil Corg reserve (Table 3). In both soil layers, continuous tea planting had significant effects on the soil Corg, Cact, and Crec reserves. Specifically, the soil Corg and Crec reserves increased significantly over time; meanwhile, the soil Cact reserve was relatively high in the 17-year-old tea plantations compared with other ages.

4. Discussion

4.1. Composition and Stability of Soil Aggregates

Regardless of the tea-planting age, the coarse macro-aggregates and micro-aggregates played predominant roles in the 0–20 and 20–40 cm soil layers, respectively (Table 2), indicating a transformation of soil aggregate composition from coarse macro-aggregate-dominant to micro-aggregate-dominant as the soil depth increased. Similarly, coarse macro-aggregates were dominant in the 0–20 cm soil layer as corroborated by Li et al. [16] from a study on tea plantations in southwestern China. In addition, it was also reported that coarse macro-aggregates were dominant in the surface soil (0–20 cm) of dry tropical forests in India [26]. In this study, coarse macro-aggregates were the dominant fractions in the 0–20 cm soil layer, which might be because of surface accumulation of soil Corg (especially Cact) (Figure 3) that provided cementing agents to facilitate coarse macro-aggregate formation [27,28]. Moreover, the data reported here—that the proportion of macro-aggregates decreased as the soil depth increased (Table 2)—conformed to the results obtained from Modak et al. [12]. The decreased macro-aggregate proportion was possibly ascribed to the elevated soil compactness (based on the bulk density) as the soil depth increased (Table 1). Soil densification could prevent plant root growth, thus leading to reduced activity of microbes, like fungi [23]. Reduced activity of fungi could lower polysaccharides and glomalin-related soil protein (GRSP) production from the fungal hyphae, thus resulting in a reduced macro-aggregate proportion [29]. Likewise, according to our prior studies [30,31], soil microbial activity and GRSP concentration were higher at the 0–20 cm depth compared with the 20–40 cm depth, and they played important roles during the formation and stabilization of soil macro-aggregates in the ecosystem of tea plantations.
At the early (from 8 to 17 years) stage, tea planting facilitated coarse macro-aggregate formation in the 0–20 and 20–40 cm soil layers (Table 2). By contrast, at the middle (from 17 to 25 years) and late (from 25 to 43 years) stages, tea planting caused coarse macro-aggregate destruction and micro-aggregate release (Table 2). These results confirm the previous findings that the age of tea planting significantly affects the aggregate composition in soil [32,33]. During the tea-planting process, the changed soil aggregate stability is evidenced by the changed soil MWD [34]. Regardless of the soil layer, the decline in MWD after 17 years of tea planting might be associated with the variation in soil aggregate composition, particularly for the decomposition of coarse macro-aggregates to micro-aggregates. These results indicated that 17-year-old tea plantations had higher soil aggregate stability than the rest of the plantations (Figure 2). According to the soil aggregates’ hierarchy concept [4], the quality of plant litter that returns into the soil decides the distribution of litter in various sized aggregates, which eventually affects the composition of soil aggregates. In the early period of tea planting, tea litter showed higher availability (based on the smaller litter C/N ratio, Table 1), implying that the litter was easily combined into the coarse macro-aggregates during its decomposition process at this stage, thus facilitating coarse macro-aggregate formation [10]. On the contrary, in the middle and late periods of tea planting, tea plants experienced a natural aging process and litter was gradually humified, which caused the decomposition of coarse macro-aggregates to micro-aggregates [35].
Soil Corg has been extensively recognized as a vital binding agent of soil aggregation [4]. Most reports have revealed the high association between aggregate stability and Corg concentration in soil [36,37,38]. Nonetheless, findings from this study showed no significant association (p > 0.05) between MWD and Corg concentration during the tea-planting process, irrespective of the soil layer (Figure 5). Besides, our first hypothesis was not sufficiently supported by the findings that soil aggregate stability declined following 17 years of tea planting, but soil Corg concentration increased continuously over time. In the period of tea planting, the 17-year-old tea plantations had the highest level of soil aggregate stability (Figure 2), possibly due to the soil Cact accumulation in these plantations (Figure 3). Soil Cact is important for soil aggregation, and it combines micro-aggregates to form macro-aggregates, thereby promoting macro-aggregate formation and enhancing aggregate stability [4]. Therefore, the correlation between MWD and Cact concentration in soil across the four different tea-planting ages was analyzed in this study, which indicated the positive association (p < 0.05) between them (Figure 5), further implying that soil aggregate stability was highly associated with the Cact concentration rather than Corg during the tea-planting process.

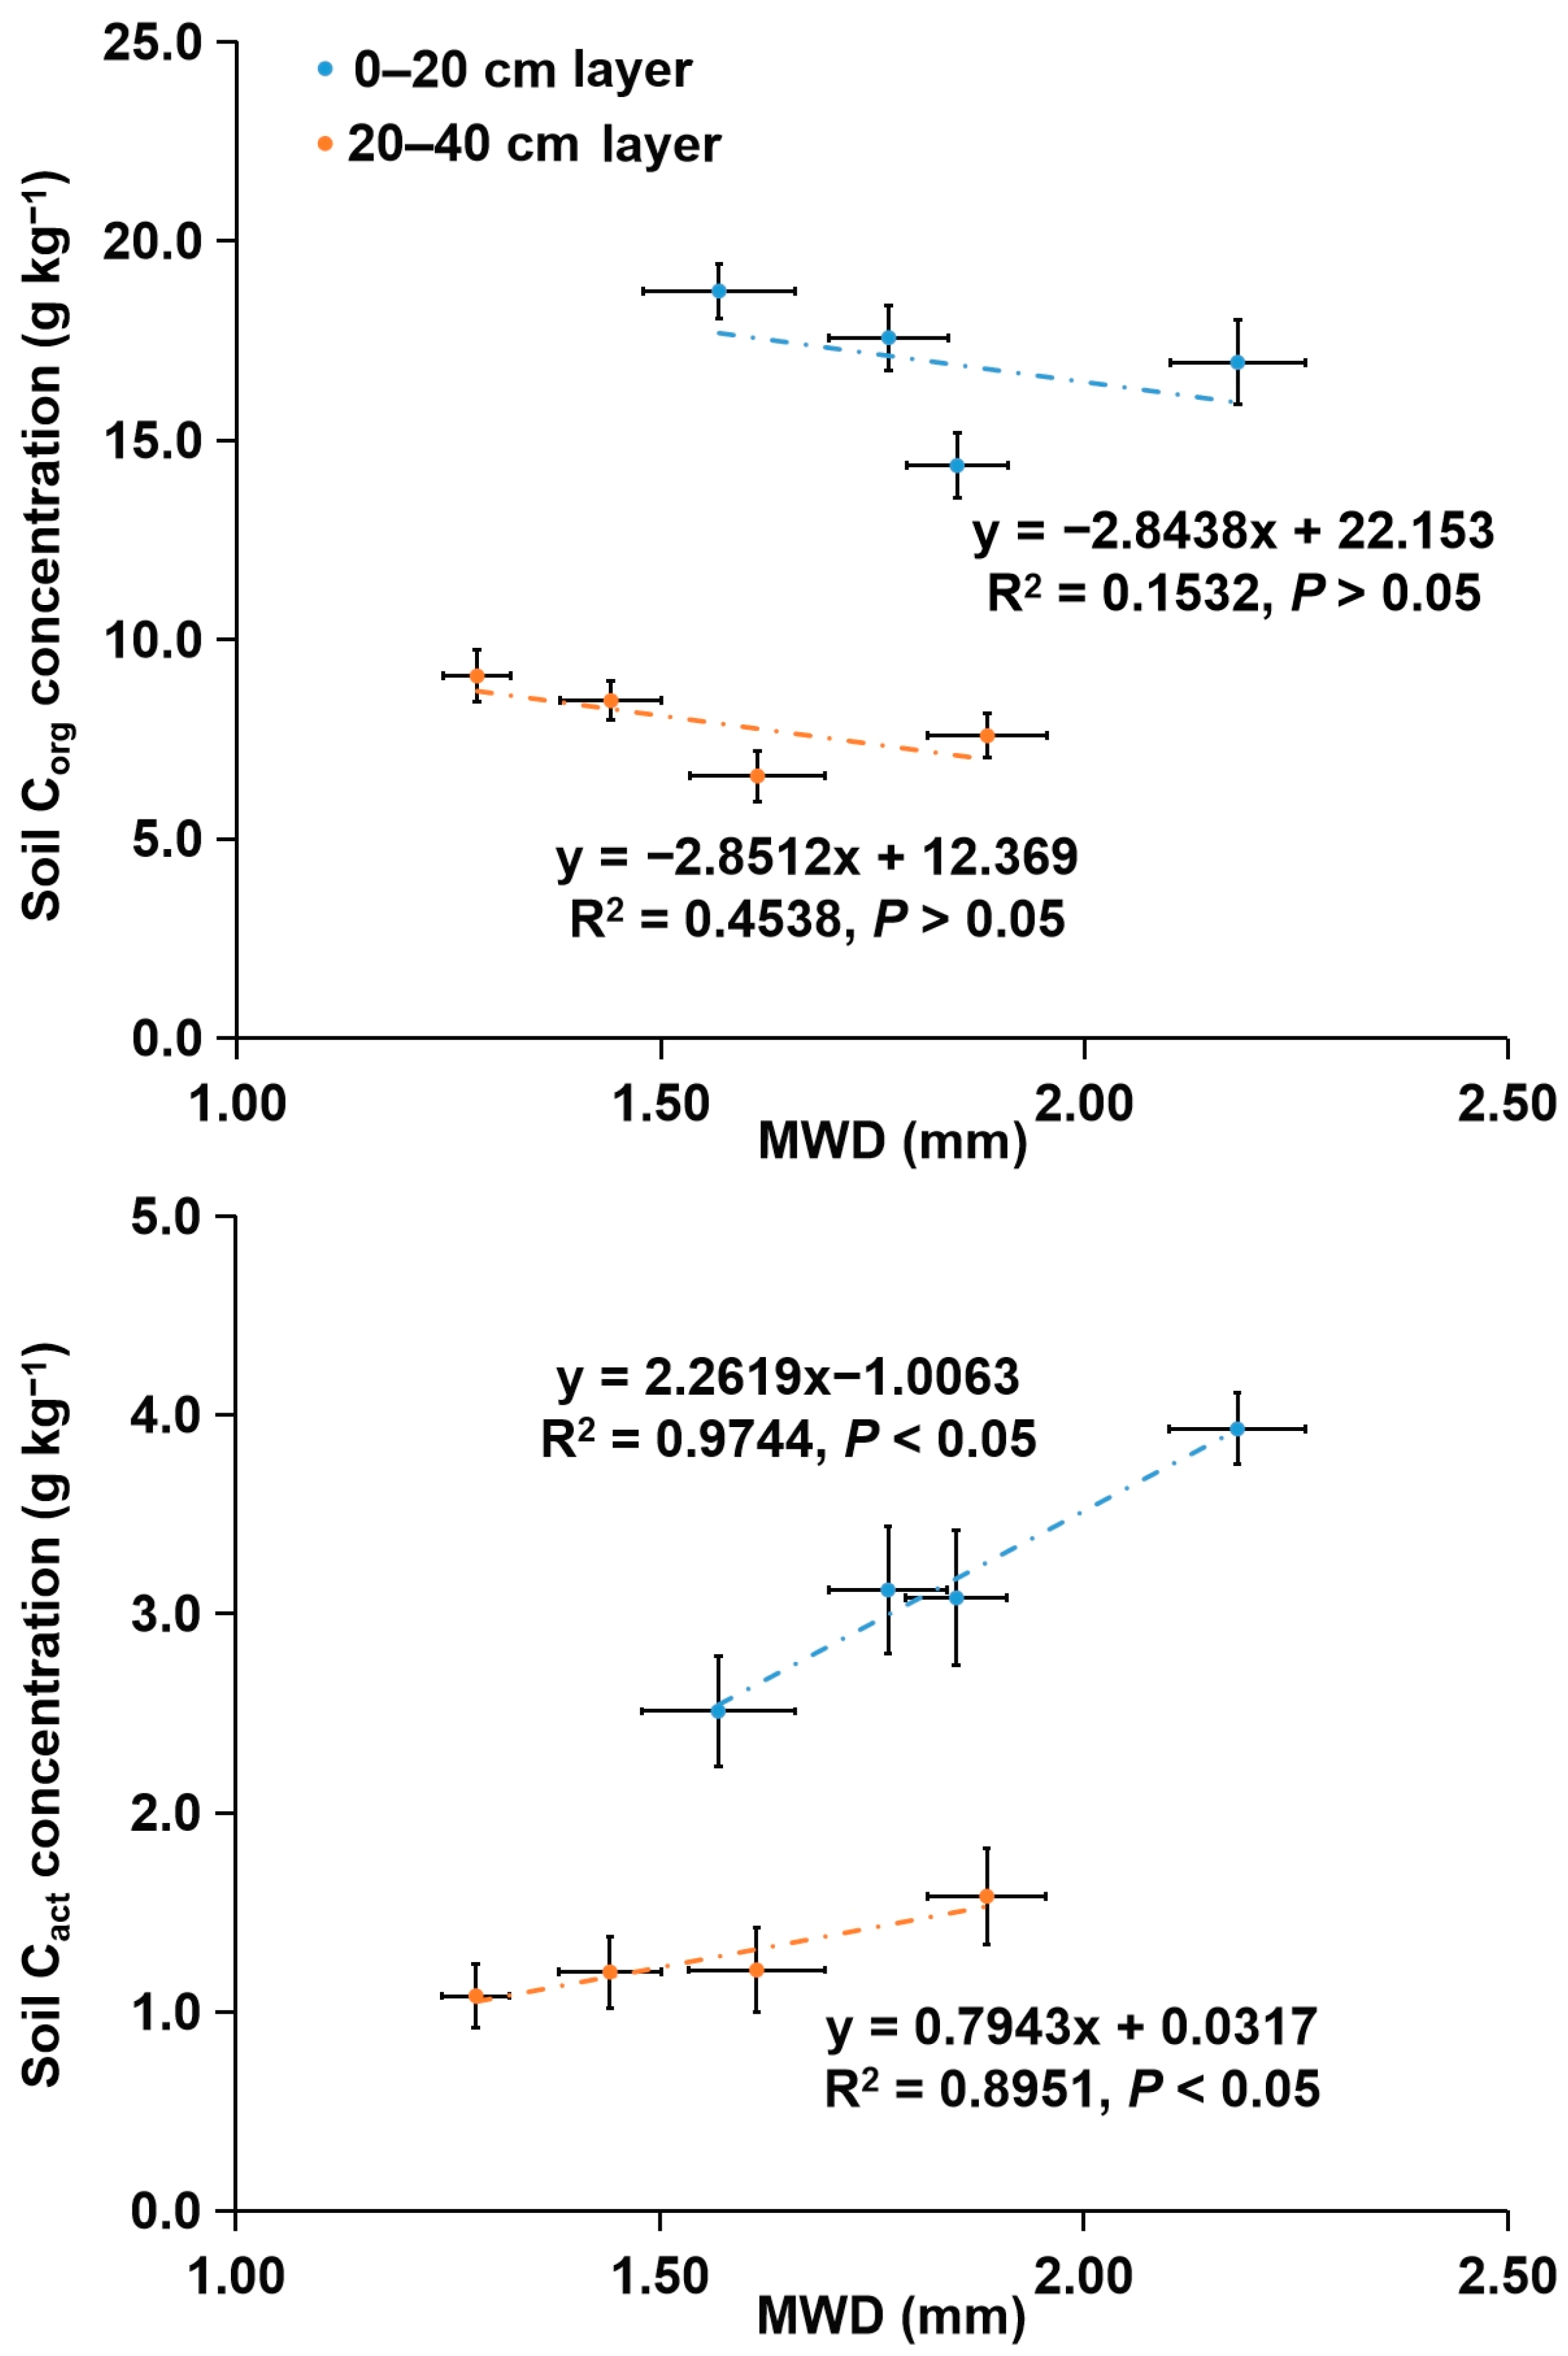
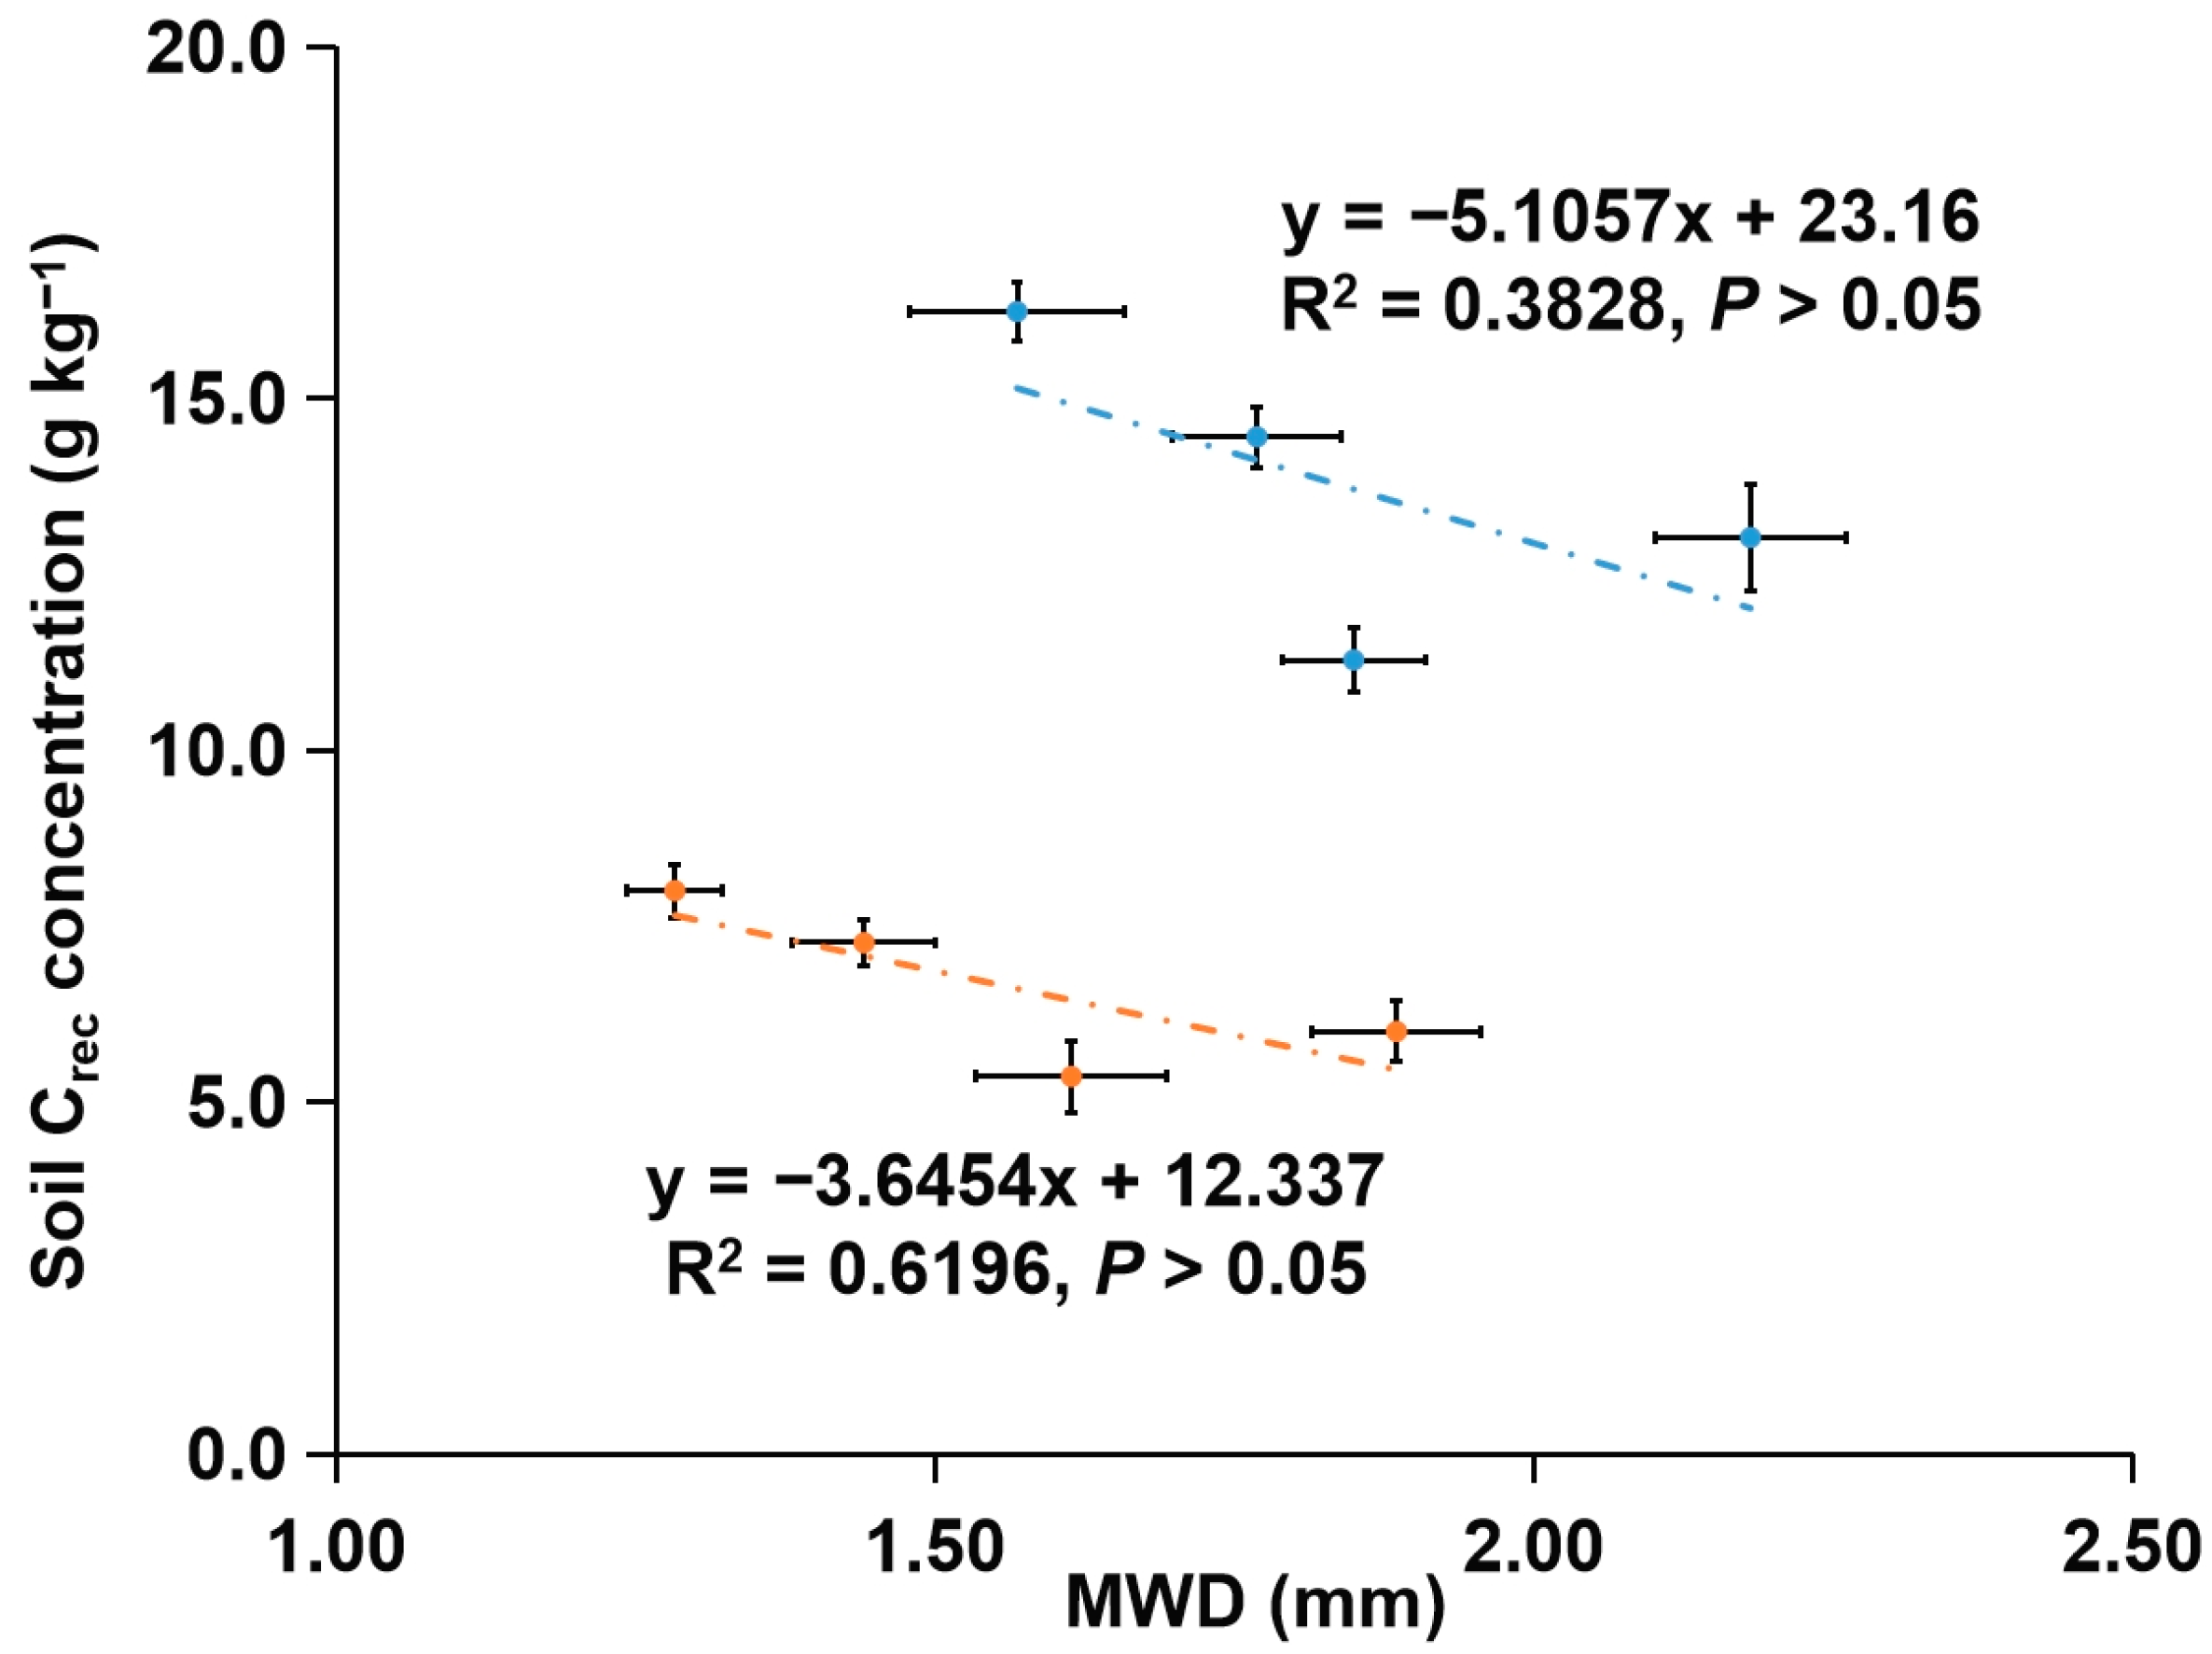
4.2. Concentrations of Corg and Its Fractions in Soil Aggregates

In this study, soil coarse and medium macro-aggregates contained higher Corg concentrations in all tea plantations (Figure 3), consistent with the research by Six et al. [4] suggesting that primary particles combine with recalcitrant bindings for micro-aggregate formation; later, micro-aggregates combine with active bindings to form macro-aggregates. In addition, macro-aggregates can physically protect Corg, thereby resulting in the higher Corg concentration in the macro-aggregates [22]. Similarly, O’Brien and Jastrow [39] as well as Gentile et al. [40] also confirmed that soil aggregates’ hierarchy concept resulted in an increase in Corg concentration with the increase in aggregate size and soil macro-aggregate stability was vital for soil Corg sequestration. Likewise, the distribution patterns of Cact and Crec concentrations were similar to those of Corg in soil aggregates (Figure 3). Soil Cact/Crec ratio, also called the “oxidation stability coefficient”, is an important indicator for indicating soil Corg availability [12]. As revealed by Blair et al. [41], the reduced soil Cact/Crec ratio stood for the decreased soil Corg availability within the agroecosystems. In this study, soil Cact/Crec ratio showed an increasing trend with the increase in aggregate size, irrespective of the tea-planting age (Figure 3), which implied that soil Corg in coarse macro-aggregates was more labile and younger than that in finer aggregates; meanwhile, micro-aggregate-associated Corg experienced greater degradation and became more recalcitrant. In short, the present study found that a higher concentration of Corg was observed in the macro-aggregates, and the Corg in these aggregates was younger with a higher availability.
Continuous tea planting was beneficial for the accumulation of soil Corg (Figure 3), which demonstrated the results obtained by articles stating that afforestation was an important way for increasing the concentration of soil Corg [13]. In this study, the increase in soil Corg concentration over time is associated with the following mechanisms. First, the application of manure is demonstrated to have positive impact on the soil Corg accumulation [34]. Likewise, an increase in the concentration of soil Corg during the process of tea planting may be because large amount of swine manure is applied every year (12 Mg ha−1 year−1) [19]. Second, plant litter is the main Corg source in soil [42]. In the period of tea planting, the accumulation of soil Corg could occur because the quantity of above-ground tea litter increases through routine trimming of tea leaf and branch (Table 1). Third, no-tillage contributes to protecting the integration of soil aggregates with Corg, thus enhancing soil Corg sequestration [43].
The stand age-associated trend of soil Crec concentration in tea plantations was consistent with that of soil Corg concentration (Figure 3). The recalcitrant organic compounds remain during the decomposition and transformation of plant litter [23] and then accumulate in soil due to the selective preservation [44]. Additionally, there are lignin and tannin within tea litter, which can increase the concentration of soil Crec [45]. Notably, contrary to soil Corg and Crec, the Cact concentration in soil was the highest in the 17-year-old tea plantations (Figure 3), which was mainly related to the characteristics of tea litter [46]. According to our results, the 17-year-old tea plantations showed the highest levels of litter quantity and quality (based on the smallest C/N ratio of litter), but later the litter quantity and quality declined significantly over time (Table 1) due to the natural aging process of tea plants, which could explain why soil Cact concentration was consistent with the litter dynamic in the tea-planting period [47]. Litter decomposed in soil could strongly affect soil Corg fractions by changing the contacts between litter decomposition products and soil solid phases, thereby affecting soil Corg availability [47]. In the early period of tea planting, the growing rate of Cact concentration (0–20 cm layer: 27.60%; 20–40 cm layer: 30.58%) was greater than that of Crec concentration (0–20 cm layer: 15.41%; 20–40 cm layer: 11.92%) in both soil layers (Figure 3); meanwhile, a significant decrease in soil Cact concentration in the middle and late periods was accompanied by a significant increase in soil Crec concentration (Figure 3), which led to the highest soil Corg availability (based on the highest Cact/Crec ratio in soil) in the 17-year-old tea plantations (Figure 3).
The higher aggregate-associated Corg concentration in the 0–20 cm soil layer (Figure 3) conformed to findings by Kurmi et al. [23] stating that the surface accumulation of soil Corg was associated with increased input of organic matters in the 0–20 cm soil layer. For all tea plantations, the application of swine manure, as well as the input of tea litter and roots, enriched the aggregate-associated Corg concentration in the 0–20 cm soil layer [16]. Besides, in the 20–40 cm soil layer, aggregate-associated Corg concentration depended mainly on the input of root exudation and debris, as well as on the downward transfer of organic matters by rainfall water and soil fauna [48]. Similarly, soil aggregate-associated Cact and Crec concentrations were relatively high in the 0–20 cm soil layer compared with the 20–40 cm (Figure 3). Soil Cact/Crec ratio at the 0–20 cm depth was greater than that at the 20–40 cm depth in the period of tea planting (Figure 3), implying that the soil layer of 20–40 cm had a more stable soil Corg pool in tea plantations. Moreover, the impact of tea-planting age on the concentration of aggregate-associated Corg was more significant at the soil depth of 0–20 cm than at 20–40 cm (Figure 3), because aggregate-associated Corg at the soil depth of 0–20 cm was more easily influenced by the tea litter returned to the soil, as well as the fertilizer application.

4.3. Reserves of Corg and Its Fractions in Soil Aggregates

In the tea-planting period, the reserve of Corg in coarse macro-aggregates made a greater contribution to that of soil in the surface layer (0–20 cm), implying that coarse macro-aggregates were the dominant carriers of Corg in the surface soil. Differently, in the deeper soil layer (20–40 cm), the dominant carriers of Corg were micro-aggregates (Table 3). Although micro-aggregates had the lowest concentrations of Corg in the deeper soil layer (Figure 3), the contribution of Corg reserve in micro-aggregates to soil was greater than that of the other aggregates (Table 3), because micro-aggregates occupied the highest proportion in soil of the deeper layer (Table 2). According to the above findings, the Corg reserve in soil aggregates was mainly dependent on the proportion of different-sized aggregates in tea plantations.
The variation in the soil Corg reserve in a period of tea planting divided by the length of this period is utilized as an index for estimating the increase or decrease rate of the soil Corg reserve [49]. Most of the reported soil Corg sequestration rates have been within an order of magnitude, with a mean of 33 g Corg m−2 year−1 for forestry and agricultural chronosequences [50]. In this study, as the tea-planting age increased from 8 to 43 years (length, 35 years), the increase rate of the soil Corg reserve was 40.83 and 23.17 g Corg m−2 year−1 in the 0–20 and 20–40 cm layers, respectively (Figure 4), implying that soil Corg accumulation was faster in the surface layer than in the deeper layer during the tea-planting process.
Notably, the increase rate of the soil Corg reserve was different at various stages of tea planting (Figure 6), which was consistent with our second hypothesis. To be specific, in the early, middle, and late periods of tea planting, the soil Corg reserve increased by 78.49, 39.85, and 22.44 g Corg m−2 year−1 in the 0–20 cm layer, and increased by 58.54, 12.40, and 10.27 g Corg m−2 year−1 in the 20–40 cm layer, respectively, with the soil Corg reserve of the 8-year-old tea plantations as a reference point. In addition, the soil Crec reserve showed a similar trend over time in both layers (Figure 4 and Figure 6), indicating that although continuous tea planting facilitated the accumulation of soil Corg and Crec, the increase rates of their reserves showed a decreasing trend with the increase in tea-planting age. Different from the soil Corg and Crec reserves, the highest level of soil Cact reserve was observed in the 17-year-old tea plantations (Figure 4). In the surface layer, the soil Cact reserve increased by 21.82 g Cact m−2 year−1 in the early period of tea planting, but it decreased by 22.51 and 6.76 g Cact m−2 year−1, respectively, in the middle and late periods (Figure 6). A similar trend was also observed in the deeper soil layer (Figure 6). Such findings indicate that soil Cact had a risk of reduction in the middle and late periods of tea planting.
According to the above discussion, measuring the diverse active fractions of soil aggregate-associated Corg is effective to characterize the changes of soil Corg quantity and quality during the tea-planting process. Nonetheless, for achieving sustainable utilization of soil resources in tea plantations, more efforts should be made to understand the decomposition potential of soil aggregate-associated Corg at diverse stages of tea planting. Based on our results, soil Corg concentration and availability in aggregates were mainly dependent on the aggregate size. Meanwhile, tea-planting age played an important role in changing the composition of different-sized aggregates in soil, which implied that tea-planting age did not affect soil Corg accumulation and decomposition individually; by contrast, the variation in soil aggregate composition was of great importance in the tea-planting period. Therefore, based on the connection (namely, “treatment-aggregate-carbon”), investigation of the soil Corg fraction distribution in different-sized aggregates is helpful in acquiring a better understanding of the soil carbon cycle for other tea-planting regions with different soil types (especially for the latosol) in the subtropics.

5. Conclusions

During the process of tea planting, soil aggregate stability was the highest in the 17-year-old tea plantations, and it was closely related to the concentration of soil Cact, but not Corg. Continuous tea planting facilitated the accumulation of soil Corg and Crec, but their reserves’ increase rates decreased as the tea-planting age increased. Additionally, the soil Cact reserve increased in the early (from 8 to 17 years) period of tea planting and then decreased over time. Therefore, in the middle (from 17 to 25 years) and late (from 25 to 43 years) periods of tea planting, maintaining soil as an Cact pool plays a vital role in facilitating the formation and stabilization of soil aggregates in southern Guangxi, China. This study sheds more lights on how tea-planting age affects the dynamic of soil Corg. For better understanding soil carbon sink or source effect in the tea plantation ecosystem, further investigations of soil carbon-relevant enzyme activities at the aggregate scale are necessary, because determining the activities of soil carbon-relevant enzymes is important for assessing the potential of soil Corg decomposition.

Author Contributions

S.W. and S.Y. designed the experiments; C.Z. and X.H. carried out the experiments; C.Z. and X.H. analyzed the experimental results; C.Z., X.H., S.W. and S.Y. wrote and edited the manuscript. All authors have read and agreed to the published version of the manuscript.

Funding

The National College Students’ Innovation and Entrepreneurship Training Program of Guangxi University (202110593049) and the Natural Science Foundation of Guangxi (2019GXNSFBA185012) financed this study.

Institutional Review Board Statement

Not applicable.

Informed Consent Statement

Not applicable.

Data Availability Statement

The data supporting the discovered information here can be presented by the relevant author based on reasonable requests.

Acknowledgments

The authors would like to express their gratitude to the editors and innominate reviewers for giving conducive advises and optimizing this article.

Conflicts of Interest

The authors declare no conflict of interest.

References

  1. Chinese Tea Committee. An area planted with tea in various provinces at the end of each year. Ann. Bull. Stat. 2020, 47, 20. [Google Scholar]
  2. Jiang, J.; Jiang, W.; Jiang, W. The present situation and countermeasures of the development of tea industry in Guangxi. Popular Sci. Technol. 2018, 20, 72–73. [Google Scholar] [CrossRef]
  3. Bleuler, M.; Farina, R.; Francaviglia, R.; Di Bene, C.; Napoli, R.; Marchetti, A. Modelling the impacts of different carbon sources on the soil organic carbon stock and CO2 emissions in the Foggia province (Southern Italy). Agric. Syst. 2017, 157, 258–268. [Google Scholar] [CrossRef]
  4. Six, J.; Bossuyt, H.; Degryze, S.; Denef, K. A history of research on the link between (micro)aggregates, soil biota, and soil organic matter dynamics. Soil Tillage Res. 2004, 79, 7–31. [Google Scholar] [CrossRef]
  5. Liu, Y.; Wang, C.; Chen, M. Carbon flow analysis of China’s agro-ecosystem from 1980 to 2013: A perspective from substance flow analysis. J. Environ. Sci. 2017, 55, 20–32. [Google Scholar] [CrossRef] [PubMed]
  6. Huang, R.; Tian, D.; Liu, J.; Lv, S.; He, X.; Gao, M. Responses of soil carbon pool and soil aggregates associated organic carbon to straw and straw-derived biochar addition in a dryland cropping mesocosm system. Agric. Ecosyst. Environ. 2018, 265, 576–586. [Google Scholar] [CrossRef]
  7. Mizuta, K.; Taguchi, S.; Sato, S. Soil aggregate formation and stability induced by starch and cellulose. Soil Biol. Biochem. 2015, 87, 90–96. [Google Scholar] [CrossRef]
  8. Li, C.; Li, Y.; Xie, J.; Wang, Y.; Liu, X. Accumulation of organic carbon and its association with macro-aggregates during 100 years of oasis formation. CATENA 2018, 172, 770–780. [Google Scholar] [CrossRef]
  9. Voltolini, M.; Taş, N.; Wang, S.; Brodie, E.; Ajo-Franklin, J.B. Quantitative characterization of soil micro-aggregates: New opportunities from sub-micron resolution synchrotron X-ray microtomography. Geoderma 2017, 305, 382–393. [Google Scholar] [CrossRef] [Green Version]
  10. Tisdall, J.M.; Oades, J.M. Organic matter and water-stable aggregates in soils. Eur. J. Soil Sci. 1982, 33, 141–163. [Google Scholar] [CrossRef]
  11. Medinski, T.V.; Freese, D.; Böhm, C.; Slazak, A. Soil carbon fractions in short rotation poplar and black locust coppices, Germany. Agrofor. Syst. 2014, 88, 505–515. [Google Scholar] [CrossRef]
  12. Modak, K.; Ghosh, A.; Bhattacharyya, R.; Biswas, D.R.; Das, T.K.; Das, S.; Singh, G. Response of oxidative stability of aggregate-associated soil organic carbon and deep soil carbon sequestration to zero-tillage in subtropical India. Soil Tillage Res. 2019, 195, 104370. [Google Scholar] [CrossRef]
  13. Li, G.-L.; Pang, X.-M. Effect of land-use conversion on C and N distribution in aggregate fractions of soils in the southern Loess Plateau, China. Land Use Policy 2010, 27, 706–712. [Google Scholar] [CrossRef]
  14. Zeng, L.; Li, J.; Zhou, Z.; Yu, Y. Optimizing land use patterns for the grain for Green Project based on the efficiency of ecosystem services under different objectives. Ecol. Indic. 2020, 114, 106347. [Google Scholar] [CrossRef]
  15. Zhang, Q.; Gao, W.; Su, S.; Weng, M.; Cai, Z. Biophysical and socioeconomic determinants of tea expansion: Apportioning their relative importance for sustainable land use policy. Land Use Policy 2017, 68, 438–447. [Google Scholar] [CrossRef]
  16. Li, W.; Zheng, Z.; Li, T.; Zhang, X.; Wang, Y.; Yu, H.; He, S.; Liu, T. Effect of tea plantation age on the distribution of soil organic carbon fractions within water-stable aggregates in the hilly region of Western Sichuan, China. CATENA 2015, 133, 198–205. [Google Scholar] [CrossRef]
  17. Zhu, R.; Zheng, Z.; Li, T.; Zhang, X.; He, S.; Wang, Y.; Liu, T.; Li, W. Dynamics of soil organic carbon mineralization in tea plantations converted from farmland at Western Sichuan, China. PLoS ONE 2017, 12, e0185271. [Google Scholar] [CrossRef] [Green Version]
  18. Wang, S.; Tang, L.; Ye, S. Dynamics of soil bacterial community diversity and composition at aggregate scales in a chronosequence of tea gardens. CATENA 2021, 206, 105486. [Google Scholar] [CrossRef]
  19. Wang, S.; Ye, S. Dynamics of bacterial function characteristics in soil aggregates during the tea-planting process. Geoderma 2020, 377, 114609. [Google Scholar] [CrossRef]
  20. Nelson, D.W.; Sommers, L.E. Total carbon, organic carbon and organic matter. In Chemical Methods; Sparks, D.L., Ed.; ASA and SSSA: Madison, WI, USA, 1996; Part 3, No. 5; pp. 961–1010. [Google Scholar]
  21. Bremner, J.M. Nitrogen-total. In Chemical Methods; Sparks, D.L., Ed.; ASA and SSSA: Madison, WI, USA, 1996; Part 3, No. 5; pp. 1085–1121. [Google Scholar]
  22. Six, J.; Conant, R.; Paul, E.A.; Paustian, K. Stabilization mechanisms of soil organic matter: Implications for C-saturation of soils. Plant Soil 2002, 241, 155–176. [Google Scholar] [CrossRef]
  23. Kurmi, B.; Nath, A.J.; Lal, R.; Das, A.K. Water stable aggregates and the associated active and recalcitrant carbon in soil under rubber plantation. Sci. Total. Environ. 2020, 703, 135498. [Google Scholar] [CrossRef]
  24. Nimmo, J.R.; Perkins, K.S. Aggregate stability and size distribution methods of soil analysis. In Physical Methods; Dane, J.H., Ed.; ASA and SSSA: Madison, WI, USA, 1996; Part 4, No. 5; pp. 317–328. [Google Scholar]
  25. Eynard, A.; Schumacher, T.; Lindström, M.; Malo, D. Effects of agricultural management systems on soil organic carbon in aggregates of Ustolls and Usterts. Soil Tillage Res. 2005, 81, 253–263. [Google Scholar] [CrossRef]
  26. Singh, M.K.; Singh, S.; Ghoshal, N. Impact of land use change on soil aggregate dynamics in the dry tropics. Restor. Ecol. 2017, 25, 962–971. [Google Scholar] [CrossRef]
  27. Al-Kaisi, M.M.; Douelle, A.; Kwaw-Mensah, D. Soil microaggregate and macroaggregate decay over time and soil carbon change as influenced by different tillage systems. J. Soil Water Conserv. 2014, 69, 574–580. [Google Scholar] [CrossRef] [Green Version]
  28. Ge, Z.; Fang, S.; Chen, H.Y.; Zhu, R.; Peng, S.; Ruan, H. Soil Aggregation and Organic Carbon Dynamics in Poplar Plantations. Forests 2018, 9, 508. [Google Scholar] [CrossRef] [Green Version]
  29. Ji, L.; Tan, W.; Chen, X. Arbuscular mycorrhizal mycelial networks and glomalin-related soil protein increase soil aggregation in Calcaric Regosol under well-watered and drought stress conditions. Soil Tillage Res. 2018, 185, 10. [Google Scholar] [CrossRef]
  30. Wang, S.; Li, T.; Zheng, Z. Distribution of microbial biomass and activity within soil aggregates as affected by tea plantation age. CATENA 2017, 153, 29. [Google Scholar] [CrossRef]
  31. Zhu, R.; Zheng, Z.; Li, T.; He, S.; Zhang, X.; Wang, Y.; Liu, T. Effect of tea plantation age on the distribution of glomalin-related soil protein in soil water-stable aggregates in southwestern China. Environ. Sci. Pollut. Res. 2018, 26, 1973–1982. [Google Scholar] [CrossRef] [PubMed]
  32. He, Y.; Xu, C.; Gu, F.; Wang, Y.; Chen, J. Soil aggregate stability improves greatly in response to soil water dynamics under natural rains in long-term organic fertilization. Soil Tillage Res. 2018, 184, 281–290. [Google Scholar] [CrossRef]
  33. Wu, W.; Zheng, Z.; Li, T.; He, S.; Zhang, X.; Wang, Y.; Liu, T. Distribution of inorganic phosphorus fractions in water-stable aggregates of soil from tea plantations converted from farmland in the hilly region of western Sichuan, China. J. Soils Sediments 2017, 18, 906–916. [Google Scholar] [CrossRef]
  34. Yin, J.; Zheng, Z.; Li, T.; Zhang, X.; He, S.; Wang, Y.; Yu, H.; Liu, T. Effect of tea plantation age on the distribution of fluoride and its fractions within soil aggregates in the hilly region of Western Sichuan, China. J. Soils Sediments 2016, 16, 2128–2137. [Google Scholar] [CrossRef]
  35. Six, J.; Paustian, K. Aggregate-associated soil organic matter as an ecosystem property and a measurement tool. Soil Biol. Biochem. 2014, 68, A4–A9. [Google Scholar] [CrossRef]
  36. Luna, L.; Miralles, I.; Andrenelli, M.C.; Gispert, M.; Pellegrini, S.; Vignozzi, N.; Solé-Benet, A. Restoration techniques affect soil organic carbon, glomalin and aggregate stability in degraded soils of a semiarid Mediterranean region. CATENA 2016, 143, 256–264. [Google Scholar] [CrossRef]
  37. Li, C.; Cao, Z.; Chang, J.; Zhang, Y.; Zhu, G.; Zong, N.; He, Y.; Zhang, J.; He, N. Elevational gradient affect functional fractions of soil organic carbon and aggregates stability in a Tibetan alpine meadow. CATENA 2017, 156, 139–148. [Google Scholar] [CrossRef]
  38. Xue, B.; Huang, L.; Huang, Y.; Zhou, F.; Li, F.; Kubar, K.A.; Li, X.; Lu, J.; Zhu, J. Roles of soil organic carbon and iron oxides on aggregate formation and stability in two paddy soils. Soil Tillage Res. 2019, 187, 161–171. [Google Scholar] [CrossRef]
  39. O’Brien, S.L.; Jastrow, J. Physical and chemical protection in hierarchical soil aggregates regulates soil carbon and nitrogen recovery in restored perennial grasslands. Soil Biol. Biochem. 2013, 61, 31. [Google Scholar] [CrossRef]
  40. Gentile, R.; Vanlauwe, B.; Six, J. Integrated Soil Fertility Management: Aggregate carbon and nitrogen stabilization in differently textured tropical soils. Soil Biol. Biochem. 2013, 67, 124–132. [Google Scholar] [CrossRef]
  41. Blair, G.; Lefroy, R.; Lisle, L. Soil carbon fractions based on their degree of oxidation, and the development of a carbon management index for agricultural systems. Aust. J. Agric. Res. 1995, 46, 1459–1466. [Google Scholar] [CrossRef]
  42. Loss, A.; Lourenzi, C.R.; dos Santos, E.; Mergen, C.A.; Benedet, L.; Pereira, M.; Piccolo, M.D.C.; Brunetto, G.; Lovato, P.E.; Comin, J.J. Carbon, nitrogen and natural abundance of 13C and 15N in biogenic and physicogenic aggregates in a soil with 10 years of pig manure application. Soil Tillage Res. 2017, 166, 52–58. [Google Scholar] [CrossRef]
  43. Varvel, G.; Wilhelm, W. No-tillage increases soil profile carbon and nitrogen under long-term rainfed cropping systems. Soil Tillage Res. 2011, 114, 28–36. [Google Scholar] [CrossRef] [Green Version]
  44. Ostertag, R.; Marin-Spiotta, E.; Silver, W.L.; Schulten, J. Litterfall and Decomposition in Relation to Soil Carbon Pools Along a Secondary Forest Chronosequence in Puerto Rico. Ecosystems 2008, 11, 701–714. [Google Scholar] [CrossRef]
  45. Kraus, T.E.C.; Dahlgren, R.; Zasoski, R.J. Tannins in nutrient dynamics of forest ecosystems—A review. Plant Soil 2003, 256, 41–66. [Google Scholar] [CrossRef]
  46. Castellano, M.J.; Mueller, K.; Olk, D.C.; Sawyer, J.E.; Six, J. Integrating plant litter quality, soil organic matter stabilization, and the carbon saturation concept. Glob. Chang. Biol. 2015, 21, 3200–3209. [Google Scholar] [CrossRef]
  47. Cotrufo, M.F.; Wallenstein, M.D.; Boot, C.M.; Denef, K.; Paul, E. The Microbial Efficiency-Matrix Stabilization (MEMS) framework integrates plant litter decomposition with soil organic matter stabilization: Do labile plant inputs form stable soil organic matter? Glob. Chang. Biol. 2012, 19, 988–995. [Google Scholar] [CrossRef] [PubMed] [Green Version]
  48. Fierer, N.; Schimel, J.P.; A Holden, P. Variations in microbial community composition through two soil depth profiles. Soil Biol. Biochem. 2003, 35, 167–176. [Google Scholar] [CrossRef]
  49. Su, Y.Z.; Liu, W.J.; Yang, R.; Chang, X.X. Changes in Soil Aggregate, Carbon, and Nitrogen Storages Following the Conversion of Cropland to Alfalfa Forage Land in the Marginal Oasis of Northwest China. Environ. Manag. 2009, 43, 1061–1070. [Google Scholar] [CrossRef] [PubMed]
  50. Post, W.M.; Kwon, K.C. Soil carbon sequestration and land-use change: Processes and potential. Glob. Chang. Biol. 2000, 6, 317–327. [Google Scholar] [CrossRef] [Green Version]
Figure 1. Location of the experimental site. 8 year: the 8-year-old tea plantations; 17 year: the 17-year-old tea plantations; 25 year: the 25-year-old tea plantations; 43 year: the 43-year-old tea plantations.
Forests 12 01530 g001
Figure 2. Soil aggregate stability (as indicated by the MWD) under the tea plantations with different ages. Data represent average of 5 replicates and error bars represent standard deviations. Different lowercase letters (i.e., a, b, c...) indicate significant differences (p < 0.05) among the different tea-planting ages.
Forests 12 01530 g002
Figure 3. Soil aggregate-relevant Corg, Cact, and Crec concentrations under the tea plantations with different ages. Data represent average of 5 replicates and error bars represent standard deviations. Different lowercase letters (i.e., a, b, c...) indicate significant differences (p < 0.05) among the different tea-planting ages. Different capital letters (i.e., A, B, C...) indicate significant differences (p < 0.05) among the different aggregate sizes. ** and * indicate significance at p < 0.01 and p < 0.05, respectively.
Forests 12 01530 g003aForests 12 01530 g003b
Figure 4. Soil aggregate-relevant Corg, Cact, and Crec reserves under the tea plantations with different ages. Data represent average of 5 replicates and error bars represent standard deviations.
Forests 12 01530 g004aForests 12 01530 g004b
Figure 5. Relationships of soil aggregate stability (as indicated by the MWD) with Corg, Cact, and Crec concentrations across the 4 tea-planting ages. Data represent average of 5 replicates and error bars represent standard deviations.
Forests 12 01530 g005aForests 12 01530 g005b
Figure 6. Change rates of soil Corg, Cact, and Crec reserves in the different tea-planting stages. Data represent average of 5 replicates and error bars represent standard deviations. Different lowercase letters (i.e., a, b, c...) indicate significant differences (p < 0.05) among the different tea-planting stages. Early stage: from 8 years to 17 years; middle stage: from 17 years to 25 years; later stage: from 25 years to 43 years.
Forests 12 01530 g006aForests 12 01530 g006b
Table 1. Litter and soil properties under the tea plantations with different ages. Data represent the average of 5 replicates ± standard deviations. Different lowercase letters indicate significant differences (p < 0.05) among the different tea-planting ages.
Soil
Layer
(cm)
Tea-Planting
Age (Year)
Soil
Bulk Density
(g cm−3)
Sand (2–0.02 mm) (%)Silt (0.02–0.002 mm) (%)Clay (<0.002 mm) (%)pH
0–2081.29 ± 0.03 a30.18 ± 0.14 a36.21 ± 0.28 a33.61 ± 0.16 a4.57 ± 0.03 a
171.27 ± 0.04 a31.24 ± 0.22 a36.33 ± 0.24 a32.43 ± 0.17 a4.51 ± 0.02 a
251.30 ± 0.03 a30.84 ± 0.16 a35.89 ± 0.21 a33.27 ± 0.18 a4.32 ± 0.01 b
431.31 ± 0.02 a29.31 ± 0.23 a37.46 ± 0.11 a33.23 ± 0.09 a4.17 ± 0.02 c
20–4081.34 ± 0.04 a29.00 ± 0.32 a38.68 ± 0.36 a32.32 ± 0.25 a4.62 ± 0.01 a
171.36 ± 0.03 a27.40 ± 0.48 a39.42 ± 0.21 a33.18 ± 0.36 a4.58 ± 0.03 a
251.41 ± 0.05 a30.46 ± 0.57 a38.47 ± 0.19 a31.07 ± 0.45 a4.45 ± 0.02 b
431.37 ± 0.02 a28.89 ± 0.32 a38.22 ± 0.34 a32.89 ± 0.27 a4.26 ± 0.04 c
Table 2. Soil aggregate distribution under the tea plantations with different ages. Data represent the average of 5 replicates ± standard deviations. Different lowercase letters indicate significant differences (p < 0.05) among the different tea-planting ages. Different capital letters indicate significant differences (p < 0.05) among the different aggregate sizes. T: tea-planting age; A: aggregate size. ** and * indicate significance at p < 0.01 and p < 0.05, respectively.
Soil Layer
(cm)
Tea-Planting Age (Year)Distribution of Soil Aggregates (%)Significance
>2 mm2–1 mm1–0.25 mm<0.25 mmTAT × A
0–20842.57 ± 3.27 b17.46 ± 1.38 a9.56 ± 0.89 a30.41 ± 2.88 b*****
1753.19 ± 4.03 a15.91 ± 0.94 a8.38 ± 0.93 a22.52 ± 3.04 c
2540.41 ± 2.26 b16.94 ± 1.24 a9.43 ± 1.02 a33.22 ± 3.53 b
4334.62 ± 2.13 c17.38 ± 1.16 a7.25 ± 0.78 a40.75 ± 4.27 a
ACDB
20–40827.42 ± 3.07 b15.21 ± 3.05 a6.65 ± 0.89 a50.72 ± 3.68 b*****
1736.19 ± 2.85 a13.17 ± 2.04 a7.33 ± 1.02 a43.31 ± 4.02 c
2524.18 ± 2.63 bc11.01 ± 1.17 a5.46 ± 0.98 a59.35 ± 3.84 a
4321.36 ± 3.41 c12.89 ± 2.18 a7.98 ± 2.87 a57.77 ± 2.35 a
BCDA
Table 3. Percentage contribution of Corg, Cact, and Crec reserves in aggregates to soil under the tea plantations with different ages. Data represent the average of 5 replicates ±standard deviations. Different lowercase letters indicate significant differences (p < 0.05) among the different tea-planting ages. Different capital letters indicate significant differences (p < 0.05) among the different aggregate sizes. T: tea-planting age; A: aggregate size. ** and * indicate significance at p < 0.01 and p < 0.05, respectively.
ItemSoil Layer
(cm)
Tea-Planting Age (Year)Percentage Contribution (%)Significance
>2 mm2–1 mm1–0.25 mm<0.25 mmTAT × A
Corg0–20849.97 ± 2.47 b19.55 ± 1.97 a8.54 ± 0.47 a21.94 ± 1.47 c******
1758.87 ± 3.13 a17.05 ± 2.01 a7.04 ± 0.85 a17.03 ± 2.03 d
2547.11 ± 2.05 b19.11 ± 2.34 a8.26 ± 0.35 a25.52 ± 1.87 b
4339.65 ± 3.41 c19.83 ± 1.03 a7.13 ± 0.27 a33.39 ± 1.55 a
ACDB
20–40832.71 ± 2.03 b17.58 ± 1.02 a6.81 ± 0.38 b42.90 ± 2.67 b****
1741.20 ± 3.27 a15.13 ± 1.38 ab6.56 ± 0.64 b37.11 ± 3.57 c
2532.80 ± 1.98 b13.25 ± 1.47 b5.44 ± 0.57 b48.50 ± 3.41 a
4325.37 ± 2.67 c15.37 ± 2.13 ab8.25 ± 0.49 a51.01 ± 2.97 a
BCDA
Cact0–20855.11 ± 3.02 b21.25 ± 1.35 a8.44 ± 0.51 a15.19 ± 2.41 b*****
1764.23 ± 3.74 a18.17 ± 2.03 a6.78 ± 0.91 bc10.83 ± 2.36 c
2553.82 ± 2.48 b19.50 ± 2.44 a7.55 ± 0.54 b19.12 ± 3.06 b
4345.21 ± 3.28 c20.74 ± 1.09 a5.66 ± 0.63 c28.39 ± 3.36 a
ABCB
20–40838.93 ± 2.98 b19.07 ± 2.58 a6.93 ± 0.36 a35.07 ± 1.29 c****
1748.92 ± 2.06 a15.59 ± 3.03 ab6.98 ± 0.51 a28.51 ± 3.45 d
2535.91 ± 3.84 b13.66 ± 1.02 b5.83 ± 0.84 a44.60 ± 2.48 b
4328.03 ± 2.51 c15.75 ± 1.48 ab7.03 ± 0.69 a49.19 ± 1.03 a
ABCA
Crec0–20848.65 ± 2.03 b19.12 ± 1.05 a8.57 ± 1.03 a23.67 ± 2.34 b******
1757.39 ± 3.05 a16.75 ± 1.47 b7.12 ± 0.89 a18.74 ± 3.21 c
2545.81 ± 1.47 b19.03 ± 2.31 a8.40 ± 1.21 a26.77 ± 0.89 b
4338.86 ± 2.36 c19.69 ± 1.98 a7.34 ± 0.58 a34.11 ± 2.14 a
ACDB
20–40831.33 ± 2.47 b17.26 ± 2.03 a6.79 ± 0.47 b44.63 ± 3.48 b****
1739.49 ± 2.03 a15.03 ± 1.35 ab6.47 ± 0.68 b39.02 ± 1.02 c
2532.30 ± 1.89 b13.19 ± 2.36 b5.38 ± 0.39 b49.14 ± 3.21 b
4325.03 ± 3.47 c15.32 ± 2.49 ab8.40 ± 0.88 a51.24 ± 2.19 a
BCDA
Publisher’s Note: MDPI stays neutral with regard to jurisdictional claims in published maps and institutional affiliations.

