Article

Effect of Heavy Machine Traffic on Soil CO2 Concentration and Efflux in a Pinus koraiensis Thinning Stand

1
Department of Forestry and Environmental Systems, Kangwon National University, Chuncheon 24341, Korea
2
Division of Forest Science, Kangwon National University, Chuncheon 24341, Korea
3
Forest Industries Research Centre, University of the Sunchine Coast, Locked Bag 4, Maroochydore DC, QLD 4558, Australia
4
College of Forest and Environmental Sciences, Kangwon National University, Chuncheon 24341, Korea
5
Forest Technology and Management Research Center, National Institute of Forest Science, Pocheon 11187, Korea
*
Author to whom correspondence should be addressed.
These authors contributed equally to this work.
Forests 2021, 12(11), 1497; https://doi.org/10.3390/f12111497
Submission received: 28 September 2021 / Revised: 28 October 2021 / Accepted: 28 October 2021 / Published: 29 October 2021
(This article belongs to the Section Forest Operations and Engineering)

Abstract

:
Mechanized timber harvesting is cost efficient and highly productive. However, mechanized harvesting operations are often associated with several environmental problems, including soil compaction and disturbance. Soil compaction impedes air circulation between the soil and atmosphere, which in turn results in increased concentrations of CO2 within soil pores. In this study, we investigated the impact of forest machine traffic on soil conditions to determine soil CO2 efflux (Fc), and soil CO2 concentrations (Sc). Field measurements included soil bulk density (BD), soil temperature (ST), soil water content (SWC), Fc, and Sc over a 3-year period at a specific thinning operation site (Hwacheon-gun) in the Gangwon Province of Korea. To assess the soil impacts associated with machine traffic, we established four machine-treatment plots (MT) characterized by different geographical and traffic conditions. The results revealed that BD, Sc, and SWC increased significantly on the disturbed track areas (p < 0.05). Furthermore, reduced soil Fc values were measured on the soil-compacted (machine disturbed) tracks in comparison with undisturbed (control) areas. Variations in BD, SWC, and Sc were significantly different among the four MT plots. Additionally, in comparison with undisturbed areas, lower Fc and higher Sc values were obtained in compacted areas with high soil temperatures.

1. Introduction

Mechanized equipment is necessary for more efficient harvesting operations [1]. However, heavy machine traffic during harvesting operations can cause disturbance to soil ecosystems, which results in long-term impacts on soil production [2]. Soil compaction is one of the major negative impacts associated with forest machinery traffic [3,4]. Heavy machine traffic may cause more severe soil compaction in forests than in croplands, since it involves machine traffic as well as the cutting, pulling, pushing, lifting, and transport of timber during the harvesting operation [2]. Froehlich et al. [5] reported that soil compaction can persist for around 15 years in temperate forests that have no frosting of soil water in the winter season. DeArmond et al. [6] found persistent compaction after a period of 30 years following logging operations. Additionally, it has been reported that soil biological disturbance can be recovered within 20 years in sandy neutral soil following compaction [7]. Severe soil disturbances and impacts on soil physical properties, such as soil compaction, rutting, and soil displacement can occur during mechanized harvesting operations [8,9,10].
Soil bulk density (BD) is an indicator that defines compaction [11]. Soil compaction diminishes porosity and pore continuity, which results in increased BD [10,12,13]. In addition, changes to the size of soil pores involve the reduction of macro-pores and induction of micro-pores which reduces hydraulic conductivity [14] and lead to problems with water infiltration and increased runoff [15]. In addition, air circulation between soil and atmosphere is altered due to compaction [13], resulting in increased concentrations of CO2 within soil pores and leading to important changes in the chemical processes [16]. Therefore, soil compaction increases soil strength and limits gas diffusion, which in turn, inhibits root growth and microbial activity [13,17,18]. In particular, the physiological and growth characteristics of seedlings are impacted due to compaction [19,20].
Carbon dioxide is a result of soil respiration and comprises heterotrophic respiration, which represents the decomposition of organic matter by soil microbes and autotrophic respiration from roots [21]. Soil temperature (ST) and soil water content (SWC) are significant determinants of soil respiration [13,22,23]. Therefore, the response of soil respiration to temperature is generally estimated by the temperature coefficient (Q10) [24]; the global median Q10 of soil respiration has been reported to be 2.4 [21]. However, Q10 values can vary as per forest type and climatic conditions [24,25,26]. In addition, SWC alters oxygen diffusivity, which indirectly affects soil respiration in compacted soils [13,23].
The severity of soil compaction caused by machine traffic may vary with the type of forestry machine and harvesting method, the frequency of machinery traffic, and soil characteristics [2]. In particular, terrain slope and traffic intensity are the major determinants of soil compaction caused by machine traffic [20,27,28]. Terrain slope is known to have an important effect on the ruts formed during forestry machine traffic [27,28]. Thus, some studies have reported that machine traffic should be limited on slopes that exceed 20% [27,28]. Soil compaction in forest areas involves compression of soil pores which may be caused as from the first trip of a heavy machine [29]. Han et al. [30] reported soil compaction of up to 90% after 3–5 round trips, and no further compaction after 10 round trips. In addition, the increase in BD resulting from compaction was found to be significantly different after 12 to 16 machine trips than after 3–6 trips [31]. However, up to 60 trips of the machine, the degree of pressure was significantly different from each other, but there was no significant difference between 60, 80, 100, and 120 [11]. In addition, in previous studies it has been reported that the correlation observed between traffic intensity and BD can be expressed using a logarithmic model [32]. The degree of soil compaction also varies with original soil properties. The effects of soil compaction during machine traffic are more evident when the initial soil bulk density is low [29,33,34] and when SWC, soil organic matter content (OMC), and terrain slope are high [8,29,34,35,36,37]. Initial SWC is a determining factor that affects soil disturbance during mechanized timber harvesting [38]; the frequency and degree of soil compaction are, however, lower on frozen soil [8].
This study aimed to investigate the impact of soil compaction caused by forestry machine traffic during thinning operations and identify whether the impact depends on machine traffic conditions such as traffic intensity and terrain slope. BD and soil CO2 efflux (Fc) and concentration (Sc) were measured during a whole-tree thinning operation in a Pinus koraiensis stand (Hwacheon-gun) in the Gangwon Province of Korea. The analysis included: (i) measurements of the change rate in BD as a function of soil depth (0–10, 10–20, 20–30 cm) in control areas and machine disturbed tracks; these measurements allowed quantifying the difference in soil response to compaction depending on traffic intensity and terrain slope in the harvesting area, (ii) an evaluation of the changes in Fc and Sc associated with an increase in BD, (iii) an evaluation of the persistence of soil compaction over a 3-year period, and (iv) the determination of correlations among ST, SWC, Fc, and Sc following soil compaction.

2. Materials and Methods

2.1. Site Description

To study the effects of soil compaction caused by the traffic of forestry machines on various soil properties, a 40-year-old Pinus koraiensis Siebold and Zucc. (Korean pine) stand located in the experimental forest of National Institute of Forest Science (38°00′58.7″ N, 127°48′31.2″ E; 370 m elevation) in the Gangwon Province, Korea was chosen as the study site. Terrain slope in the study area ranged between 21% and 57%, while the soil type corresponded to the Mui Series (coarse loamy, mixed, Typic Humudepts) based on U.S. Soil Taxonomy. Soils in the area consisted of dark brown sandy loam or loamy sand A horizons. The organic layer above the surface soil had a mean thickness of 4 cm and a mean density of 1.8 kg/m2. The dominant forest species in the study area was Pinus koraiensis with a stocking density of 448.6 trees per ha and a timber volume of 279.9 m3 per ha. The 30-year mean annual precipitation was 1358.7 mm, with average minimum and maximum temperatures of –18.5 °C and 35.2 °C, respectively.

2.2. Experimental Design

The route and traffic intensity (number of machine passes) were collected using the GPS of the forestry machine at the thinning operation site. Each pass comprised a round trip of the machine. The thinning operation applied the whole tree method and was conducted in May 2018. Two forestry machines were used during the thinning operation: a harvester and a skidder. The harvester had a total weight of 6030 kg, with the machine (DX55 A-MT) and the grapple saw (GMT035) having a weight of 5800 kg and 230 kg, respectively. The contact area of each harvester wheel was 15,580 cm2 (205(L) × 38(W) × 2EA), with a contact pressure of 0.38 kgf/cm2. The skidder weighed 5760 kg. Each wheel of the machine had a contact pressure of 0.36 kgf/cm2, and the contact area was the same as the harvester.
The soil-compacted areas (disturbed tracks) were visually identified by the tire marks over an average length of 25 m in each MT plot. An undisturbed soil area (control) of the same length and within 5 m of the disturbed track was selected in each plot to reduce the effect of environmental conditions. Based on the results from previous studies that have reported the impact of traffic intensity and terrain slope on compaction, four machine-treatment (MT) plots were selected: MT1—with one round-trip performed by the harvester on a 54% terrain slope, MT2—with one round-trip performed by the harvester on a 34% terrain slope, MT3—with one round-trip performed by the harvester and skidder on a 22% terrain slope of 22%, and MT4 with three round-trips performed by the harvester and two round-trips performed by the skidder on a 33% terrain slope (Table 1, Figure 1).
However, it was difficult to select a MT plot with a specific traffic intensity and terrain slope in the thinning stand since the out-row thinning method is limited in most of Korean forest areas that have a rugged terrain. Therefore, four MT plots were selected to determine the effect of low and high machine traffic intensity on soil compaction.
Finally, five measurement points along the disturbed track and control areas were selected in each MT plot; at each point, measurements of ST, SWC, Fc, and Sc were performed.

2.3. Soil Physicochemical Properties

Soil samples used for the analysis of initial soil pH, OMC, and texture in the study site were collected during May 2018 (prior to the mechanized timber harvesting operation) (Table 2). The collected soil samples (>1 kg) were transported to the laboratory, and subsequently analyzed at the Korea Forestry Promotion Institute in Seoul, Korea. Soil pH ranged from 4.7 to 5.1 at a soil depth of 0–30 cm (Table 2). The original OMC in each study plot is provided in Table 1. The highest mean OMC was found in MT2 followed by that in MT3 (Table 2). Soil was classified as mostly sandy loam and loamy sand through an analysis of the soil physical properties (Table 1).
Similarly, OMC was measured to determine the effect of compaction caused by the machine traffic. Soil samples for the analysis of OMC were collected during October 2020. In addition, soil BD was measured to assess the effects of compaction. Soil samples collected for the analysis of BD were obtained from five measuring points at locations other than those used to measure ST, SWC, Fc, and Sc. These soil samples were collected from the disturbed and undisturbed (control) tracks on three occasions at soil depths of 0–10, 10–20, and 20–30 cm in September 2018, 2019, and 2020. The soil samples were dried for 48 h in a laboratory oven at 105 °C and in containers of 100 cm3. BD (representing soil dry bulk density) was calculated using Equation (1):
BD = BD w M w
where BD is dry bulk density, BDw is wet bulk density, and Mw is the mass of water (g cm−3).

2.4. Soil Temperature, Water Content, and CO2 Efflux and Concentration

In each MT plot, measurements of ST, SWC, Fc, and Sc were taken at five selected measurement points from the disturbed tracks and undisturbed (control) areas. These variables were measured once a month from September 2018 to September 2020 (a total of 18 measurement days). This excluded measurements in the winter season (December, January, and February), since in this period the soil is generally frozen; also, no measurements were performed in March 2020, owing to COVID-19-related travel restrictions. ST and SWC were measured to determine the response of Fc and Sc resulting from soil compaction. ST was measured using a digital thermometer TP3001, and SWC was measured with probe sensors (TDR 300, FieldScout) in the form of volumetric water content (%). At each of the measurement points, ST and SWC were measured five times.
Fc and Sc were measured to assess gas diffusivity and soil CO2 productivity resulting from soil compaction caused by machine traffic. Fc was measured at the same time as ST and SWC (total of 18 days) at each measurement point. All measurements were carried out during daytime (11:00 to 16:00). The PVC chambers, 13 cm in diameter and 16 cm in length, were embedded 1.4 cm into the soil surface. After closing the chamber, a carbon dioxide probe (GMP343, Vaisala CARBOCAP®, Helsinki, Finland) was inserted, and Fc was measured for 5 minutes. Fc was calculated from the change rate in CO2 concentration (ppm) using the closed dynamic chamber method [39] as per Equation (2):
F c , s = [ CO 2 ] c t m w m v V A
where V is the total chamber volume of the system, A is the area covered by the chamber, mw is the molecular weight, and mv is the CO2 volume.
Sc was measured on the same day as the other variables. In July 2018, a total of 40 vapor tips (mesh covered for air suction) were installed at a soil depth of 10–15 cm, and silicon tubes (3-mm internal diameter) connected to the vapor tip were pulled out of the soil surface. To avoid potential disturbance of these pre-treatment procedures on the subsequent measurement of Sc, data collection commenced only after two months of completing the pre-treatment in September 2018. The pump (GM70, Vaisala CARBOCAP®, Helsinki, Finland) was connected to the other side of the tube to suck air from the soil, and Sc in soil pores was measured using a carbon dioxide probe (GMP222, Vaisala CARBOCAP®, Helsinki, Finland). The vapor tips, made of metal and meshed for sucking air in the soil, were installed at a soil depth of 10 cm and connected to a silicon tube. The other side of the tube was connected to a pump (GM70, Vaisala CARBOCAP®, Helsinki, Finland) for sucking soil air, which was allowed to pass through the carbon dioxide probe (GMP222, Vaisala CARBOCAP®, Helsinki, Finland). At each of the measurement points, Sc was measured for 5 min after Fc measurements had been completed to avoid disturbances while sucking the soil air.

2.5. Data Analysis

All measurements were conducted at five points on each machine disturbed track and control area. Monthly average data for Fc, Sc, ST, and SWC, as well as yearly average data for BD were calculated as the mean of the five replicated data points on the machine disturbed track and control area to avoid pseudo-replication.
To assess the effect of soil compaction caused by machine traffic, we calculated the relative change between the soil compaction values on the disturbed track and control area using Equation (3):
Relative   change   % = Compaction   on   disturbed   track Compaction   in   Control   area × 100 100
The Anderson-Darling normality test and Bartlett test were used to evaluate the normality and homogeneity of variance, respectively. To assess the effects of machine traffic-related factors (i.e., traffic intensity and terrain slope) and/or year on BD, Fc, Sc, ST, SWC, analyses of variance (ANOVA) with repeated measures were performed using a generalized linear model (GLM). A Post-Hoc test was conducted with Tukey’s pair-wise comparisons. All analyses of variance and normality were conducted in SPSS v. 25, and significance was set at p ≤ 0.05.
To assess the effects of ST on Fc and Sc, a first-order exponential function Q10 was fitted to Equation (4):
y = β 0 × exp   β 1 × ST
where y represents the measured Fc or Sc, β0 and β1 are the fitted parameters. Q10 values were calculated using Equation (5):
Q 10 = exp   10 × β 1
Fc and Sc were measured on the same day during daylight hours (11:00 to 16:00), while ST and SWC were measured at the same time as Fc and Sc. Therefore, a normalization of soil CO2 values to daily mean ST was not required. However, Fc and Sc were normalized to a soil temperature of 10 °C during the measurement period to assess the effect of SWC on soil CO2 and to avoid changes in soil CO2 associated with the seasonal variation in soil temperature.
In addition, a polynomial expression was fitted as per Equation (6) using F10 and S10 values to assess the effect of SWC on Fc and Sc.
F c   or   S c = a · ST 2 × b · ST × c
Multiple nonlinear regression was performed using a SigmaPlot demo (Systat Software, Inc., San Jose, CA, USA) for Windows (Microsoft, Redmond, WA, USA).
The covariance structures of regression Equation (6) was chosen by minimizing the corrected Akaike information criteria (AICC) [26].

3. Results

3.1. Soil Physical Properties following Machine Traffic

Average BD following compaction was significantly higher (average increase of 14%) at p = 0.001 on the disturbed track with respect to the control area (Table 3 and Table 4). This change appears to be the effect of compaction due to machine traffic. Soil porosity decreases in soils with increased BD, which results in higher SWC values [12,40]. In comparison with the control plot, we detected an increase in BD on disturbed tracks, although these differences were not statistically significant in any MT plot at different soil depths (Table 3). In addition, although dissimilar changes in BD following compaction were found among the four MT plots, these differences were not statistically significant at p = 0.133 (Table 3). The largest increase in BD (23.0%) on disturbed tracks was found in MT4 (23.0%), followed by MT1 (12.3%).
In comparison to the control area, BD on disturbed tracks increased more in areas closer to the surface soil across all MT plots, although these differences were not statistically significant at p ≤ 0.05 (Table 4). In a previous study, BD was reported to increase by 28% (0–10 cm soil depth), 12% (10–20 cm soil depth), and 34% (20–30 cm soil depth) as a consequence of forwarder traffic (1 and 5 round-trips) on silt loam in a mixed forest (consisting of 60% Pinus koraiensis) in Korea [41]. Goutal et al. [1] observed an increase in BD of 6% (30–40 cm soil depth) and 27% (0–10 cm soil depth) following the traffic of a forwarder, while Jankovský et al. [10] reported an increase in BD ranging from 35 to 38% following machine traffic. These studies also confirmed that increased BD on the soil surface can lead to poor gas diffusion between soil and atmosphere [42].
Excepting in MT2, OMC was higher on disturbed tracks than in control areas, although the differences were not statistically significant at p ≤ 0.05 (Table 4). In addition, there was no statistically significant difference (p ≤ 0.05) in OMC between MT1 and MT4 following compaction (Table 4).
Following compaction, SWC increased significantly (average increase of 29.8%) on the disturbed tracks with respect to the control areas in all MT plots (p ≤ 0.001) (Table 3, Table 5). In addition, SWC increased in all seasons but there was no significant difference among the seasonal variation of SWC on the disturbed tracks (Table 5).
An increase in SWC led to a slight decrease in ST on the disturbed tracks in comparison to that in the control areas, but this change was not statistically significant (p = 0.053). In addition, there was no seasonal difference of changes in ST following compaction (Table 5).

3.2. Soil CO2 Efflux and CO2 Concentration following Machine Traffic

The increase in BD and SWC impedes gas diffusivity following machine traffic, resulting in a statistically significant (p = 0.025) average reduction of 23.7% in Fc (Table 3). In addition, the correlation was less obvious and more complex on the disturbed tracks (Figure 2). Additionally, Sc on disturbed tracks increased significantly at p = 0.002 (average increase of 10.6%) with respect to the control areas; this was a consequence of the impact on gas diffusivity following mechanized timber harvesting (Figure 2).
The effect in Fc was statistically significant (p ≤ 0.001) for the interaction of soil compaction and measurement period (Table 3). This may be because Fc had a substantial decline on disturbed tracks from June to September in comparison to other periods (Figure 3a). However, there was no significant difference (p = 0.514) among the four MT plots for the interaction effect of soil compaction and measurement period (Table 3, Figure 3a).
Sc was high from July to September both on disturbed tracks and control areas (Figure 3b). In addition, the increase in Sc on disturbed tracks was higher from July to September in comparison to the other periods; this effect was associated with the largest decrease in Fc that occurred on disturbed tracks in the same periods (Figure 3a). However, the interaction effect between soil compaction and measurement period on Sc was not significant (Table 3, Figure 3b).

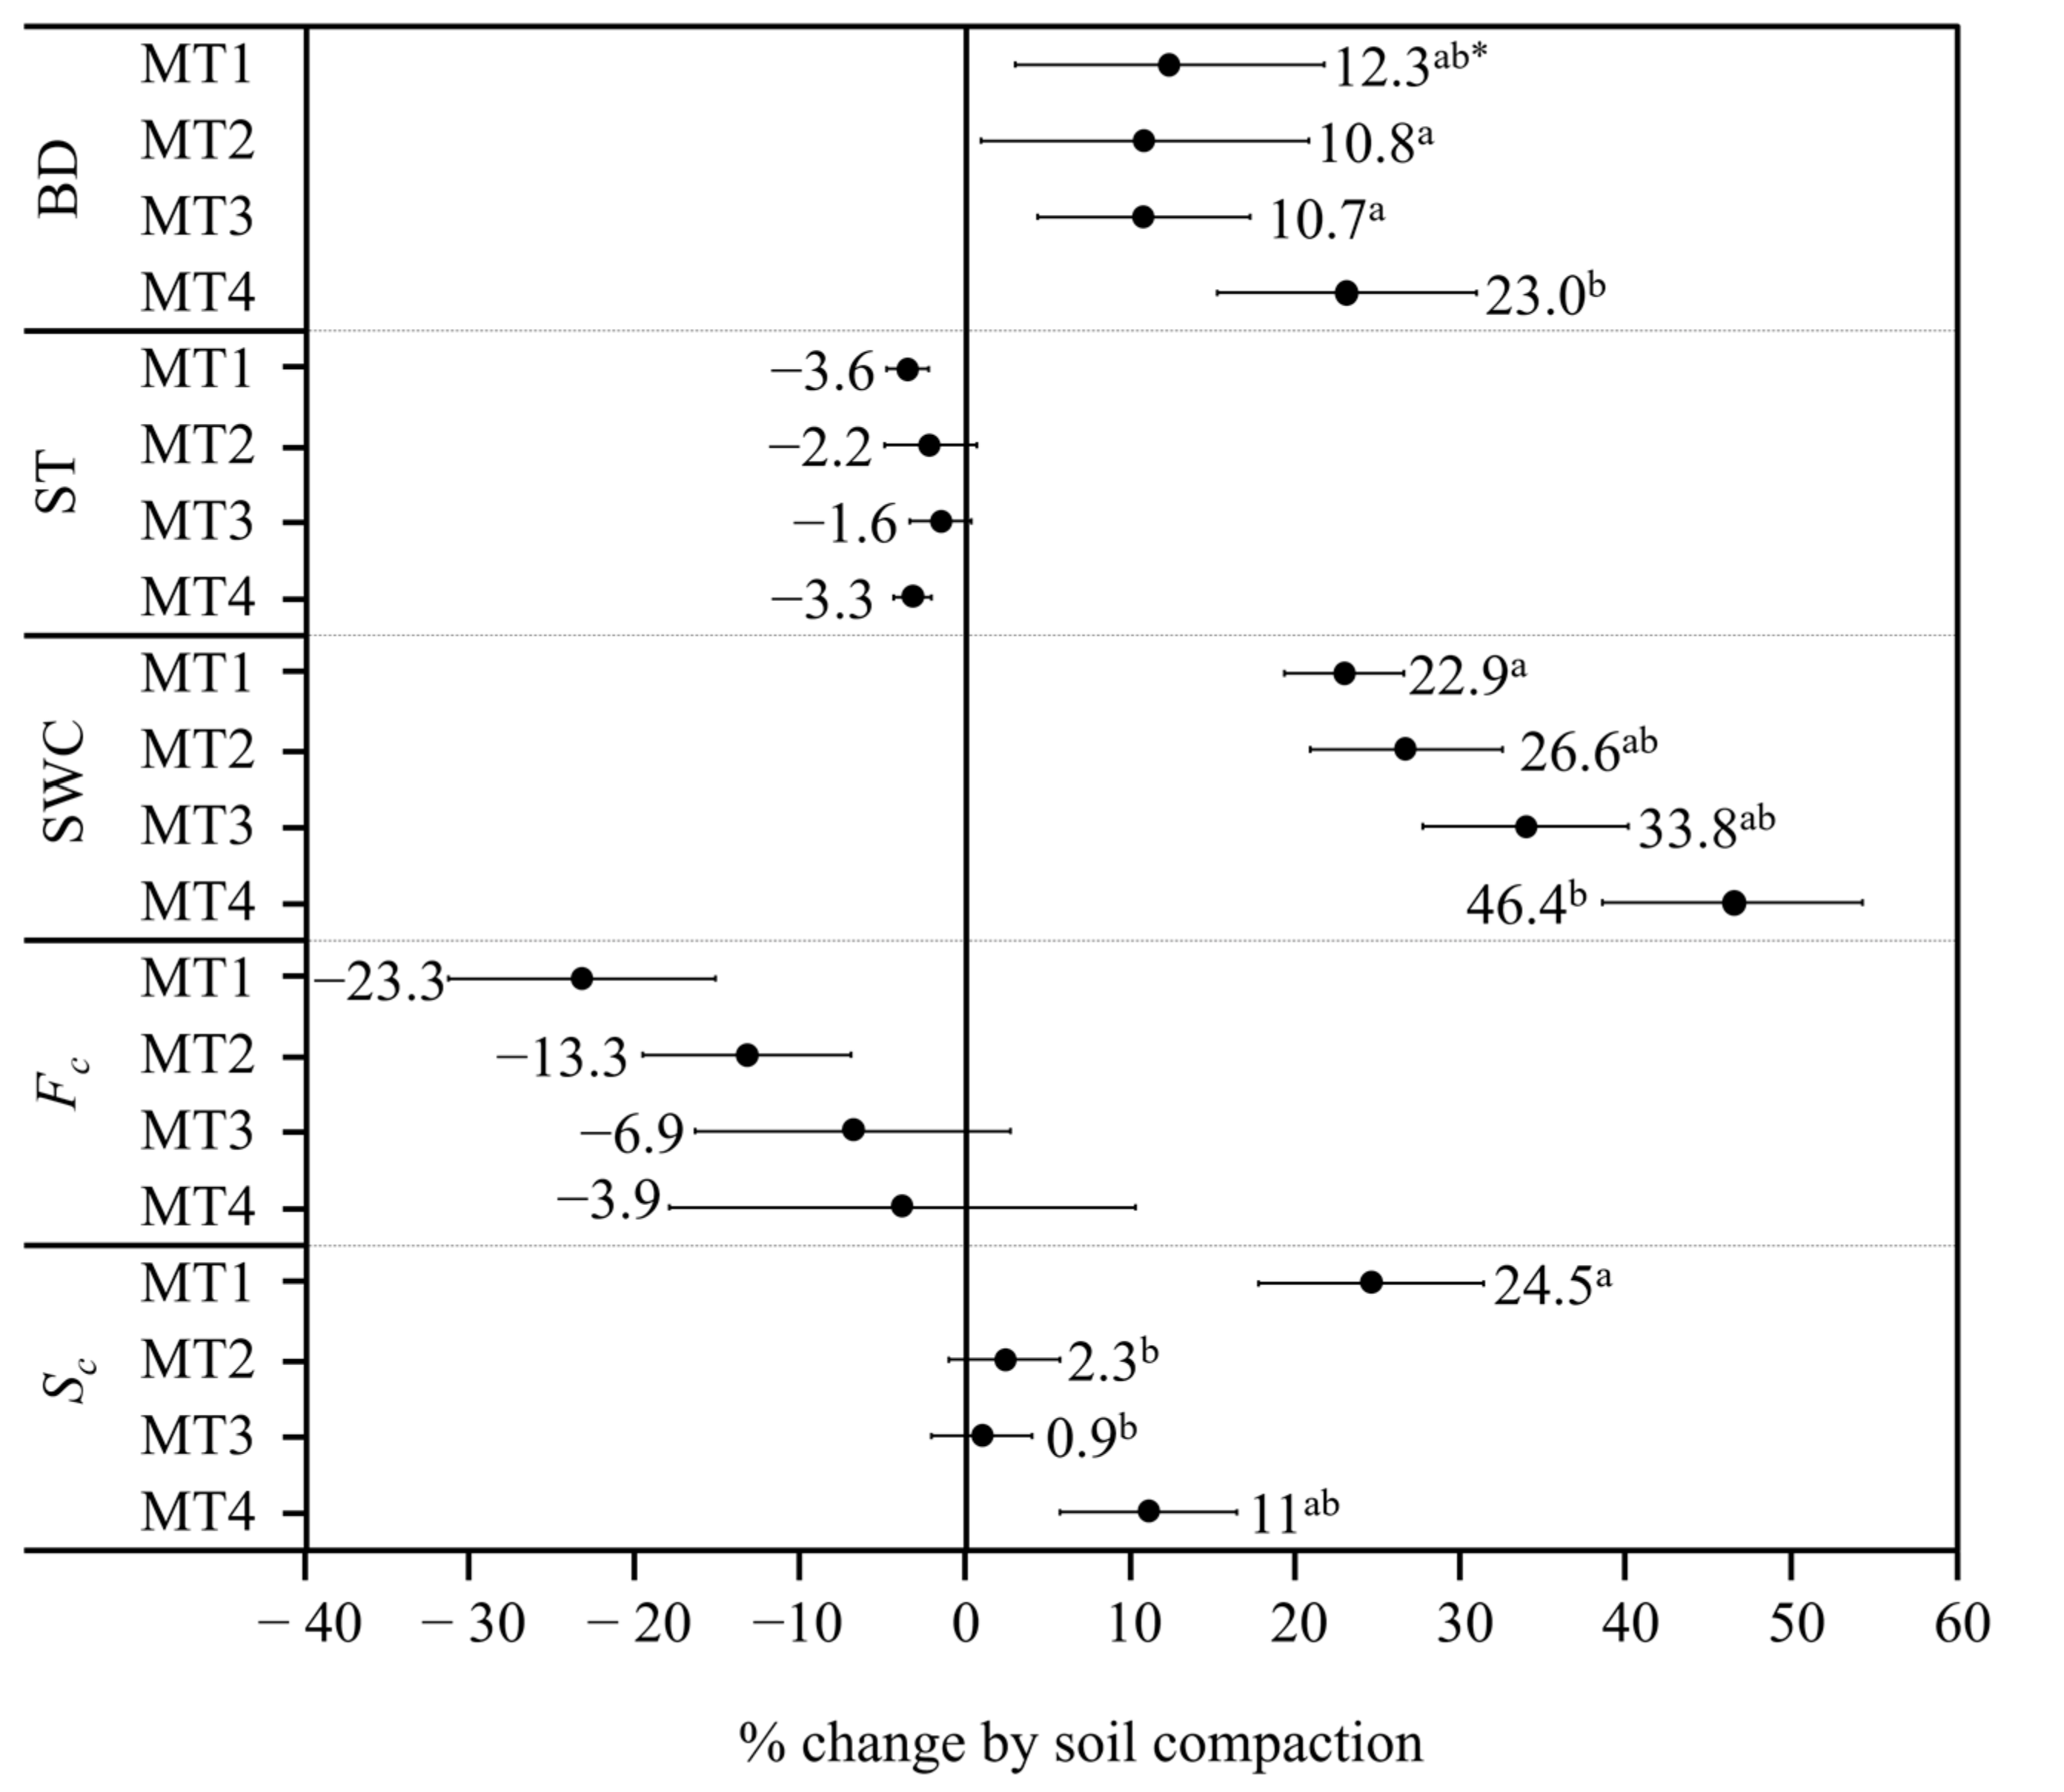
3.3. Effects of Machine Traffic Conditions on Soil Compaction

The effects of compaction caused by machine traffic on Sc and SWC depended significantly on machine traffic conditions (traffic intensity and terrain slope) at p = 0.024 and p = 0.012, respectively (Table 3, Figure 4). The change rate in SWC and Sc differed significantly among the MT plots (Figure 4). The highest increase in BD was observed in MT4 (23.0%), followed by MT1 (12.3%). SWC also showed the largest increase in MT4 (46.4%), followed by a 22.9% increase in MT1, 26.6% in MT2, and 33.8% in MT3. Although there were no significant differences in Fc among the MT plots, the largest change rate in Fc occurred on the disturbed track of MT1. The largest increase in Sc was observed in MT1 (Figure 4). While MT4, had the largest increase in BD and SWC, it also had the lowest Fc reduction rate and the second largest increase in Sc (Figure 4). These results can be explained to a greater extent by the change rate in BD and Sc.

3.4. Yearly Difference Associated with the Impact of Machine Traffic on Soil Characteristics

Significant effects on BD’s change rate were observed for the interaction between compaction (C), machine traffic condition (MT), and measurement period (P) (p = 0.004) (Table 3, Figure 5a). Dissimilar results were obtained for BD’s change rate on disturbed tracks in comparison to control areas; thus, the change rate increased in MT1 and MT2 throughout the year and decreased in MT3 and MT4 during the same period (Figure 5a). MT4 had the largest average BD increase on disturbed tracks with respect to control areas; in 2018 this increase reached 40.4% after compaction (Figure 5a). Since 2018, the growth rate in BD declined significantly in MT4 (p ≤ 0.05) (Figure 5a). In MT3, the growth rate in BD decreased over the years (Figure 5a).
The interaction effect for the variables compaction (C), machine traffic condition (MT) and measurement period (P) was not determined except for BD; however, the change rate in Sc was significantly different during the three years that follow the thinning in each MT plot (Table 3, Figure 5b). In MT4, the growth rate in Sc increased while BD decreased throughout the year (Figure 5b). Thus, the effect of compaction on Sc was not simply caused by the effect of pore compression, but also by the interruption of CO2 gas exchange between soil and atmosphere; this latter effect was a consequence of the diminished air circulation that resulted from the interruption in pore continuity [12,13]. On the other hand, BD increased by 40.4% and Sc was lower on the disturbed track with respect to the control area in MT4 during 2018.

3.5. Effects of Compaction on ST and Soil CO2

Unfortunately, soil CO2 measurements in our study could not be performed in winter since the soil was frozen during this season. However, the Q10 values showed that Fc and Sc decreased and increased following compaction in the summer season, respectively (Table 6). Furthermore, the exponential function between ST and Fc or Sc had a distinctive positive relationship, revealing that soil disturbance occurred mainly when the soil temperature was high after compaction.

4. Discussion

4.1. Changes in Gas Diffusion following Soil Compaction

In general, as CO2 production increases, so does CO2 efflux from the soil surface [18]. Therefore, Fc and Sc probably have an obvious positive correlation in machine-disturbed soils. In this study, Fc correlated well with Sc in the control area. As shown in Figure 2, gas diffusion was inhibited in all MT plots following compaction. The results are similar to those reported by Goutal et al. [1] and reveal impediments of gas diffusion following compaction.
Increased BD results in reduced macropores, and the disconnection of pores could impede gas diffusion in compacted soils [18,34] which might lead to an increased concentration of CO2 in soil pores. Fc values were lower on disturbed tracks than in control areas following compaction [3,43,44]. Greater values of Fc in control areas may be the result of CO2 production in the soil; this effect is more predominant active under aerobic conditions than anaerobic conditions [45]. The changes in soil CO2 obtained in our study are in agreement with those from previous studies, which have reported higher Sc values in disturbed than in undisturbed areas following compaction [1,17,34,46]. Therefore, significant increases in Sc in this study are a consequence of the impact on gas diffusivity following mechanized timber harvesting (Figure 2).

4.2. Impact of Machine Traffic on Soil Compaction

The largest increase in BD was observed on the disturbed track of MT4, followed by that of MT1 (Figure 4), which reveals that machine traffic on steep terrain and high machine traffic intensity can result in severe soil compaction. Agherkakli et al. [28] studied the change in rut depth and BD after 1, 5, and 9 passes of forestry machines on terrain slopes of <20% and >20%. They reported significantly higher BD and rut depth values when terrain slope exceeded 20%. They also showed that traffic intensity resulted in increased BD values. Najafi et al. [27] also reported that machine traffic on slopes greater than 20% led to significant soil disturbance.
During 2018, Fc in MT4 was lower on the disturbed track than in the control area, while root respiration and microbial activities were severely hampered by soil compaction. In a previous mechanized harvesting study, a reduction in root depth of more than 20% was reported on disturbed tracks with respect to undisturbed control areas [47]. As a result of Sc, the effects of compaction were not retained in MT2 and MT3. However, in MT1 and MT4, compaction was significantly higher on the disturbed track than in the control area, and Sc continued to increase from 2018 to 2020. Therefore, even when the number of machine passes was just one, the effect of compaction was quite evident in areas of steep terrain; the same effect was observed when the number of trips was larger than five.
Our study did not include cases where the number of roundtrips of machine was three or more. However, the results can be used to estimate values in scenarios where the number of roundtrips is equal to five and in cases when the number of passes is just one and terrain slope is high.

4.3. The Soil Respiration Variance in Soil Compacted Area

Increased Sc in soil pores can hinder future root growth and soil microbial activities [40]. Conlin and Driessche [46] concluded that since the change in Sc following compaction is not significantly related to whether organic matter is removed or not, the origin of most respiratory activities might be associated with autotrophic rather than heterotrophic activity. However, Hanson et al. [48] reported that, on average, root respiration accounts for about 45% of Fc in forested ecosystems, with values that range between 20% and 80%. In addition, Striegl and Wickland [3] reported a value of 35% for a mature Saskatchewan jack pine forest. In this study, no measure was taken to distinguish between root respiration and microbial activity, which made it difficult to determine if the origin of soil respiration accounted for the majority. However, it can be assumed that the effect of compaction on roots was greater than that on microorganisms because the OMC was not significantly difference between disturbed tracks and control area after compaction.

4.4. The Seasonal Soil CO2 Impacted by Soil Compaction

Buyanovsky and Wagner [49] reported that the exponential function explained the increase in Sc as soil temperature went up from 10 to 20 °C. Epron et al. [18] concluded that a reduction in Fc represents a degradation in soil CO2 production, while an increase in Sc means a slow CO2 diffusivity. Although root growth or microbial activities were not measured in our study, a Q10 reduction in Fc measured on disturbed tracks following compaction may have decreased especially in the summer. The restricted gas exchange between soil and atmosphere following compaction increase Sc and decrease the oxygen concentrations in the soil [46]. In addition, Allman et al. [40] reported that a critical Sc is believed to fluctuate around 0.6%; other studies have indicated that an increase in Sc over this limit might impede the root growth of seedlings [19,20]. The main growing season in our study site was summer when both air temperature and precipitations are high. Regardless of when compaction occurs, our results suggest that soil compaction can lead to reduced soil productivity owing to reduced root growth and microbial activities.

4.5. Soil Recovery after Soil Compaction

The process of root penetration and annual freeze-thaw cycles may allow the recovery of macroporosity on the topsoil with the corresponding decrease in BD [50,51]. However, Goutal et al. [1] and Epron et al. [18] reported that there was no evidence of recovery either immediately or within five years after compaction. Jakobsen [52] observed that the effect of soil compaction persisted for 30 years following machine harvesting in a temperate forest without freeze-thaw cycles. In addition, Labelle and Jaeger [50] observed an increase in BD following compaction, which persisted for 5 years in soils exposed to swelling and shrinking; this was due to the high variation in the precipitation rates throughout the year and the occurrence of the freeze-thaw cycles. In our study, BD recovery following compaction was not observed (Figure 5a). In addition, growth rate of Sc in MT1 and MT4 increased year by year after compaction. This suggests that machine traffic on steep slopes or high-intensity machine traffic during mechanized harvesting should be avoided.

5. Conclusions

This study aimed to quantify the compaction of forest soil caused by mechanized timber harvesting. After machine traffic, soil bulk density on disturbed tracks increased significantly with respect to control areas. This resulted in a reduction in soil porosity and pore connectivity. Consequently, soil water content also increased after soil physical degradation due to the reduction in infiltration. In addition, an increased soil bulk density and water content led to a reduction in gas diffusivity. This observation was supported by a decrease in soil CO2 efflux and a significant increase in soil CO2 concentration after machine traffic. In addition, temperature coefficient (Q10) values were lower for soil CO2 efflux and higher for soil CO2 concentration across all-disturbed tracks in comparison to the control areas, regardless of the machine traffic conditions. Soil recovery from compaction was not observed within three years after the mechanized thinning operation. We conclude from these results, that machine traffic during mechanized timber harvesting can lead to a reduction of soil productivity associated with root growth and soil microbial activity.
Soil compaction caused by machine traffic was significantly affected by traffic intensity (number of passes) and terrain slope; this was confirmed by the change rate in soil bulk density, water content, and CO2 concentration on disturbed tracks in comparison with control areas among the MT plots. In our study, disturbed tracks with moderate terrain slope and high machine traffic (5 round-trips) showed a significant increase in soil bulk density, water content, and CO2 concentration; the same was observed for disturbed tracks on steep terrain and low machine traffic (1 roundtrip). On the contrary, disturbed tracks with a moderate slope and machine traffic (1 or 2 roundtrips) did not show any significant increase in soil CO2 concentration. Based on our research, we can conclude that soil compaction is mainly caused by a high machine traffic intensity and operation of the machine on steep terrain during mechanized harvesting. To reduce soil compaction in small scale areas of steep terrain, it is highly recommended to plan and design the skid trails properly considering environmental and economic factors.
In our study, field data was collected from a forest stand that had been subjected to mechanized harvesting in order to assess the effects of soil compaction following machine traffic. Nevertheless, the study has two main limitations. The first is that the various conditions associated with machine traffic were not repeatedly investigated to determine the degree of soil compaction in relation to traffic intensity, terrain slope, and type of forestry machine. The second is that the 3-year measurement period was not long enough to observe soil recovery from the disturbance caused by the machine operations. Future research should consider long-term studies that include plots of similar conditions (i.e., traffic intensity and terrain slope) to the ones of the present study. These studies should also include measurements and analyses regarding the response of soil microbes and roots to compaction.

Author Contributions

Conceptualization, B.C. and I.K.; methodology, B.C., I.K. and J.-H.O.; validation, B.C., I.K. and H.W.; formal analysis, B.C. and I.K.; investigation, B.C., S.-K.H. and I.K.; resources, S.-K.H. and J.-H.O.; data curation, B.C., S.-K.H. and B.C.; writing—original draft preparation, B.C. and I.K.; writing—review and editing, I.K., H.W., B.C., S.-K.H. and M.A.; visualization, I.K. and H.W.; supervision, B.C.; project administration, B.C.; funding acquisition, B.C. and J.-H.O. All authors have read and agreed to the published version of the manuscript.

Funding

This work was supported by the National Research Foundation of Korea (NRF) funded by the Korea government (MSIP) (No. NRF-2018R1D1A1B07041766) and (MSIT) (NRF-2021R1A2C2008002). This research was also carried out with the support of ‘R&D Program for Forest Science Technology (2019151D10-2123-0301)’ provided by Korea Forest Service (Korea Forestry Promotion Institute) and was funded by the Korea Forest Service (National Institute of Forest Science), grant number FO0200-2018-01-2021.

Conflicts of Interest

The authors declare that they have no known competing financial interests or personal relationships that could have appeared to influence the work reported in this paper.

References

  1. Goutal, N.; Boivin, P.; Ranger, J. Assessment of the natural recovery rate of soil specific volume following forest soil com-paction. Soil Sci. Soc. Am. J. 2012, 76, 1426–1435. [Google Scholar] [CrossRef]
  2. Cambi, M.; Certini, G.; Neri, F.; Marchi, E. The impact of heavy traffic on forest soils: A review. For. Ecol. Manag. 2015, 338, 124–138. [Google Scholar] [CrossRef]
  3. Striegl, R.G.; Wickland, K.P. Effects of a clear-cut harvest on soil respiration in a jack pine-lichen woodland. Can. J. For. Res. 1998, 28, 534–539. [Google Scholar] [CrossRef]
  4. Schweier, J.; Magagnotti, N.; Labelle, E.R.; Athanassiadis, D. Sustainability impact assessment of forest operations: A review. Curr. For. Rep. 2019, 5, 101–113. [Google Scholar] [CrossRef] [Green Version]
  5. Froehlich, H.; Miles, D.; Robbins, R. Growth of young Pinus ponderosa and Pinus contorta on compacted soil in central Washington. For. Ecol. Manag. 1986, 15, 285–294. [Google Scholar] [CrossRef]
  6. DeArmond, D.; Emmert, F.; Lima, A.J.N.; Higuchi, N. Impacts of soil compaction persist 30 years after logging operations in the Amazon Basin. Soil Tillage Res. 2019, 189, 207–216. [Google Scholar] [CrossRef]
  7. Mohieddinne, H.; Brasseur, B.; Spicher, F.; Gallet-Moron, E.; Buridant, J.; Kobaissi, A.; Horen, H. Physical recovery of forest soil after compaction by heavy machines, revealed by penetration resistance over multiple decades. For. Ecol. Manag. 2019, 449. [Google Scholar] [CrossRef]
  8. Han, H.-S.; Page-Dumroese, D.; Han, S.-K.; Tirocke, J. Effects of Slash, Machine Passes, and Soil Moisture on Penetration Resistance in a Cut-to-length Harvesting. Int. J. For. Eng. 2006, 17, 11–24. [Google Scholar] [CrossRef]
  9. Poltorak, B.J.; Labelle, E.R.; Jaeger, D. Soil displacement during ground-based mechanized forest operations using mixed-wood brush mats. Soil Tillage Res. 2018, 179, 96–104. [Google Scholar] [CrossRef]
  10. Jankovský, M.; Allman, M.; Allmanová, Z.; Ferenčík, M.; Vlčková, M. Changes of key soil parameters five years after forest harvesting suggest slow regeneration of disturbed soil. J. Sustain. For. 2019, 38, 369–380. [Google Scholar] [CrossRef]
  11. Varol, T.; Emir, T.; Akgul, M.; Ozel, H.B.; Acar, H.H.; Cetin, M. Impacts of Small-Scale Mechanized Logging Equipment on Soil Compaction in Forests. J. Soil Sci. Plant Nutr. 2020, 20, 953–963. [Google Scholar] [CrossRef]
  12. Busman, N.A.; Maie, N.; Ishak, C.F.; Sulaiman, M.F.; Melling, L. Effect of compaction on soil CO2 and CH4 fluxes from tropical peatland in Sarawak, Malaysia. Environ. Dev. Sustain. 2021, 1–14. [Google Scholar] [CrossRef]
  13. Fernández, J.L.F.; Hartmann, P.; Schäffer, J.; Puhlmann, H.; Von Wilpert, K. Initial recovery of compacted soil—planting and technical treatments decrease CO2 concentrations in soil and promote root growth. Ann. For. Sci. 2017, 74, 73. [Google Scholar] [CrossRef] [Green Version]
  14. Benthaus, M.; Matthies, D. Regeneration of forst soils stressed by skidders. AFZ. Allg. Forst Z. Waldwirtsch. Umweltvorsorge 1993, 48, 448–451. [Google Scholar]
  15. Zemke, J.J.; Enderling, M.; Klein, A.; Skubski, M. The Influence of Soil Compaction on Runoff Formation. A Case Study Focusing on Skid Trails at Forested Andosol Sites. Geosciences 2019, 9, 204. [Google Scholar] [CrossRef] [Green Version]
  16. Ballard, R.A.; Charman, N. Nodulation and growth of pasture legumes with naturalised soil rhizobia. 1. Annual Medicago spp. Aust. J. Exp. Agric. 2000, 40, 939–948. [Google Scholar] [CrossRef]
  17. Qi, J.; Marshall, J.D.; Mattson, K.G. High soil carbon dioxide concentrations inhibit root respiration of Douglas fir. New Phytol. 1994, 128, 435–442. [Google Scholar] [CrossRef]
  18. Epron, D.; Plain, C.; Ndiaye, F.-K.; Bonnaud, P.; Pasquier, C.; Ranger, J. Effects of compaction by heavy machine traffic on soil fluxes of methane and carbon dioxide in a temperate broadleaved forest. For. Ecol. Manag. 2016, 382, 1–9. [Google Scholar] [CrossRef]
  19. Cambi, M.; Hoshika, Y.; Mariotti, B.; Paoletti, E.; Picchio, R.; Venanzi, R.; Marchi, E. Compaction by a forest machine affects soil quality and Quercus robur L. seedling performance in an experimental field. For. Ecol. Manag. 2017, 384, 406–414. [Google Scholar] [CrossRef]
  20. Jourgholami, M. Effects of soil compaction on growth variables in Cappadocian maple (Acer cappadocicum) seedlings. J. For. Res. 2017, 29, 1–10. [Google Scholar] [CrossRef]
  21. Raich, J.W.; Schlesinger, W.H. The global carbon dioxide flux in soil respiration and its relationship to vegetation and climate. Tellus B 1992, 44, 81–99. [Google Scholar] [CrossRef] [Green Version]
  22. Jeong, S.-H.; Eom, J.-Y.; Park, J.-Y.; Lee, J.-S. Characteristics of accumulated soil carbon and soil respiration in temperate deciduous forest and alpine pastureland. J. Ecol. Environ. 2018, 42, 3. [Google Scholar] [CrossRef] [Green Version]
  23. Mazza, G.; Agnelli, A.E.; Cantiani, P.; Chiavetta, U.; Doukalianou, F.; Kitikidou, K.; Milios, E.; Orfanoudakis, M.; Radoglou, K.; Lagomarsino, A. Short-term effects of thinning on soil CO2, N2O and CH4 fluxes in Mediterranean forest ecosystems. Sci. Total Environ. 2018, 651, 713–724. [Google Scholar] [CrossRef]
  24. Jiang, H.; Deng, Q.; Zhou, G.; Hui, D.; Zhang, D.; Liu, S.; Chu, G.; Li, J. Responses of soil respiration and its tempera-ture/moisture sensitivity to precipitation in three subtropical forests in southern China. Biogeosciences 2013, 10, 3963–3982. [Google Scholar] [CrossRef] [Green Version]
  25. Hinko-Najera, N.; Fest, B.; Livesley, S.J.; Arndt, S.K. Reduced throughfall decreases autotrophic respiration, but not het-erotrophic respiration in a dry temperate broadleaved evergreen forest. Agric. For. Meteorol. 2015, 200, 66–77. [Google Scholar]
  26. ArchMiller, A.A.; Samuelson, L.J. Intra-annual variation of soil respiration across four heterogeneous longleaf pine forests in the southeastern United States. For. Ecol. Manag. 2016, 359, 370–380. [Google Scholar] [CrossRef] [Green Version]
  27. Najafi, A.; Solgi, A.; Sadeghi, S.H. Soil disturbance following four wheel rubber skidder logging on the steep trail in the north mountainous forest of Iran. Soil Tillage Res. 2009, 103, 165–169. [Google Scholar] [CrossRef]
  28. Agherkakli, B.; Najafi, A.; Sadeghi, S. Ground based operation effects on soil disturbance by steel tracked skidder in a steep slope of forest. J. For. Sci. 2010, 56, 278–284. [Google Scholar] [CrossRef] [Green Version]
  29. Williamson, J.; Neilsen, W. The influence of forest site on rate and extent of soil compaction and profile disturbance of skid trails during ground-based harvesting. Can. J. For. Res. 2000, 30, 1196–1205. [Google Scholar] [CrossRef]
  30. Han, S.-K.; Han, H.-S.; Page-Dumroese, D.S.; Johnson, L.R. Soil compaction associated with cut-to-length and whole-tree harvesting of a coniferous forest. Can. J. For. Res. 2009, 39, 976–989. [Google Scholar] [CrossRef] [Green Version]
  31. Andrade, M.L.d.C.; Tassinari, D.; Dias, M.d.S.; Martins, R.P.; Rocha, W.W.; Souza, Z.R.D. Soil compaction caused by harvest and logging operations in eucalyptus forests in coarse-textured soils from northeastern Brazil. Ciência Agrotecnologia 2017, 41, 191–200. [Google Scholar] [CrossRef] [Green Version]
  32. Brais, S.; Camiré, C. Soil compaction induced by careful logging in the claybelt region of northwestern Quebec (Canada). Can. J. Soil Sci. 1998, 78, 197–206. [Google Scholar] [CrossRef]
  33. Powers, R.F.; Scott, D.A.; Sanchez, F.G.; Voldseth, R.A.; Page-Dumroese, D.; Elioff, J.D.; Stone, D.M. The North American long-term soil productivity experiment: Findings from the first decade of research. For. Ecol. Manag. 2005, 220, 31–50. [Google Scholar] [CrossRef]
  34. Ampoorter, E.; de Schrijver, A.; van Nevel, L.; Hermy, M.; Verheyen, K. Impact of mechanized harvesting on compaction of sandy and clayey forest soils: Results of a meta-analysis. Ann. For. Sci. 2012, 69, 533–542. [Google Scholar] [CrossRef] [Green Version]
  35. McDonald, T.P.; Seixas, F. Effect of slash on forwarder soil compaction. J. For. Eng. 1997, 8, 15–26. [Google Scholar]
  36. McNabb, D.; Startsev, A.; Nguyen, H. Soil wetness and traffic level effects on bulk density and air-filled porosity of com-pacted boreal forest soils. Soil Sci. Soc. Am. J. 2001, 65, 1238–1247. [Google Scholar] [CrossRef]
  37. Raper, R. Agricultural traffic impacts on soil. J. Terramechanics 2005, 42, 259–280. [Google Scholar] [CrossRef]
  38. Aragón, A.; Garcıa, M.; Filgueira, R.; Pachepsky, Y. Maximum compactibility of Argentine soils from the Proctor test—The relationship with organic carbon and water content. Soil Tillage Res. 2000, 56, 197–204. [Google Scholar] [CrossRef]
  39. Rochette, P.; Ellert, B.; Gregorich, E.G.; Desjardins, R.L.; Pattey, E.; Lessard, R.; Johnson, B.G. Description of a dynamic closed chamber for measuring soil respiration and its comparison with other techniques. Can. J. Soil Sci. 1997, 77, 195–203. [Google Scholar] [CrossRef]
  40. Allman, M.; Allmanová, Z.; Jankovský, M.; Ferenčík, M.; Messingerová, V. Damage of the remaining stands caused by various types of logging technology. Acta Univ. Agric. Silvic. Mendel. Brun. 2016, 64, 379–385. [Google Scholar] [CrossRef] [Green Version]
  41. Han, S.-K.; Lee, K.-C.; Oh, J.-H.; Mun, H.-S.; Lee, S.-T.; Choi, Y.-S.; Choi, B.-K. Characteristics of Soil Disturbance Caused by Passages of Harvester and Forwarder in Cut-to-Length Harvesting Operations. J. Korean Soc. For. Sci. 2019, 108, 67–76. [Google Scholar]
  42. Pla, C.; Cuezva, S.; Martinez-Martinez, J.; Fernandez-Cortes, A.; Garcia-Anton, E.; Fusi, N.; Crosta, G.B.; Cuevas-Gonzalez, J.; Cañaveras, J.C.; Sanchez-Moral, S. Role of soil pore structure in water infiltration and CO2 exchange between the at-mosphere and underground air in the vadose zone: A combined laboratory and field approach. Catena 2017, 149, 402–416. [Google Scholar] [CrossRef] [Green Version]
  43. Rayment, M.; Jarvis, P. Temporal and spatial variation of soil CO2 efflux in a Canadian boreal forest. Soil Biol. Biochem. 2000, 32, 35–45. [Google Scholar] [CrossRef]
  44. Drewitt, G.; Black, T.; Nesic, Z.; Humphreys, E.; Jork, E.; Swanson, R.; Ethier, G.; Griffis, T.; Morgenstern, K. Measuring forest floor CO2 fluxes in a Douglas-fir forest. Agric. For. Meteorol. 2002, 110, 299–317. [Google Scholar] [CrossRef]
  45. Ball, B.C.; Scott, A.; Parker, J.P. Field N2O, CO2 and CH4 fluxes in relation to tillage, compaction and soil quality in Scotland. Soil Tillage Res. 1999, 53, 29–39. [Google Scholar] [CrossRef]
  46. Conlin, T.S.S.; Driessche, R.V.D. Response of soil CO2 and O2 concentrations to forest soil compaction at the Long-term Soil Productivity sites in central British Columbia. Can. J. Soil Sci. 2000, 80, 625–632. [Google Scholar] [CrossRef] [Green Version]
  47. Mariotti, B.; Hoshika, Y.; Cambi, M.; Marra, E.; Feng, Z.; Paoletti, E.; Marchi, E. Vehicle-induced compaction of forest soil affects plant morphological and physiological attributes: A meta-analysis. For. Ecol. Manag. 2020, 462, 118004. [Google Scholar] [CrossRef]
  48. Hanson, P.; Edwards, N.; Garten, C.; Andrews, J. Separating root and soil microbial contributions to soil respiration: A review of methods and observations. Biogeochemistry 2000, 48, 115–146. [Google Scholar] [CrossRef]
  49. Buyanovsky, G.A.; Wagner, G.H. Annual Cycles of Carbon Dioxide Level in Soil Air1. Soil Sci. Soc. Am. J. 1983, 47, 1139–1145. [Google Scholar] [CrossRef]
  50. Labelle, E.R.; Jaeger, D. Soil compaction caused by cut-to-length forest operations and possible short-term natural rehabilitation of soil density. Soil Sci. Soc. Am. J. 2011, 75, 2314–2329. [Google Scholar]
  51. Bottinelli, N.; Hallaire, V.; Goutal, N.; Bonnaud, P.; Ranger, J. Impact of heavy traffic on soil macroporosity of two silty forest soils: Initial effect and short-term recovery. Geoderma 2014, 217–218, 10–17. [Google Scholar] [CrossRef]
  52. Jakobsen, B.; Greacen, E. Compaction of sandy forest soils by forwarder operations. Soil Tillage Res. 1985, 5, 55–70. [Google Scholar] [CrossRef]
Figure 1. Mechanized thinning of Pinus koraiensis stand (May 2018) in the Hwacheon-gun, Gangwon Province, Korea. Compacted and uncompacted (control) areas were selected in four machine-treatment (MT) plots to determine the effects of compaction on forest soils.
Forests 12 01497 g001
Figure 2. Soil CO2 efflux (Fc) in the study site, from September 2018 to October 2020, as a function of soil CO2 concentration (Sc). * represent significant differences at p ≤ 0.05 between values on disturbed tracks and control areas in the MT plots.
Forests 12 01497 g002
Figure 3. Impact of machine traffic on (a) soil CO2 efflux (Fc) and (b) soil CO2 concentration (Sc) in the disturbed track and control area from September 2018 to September 2020; each symbol represents the mean of measured data in four MT plots.
Forests 12 01497 g003
Figure 4. Change rate in soil bulk density (BD), soil temperature (ST), soil water content (SWC), soil CO2 efflux (Fc), and soil CO2 concentration (Sc) on disturbed tracks with respect to control areas by machine-treatment (MT) plot. Except for BD, data was collected monthly from September 2018 to September 2020 after the thinning operation was conducted in May 2018. Soil samples for the analysis of BD were collected in every September from 2018 to 2020. * Different letters represent significant difference across MT plots for each variable at p ≤ 0.05.
Forests 12 01497 g004
Figure 5. Annual average change rate in (a) soil bulk density (BD) and (b) soil CO2 concentration (Sc) on disturbed tracks with respect to control areas in all four MT plots following compaction. Soil samples for the analysis of BD were collected every September from 2018 to 2020. Sc was measured monthly from September 2018 to September 2020, except in the winter season. * Different letters represent a significant difference in mean change rate across the years in each MT plot at p ≤ 0.05.
Forests 12 01497 g005
Table 1. Machine traffic conditions on each machine-treatment (MT) plot.
PlotTraffic Intensity (Machine Passes)Terrain Slope(%)
HarvesterSkidder
MT11054
MT21034
MT31122
MT43233
Table 2. Site description for each machine-treatment (MT) plot at the study site. Soil samples to obtain soil pH, organic matter content (OMC), and texture were collected at different soil depths (0–10, 10–20, and 20–30 cm) prior to the thinning operation in May 2018.
PlotSoil pHOMC (%)Soil Texture
Soil Depth (cm)
102030102030102030
MT14.94.95.17.55.23.4loamloamy sandloamy sand
MT24.94.9523.69.68.4sandy loamsandy loamsandy loam
MT34.84.74.710.96.23.6sandy loamloamy sandsand
MT44.74.84.88.96.15.6loamloamy sandsand
Table 3. Statistical significance probability values for the effect of variables on soil bulk density (BD), soil CO2 efflux (Fc), soil CO2 concentration (Sc), soil temperature (ST), and soil water content (SWC) from ANOVA using general linear models (GLM).
VariablePr > |F|
BD cFcScSTSWC
Soil compaction (C)0.0010.0250.0020.053<0.001
Machine traffic condition (MT) a
C × MT0.1330.5140.0240.3350.012
Measurement period (P) b
C × P0.408<0.0010.5110.9970.995
C × MT × P0.004ND dNDNDND
Soil depth (D)
C × D0.802----
C × D × P0.985----
a Machine traffic condition (MT) represents the frequency of machine traffic and terrain slope. b Measurement period (P) of Fc, Sc, ST, and SWC was September 2018 to September 2020, except for the winter months (December, January, February) (mechanized timber harvesting was conducted in 2018 at the study site); b Measurement period (P) for BD was September 2018, 2019, 2020. c Soil samples for the analysis of BD were collected at soil depths (D) of 10, 20, and 30 cm. d ND: non-determined.
Table 4. Average ± standard error of soil bulk density (BD) by soil depth and soil organic matter content (OMC) following machine traffic during the thinning operation in May 2018. Soil samples for the analysis of BD were collected in September 2018, 2019, 2020. Soil samples for the analysis of organic matter content (OMC) analysis on disturbed tracks (0–30 cm depth) and control areas across all MT plots were collected in October 2020.
Disturbed TrackControl Area
PlotBD
(g cm−3)
OMC
(%)
BD
(g cm−3)
OMC
(%)
10 cm20 cm30 cm0–30 cm0–30 cm10 cm20 cm30 cm0–30 cm0–30 cm
MT10.97 ± 0.021.06 ± 0.021.06 ± 0.061.03 ± 0.035.0 ± 1.10.85 ± 0.020.89 ± 0.021.00 ± 0.050.91 ± 0.034.6 ± 0.6
MT21.01 ± 0.051.08 ± 0.041.11 ± 0.041.06 ± 0.044.0 ± 0.80.90 ± 0.030.98 ± 0.021.06 ± 0.000.98 ± 0.025.1 ± 0.7
MT31.12 ± 0.021.08 ± 0.011.14 ± 0.021.11 ± 0.024.9 ± 0.60.97 ± 0.021.00 ± 0.041.06 ± 0.031.01 ± 0.033.8 ± 0.6
MT41.23 ± 0.061.27 ± 0.061.35 ± 0.071.28 ± 0.064.6 ± 0.90.94 ± 0.021.02 ± 0.011.12 ± 0.031.03 ± 0.024.3 ± 0.5
Total1.08 ± 0.041.12 ± 0.031.17 ± 0.051.12 * ± 0.034.6 ± 0.90.92 ± 0.020.97 ± 0.021.06 ± 0.030.98 * ± 0.024.4 ± 0.6
* indicates a significant difference between the values on the disturbed track and control area for each variable.
Table 5. Seasonal average ± standard error of soil temperature (ST), soil water content (SWC) obtained on disturbed tracks (T) and control areas (C) for the four machine-treatment (MT) plots following machine traffic during the thinning operation in May 2018. The data were collected every month from September 2018 to September 2020 except during the winter months (December, January, February).
MT1MT2MT3MT4
TCTCTCTC
ST(°C)Fall y1 a9.8 ± 1.610.0 ± 1.69.4 ± 1.610.0 ± 1.69.4 ± 1.710.0 ± 1.69.9 ± 1.610.0 ± 1.5
Spring y26.2 ± 1.56.6 ± 1.58.2 ± 2.18.2 ± 2.08.4 ± 2.58.8 ± 2.18.6 ± 2.38.9 ± 2.4
Summer y218.6 ± 1.319.3 ± 1.319.8 ± 1.419.8 ± 1.419.3 ± 2.117.8 ± 3.219.0 ± 2.219.1 ± 2.4
Fall y211.9 ± 3.511.9 ± 3.310.2 ± 2.910.4 ± 2.910.2 ± 3.010.7 ± 2.810.6 ± 2.810.5 ± 3.0
Spring y38.8 ± 2.69.5 ± 2.68.7 ± 2.79.1 ± 2.69.2 ± 2.89.1 ± 2.89.3 ± 2.79.8 ± 2.7
Summer y317.0 ± 0.117.4 ± 0.117.6 ± 0.118.0 ± 0.218.1 ± 0.118.0 ± 0.018.0 ± 0.318.4 ± 0.6
Fall y314.8 ± 0.015.1 ± 0.015.3 ± 0.015.4 ± 0.015.4 ± 0.015.4 ± 0.015.1 ± 0.015.1 ± 0.0
SWC(%)Fall y118.6 ± 0.514.5 ± 0.618.4 ± 1.311.7 ± 0.914.6 ± 0.812.7 ± 0.915.4 ± 0.411.0 ± 0.7
Spring y216.0 ± 1.212.1 ± 0.815.9 ± 2.213.8 ± 2.917.4 ± 1.810.5 ± 1.814.3 ± 1.711.8 ± 2.4
Summer y213.5 ± 2.011.5 ± 1.815.3 ± 2.411.3 ± 2.016.1 ± 1.012.9 ± 0.914.7 ± 1.111.5 ± 1.5
Fall y216.1 ± 2.313.4 ± 1.920.9 ± 2.114.0 ± 1.316.7 ± 1.212.2 ± 1.515.3 ± 2.412.6 ± 2.1
Spring y318.5 ± 2.216.5 ± 2.720.4 ± 4.015.0 ± 2.616.6 ± 2.715.2 ± 2.918.8 ± 1.514.4 ± 2.2
Summer y317.2 ± 4.815.6 ± 4.921.2 ± 4.714.7 ± 4.416.4 ± 3.314.0 ± 4.018.0 ± 4.513.6 ± 4.2
Fall y321.6 ± 0.016.7 ± 0.023.5 ± 0.016.3 ± 0.019.0 ± 0.015.4 ± 0.018.4 ± 0.015.2 ± 0.0
a y1: first year when machine traffic occurred (September to November 2018, y2: second year after machine traffic (March to November 2019), y3: third year after machine traffic (April to September 2020).
Table 6. Relationship between soil CO2 efflux (Fc)·concentration (Sc) and soil temperature.
PlotEffects of ST on FcEffects of ST on Sc
R2pQ10 aAICC bR2pQ10AICC
Disturbed trackMT10.56<0.0012.72−157.760.60<0.0012.01−260.76
MT20.34<0.0012.01−174.850.42<0.0011.82−264.71
MT30.38<0.0012.23−168.880.51<0.0012.01−259.86
MT40.49<0.0012.23−145.820.58<0.0012.01−254.39
Control areaMT10.63<0.0013.32−156.740.52<0.0011.82−272.84
MT20.46<0.0012.23−182.940.38<0.0011.65−266.84
MT30.51<0.0012.72−158.300.51<0.0011.82−267.68
MT40.53<0.0012.72−134.310.34<0.0011.65−262.23
a Q10: temperature coefficient. b AICC: Akaike information criteria.
Publisher’s Note: MDPI stays neutral with regard to jurisdictional claims in published maps and institutional affiliations.

