Article

Dynamic Patterns of the Vertical Distribution of Vegetation in Heihe River Basin since the 1980s

1
State Key Laboratory of Resources and Environmental Information System, Institute of Geographic Sciences and Natural Resources Research, Chinese Academy of Sciences, Beijing 100101, China
2
College of Resources and Environment, University of Chinese Academy of Sciences, Beijing 100049, China
3
Jiangsu Center for Collaborative Innovation in Geographical Information Resource Development and Application, Nanjing 210023, China
Forests 2021, 12(11), 1496; https://doi.org/10.3390/f12111496
Submission received: 3 September 2021 / Revised: 22 October 2021 / Accepted: 28 October 2021 / Published: 29 October 2021
(This article belongs to the Special Issue Effects of Forest Management and Climate Change on Forest Vegetation)

Abstract

:
The vertical distribution of vegetation in Heihe River Basin has presented a significant dynamic change in the different elevation zones since the 1980s. To explore the dynamic patterns of vegetation types located in the different elevation zones of Heihe River Basin, this study collected 440 field sampling datapoints of vegetation types, remote sensing images, climatic observation data, and DEM and preprocessed them. On the basis of the vegetation distribution and the terrain characteristics of Heihe River Basin, this study classified the vertical distribution of vegetation in Heihe River Basin into six vegetation zones, namely, the oasis farmland and desert zone, desert-steppe zone, dry scrub-steppe zone, mountain forest-steppe zone, subalpine scrub-meadow zone, and alpine cold desert-meadow zone. Moreover, the mean annual biotemperature (MAB) and total annual average precipitation (TAP) were used to analyze the relationship between vegetation change and climate change in the different elevation zones. The results show that the change rate of vegetation was up to 25.75% in Heihe River Basin. The area of vegetation that changed in the oasis farmland and desert zone was the largest (7224 km2), and the rate of vegetation that changed in the mountain forest-steppe zone was up to 56.93%. The mean annual biotemperature (MAB) and total annual average precipitation (TAP) in the six elevation zones showed an increasing trend, in which the increased rate of TAP presented a downward trend with the increase of elevation, and that of MAB showed a continuous upward trend with the increase of elevation. The change rate of vegetation was generally higher than that of MAB and TAP in the low and middle vegetation zones. The influence intensity of human activities on vegetation change in the lower and middle elevation zones of Heihe River Basin was greater than that in the high elevation zone between the 1980s and the 2010s. MAB is the major impact factor to vegetation change in the alpine cold zone of Heihe River Basin.

1. Introduction

The plant community is the product of the interaction between plants and their ambient environment, which is manifested in the adaptability and feedback of vegetation to changes in environmental elements [1,2,3]. The spatial distribution of vegetation is affected by various environmental factors, such as temperature, precipitation, soil, humidity, and topography. The spatiotemporal pattern of vegetation distribution tends to undergo a series of spatial movements driven by climate change, indicators for studying the quantitative impact of climate change, and response of vegetation due to climate change [4,5,6]. At present, a large number of studies [7,8] have been efforts to establish the relationship between vegetation and climate by considering biophysical variables such as sunshine duration, ppt, slope, and Kira’s warmth index. However, these studies mainly focus on analyzing the change of vegetation coverage index (e.g., NDVI) [9], or discussing the response of vegetation change to climate from a horizontal perspective [10], lacking explication from a vertical perspective.
Climate change causes a change in the soil hydrological cycle system [11], leading to changes in plant growth and its distribution environment [12] and corresponding changes in vegetation types and distribution [13,14]. Temperature and precipitation are the most important climatic elements, and their spatiotemporal changes will directly affect the spatial distribution and change of vegetation [15]. In the past 50 years, the average temperature in the Heihe River Basin has shown a significant increasing trend [16]. Under the impacts of climate change and human activities, the ecological environment of Heihe River Basin has shown a series of degradation phenomena. For example, the overload of the mountain pastures in the upper reaches of Heihe River led to the degradation of large areas of pastures. The area of Ejina Banner in the lower reaches was deteriorate from an ecological barrier of the northwestern region to an important source of sandstorms [16], and the area of influence involves Northwest China, North China, and even East China [17,18]. In recent years, a large number of observations and statistical studies have been made in Heihe River Basin [19,20], especially in small watersheds or smaller scales [21]. However, the responses of spatial distribution in vegetation to climate change are mainly concentrated in some local areas and lack an analysis to the whole area of Heihe River Basin, especially in the different elevation zones [22,23,24].
Moreover, the traditional method of updating vegetation distribution data is mainly based on a large number of field sampling data, original vegetation map, remote sensing images, and other auxiliary data [14,25], which requires expensive cost for purchasing and storing a large number of high-resolution images of remote sensing. In terms of the Google Earth platform, the multi-resolution remote sensing images do not need be downed and stored, being used directly on the Google Earth platform. The original data of vegetation distribution and sampling data can be directly upload to the Google Earth platform [24]. The different resolution images can be adjusted to meet the needs of identifying the vegetation type by zooming the image window on the Google map. They indicate the spatial mapping and analysis methods on the Google Earth platform, and ArcGIS can not only efficiently update the vegetation distribution data but also effectively make up for the current limitations of analyzing vegetation changes in the Heihe River Basin [22,25].
In this paper, the 410 field sampling data multi-resolution remote sensing images and the original vegetation data in the 1980s were combined, and the cost-effective Google Earth platform was utilized to update the spatial data of vegetation in Heihe River Basin in the 2010s. Heihe River Basin is classified into six elevation zones according to the characteristics of vegetation distribution. A dynamic index of vegetation distribution was developed to explicate the spatiotemporal change of vegetation, and a spatial change index of climate elements was developed to analyze the change trend of mean annual biotemperature (MAB) and total annual average precipitation (TAP) in the different elevation zones of Heihe River Basin between the 1980s and 2010s. In addition, the response differences of vegetation to climate change are discussed in the different elevation zones of Heihe River Basin.

2. Materials and Methods
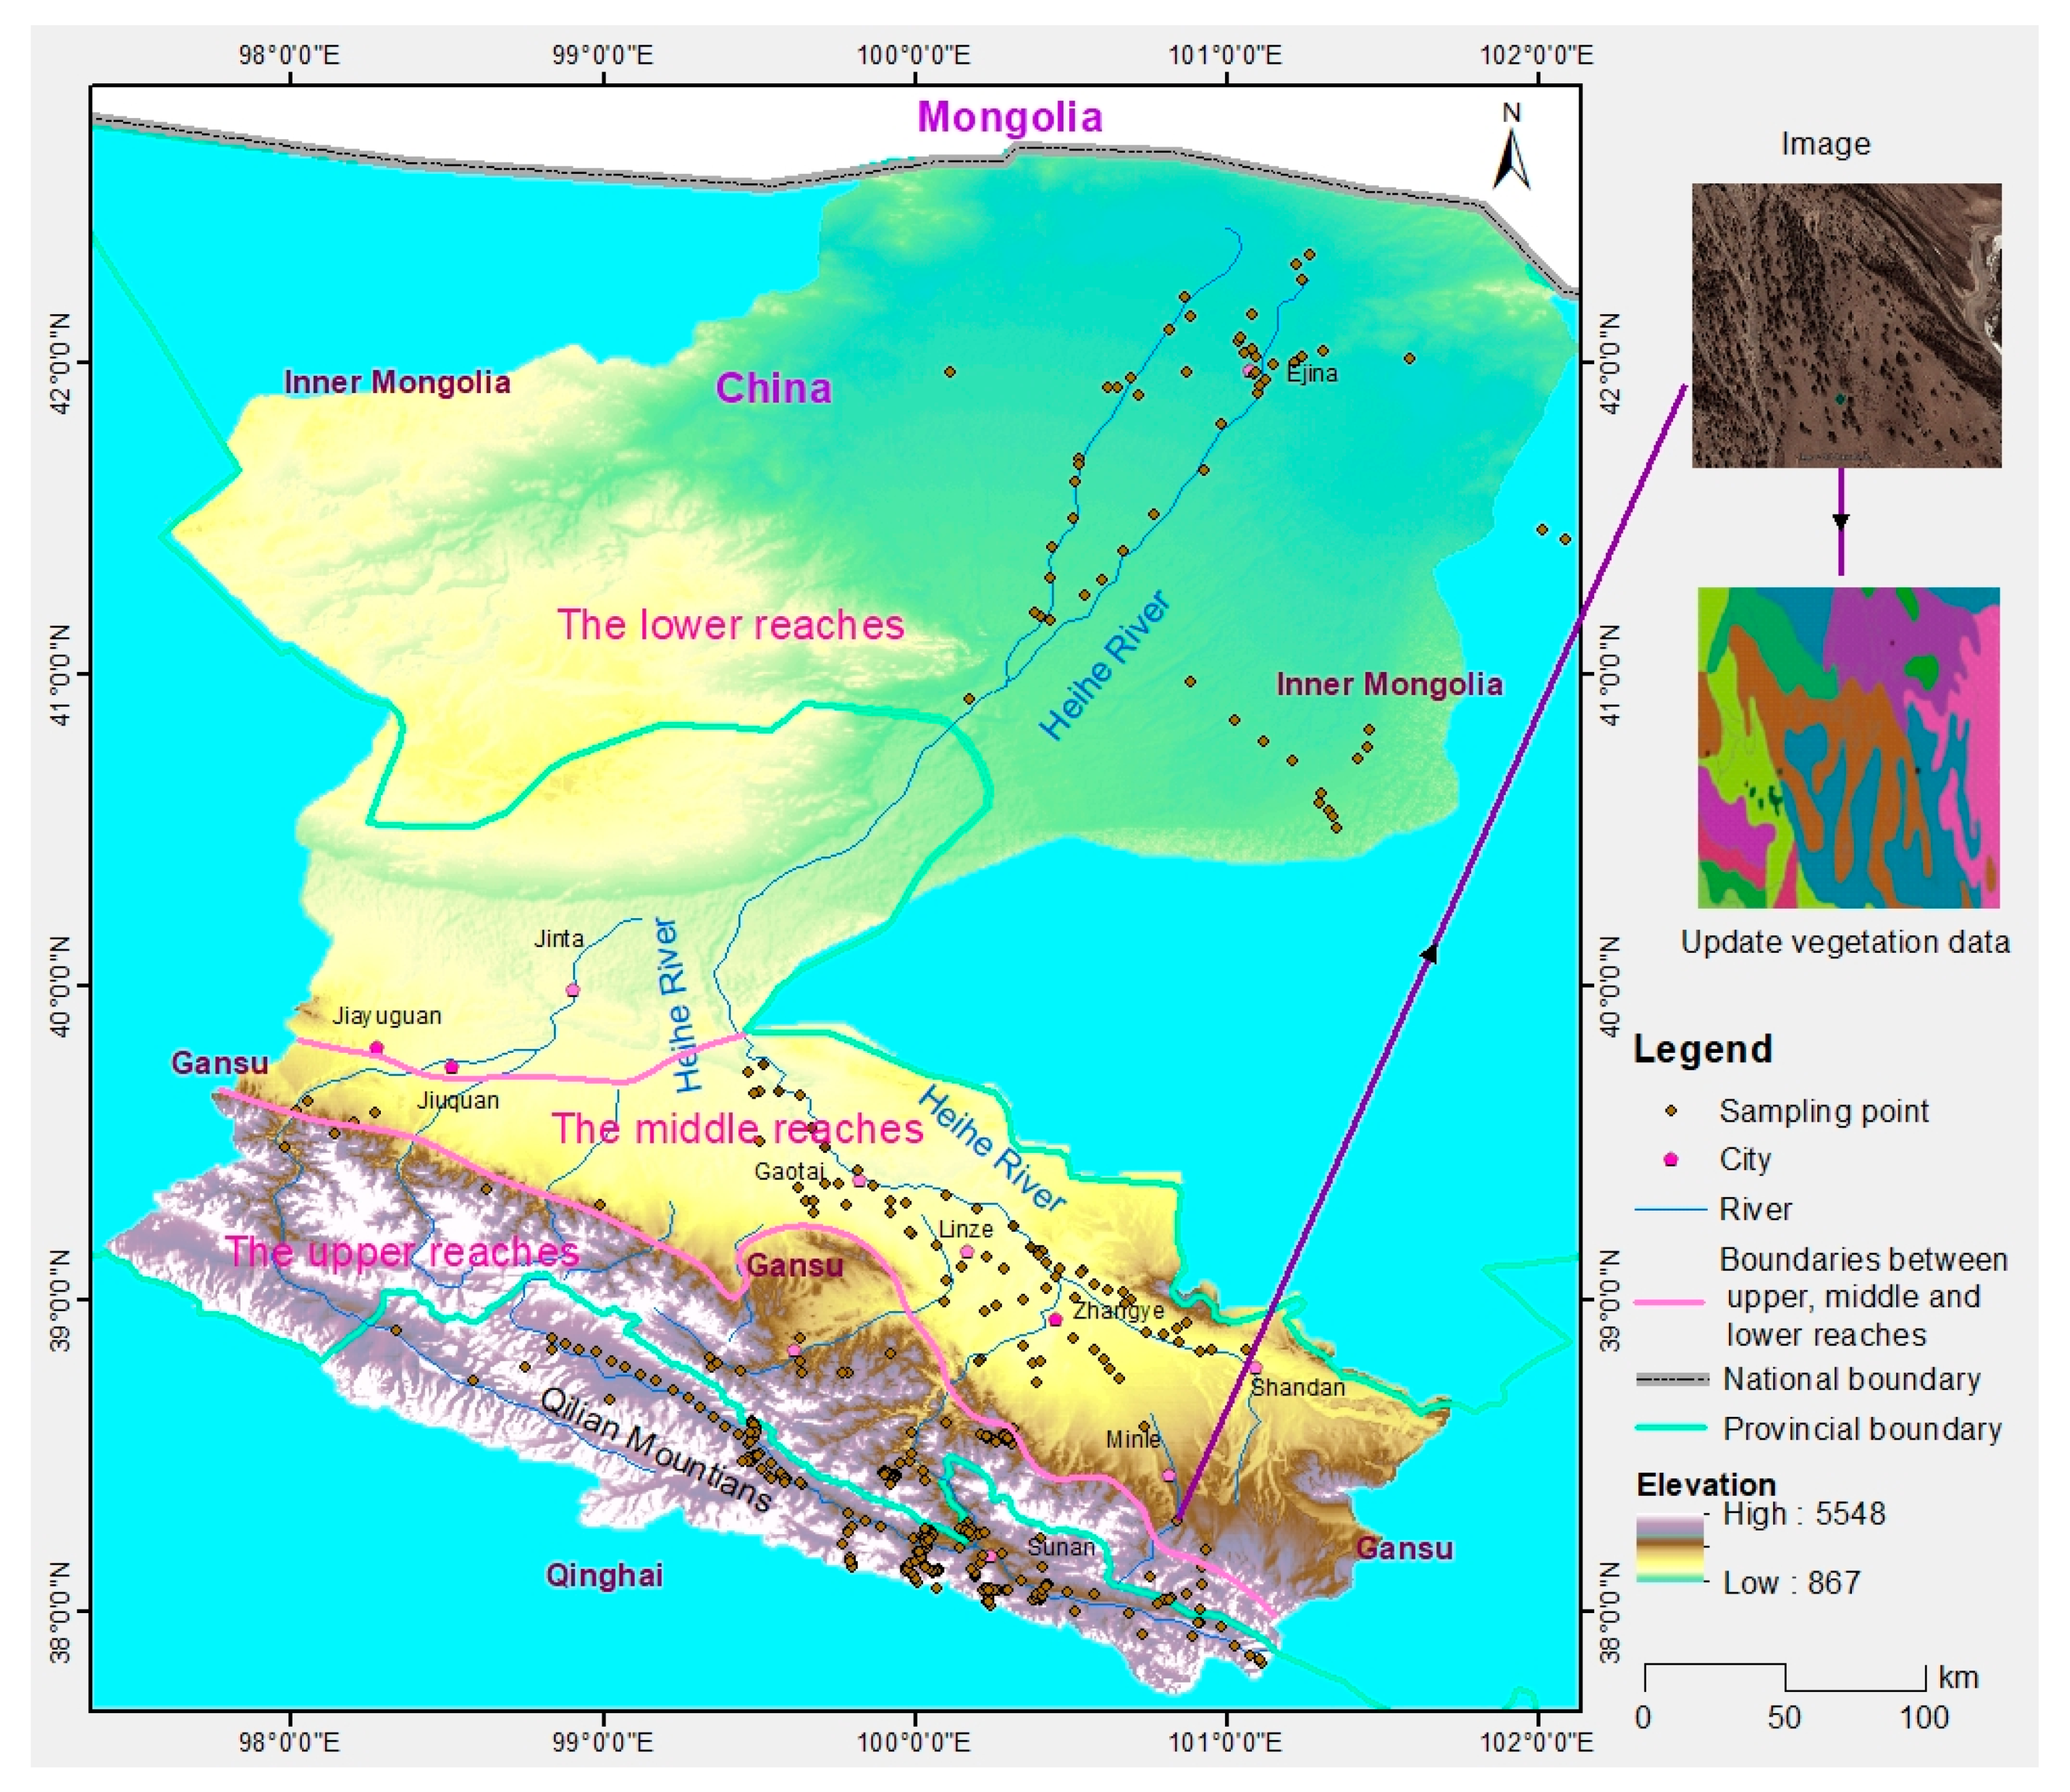
2.1. Study Area

Heihe River Basin, the second largest inland river basin in China, covers more than 14 × 104 km2, being a typical ecological transition zone with the continental arid climate condition [21,26,27] (Figure 1). From the upper reaches to the lower reaches, the biotemperature increases and the precipitation decreases gradually [28,29,30]. The upper reaches with high terrain and cold climate are mainly located in the Qilian Mountains, where the range of total annual average precipitation (TAP) is between 250 and 500 mm, and the distribution of vegetation has an obvious gradient. Among them, the alpine cushion vegetations are mainly distributed in the elevations from 3900 to 4200 m. The alpine meadow vegetations dominated by Kobresia and forb grass are mainly distributed in the elevations from 3600 to 3900 m. The alpine scrub-meadows dominated by the scrub species of Rhododendron przewalskii, Salix cupularis, and Potentilla fruticosa are mainly distributed in the elevations from 3300 to 3900 m. The mountain forests mainly consist of Picea crassifolia and Sabina przewalskii and are distributed in the elevations between 2400 and 3400 m. The mountain steppe and the desert steppe are mainly distributed in the elevations from 2200 to 2600 m, and from 1900 to 2300 m, respectively.
The vegetation types of temperate small scrubs and semi-scrub deserts are mainly located in the middle and lower reaches of Heihe River Basin, where the elevation is generally less than 2000 m. In addition to a few of the desert vegetations of natural small-scrubs and semi-scrubs, the middle reaches are mainly covered by a large number of cultivated crops and planted forests. The lower delta of Heihe River basin is dominated by desert vegetations such as Populus euphratica, Haloxylon ammodendron, Elaeagnus angustifolia, Tamarix chinensis, and Nitraria tangutorum, among others [21,22]. In general, the distribution of Heihe Rivere Basin vegetation shows an obvious vertical zonality. The richness of vegetation types distributed in Qilian Mountains, Ober Beach, and Yeniugou Basin in the upper reaches is higher than that in other areas. The semi-scrub/dwarf semi-scrub desert, scrub desert, Kobresia/weed alpine meadow, and cultivated vegetation are the major vegetation types, covering 74.00% of the whole Heihe River Basin, in which the area of semi-scrub/dwarf semi-scrub desert is up to 57,222.87 km2, accounting for 44.53% of the total area.

2.2. Data Collection and Processing

The basic data for updating the vegetation data in the 2010s include the original vegetation types data in the 1980s, 410 vegetation samples collected in the field from 2011 to 2015 (Figure 1), and multi-resolution remote sensing images obtained from the Google Earth platform. The spatial data of original vegetation in the 1980s was downloaded from the Science Data Center for Cold and Arid Regions (http://sdb.casnw.net/portal/, accessed on 7 October 2020), which involves 79 plant species. The 410 vegetation samples are distributed in the upper, middle, and lower reaches, which cover all types of plant species in the Heihe River Basin. The remote sensing data include the resolutions from 2.5 to 30 m, which were obtained by zooming the images in the different levels for which plant type recognition was necessary (Figure 1).
During the update process of vegetation type in the 2010s, firstly, the sample data of vegetation, the original vegetation data in the 1980s, and the boundary data of Heihe River Basin were input into the Google map. Secondly, a plant species located in a simple point was distinguished on the basis of the plant species of samples data, and its boundary was drawn by combining the original vegetation data in the 1980s and the remote sensing images with suitable resolutions that can be used to identify the plant species. Thirdly, this study repeated the previous step until each plant species was identified and its boundary was drawn. Finally, the boundaries of all updated plant species were integrated to form a plant species map in the 2010s. In addition, in order to explore the vertical distribution of vegetation in Heihe River Basin and its response to climate change, this study classified the 79 plant species data from both the 1980s and the 2010s into 25 vegetation types (Figure 2) and transformed them by using the ArcGIS software to grid data with a same resolution of 500 × 500 m of MAB and TAP.
The climate data were collected from 44 meteorological observation stations in Heihe River Basin and its surrounding area. The spatial data of MAB and TAP with a resolution of 500 × 500 m were simulated by operating the high-speed and high-precision surface modeling (HASM) method (see references of Yue et al. (2013, 2020) [31,32,33,34,35] for specific methods). Moreover, the digital elevation model (DEM) data of Heihe River Basin were obtained from Shuttle Radar Topography Mission (SRTM) data, with a spatial resolution of 30 × 30 km (http://srtm.csi.cgiar.org, accessed on 5 June 2015).

2.3. Classification of the Vertical Vegetation Zone

The dynamic pattern of vegetation in the different elevation zones of Heihe River Basin is important to consider when explicating the differences of vegetation distribution and their responses to climate change from the gradient perspective [36]. On the basis of the DEM data and the spatial data of vegetation in the 1980s and 2010s, as well as by operating the ArcGIS software, this study classified the vertical distribution into six elevation zones, which considered the horizontal and vertical characteristics of vegetation distribution and climate elements in Heihe River Basin [14,37,38,39,40]. Among them, oasis farmland and desert zone is located in the area of elevation less than 1700 m, desert steppe zone is distributed in the elevation range from 1700 to 2100 m, dry scrub-grassland zone is distributed in the elevation range from 2100 to 2500 m, mountain forest-steppe zone is located in the elevation range from 2500 to 3300 m, subalpine scrub-meadow zone is distributed in the elevation range from 3300 to 3800 m, and alpine cold desert-meadow zone is located in the area of elevation more than 3800 m.

2.4. A dynamic Index of Vegetation Distribution

To analyze the dynamic changes of vegetation in the different elevation zones of Heihe River Basin, this study developed a dynamic index of vegetation distribution to compute the change rate of every vegetation type at the cell level. On the basis of the spatial data of vegetation type in the 1980s ( t 0 ) and 2010s ( t 1 ), DEM, and ArcGIS software, this study formulated the dynamic index as
i f { G ( x , y ) i , t 1 = G ( x , y ) i , t 0   ,   S ( x , y ) i = 0 G ( x , y ) i , t 1 G ( x , y ) i , t 0   ,   S ( x , y ) i = S i z e ( x , y ) i
SDI V k = i k S ( x , y ) i / S k
where SDI V k represents the change rate of vegetation in the kth (k = 1, 2, 3 …, 6) elevation zone of Heihe River Basin between t 0 and t 1 ; G ( x , y ) i , t 0 and G ( x , y ) i , t 1 are the attribute value of vegetation type at site ( x , y ) i in t 0 and t 1 , respectively; i is the elevation value included in the kth elevation zone; S i z e ( x , y ) i is the cell size at site ( x , y ) i ; and S k indicates the total area of the kth elevation zone of vegetation.

2.5. A Spatial Change Index of Climate Elements

In order to explicate the change trend of MAB and TAP in the different elevation zones of Heihe River Basin, this study developed a spatial change index of climate element to calculate the average value of MAB and TAP change from the 1980s ( t 0 ) to 2010s ( t 1 ) in the six elevation zones, which this study used to discuss the relationship between vegetation change and climate. The spatial change index of climate element can be formulated as
SIT k = ( M A B ( x , y ) k , t 1 M A B ( x , y ) k , t 0 ) ¯   /     ( M A B ( x , y ) k , t 0 ) ¯
SIP k =   ( T A P ( x , y ) k , t 1 T A P ( x , y ) k , t 0 ) ¯   /     ( T A P ( x , y ) k , t 0 ) ¯
where SIT k   and SIP k are the change rate of MAB and TAP in the kth elevation zone from the 1980s to the 2010s, respectively; M A B ( x , y ) k , t 0 and M A B ( x , y ) k , t 1 are the value of MAB at site   ( x , y ) in the kth elevation zone of vegetation in the 1980s and the 2010s, respectively; T A P ( x , y ) k , t 0 and T A P ( x , y ) k , t 1 are the value of TAP at site   ( x , y ) in the kth elevation zone of vegetation in the 1980s and the 2010s, respectively. k = 1, 2, 3 …, 6 represents the six respective elevation zones of vegetation.

3. Results

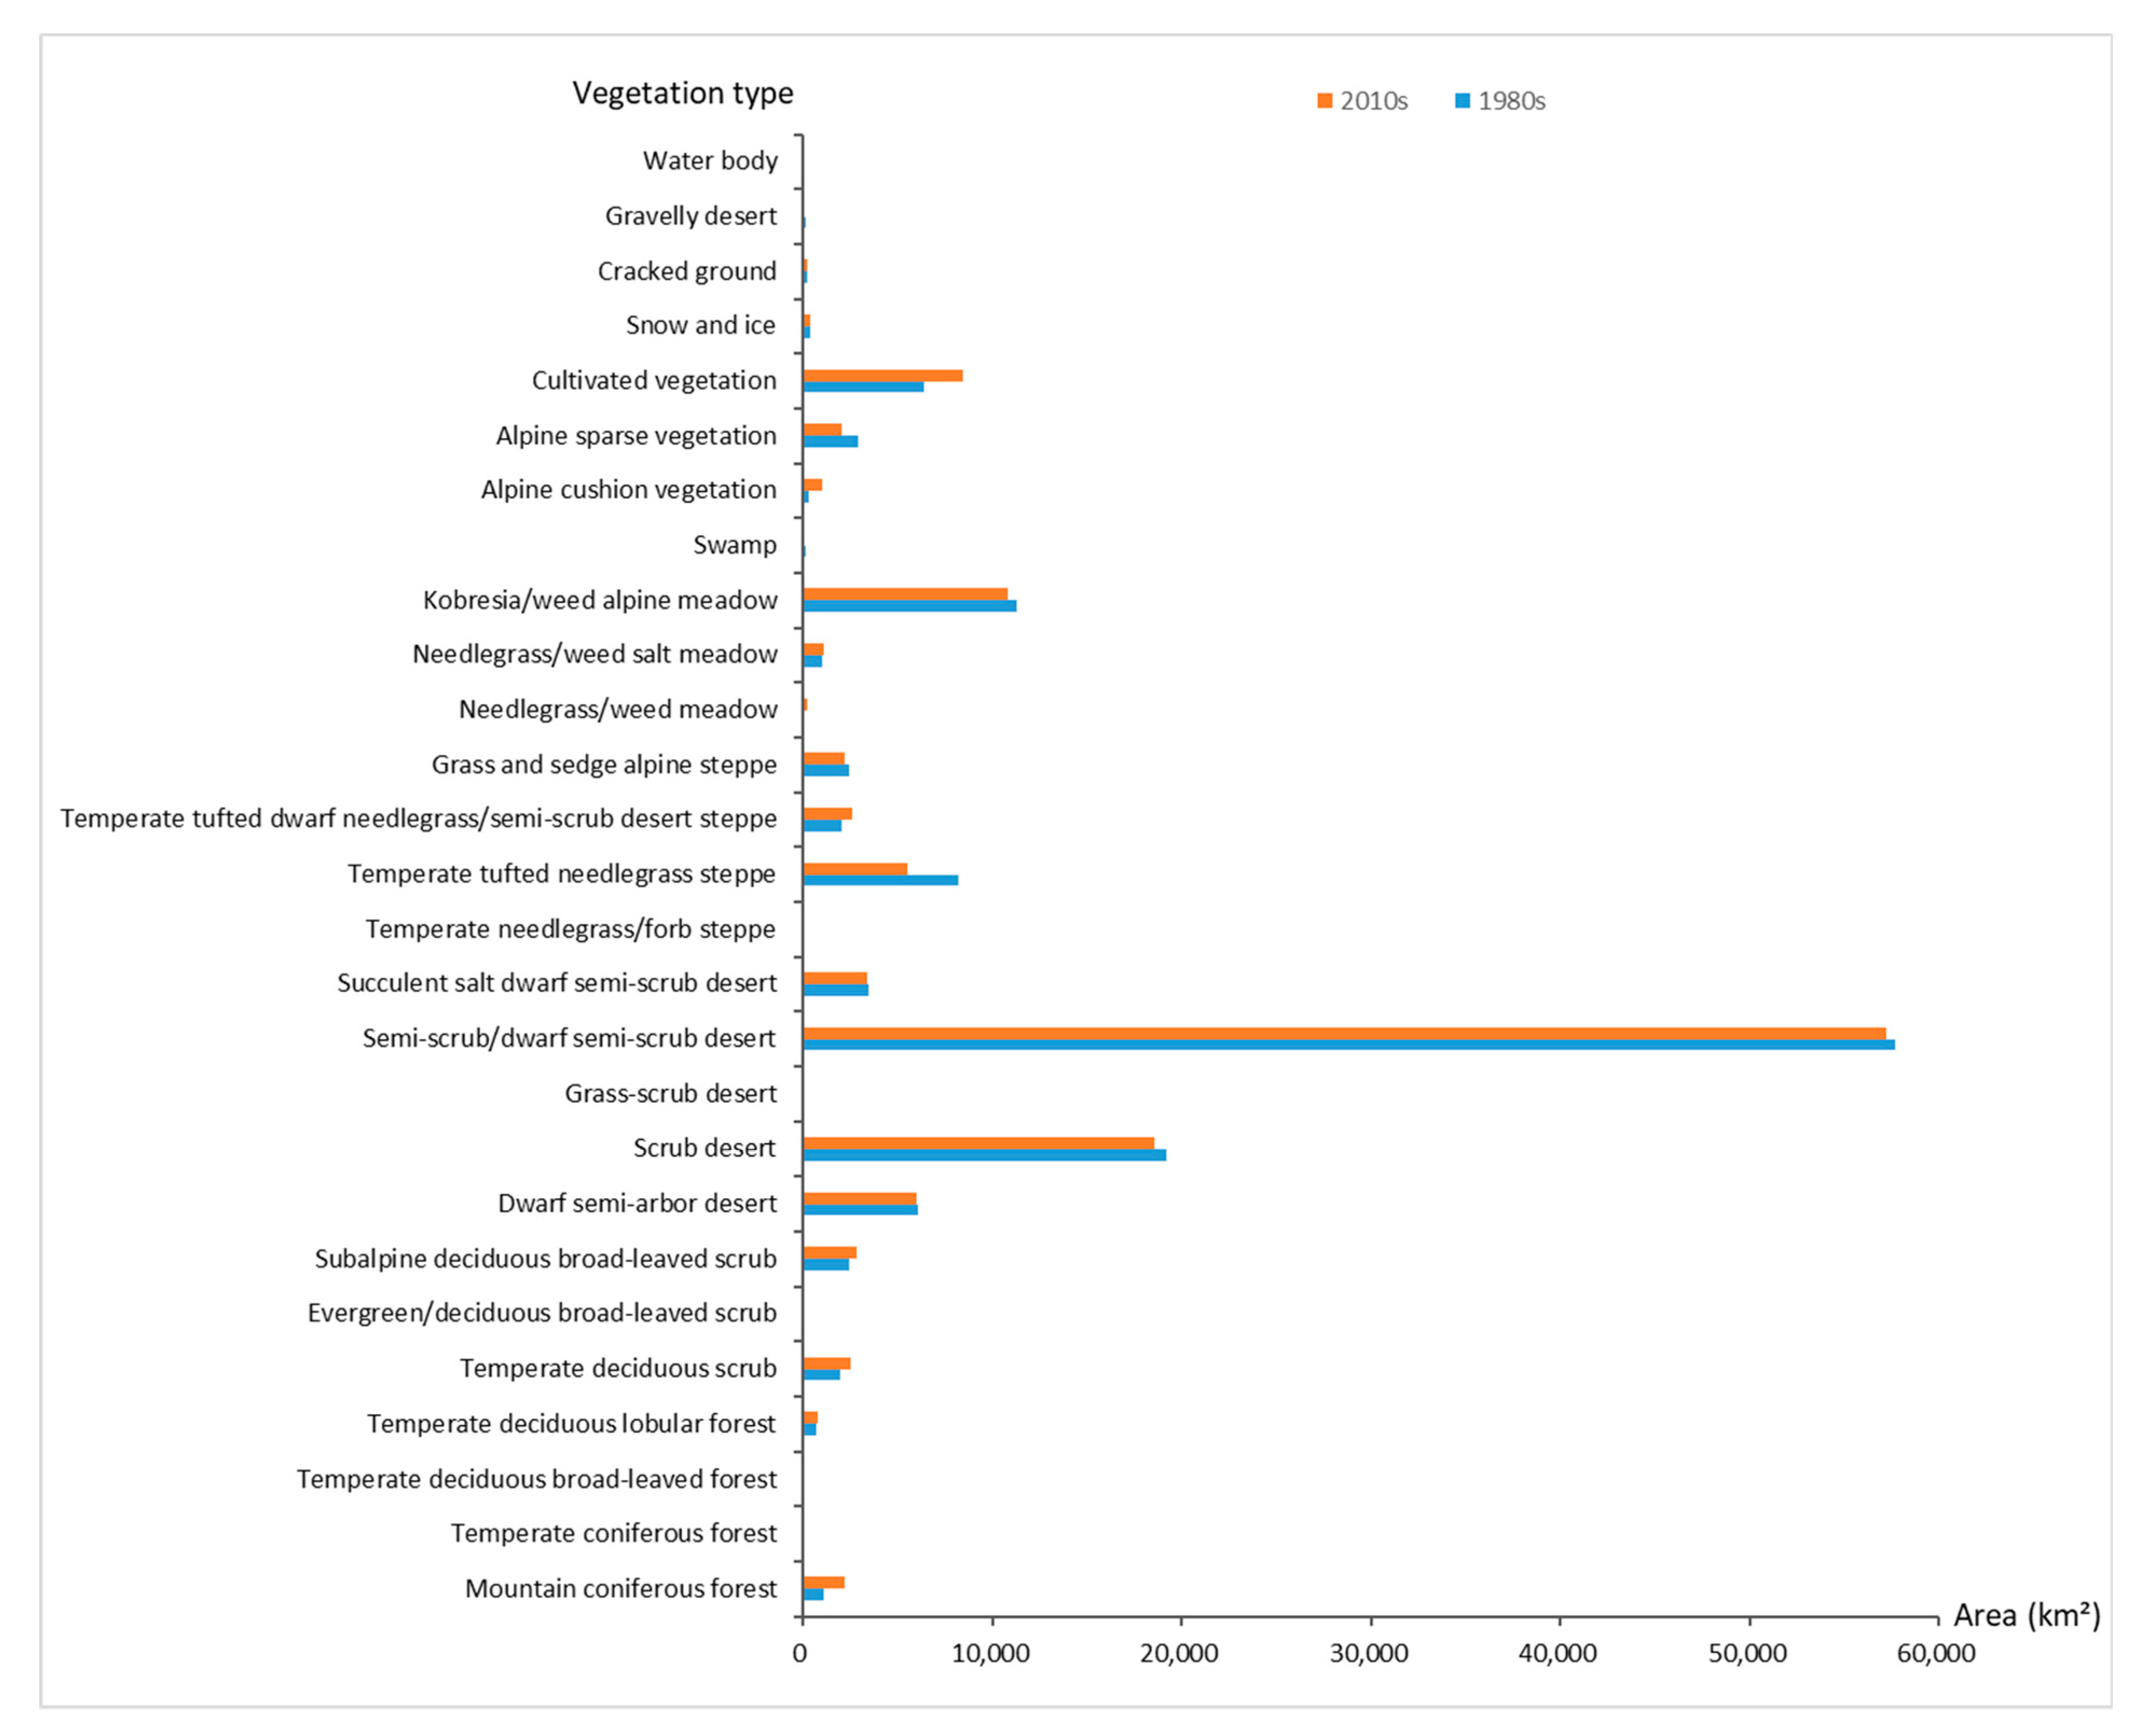
3.1. Dynamic Changes of Vegetation Types

Between the 1980s and the 2010s, the dynamic change rate of the vegetation distribution in the whole area of Heihe River Basin was up to 25.75%. The largest increased area of vegetation type is cultivated vegetation that was increased by 684.85 km2 per decade, and the second is mountain coniferous forest that was increased by 360.17 km2 per decade. In addition, the increased area of alpine cushion vegetation, temperate deciduous scrub, and the temperate tufted dwarf needlegrass/semi-scrub desert steppe are generally more than that of other vegetation types, which were, respectively, increased by 214.11, 205.54, and 189.39 km2 per decade. The vegetation types of temperate tufted needlegrass steppe, alpine sparse vegetation, scrub desert and semi-scrub/dwarf semi-scrub desert were, respectively, decreased by 887.65, 268.37, 201.06, and 157.97 km2 per decade, which were larger than that of other vegetation types (Figure 3).
From the plant species perspective, during the period from the 1980s to the 2010s, the Picea crassifolia distributed in the Shandan and Minle areas of the middle reaches was increased by 351.08 km2 per decade. The S. sareptana var. krylovii steppe distributed in the Qilian mountains of the upper reaches was decreased by 288.67 km2 per decade, and dwarf needlegrass steppe disappeared in Sunan County of the middle reaches. The area of S. oritrepha scrub had the biggest decrease rate (decreased by 95%), and the area of Picea crassifolia forest had the largest increase rate (increased by 96%) from the 1980s to the 2010s. In general, the Carex spp. forb meadow, Picea crassifolia forest, Sabina przewalskii forest, and Potentilla fruticosa scrub showed a rapid increasing trend, being increased by 358.19%, 32.52%, 30.68%, and 27.48% per decade, respectively. The S. oritrepha scrub, Calamagrostis epigejos tall grass meadow, Hedysarum monogolicum/Artemisia sasoloides/Psammochloa villosa desert, and Polygonum sphaerostachyum/P. viviparum meadow presented a rapid decreasing trend, being reduced by 31.69%, 27.46%, 26.34%, and 17.40% per decade, respectively. In addition, the increased area of the Salix gilashania scrub was only 1.24 km2 between the 1980s and the 2010s, but that showed an obviously different change trend at different elevations of Heihe River Basin.

3.2. Change Trends of Vegetation in Different Elevation Zones

The computed results of vegetation change in the different elevation zones of Heihe River Basin (Figure 4) showed that the vegetation distributed in the oasis farmland and desert zone had the largest changed area and the least change rate, accounting for 2408.00 km2 and 7.73% per decade between the 1980s and the 2010s, respectively. The area of vegetation change in the dry scrub-steppe zone was 1619.25 km2, which was the least in all elevation zones. The vegetation distributed in the mountain forest-steppe zone had the largest change rate, which was changed by 18.98% per decade during the period from the 1980s to the 2010s. In general, the change rate of vegetation distributed in the desert steppe zone, dry scrub-steppe zone, mountain forest-steppe zone, and subalpine scrub meadow zone were larger than that in other two elevation zones of Heihe River Basin between the 1980s and the 2010s.

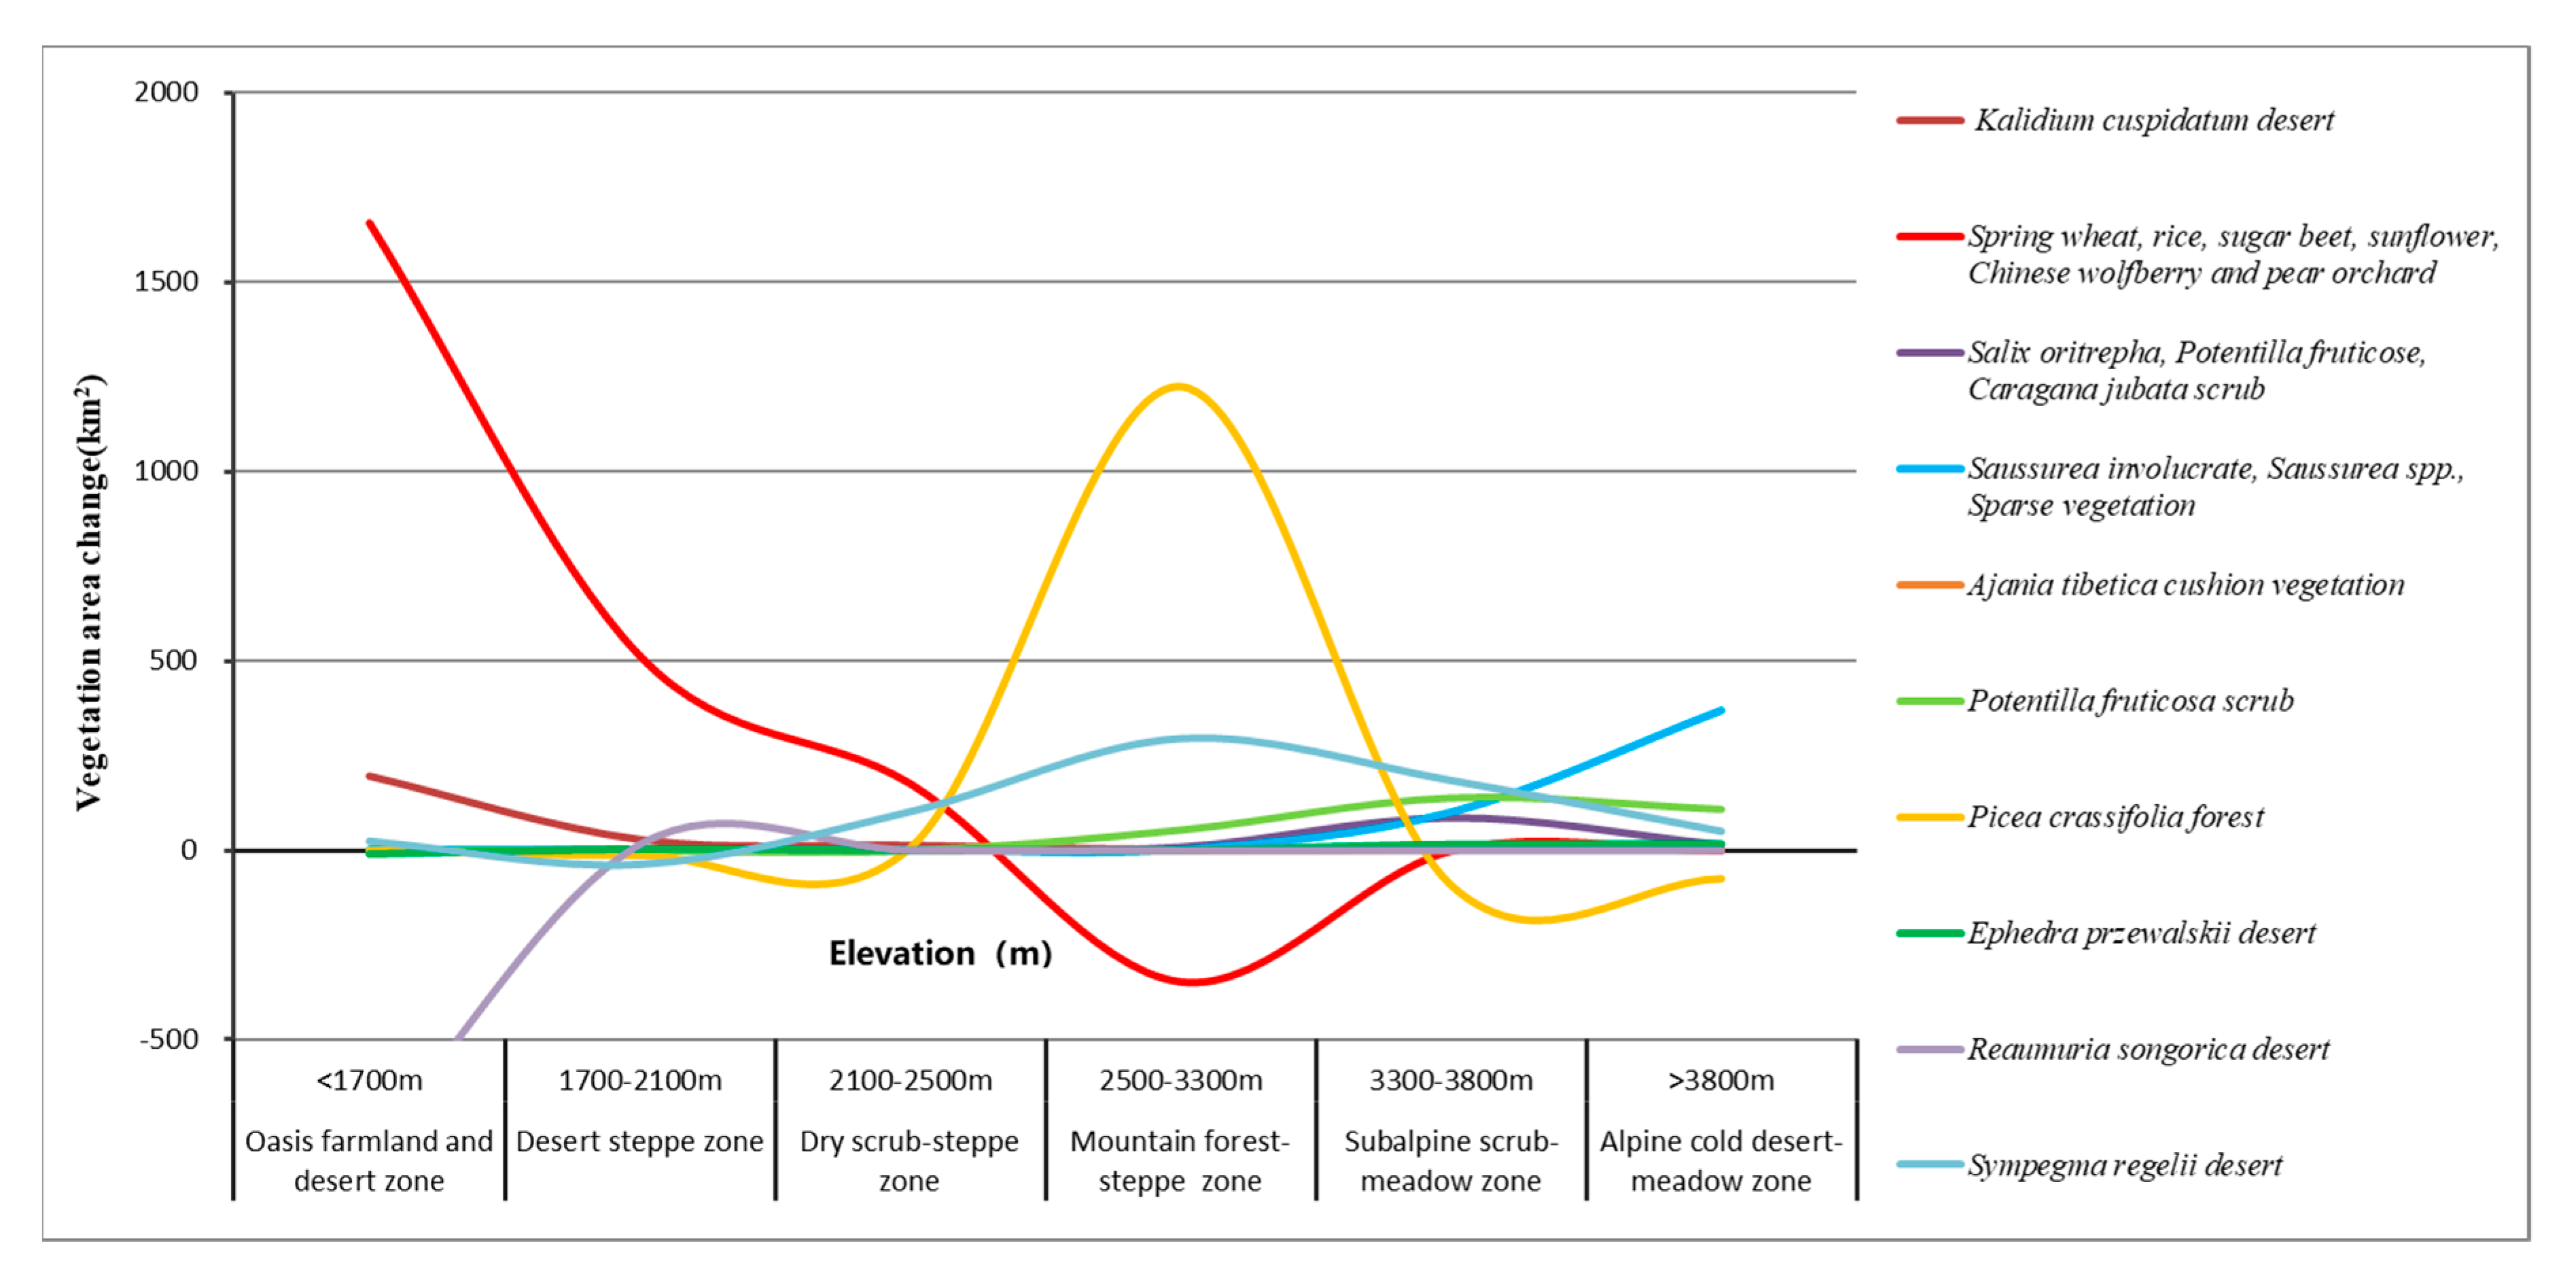
3.3. Dynamic Changes of Typical Plant Species in the Different Elevation Zones

In order to better analyze the change trend of vegetation distributed in the different elevation zones of Heihe River Basin, this study selected 10 typical plant species that covered at least two elevation zones or more. The changed areas of 10 typical plant species were calculated in the six elevation zones between the 1980s and the 2010s (Figure 5).
The cultivated vegetation (spring wheat, rice, sugar beet, sunflower, Chinese wolfberry, and pear orchard) had the largest increased area in the oasis farmland desert zone, desert steppe zone, and dry scrub-steppe zone, accounting for 552.58, 171.58, and 59.17 km2 per decade, respectively. The increased area of Picea crassifolia forest was the largest in the mountain forest-steppe zone, which was increased by 407.42 km2 per decade. The Sympegma regelii desert had the largest increased area in the subalpine scrub-meadow zone, which was increased by for 61.17 km2 per decade. The Saussurea involucrate, Saussurea spp., and sparse vegetation was increased by 122.75 km2 per decade, being more than in the other elevation zones.
The Reaumuria songorica desert had the biggest decreased area in the oasis farmland and desert zone, which was reduced by 264.83 km2 per decade. The decreased area of Sympegma regelii desert was the largest in the desert steppe zone, which was reduced by 13.00 km2 per decade. All 10 typical plant species showed an increasing trend in the dry scrub-steppe zone. The cultivated vegetation (spring wheat, rice, sugar beet, sunflower, Chinese wolfberry, and pear orchard) in the mountain forest-steppe zone had largest decrease area, which was up to 115.33 km2 per decade. The Picea crassifolia forest had the biggest decreased area in the subalpine scrub-meadow zone and alpine cold desert-meadow zone, which were reduced by 30.25 and 24.58 km2 per decade, respectively.

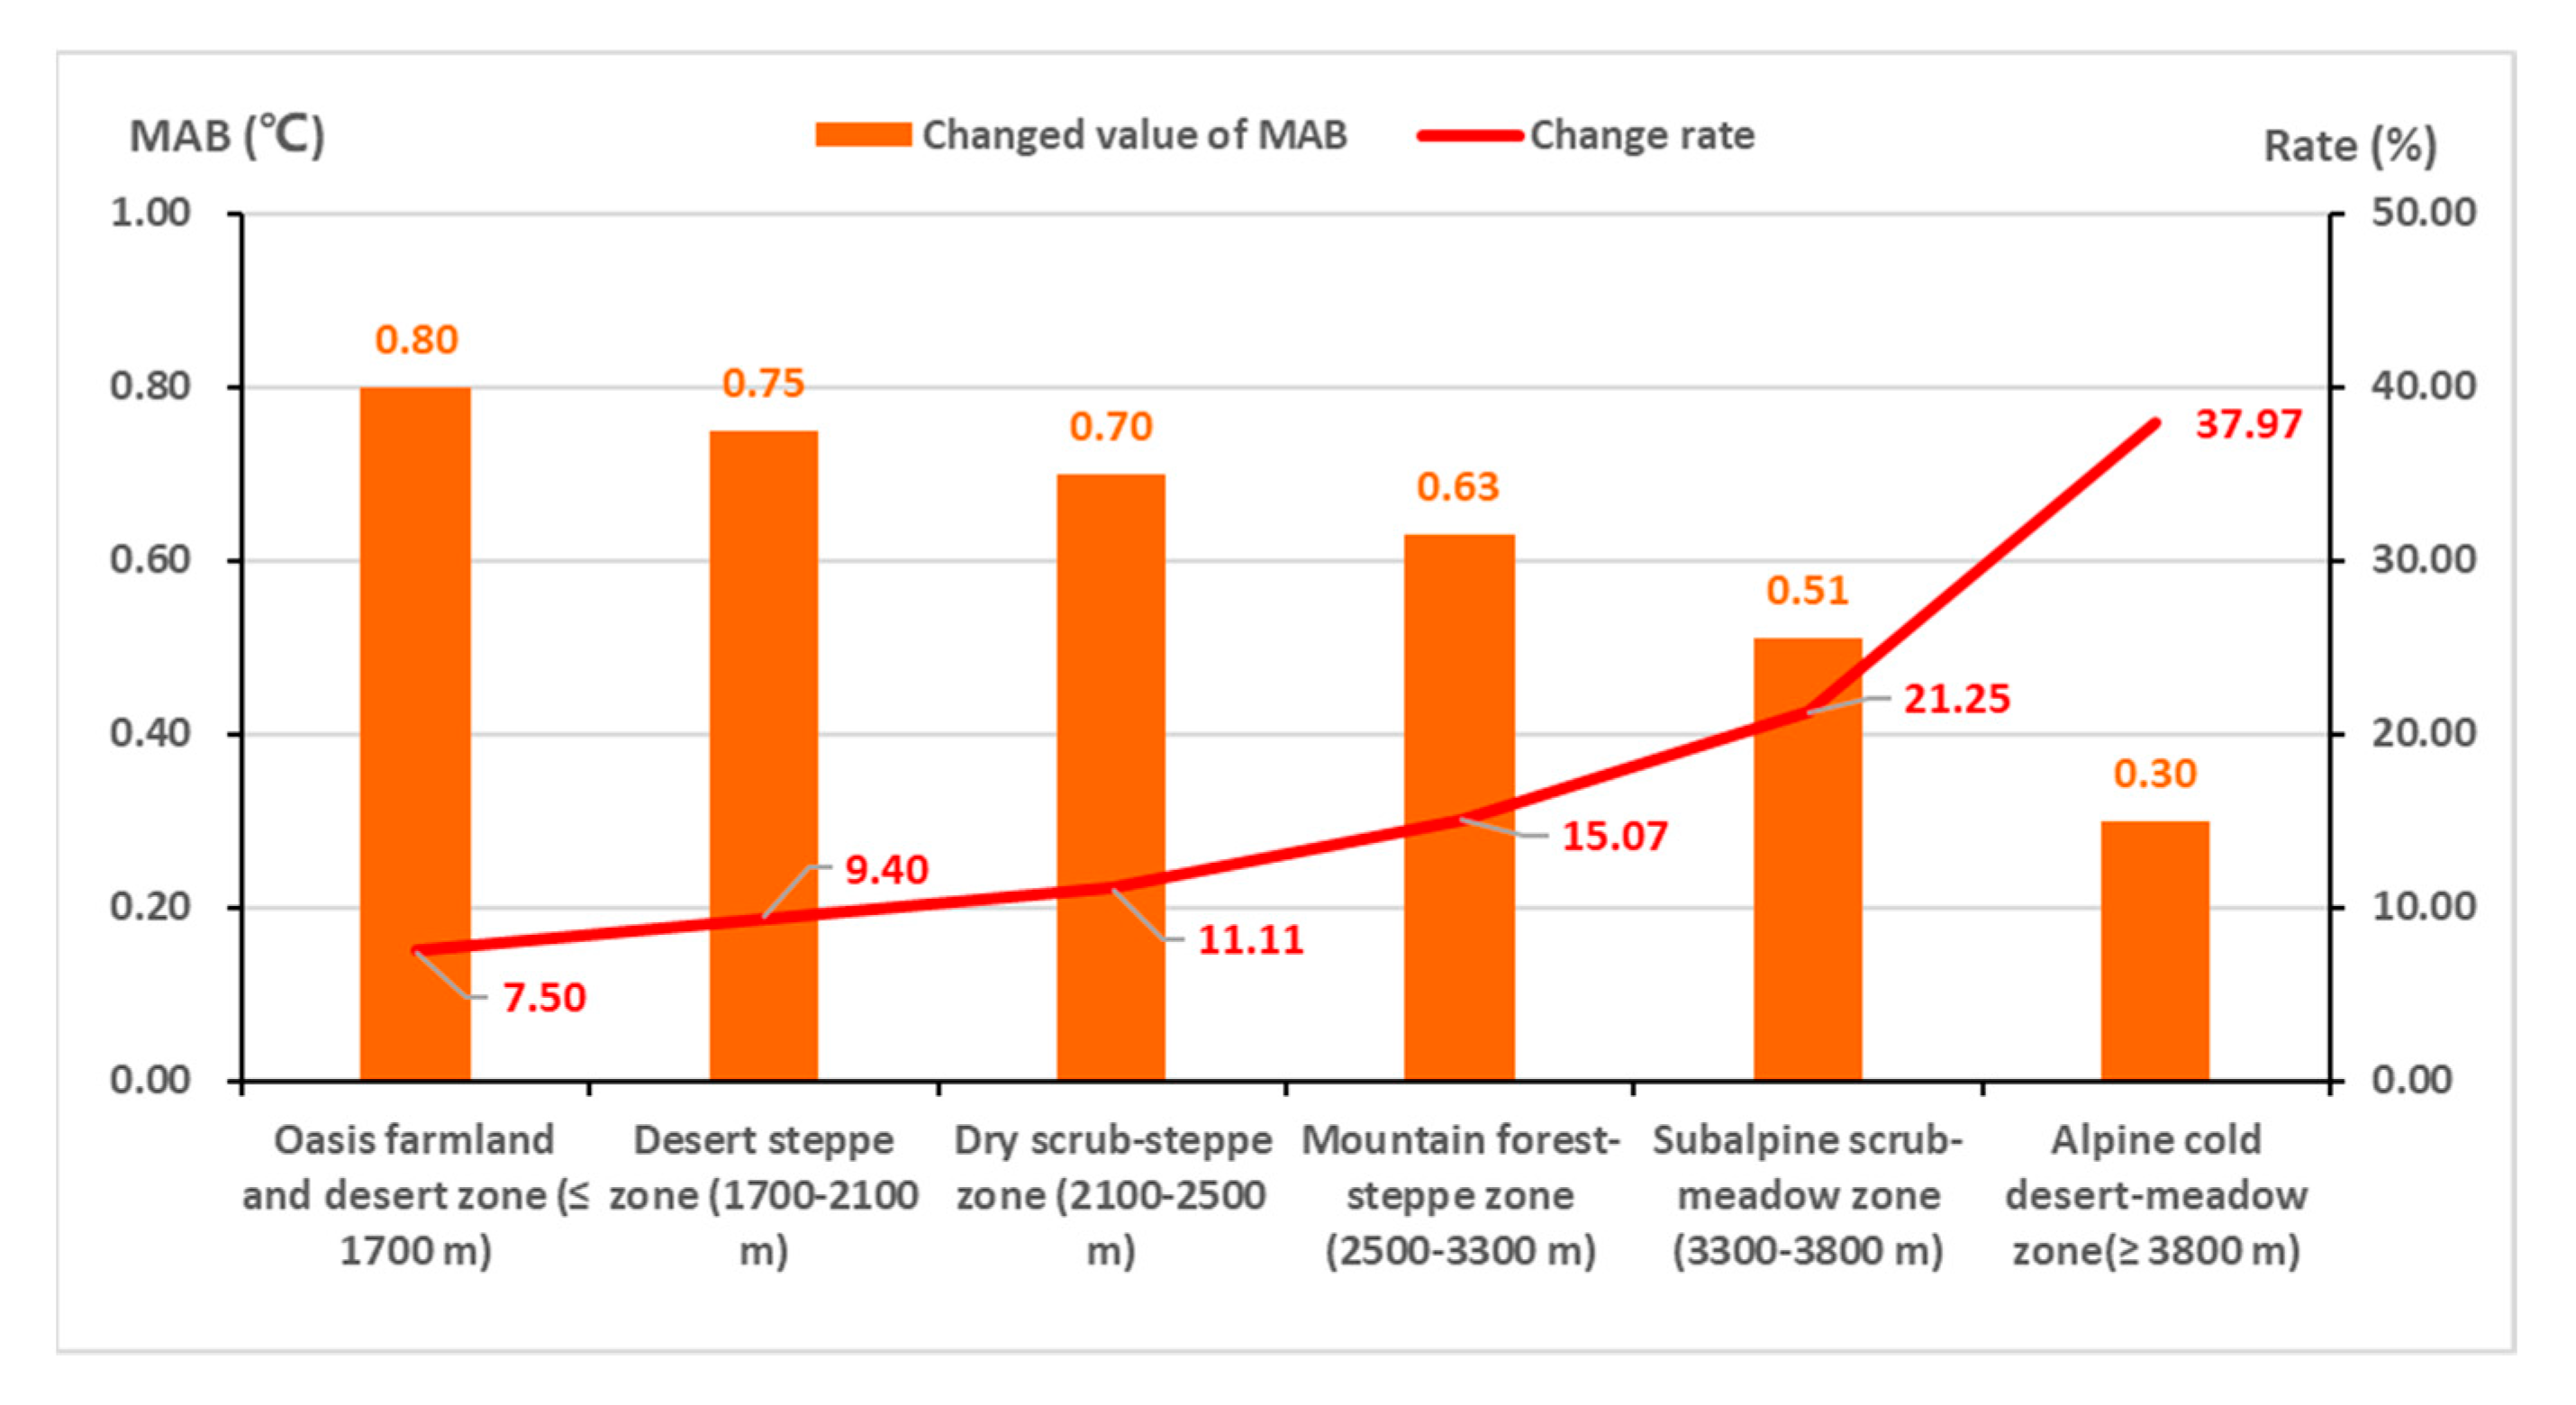
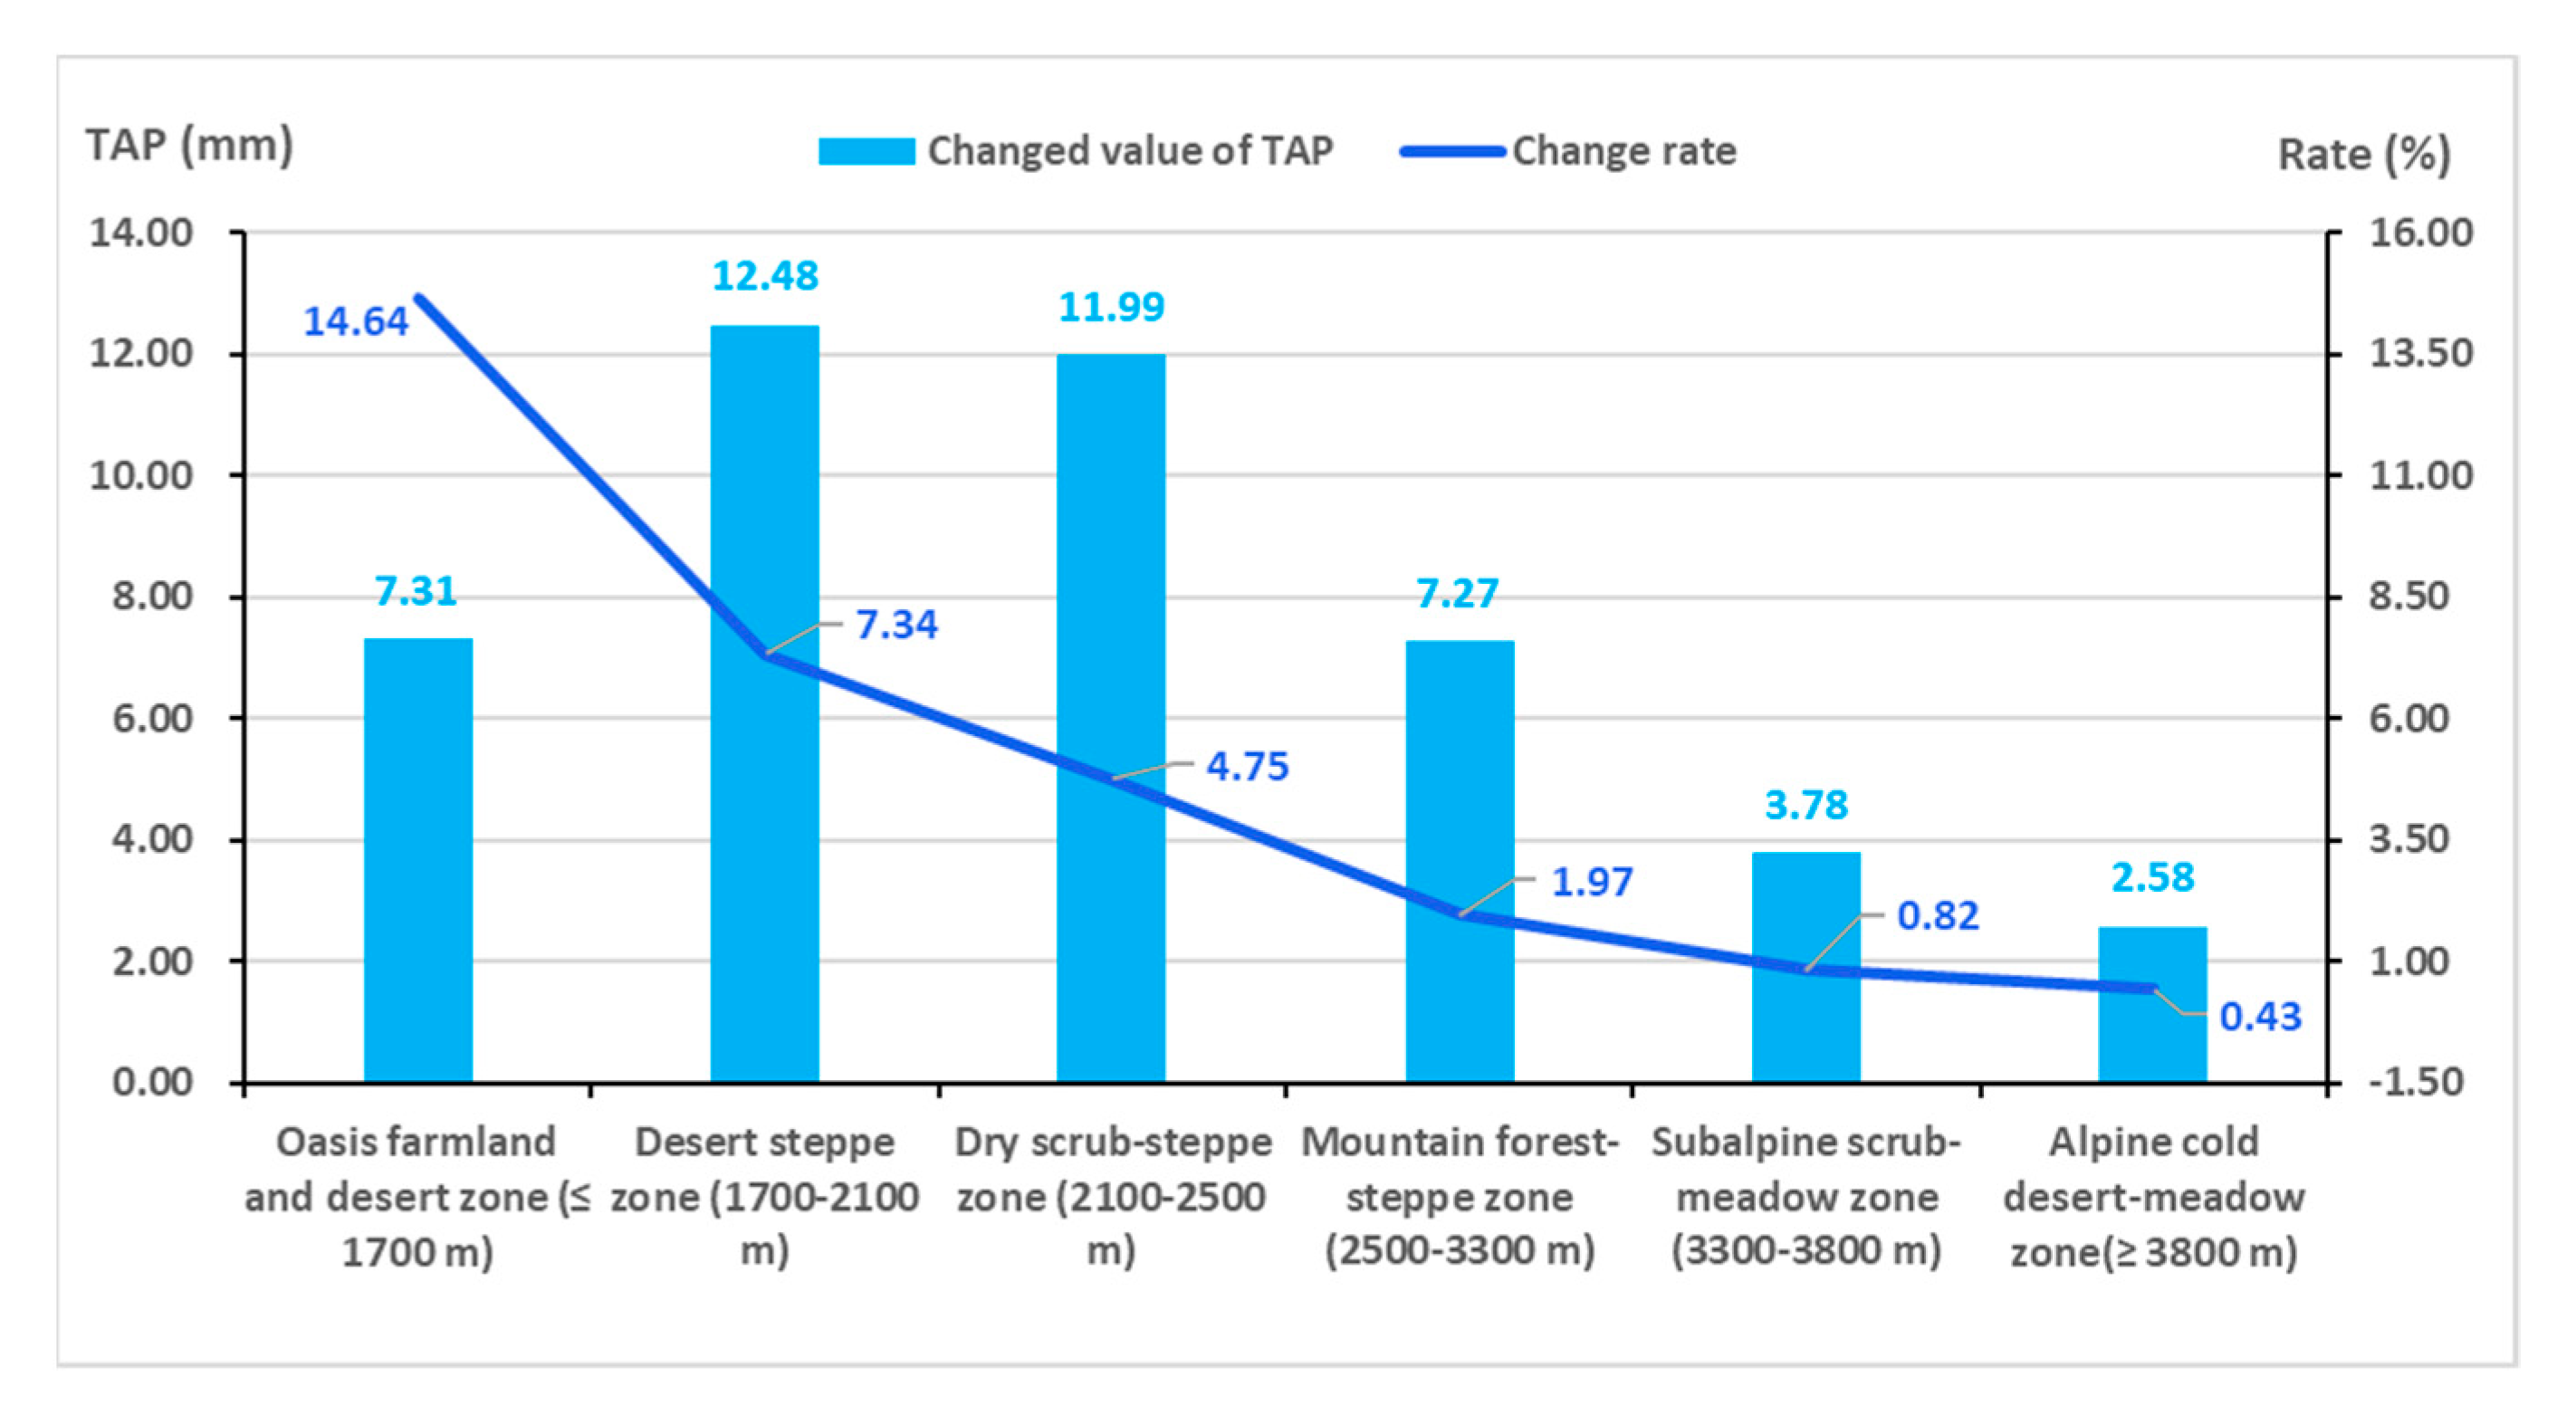
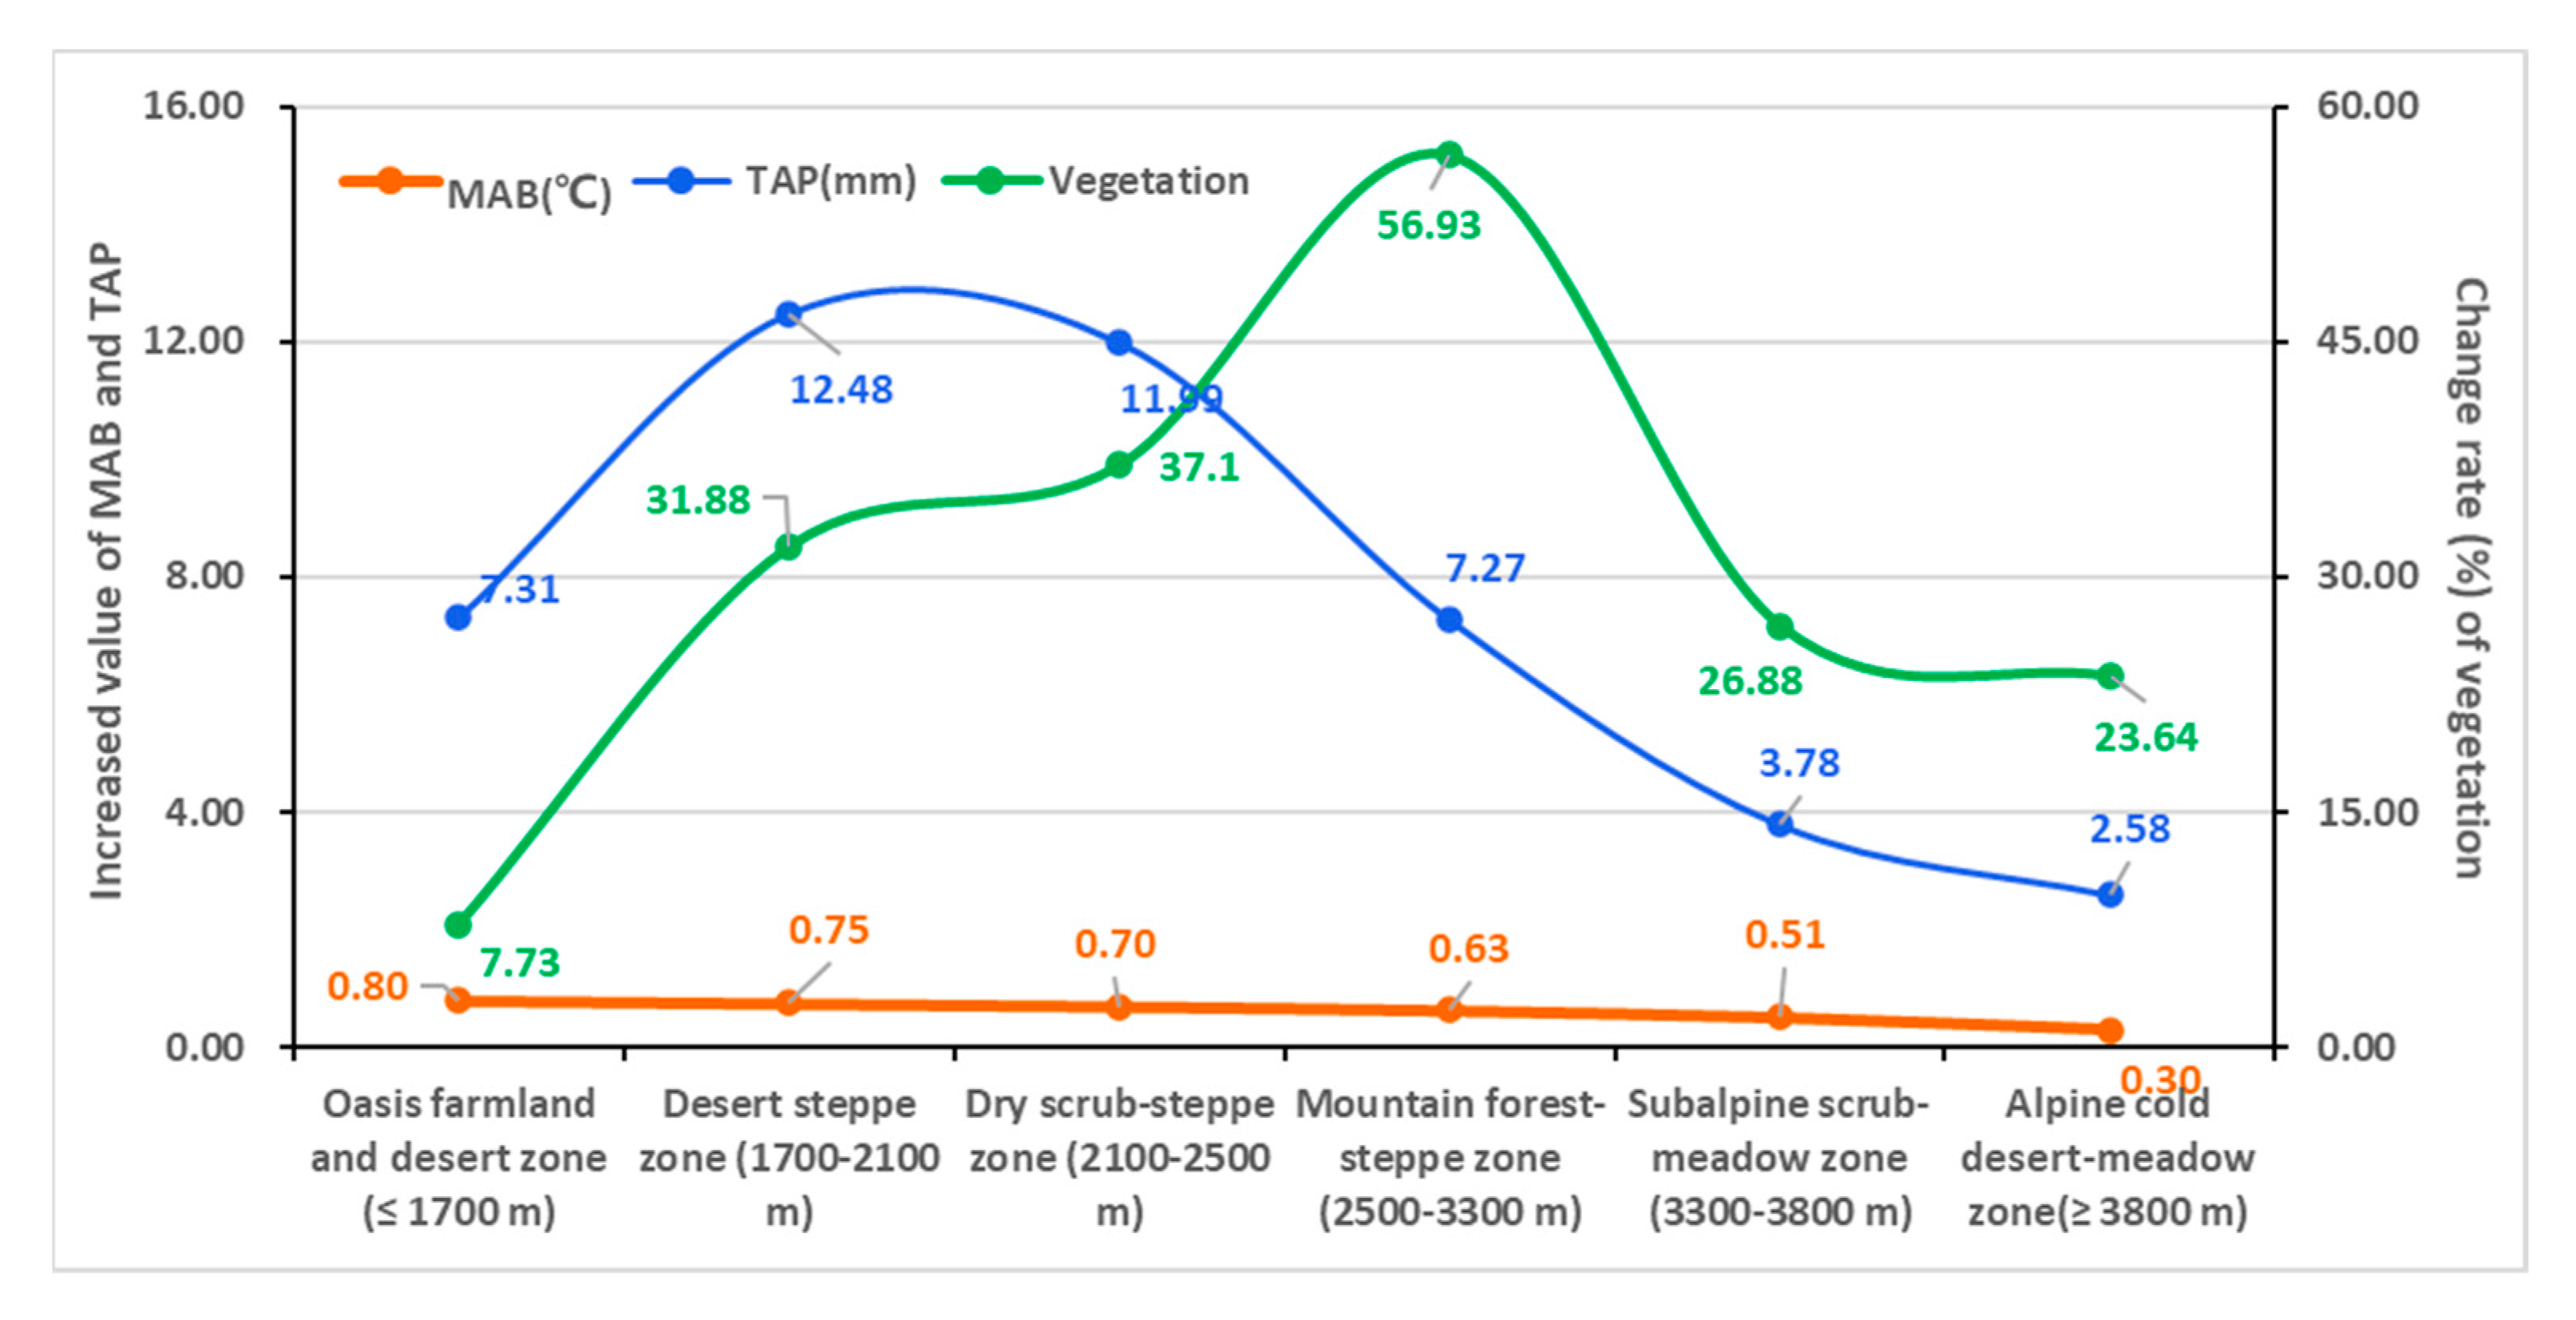
3.4. Change Trends of Climate in the Differrent Elevation Zones

The calculated results of climate elements in the different elevation zones of Heihe River Basin from the 1980s to the 2010s showed that MAB and TAP both presented a significant increasing trend in the whole area, which were increased by 0.62 °C and 7.57 mm, respectively, between the 1980s and the 2010s. In general, the value of increased MAB was reduced with the elevation increase, while its increased rate was increased gradually with elevation increase (Figure 6). The value and rate of increased TAP were reduced gradually with the elevation rise (Figure 7). In detail, MAB of the oasis farmland and desert zone had the largest increase value (0.80 °C) but showed the least increase rate (7.50%). MAB of the alpine desert-meadow zone had the smallest increased value (0.30 °C), while its increased rate (37.97%) was the fastest. TAP had the largest increase value (12.48 mm) in the desert steppe zone, and the least increase value (2.58 mm) in the alpine cold desert-meadow zone. The change rate of TAP was the highest in the oasis farmland and desert zone, and the least in the alpine cold desert-meadow zone, in which TAP was increased by 4.88% and 0.14% per decade, respectively, between the 1980s and the 2010s.

4. Discussion

The dynamic change of vegetation was generally at a high level in the Heihe River Basin between the 1980s and the 2010s. According to the change trends of vegetation in different elevation zones, the change rate of vegetation in the low and middle elevation zones was generally higher than that in the high-cold zone, which indicates that human activities could be considered a key role to vegetation change during the period from the 1980s to the 2010s because the range of human activities are mainly concentrated in the low and middle elevation zones, and it is difficult up to the high-cold zone [14,20,41].
According to the dynamic changes of typical plant species in the different elevation zones, this study found that the changed areas of cultivated vegetation (spring wheat, rice, sugar beet, sunflower, Chinese wolfberry, and pear orchard) and Picea crassifolia forest were larger than that of other typical plant species, which covered 60.71% of the total changed area of 10 typical plant species in Heihe River Basin between the 1980s and the 2010s. They also indicate the human activities that were the major driving force of vegetation change in Heihe River Basin during the period from the 1980s to the 2010s [41].
In addition, in order to clearly explicate the response of vegetation change to climate, the changes of vegetation, MAB, and TAP were individually calculated in the different elevation zones of Heihe River Basin between the 1980s and the 2010s (Figure 8). There was a positive relationship between the change rate of vegetation and the increased value of TAP, which kept a positive increasing trend from the oasis farmland and desert zone to the dry scrub-steppe zone, but where the increased value of MAB was gradually reduced. These could be used to understand how the sensitivities of vegetation changes to TAP are higher than that to MAB in the low and middle elevation zones of Heihe River Basin [42]. The largest change intensity of vegetation appeared in the mountain forest-steppe zone, but where all the change intensities of MAB and TAP were not the highest between the 1980s and the 2010s. This phenomenon is mainly caused by the projects of returning farmland to forest and grassland, as well as closing mountains for afforestation and grassland [43]. The change rate of vegetation and the increase value of MAB and TAP had a similar decreasing trend from the mountain forest-steppe zone to the alpine cold desert-meadow zone during the period from the 1980s to the 2010s, which further indicates that the influence of human activities on vegetation change in the lower and middle elevation zones was greater than that in the high-cold zone of Heihe River Basin between the 1980s and the 2010s [8,14,44].

5. Conclusions

The analyzed results show that the change intensity of vegetation distributed in the low and middle elevation zones was generally higher than that in the high-elevation zones of Heihe River Basin between the 1980s and the 2010s. The vegetation changes are mainly affected by climate change in the high-cold zone, and the higher the elevation, the smaller the impact from human activities. For example, with the MAB increase, the permanent glaciers, perennial snow, and sparse vegetation were decreased in the high-elevation zones. MAB and TAP were clearly increased value, but showed a decreasing trend with the elevation increasing in Heihe River Basin. Change intensity of MAB increased with the increase of elevation, while that of TAP was the opposite. The cultivated vegetation clearly increased in the oasis farmland and desert zone and decreased in the mountain forest-steppe zone, which means the impacts of human activity to vegetation change was more than that of climate in the low and middle elevation zones of Heihe River Basin during the period from the 1980s to the 2010s.

Funding

This research was funded by the National Key R&D Program of China (2017YFA0603702 and 2018YFC0507202), National Natural Science Foundation (41971358 and 41930647), the Strategic Priority Research Program (A) of the Chinese Academy of Sciences (XDA20030203), and the Innovation Project of State Key Laboratory of Resources and Environmental Information System (O88RA600YA).

Data Availability Statement

The vegetation data in 1980s was downloaded from the Science Data Center for Cold and Arid Regions (http://sdb.casnw.net/portal, accessed on 28 October 2021), The Shuttle Radar Topography Mission (SRTM) data was downloaded at the website of http://srtm.csi.cgiar.org, accessed on 28 October 2021.

Conflicts of Interest

The author declare no conflict of interest.

References

  1. Quinn, J.F.; Dunham, A.E. On hypothesis testing in ecology and evolution. Am. Nat. 1983, 122, 602–617. [Google Scholar] [CrossRef]
  2. Legendre, P.; Fortin, M.J. Spatial pattern and ecological analysis. Vegetation 1989, 80, 107–138. [Google Scholar] [CrossRef]
  3. Borcard, D.; Legendre, P.; Drapeau, P. Partialling out the spatial component of ecological variation. Ecology 1992, 73, 1045–1055. [Google Scholar] [CrossRef] [Green Version]
  4. Parmesan, C.; Yohe, G. A globally coherent fingerprint of climate change impacts across natural systems. Nature 2003, 421, 37–42. [Google Scholar] [CrossRef]
  5. Loarie, S.R.; Duffy, P.B.; Hamilton, H.; Asner, G.P.; Field, C.B.; Ackerly, D.D. The velocity of climate change. Nature 2009, 462, 1052–1055. [Google Scholar] [CrossRef]
  6. Chmura, D.J.; Anderson, P.D.; Howe, G.T.; Harrington, C.A.; Halofsky, J.E.; Peterson, D.L.; Shaw, D.C.; Brad StClair, J. Forest responses to climate change in the northwestern United States: Ecophysiological foundations for adaptive management. For. Ecol. Manag. 2011, 261, 1121–1142. [Google Scholar] [CrossRef]
  7. He, M.Z.; Zheng, J.G.; Li, X.R.; Qian, Y.L. Environmental factors affecting vegetation composition in the Alxa Plateau, China. J. Arid Environ. 2007, 69, 473–489. [Google Scholar] [CrossRef]
  8. Zhang, X.L.; Guan, T.Y.; Zhou, J.H.; Cai, W.T.; Gao, N.N.; Du, H.; Jiang, L.H.; Lai, L.M.; Zheng, Y.R. Groundwater depth and soil properties are associated with variation in vegetation of a Desert Riparian ecosystem in an Arid Area of China. Forests 2018, 9, 34. [Google Scholar] [CrossRef] [Green Version]
  9. Guisan, A.; Zimmermann, N.E. Predictive habitat distribution models in ecology. Ecol. Model. 2000, 135, 147–186. [Google Scholar] [CrossRef]
  10. Dorothy, P. Sensitivity and rapidity of vegetational response to abrupt climate change. Proc. Natl. Acad. Sci. USA 2000, 97, 1359–1361. [Google Scholar]
  11. Dobson, A.P.; Bradshaw, A.D.; Baker, A.J.M. Hopes for the future: Restoration ecology and conservation biology. Science 1997, 277, 515–522. [Google Scholar] [CrossRef]
  12. Emanuel, W.R.; Shugart, H.H.; Stevenson, M.P. Climatic change and the broad-scale distribution of terrestrial ecosystem complexes. Clim. Chang. 1985, 7, 29–43. [Google Scholar] [CrossRef]
  13. Leemans, R.; Eickhout, B. Another reason for concern: Regional and global impacts on ecosystems for different levels of climate change. Glob. Environ. Chang. 2004, 14, 219–228. [Google Scholar] [CrossRef]
  14. Zhou, X.; Fan, Z.M.; Yue, T.X. Simulation of vegetation distribution in Heihe River Basin based on SVM. J. Geo. Inf. Sci. 2017, 19, 493–501. [Google Scholar]
  15. Dolezal, J.; Dvorsky, M.; Kopecky, M. Vegetation dynamics at the upper elevational limit of vascular plants in Himalaya. Sci. Rep. 2016, 6, 24881. [Google Scholar] [CrossRef] [PubMed] [Green Version]
  16. Wuyts, B.; Champneys, A.R.; House, J.I. Amazonian forest-savanna biostability and human impact. Nat. Commun. 2017, 8, 15519. [Google Scholar] [CrossRef] [Green Version]
  17. Fan, Z.; Zhang, X.; Li, J.; Yue, T.; Liu, J.; Xiang, B.; Kuang, W. Land-cover changes of national nature reserves in China. J. Geogr. Sci. 2013, 23, 258–270. [Google Scholar] [CrossRef]
  18. Fan, Z.M.; Li, J.; Yue, T.X. Land-cover changes of biome transition zones in Loess Plateau of China. Ecol. Model. 2013, 252, 129–140. [Google Scholar] [CrossRef]
  19. He, Z.B.; Zhao, W.Z. Characterizing the spatial structures of riparian plant communities in the lower reaches of the Heihe River in China using geostatistical techniques. Ecol. Res. 2006, 21, 551–559. [Google Scholar] [CrossRef]
  20. Yuan, L.H.; Chen, X.Q.; Wang, X.Y.; Xiong, Z.; Song, C.Q. Spatial associations between NDVI and environmental factors in the Heihe River Basin. J. Geogr. Sci. 2019, 29, 1548–1564. [Google Scholar] [CrossRef] [Green Version]
  21. Jiang, X.H.; Liu, C.M. The influence of water regulation on vegetation in the lower Heihe River. J. Geogr. Sci. 2010, 20, 701–711. [Google Scholar] [CrossRef]
  22. Wang, X.F.; Ma, M.G.; Huang, G.H.; Veroustraete, F.; Zhang, Z.H.; Song, Y.; Tan, J.L. Vegetation primary production estimation at maize and alpine meadow over the Heihe River Basin, China. Int. J. Appl. Earth Obs. Geoinf. 2012, 17, 94–101. [Google Scholar] [CrossRef]
  23. Pauli, H.; Gottfried, M.; Dullinger, S.; Abdaladze, O.; Akhalkatsi, M.; Alonso, J.L.B.; Coldea, G.; Dick, J.; Erschbamer, B.; Calzado, R.F.; et al. Recent plant diversity changes on Europe’s mountain summits. Science 2012, 336, 353–355. [Google Scholar] [CrossRef] [Green Version]
  24. Fan, Z.M.; Li, S.B.; Fang, H.Y. Explicitly identifying the desertification change in CMREC area based on multisource remote data. Remote Sens. 2020, 12, 3170. [Google Scholar] [CrossRef]
  25. Adger, W.N.; Brown, K. Land Use and the Causes of Global Warming; John Wiley: New York, NY, USA, 1994. [Google Scholar]
  26. Smith, T.B.; Wayne, R.K.; Girman, D.J.; Bruford, M.W. A role for ecotones in generating rainforest biodiversity. Science 1997, 276, 1855–1857. [Google Scholar] [CrossRef]
  27. Mayle, F.E.; Burbridge, R.; Killeen, T.J. Millennial-scale dynamics of southern amazonian rain forests. Science 2000, 290, 2291–2294. [Google Scholar] [CrossRef] [Green Version]
  28. Chapin, F.S., III; Zavaleta, E.S.; Eviner, V.T.; Naylor, R.L.; Vitousek, P.M.; Reynolds, H.L.; Hooper, D.U.; Lavorel, S.; Sala, O.E.; Hobbie, S.E.; et al. Consequences of changing biodiversity. Nature 2000, 405, 234–242. [Google Scholar] [CrossRef] [PubMed]
  29. Marshall, C.J.; Liebherr, J.K. Cladistic biogeography of the Mexican transition zone. J. Biogeogr. 2000, 27, 203–216. [Google Scholar] [CrossRef]
  30. Loehle, C. Disequilibrium and relaxation times for species responses to climate change. Ecol. Model. 2018, 384, 23–29. [Google Scholar] [CrossRef]
  31. Yue, T.X.; Liu, Y.; Zhao, M.W.; Du, Z.P.; Zhao, N. A fundamental theorem of Earth’s surface modelling. Environ. Earth Sci. 2016, 75, 751. [Google Scholar] [CrossRef]
  32. Yue, T.X. Surface Modelling: High Accuracy and High Speed Methods; CRC Press: New York, NY, USA, 2011. [Google Scholar]
  33. Yue, T.X.; Zhao, N.; Ramsey, R.D.; Wang, C.L.; Fan, Z.M.; Chen, C.F.; Lu, Y.M.; Li, B.L. Climate change trend in China, with improved accuracy. Clim. Chang. 2013, 120, 137–151. [Google Scholar] [CrossRef]
  34. Yue, T.X.; Zhao, N.; Liu, Y.; Wang, Y.F.; Zhang, B.; Du, Z.P.; Fan, Z.M.; Shi, W.J.; Chen, C.F.; Zhao, M.W.; et al. A fundamental theorem for eco-environmental surface modelling and its applications. Sci. China Earth Sci. 2020, 63, 1092–1112. [Google Scholar] [CrossRef]
  35. Fan, Z.M.; Bai, X.Y. Scenarios of potential vegetation distribution in the different gradient zones of Qinghai-Tibet Plateau under future climate change. Sci. Total Environ. 2021, 796, 148918. [Google Scholar] [CrossRef]
  36. Zhou, S.; Yu, B.F.; Zhang, Y.; Huang, Y.F.; Wang, G.Q. Water use efficiency and evapotranspiration partitioning for three typical ecosystems in the Heihe River Basin, northwestern China. Agric. For. Meteorol. 2018, 253, 261–273. [Google Scholar] [CrossRef]
  37. Fan, Z.M.; Fan, B. Shifts of the mean center of potential vegetation ecosystems under future climate change in Eurasia. Forests 2019, 10, 873. [Google Scholar] [CrossRef] [Green Version]
  38. Fan, Z.M.; Bai, R.Y.; Yue, T.X. Spatio-temporal distribution of vascular plant species abundance on Qinghai-Tibet Plateau. J. Geogr. Sci. 2019, 29, 1625–1636. [Google Scholar] [CrossRef]
  39. Gao, X.; Huang, X.X.; Lo, K.; Dang, Q.W.; Wen, R.Y. Vegetation responses to climate change in the Qilian Mountain Nature Reserve, Northwest China. Glob. Ecol. Conserv. 2021, 28, e01698. [Google Scholar] [CrossRef]
  40. Shen, Q.; Ma, Y. Did water diversion projects lead to sustainable ecological restoration in arid endorheic basins? Lessons from long-term changes of multiple ecosystem indicators in the lower Heihe River Basin. Sci. Total Environ. 2020, 701, 134785. [Google Scholar] [CrossRef]
  41. Fan, Z.M.; Fan, B.; Yue, T.X. Terrestrial ecosystem scenarios and their response to climate change in Eurasia. Sci. China Earth Sci. 2019, 62, 1607–1618. [Google Scholar] [CrossRef]
  42. Fan, Z.M. Response analysis of gradient distribution of vegetation to climate change in Heihe River Basin. Acta Ecol. Sin. 2021, 41, 4066–4076. [Google Scholar]
  43. Williams, A.P.; Allen, C.D.; Millar, C.I.; Swetnam, T.W.; Michaelsen, J.; Still, C.J.; Leavitt, S.W. Forest responses to increasing aridity and warmth in the southwestern United States. Proc. Natl. Acad. Sci. USA 2010, 107, 21289–21294. [Google Scholar] [CrossRef] [PubMed] [Green Version]
  44. Wu, F.; Zhan, J.Y.; Chen, J.C.; He, C.; Zhang, Q. Water yield variation due to forestry change in the head-water area of Heihe River Basin, Northwest China. Adv. Meteorol. 2015, 786764, 786764. [Google Scholar] [CrossRef]
Figure 1. Field samples, DEM, and boundary of Heihe River Basin.
Forests 12 01496 g001
Figure 2. Spatial distribution of vegetation in Heihe River Basin in the 1980s and 2010s.
Forests 12 01496 g002
Figure 3. Vegetation change in Heihe River Basin between the 1980s and the 2010s.
Forests 12 01496 g003
Figure 4. Change trends of vegetation distributed in the different elevation zones between the 1980s and the 2010s.
Forests 12 01496 g004
Figure 5. Surface area change of 10 typical plant species with respect to elevation.
Forests 12 01496 g005
Figure 6. Change trends of MAB in the different elevation zones.
Forests 12 01496 g006
Figure 7. Change trends of TAP in the different elevation zones.
Forests 12 01496 g007
Figure 8. Change trends of vegetation, MAB, and TAP in the different zones.
Forests 12 01496 g008
Publisher’s Note: MDPI stays neutral with regard to jurisdictional claims in published maps and institutional affiliations.

