Article

Experimental Investigations and Numerical Simulations of the Vibrational Performance of Wood Truss Joist Floors with Strongbacks

1
Faculty of Architecture, Civil and Transportation Engineering, Beijing University of Technology, Beijing 100124, China
2
Research Institute of Wood Industry, Chinese Academy of Forestry, Beijing 100091, China
3
National Engineering Research Center of Wood Industry, Beijing 102300, China
4
China State Railway Group Co., Ltd., Beijing 100844, China
5
School of Technology, Beijing Forestry University, Beijing 100083, China
*
Author to whom correspondence should be addressed.
Forests 2021, 12(11), 1493; https://doi.org/10.3390/f12111493
Submission received: 21 August 2021 / Revised: 25 October 2021 / Accepted: 26 October 2021 / Published: 29 October 2021
(This article belongs to the Special Issue Application of Wood in Construction)

Abstract

:
This paper provides an experimental study and computer modeling analysis of vibration performance of full-scale wood truss joist floors, related to the static deflection and vibration mode/frequency and single-person-induced vibration. The vibration behavior of full-scale truss joist floors was investigated and the influences of the strongbacks on the vibration behavior were assessed. The results showed that the simulated predictions agreed well with the measured results. Strongbacks do not significantly affect the fundamental frequency of the truss joist floors but influence the second and third modal frequencies. The use of strongback rows at mid-span effectively decreased the maximum deformation of point loading at floor center. The effect of adding strongbacks at one-third of each span on decreasing maximum deformation at the floor center was minimal. The case of walking parallel to the joist produced higher acceleration response at the floor center than that of walking perpendicular to the joist. The closer the placements of strongbacks were to the mid-span, the more significant reduction of the vibration at floor center was. Two strongback rows at mid-span performed the best effect on reduction of vibration response at floor center. However, the use of strongbacks had limits of reduction peak acceleration of the sheathing between the joists. The study provides a valuable guide for future vibration serviceability study and design optimization of wood truss joist floors.

1. Introduction

Wood truss joist floors are a new generation of lightweight timber floor systems and are increasingly being used for intermediate-span timber floors in low-rise timber residences. The floor system is beneficial to access for service pipes and electrical cables and ensure quality control of wood and reach a large span. It also provides more freedom of design and optimization for the timber floors. The timber floor systems consist of several parallel wood truss joists that support wood subflooring or sheathing. The web members and flange members of the joists are connected using metal plates. The sheathing panels are connected to the top flanges of the joists by fasteners. The rim boards are attached to the ends of the joists. Typical spacing for truss joists is 400 to 600 mm. Strongbacks often run perpendicular to the joists and are connected to vertical web members as braces to transfer the load to the adjacent joist, as shown in Figure 1.
In the past decades, numerous experimental works have been performed to investigate the static and dynamic response of various types of timber floors. In the early years, Ohlsson [1] studied the dynamic behaviors of twelve wood I-joist floors and recommended three design requirements, including a fundamental frequency higher than 8 Hz and the limitation of 1.5 mm for point load deflection and the response of or impulse velocity. These criteria were adopted in the Euro code 5 Part 1-1 [2] to ensure the vibration performance of lightweight timber floors. Smith and Chui [3,4] investigated the vibration behaviors of solid lumber joist floors and proposed the limitation less than 0.45 m/s2 for the root-mean-square acceleration and suggested the fundamental frequency should exceed 8 Hz. Khokhar [5] investigated the impact of bridging (lateral element) between the joists on the vibration performance of solid lumber joists floors. The vibration performance of wood I-joist floors was investigated by Weckendorf [6] and Weckendorf et al. [7]. Meanwhile, traditional and recent design methods to minimize timber floor vibrations were summarized by the authors. Zhang [8] and Zhang et al. [9,10,11] studied the vibration performance related to serviceability of solid timber joists, I-joists, and open metal-web joist floors system and assessed the influence of the space of the adjacent joists, sheathing and strongbacks on vibration performance. Jarnero and Jarnero et al. [12,13] studied the effects of the addition of subflooring layers and boundary conditions on vibration performance of the wood floor in a laboratory. The effects of detailed structure construction including a gypsum ceiling, battens, blocking, furring channels, and post-tensioning on the vibration performance of lightweight engineered timber floors were revealed by Bernard [14]. Recently, some studies have been focused on mass timber floor systems for long-span floor structure, such as cross-laminated timber (CLT) floors [15,16], timber–concrete composite (TCC) floors [17,18,19,20], a combination of ribs and thick panels composing a composite section [21], and so on.
In a numerical study, the simulations of joint connections play a critical role on the mechanical performance prediction of the timber floors. For wood I-joist floors, nails or screws are used to connect the sheathing and lumber joists. The common practice of nailed connection in numerical method is using spring elements to quantify the corresponding stiffness by load–slip tests. Hu [22] simulated the vibrational response of wood I-joist floors while considering rotary inertia and shear deformation of ribbed plates. Eriksson [23] developed time domain load functions including a model for a randomly walking pedestrian group and a model for a single randomly walking pedestrian. Weckendorf et al. [24] also only modeled the modal frequencies and mode shapes, and static deflection under point loading of wood I-joist floors. Glisovic et al. [25] numerically studied the parameter effect on the vibrational performance of a solid lumber joist floor system without verification of the test results. However, for wood truss joist floors, the connections are complex with nailed connections for sheathing to the joist and metal plate connections for wood truss. For each wood truss joist, different dimensions of metal plates and various joint types connected to multi-member with different angles lead into difficulty of stiffness determination of each metal plate connection. It is also impossible to quantify the behavior of the connection between each web member and the chord member with different angles in three directions in a wood truss floor system, due complex computation. Thus, to find an appropriate simulation method of metal plate connections is the key challenge of numerical study of wood truss joist floors at present.
In general, present research on the vibration performance of wood truss joist floors has rarely been reported in the literature. And the vibration mechanics of wood truss joist floors related to the vibration serviceability are not clear. Vibration testing combining with computer analysis of the floor system can provide higher accuracy estimations of the floor dynamic properties. In previous research, the authors [26] proposed three modeling approaches for the connections of the wood truss joist floor, and revealed the modeling method considering the flexible characteristics of metal plate connections and sheathing-to-joist connections perform best in the terms of predicting the vibration performance of the floor. In this paper, the numerical method for the connections considering the flexible characteristics is applied based on the finite software ANSYS Mechanical APDL 19.0 (ANSYS Inc., Canonsburg, PA, USA). The elastic stiffness of metal plate connection is assumed to be the same and determined by numerical calibrating the experimental deflection results of single wood truss. Meanwhile, the elastic stiffness of sheathing-to-joist connections was obtained by load–slip test. The paper further provides an experimental study and extensive computer modeling analysis of vibration performance of a series of full-scale wood truss joist floors with different strongbacks, related to the static deflection and vibration mode/frequency and human-induced vibration under single-person loading. The numerical modeled results were validated using data from a series of experimental floors tests with and without strongbacks. This main purpose is to understand the vibration behavior of truss joist floor system, and assess and optimize the effectiveness of strongbacks on the floors. This research provides reference for future vibration serviceability study and design optimization of wood truss joist floors.

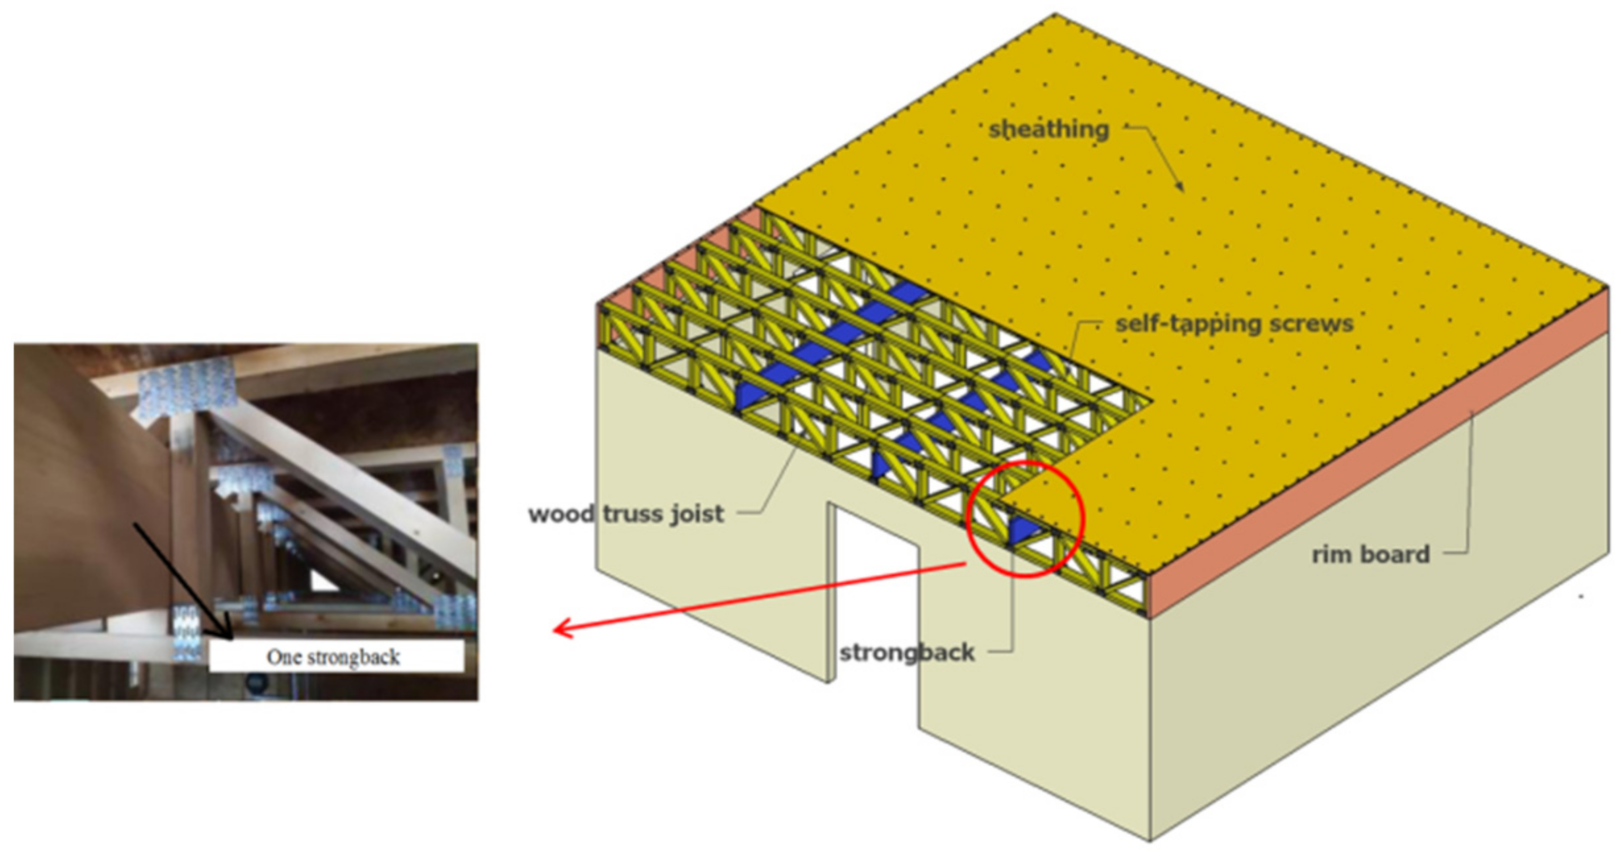
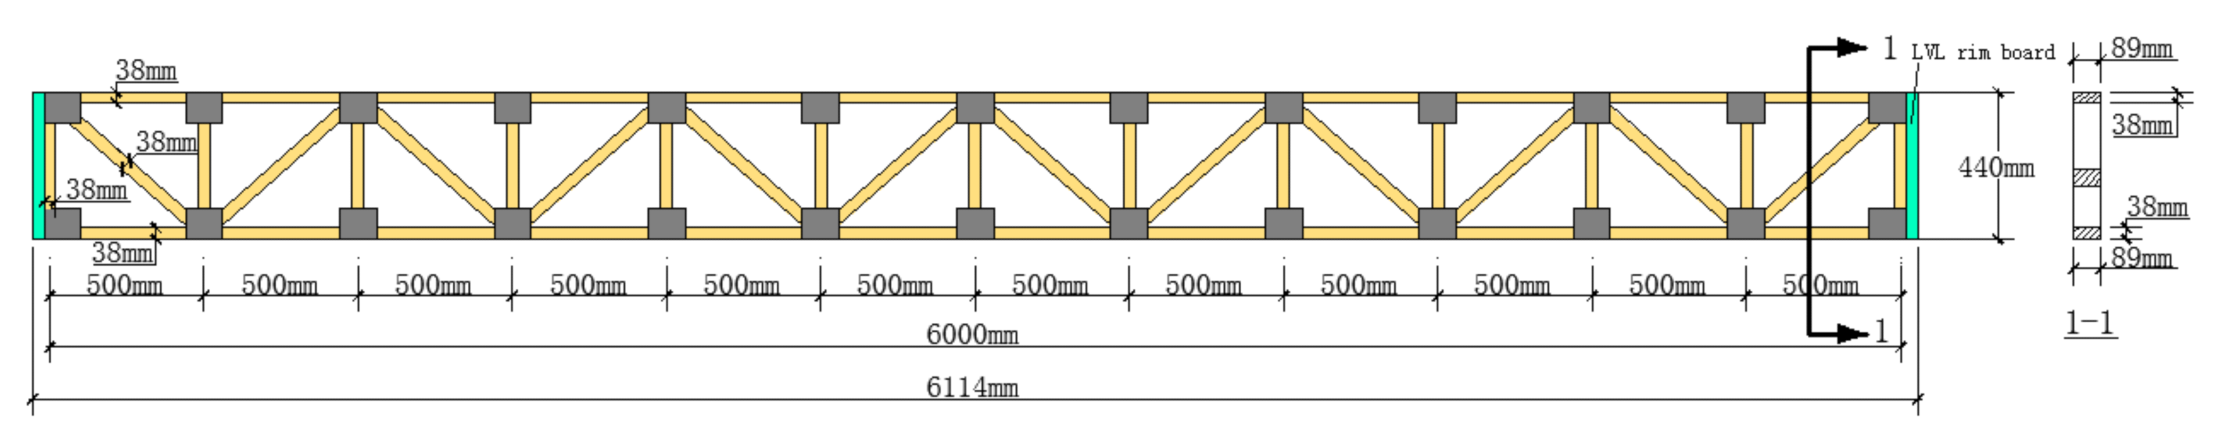
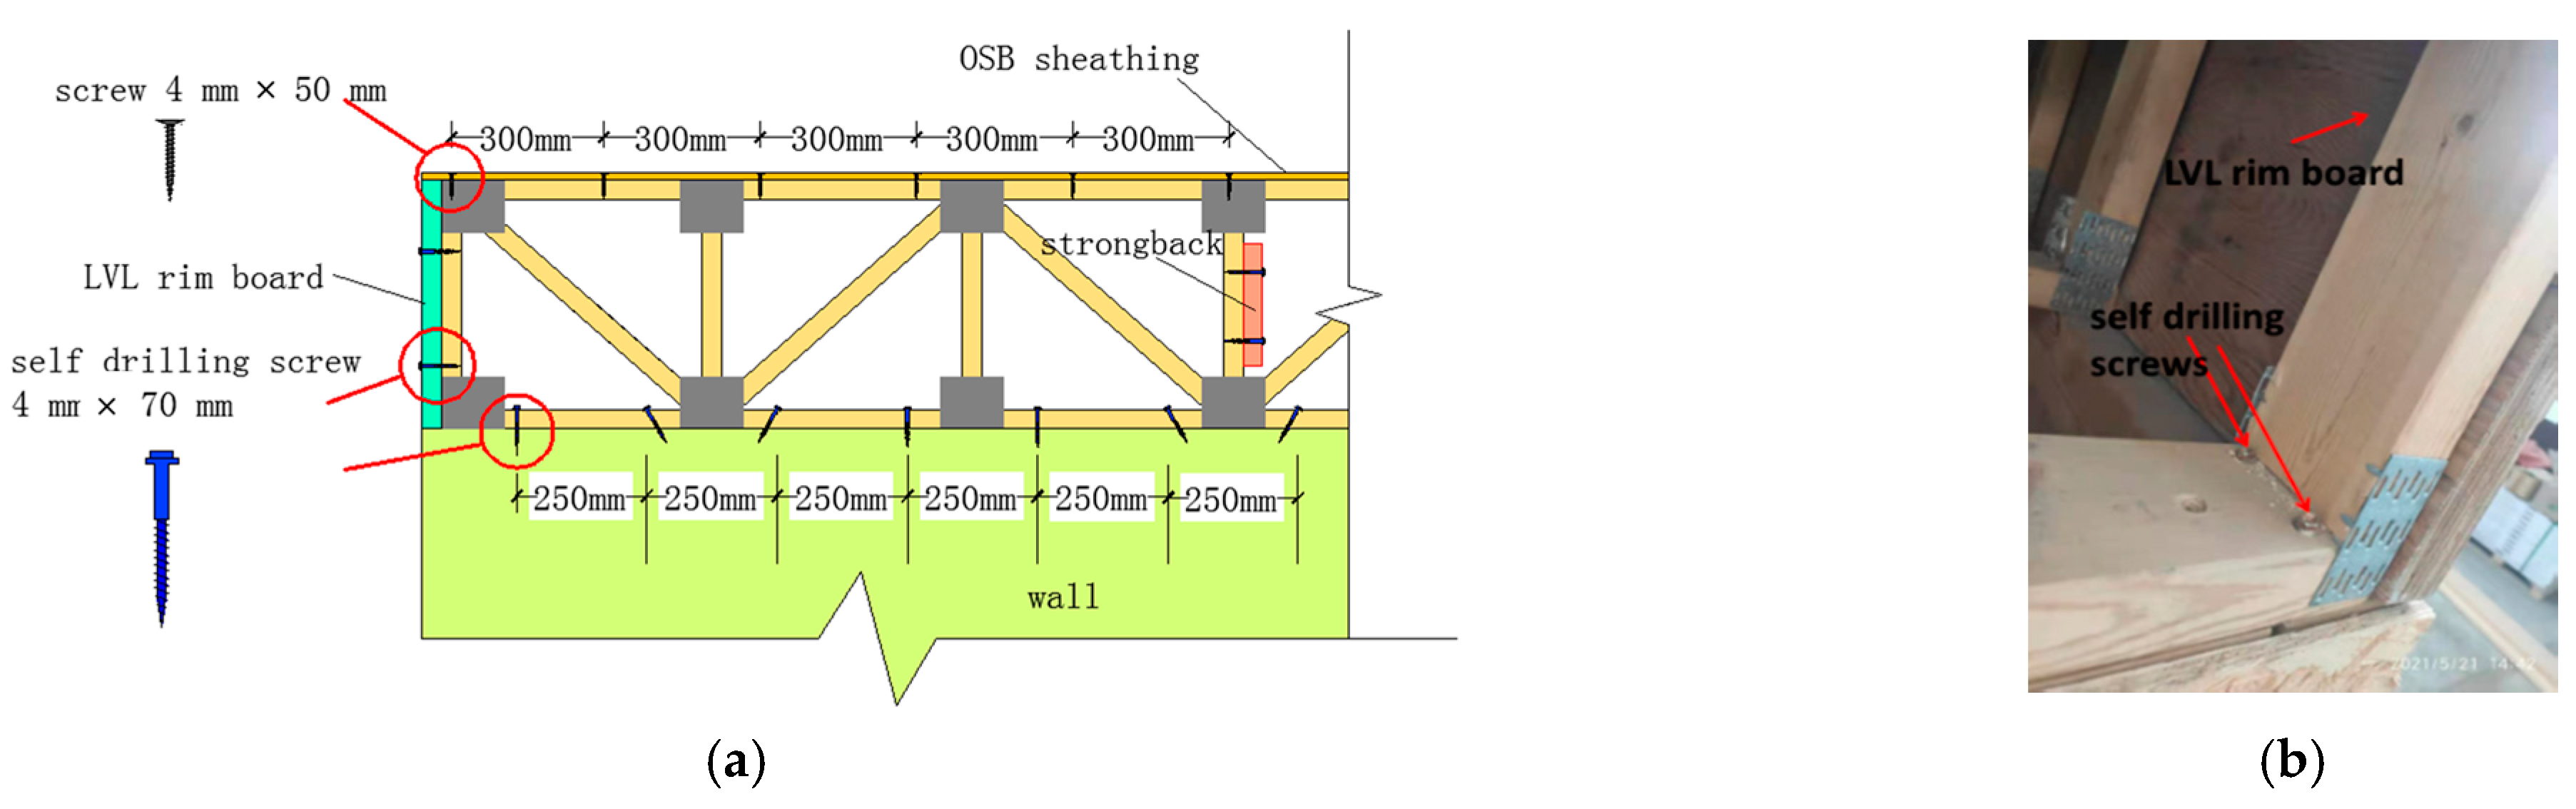
2. Configurations of Wood Truss Joist Floor

All tested floors had a length (span) of 6.114 and a width of 5.689 m and had sawn lumber framing walls (1.85 m height) sheathed with OSB panels. The wood floor system consisted of 15 truss joists with a spacing of 400 mm, OSB sheathing as subfloor, and laminated veneer lumber (LVL) plates as the rim boards covering the ends of the joists. Dimensional lumber of spruce–pine–fir (SPF) (38 × 89 mm) was used for the flange and web members, resulting in a nominal depth of the herringbone truss joist of 440 mm (Figure 2). The SPF strongbacks with a cross-section of 38 × 235 mm ran perpendicularly to the parallel truss joists and were fastened to the vertical web members using 70 mm lag screws. One row and two rows of strongbacks were used as the bracing component.
Based on a real wood truss joist floor case, the OSB sheathing was fastened on the wood truss joists using 3 × 50 mm self-tapping screws at a distance of 150 mm at the edge of the floor and 300 mm elsewhere along the joist. The metal plates made of MiTek Ltd. (thin steel plates of 1 mm thickness and teeth of 8.4 mm height) were used to connect the flange members and web members for each truss joist. The edge joists were fixed to the framing walls with 70 mm lag screws at a distance of 250 mm, and both ends of the other joists were fastened to the framing walls with 70 mm lag screws. Lag screws were also used to connect the LVL rim board to each joist, illustrated in Figure 3.
The OSB subfloor has a thickness of 15 mm with the average density of 650 kg/m3. The OSB sheathing has orthotropic material directions with 4080 MPa for average major elastic modulus and 2080 MPa for average minor elastic modulus. The major material direction of OSB panel in-plane is for normal to the joist. The rim boards of LVL plates with the thickness of 38 mm have the average density of 600 kg/m3. The average elastic moduli of LVL plate were 13,000 MPa for longitudinal direction, and 1000 MPa for other directions. In terms of the SPF wood made for the truss joists with the average density of 560 kg/m3, the longitudinal, radial, and tangential elastic moduli were 8700, 600, and 400 MPa, respectively. For SPF strongbacks with the average density of 540 kg/m3, the longitudinal, radial, and tangential elastic moduli were 9000, 870, and 710 MPa, respectively. Five floor configurations (floors A–E) with strongbacks from zero to four were tested and modeled in the study, listed in Table 1.

3. Experimental Floor Test Method

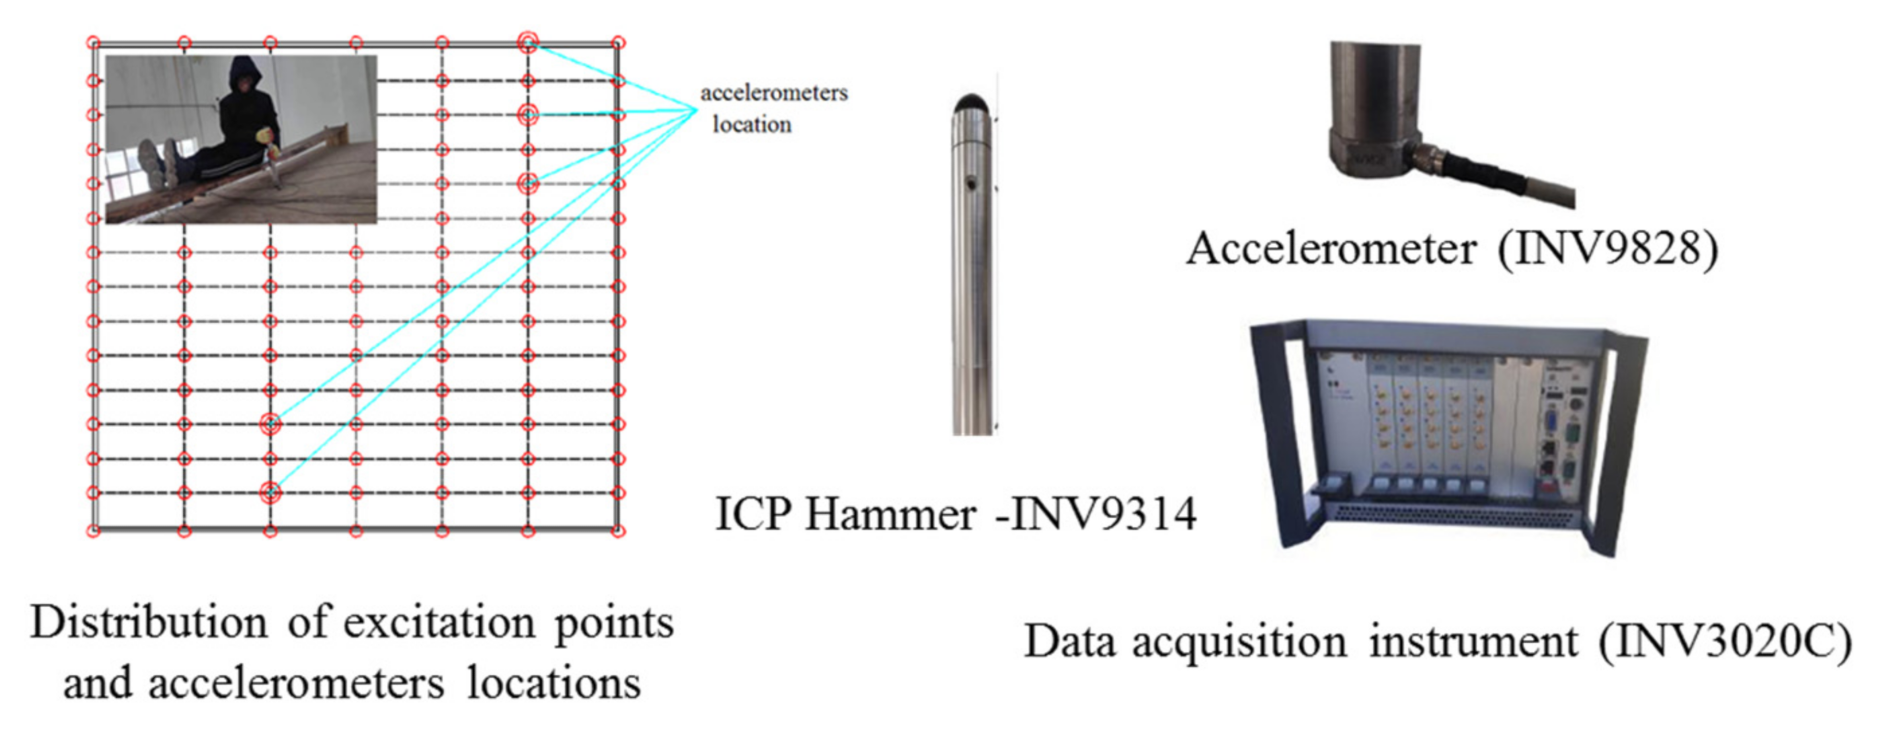
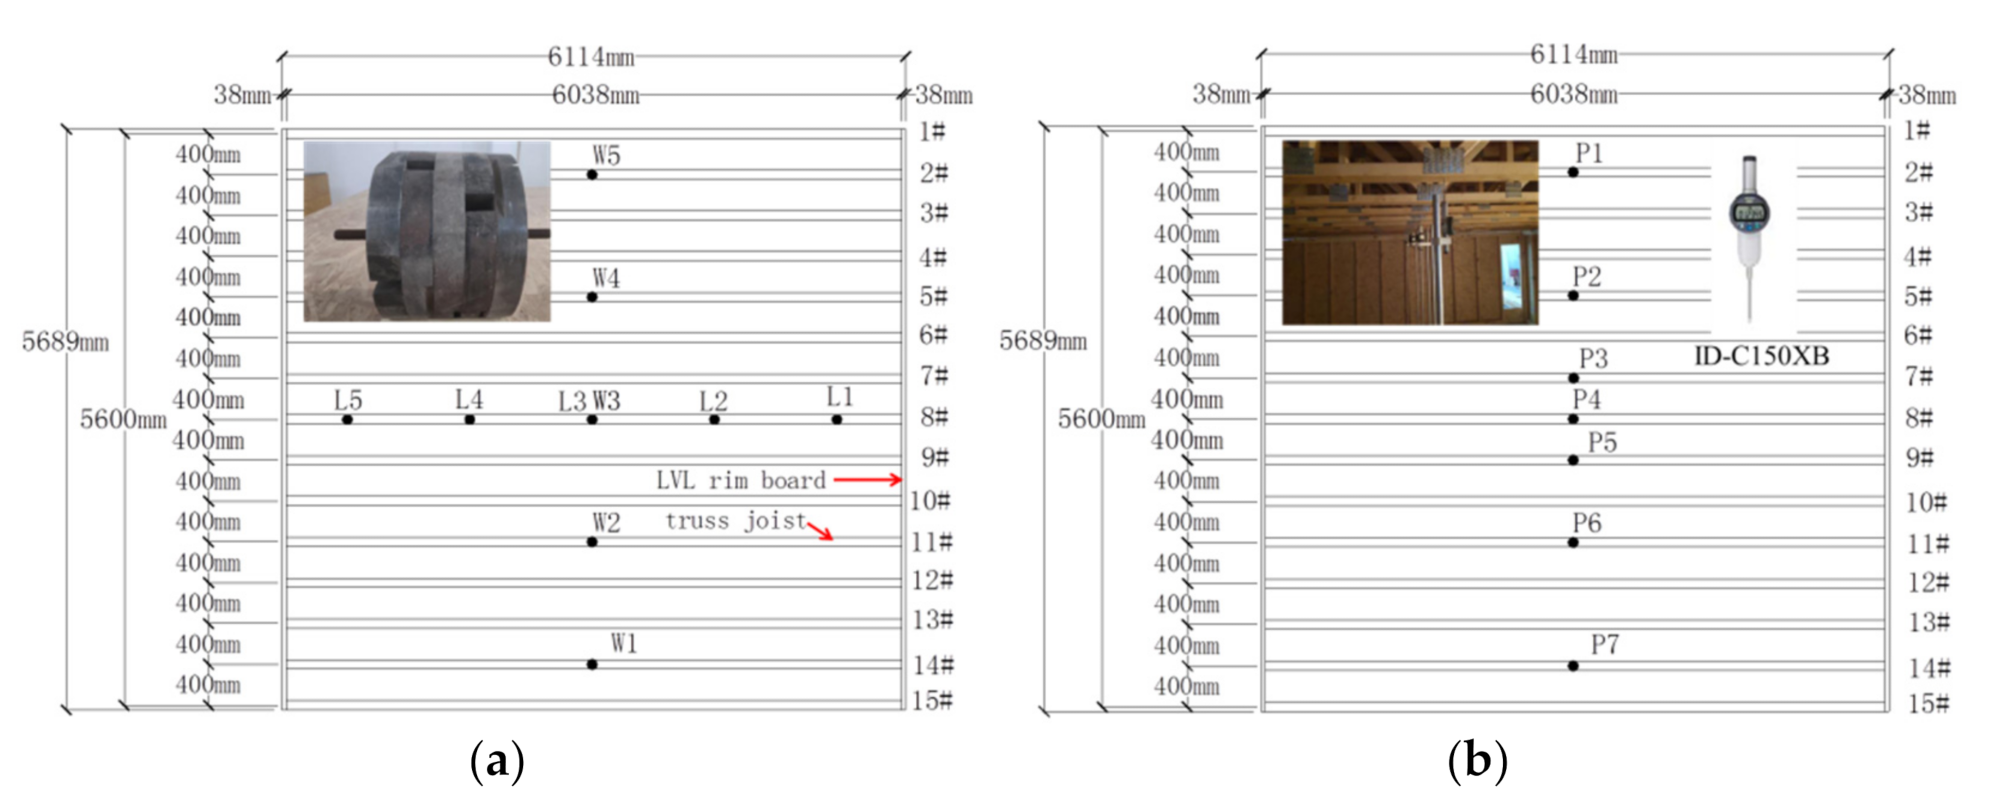
3.1. Vibration Mode and Frequency Testing

The test standard of ISO-18324-2016 [27] was used to obtain the vibration modes and natural frequencies by conducting vibration mode and frequency testing on a series of wood truss joist floors. The vibration mode and frequency tests were conducted in a quiet and spacious woodworking workshop. A grid of 7 × 15 = 105 equally distributed node points as excitation points were drawn on the OSB subfloor and were mirrored on the computer screen by DASP-V10 Software (COINV Inc., Beijing, China). The five INV9828 accelerometers (COINV Inc., Beijing, China) were placed to obtain the acceleration response of the points on the subfloor. However, the point at the center of the floor should be avoided in order to obtain the higher vibration modes, see Figure 4. The tester supported by a movable wood frame hammered the excitation points on the floor using an ICP hammer (INV9314) (COINV Inc., Beijing, China) in order to create impact excitation. The accelerometers sensed and transformed the vertical vibration movement of the floor into electrical signals, which were recorded by a data acquisition instrument (INV3020C) (COINV Inc., Beijing, China). Based on the processing method of fast Fourier transform, the frequency response function, natural frequencies, and mode shapes of the tested floors were obtained in DASP-V10 Software (COINV Inc., Beijing, China). The measurement instruments before the tests started were corrected with high precision. The voltage value of vibration signal output was much greater than that of ground noise. We used a coherence function, which is a dimensionless metric of the relationship between response signal and excitation signal, to control the quality of the test. The value range of coherence function should be between 0 and 1, generally greater than 0.8. In addition, window functions were used to reduce spectrum energy leakage. These operations can ensure the accuracy of frequency obtaining of the floors in vibration mode and frequency tests.

3.2. Point Load Deflection Testing

Point load deflection test under a concentrated load of 1 kN has been widely used because the deflection limitation of the floor is correlated with the floor response subjected to the force exerted by the footstep of the occupants. The ten loading points were selected, and seven monitoring points were measured to obtain the deflection values, presented in Figure 5. The five different loading points normal to the joist (numbered 1, 2, 3, 4, and 5 in Figure 5a referred to loading locations, defined as W1, W2, W3, W4, and W5, respectively) were located on every third joist at the center of the joists. Another five loading positions parallel to the joist (numbered as from L1 to L5) were distributed at the same distance on the middle joist, as also illustrated in Figure 5a. W3 and L3 are the same loading positions. Seven ID-C150XB dial indicators (0.001 mm resolution) (Mitutoyo Inc., Kawasaki, Kanagawa Prefecture, Japan) attached to the steel hangers with 1.8 m height were used to monitor the deflections at the bottom at the mid-span of the joists of each floor, P1 was used for the #2 joist, P2 for the #5 joist, P3 for the #7 joist, P4 for the middle joist #8, P5 for the #9 joist, P6 for the #11 joist, and P7 for the #14 joist, as illustrated in Figure 5b. The 100-kg iron roller was placed sequentially at the ten loading points on the sheathing.

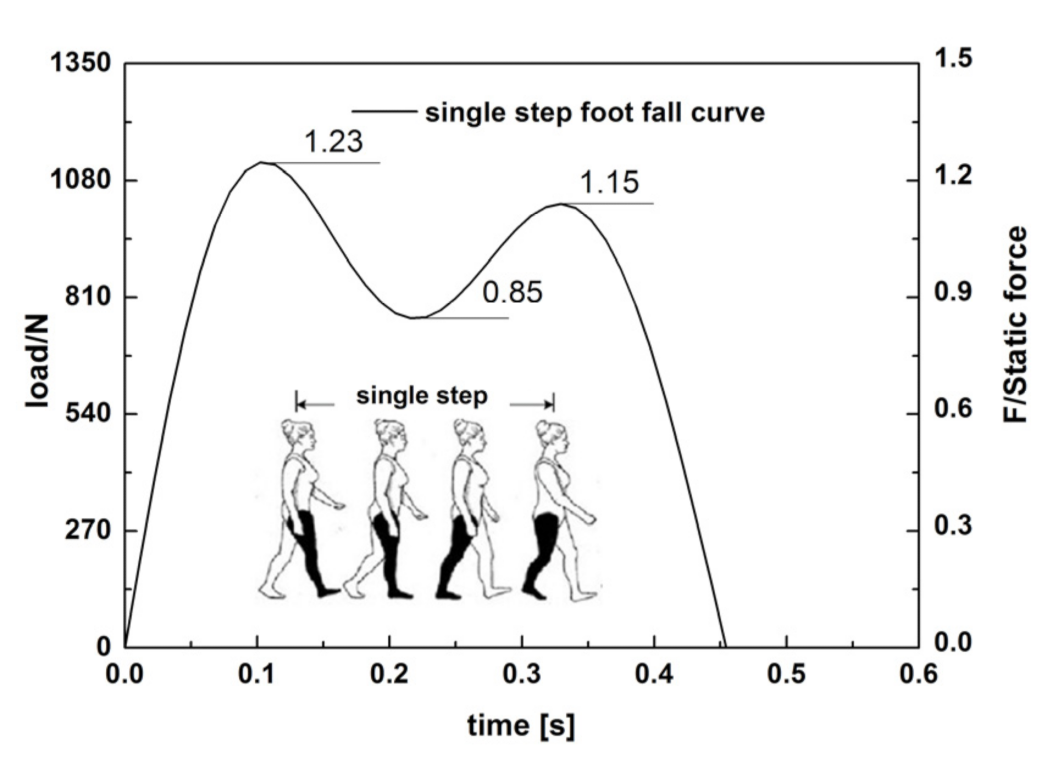
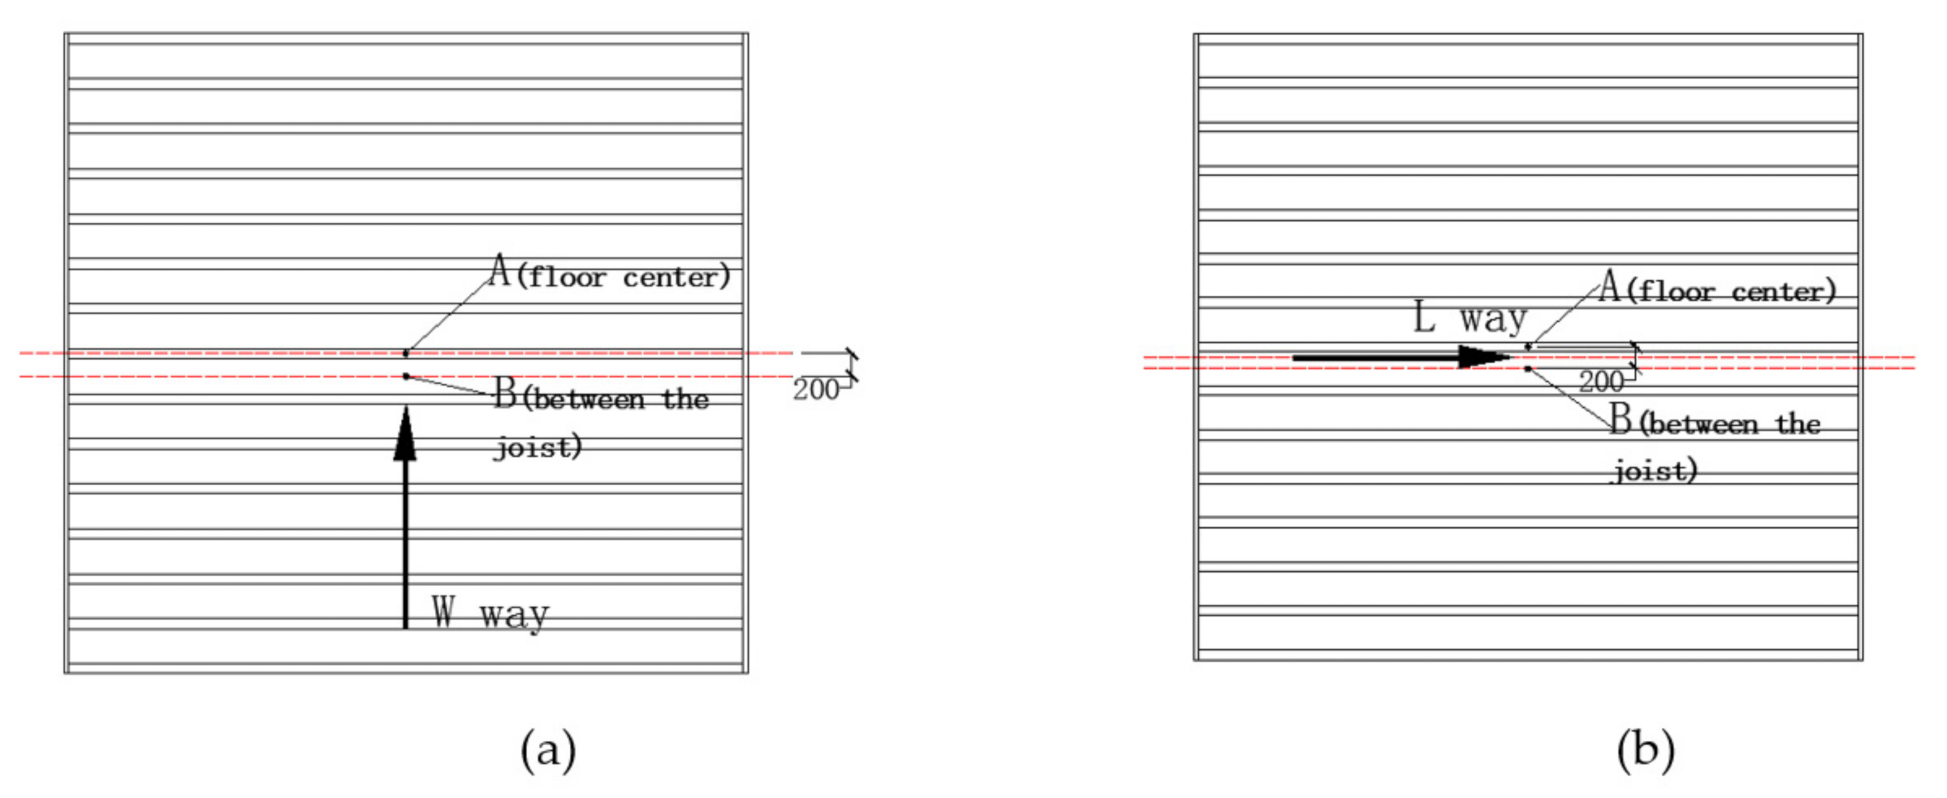
3.3. Human Induced Vibration Tests under Single Person Loading

Excessive vibration of wood truss joist floors may occur due to human activities. The dynamic responses of different floors induced by single person walking loading were investigated to evaluate the effect of the strongbacks on the floor vibrations. The vertical acceleration response at the center of the wood truss joist floors were measured using an accelerometer (INV9828) (COINV Inc., Beijing, China) provided in Figure 4. The accelerometer placed at the center of the floor was tightly stuck to the sheathing of the floor to ensure signal acquisition stable, marked as A point. In the associated tests, a person with the mass of 90 kg using a metronome to play the walking beat walked along the paths. The walking frequency is 2.2 Hz and the step length is about 600–650 mm. The walking paths were perpendicular to the joist (W path) and parallel to the joist (L path), illustrated in Figure 6. The single person walking on each floor is repeated three times for each path to obtain reliable results. The time history acceleration curves were recorded by a data acquisition instrument (INV3020C) (COINV Inc., Beijing, China) provided in Figure 4. A series of window functions have been used to denoise and reduce spectrum energy leakage, such as a rectangular window or exponential window. The response signal curves were adjusted to eliminate the unnecessary energy dissipation and the curves discontinuity.

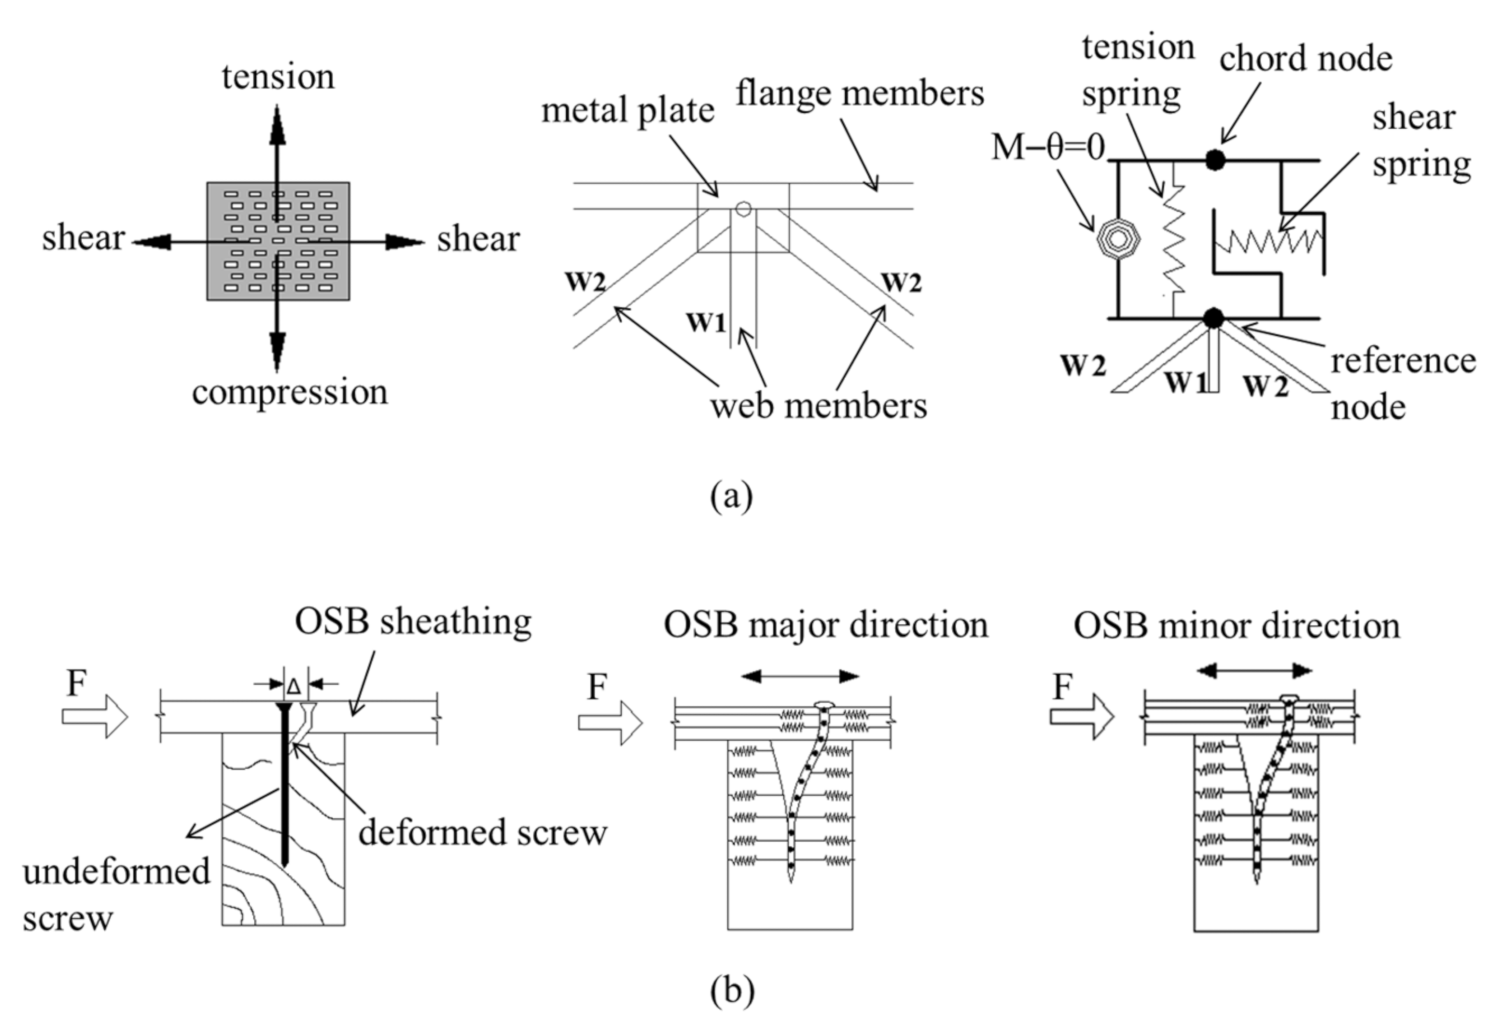
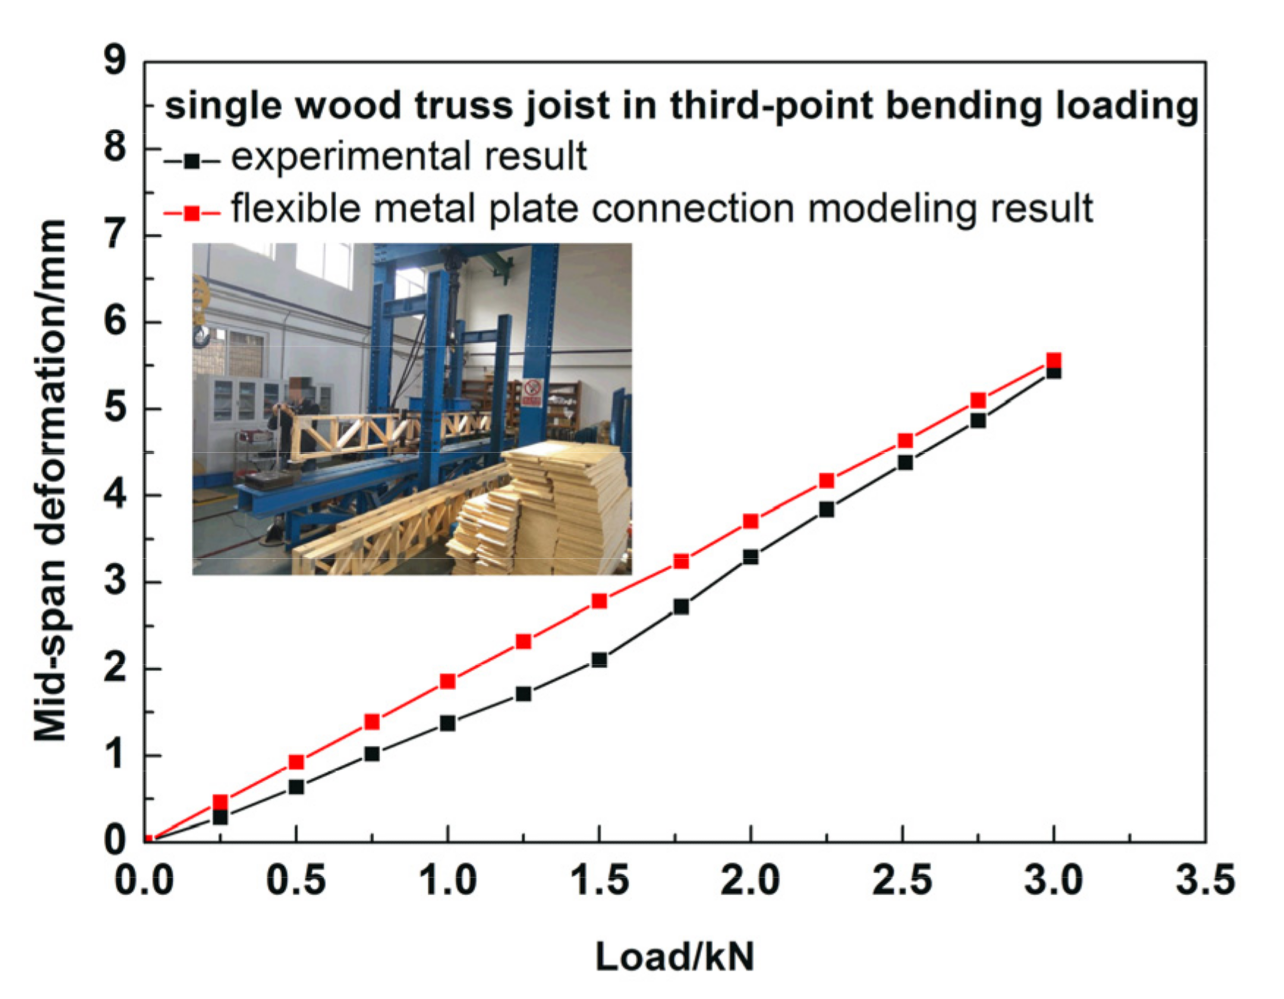
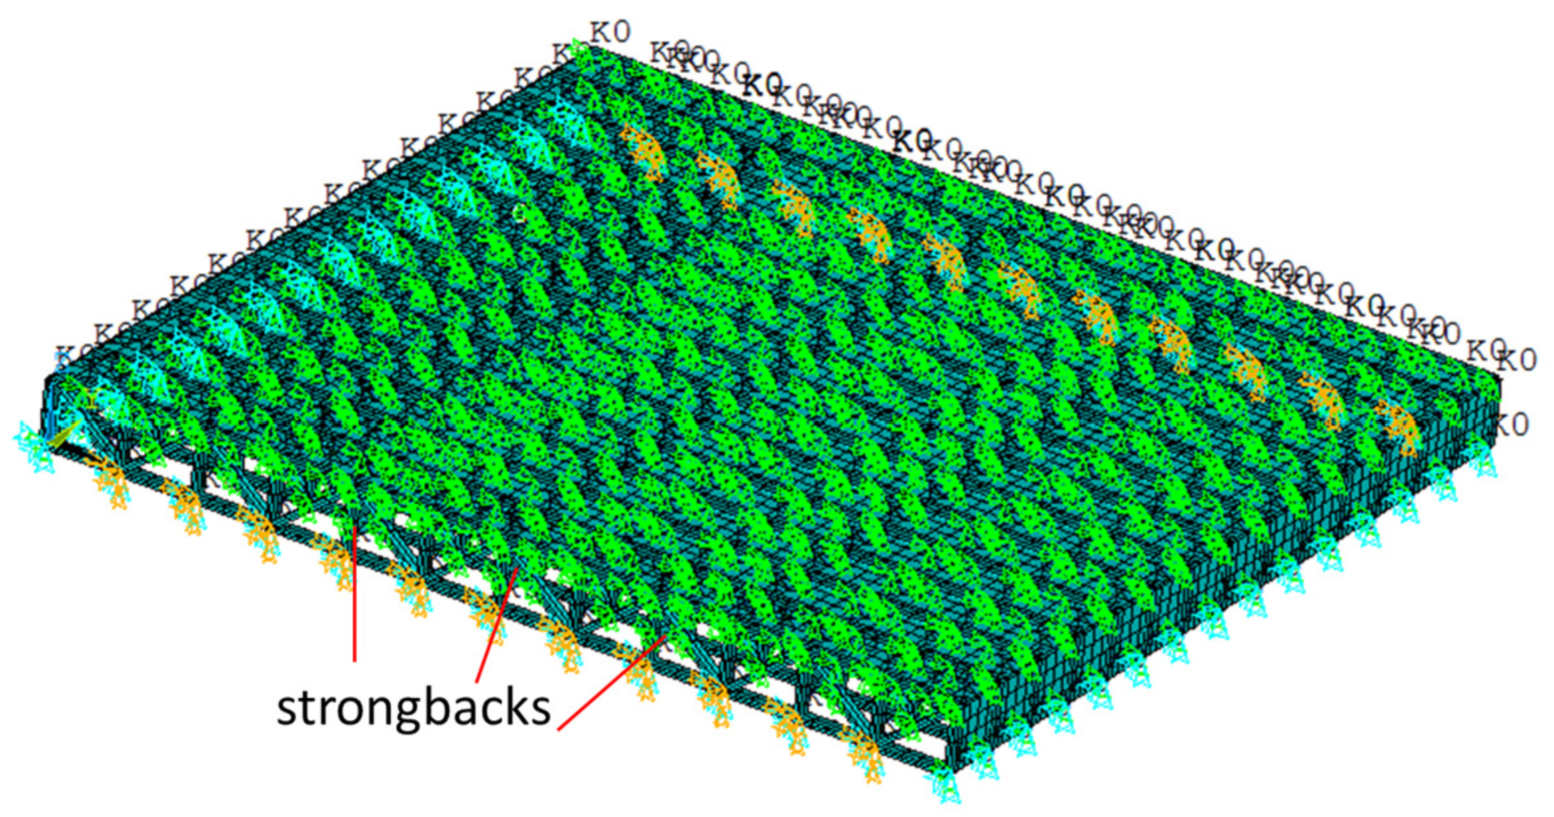
4. Numerical Simulation Method

The floor models have the range of element amounts from 7032–7449 with variation depending on the various floor models based on the finite software of ANSYS Mechanical APDL 19.0 (ANSYS Inc., Canonsburg, PA, USA), including spring elements, shell elements, and beam elements. Spring elements are adopted to model the behavior at each direction of the metal plate connections connecting wood truss, respectively. Spring elements are also used to model the behavior of screwed connection between the sheathing and the wood truss. Beam elements are used for members composing the wood truss joist and strongbacks, and shell elements are used for sheathing and rim board of the floor system. It should be noted within the models, the multi-web members at corresponding metal plate connections are assumed to generate a composite force at a reference node (Figure 7a) rather than to quantify the performance of each web member to chords. Regardless of types of metal plate connections, the elastic stiffness between composite force node and the corresponding chord in each wood truss joist model is assumed to the same. The relationship between the component load and the corresponding deformation of the metal connections is mainly quantified by orthogonal zero-length springs for the directions of the major axis (referred to in-plane shear) and minor axis (referred to in-plane tension) in Figure 7a. The rotation stiffness of the metal plate connection is assumed to zero. Spring elements (Combin39) with one degree of freedom are used to quantify the shear and tension or compression performance in-plane of the metal plate connections, respectively. Other orthogonal spring elements (Combin39) with one degree of freedom are used to quantify the shear deformation and the corresponding loads in-plane for both direction (OSB major direction and minor direction) between the fasteners and the sheathing, respectively, as shown in Figure 7b. For the simplification of boundary conditions in numerical analysis, the rigid connection for the edge joists was assumed. Meanwhile, simply supported connection for other inner joists was also assumed. The hinge connection between the strongbacks and the vertical web members is also assumed.
For floor vibration problems induced by humans, the joint connections of the timber floor commonly exhibit recoverable linear elastic behavior. Thus, the performance of connections in elastic phrase should be considered. The initial periods defined between 0–40% of the peak load of the load-displacement curves of timber connections are conservatively accepted as linear elastic periods, which is the common practice from different countries [28,29,30,31,32,33]. Thus, the linear elastic stiffness parameters of screwed connections from the load–slip test are applied to quantify the connection behavior between the sheathing and wood truss in the numerical model, which has been reported in the reference [26].
An accurate assessment of the linear-elastic stiffness of the metal plate connections is critical. The stiffness parameters of metal plate connection were obtained by numerically calibrating the experimental deflection results of single wood truss joist in a third-point bending loading test, see Figure 8. This approach ensured the accuracy of component level in numerical prediction. More model description can be reported in the reference [26]. From the Figure 8, the calibrated numerical curve exhibits ideal linear increase, quite close the experimental curve of single wood truss joist. However, the discrepancy still exists, especially under the middle range of load. This is because the complexity of metal plate connection, nature and anisotropy of the timber materials with material defects, and prefabrication error lead into the real elastic experimental curve with slight nonlinear variation.
The elastic stiffness parameters of sheathing-to-joist connections, the calibrated elastic parameters for metal plate connections and the material mechanical parameters of the wood members were used to establish the floor models with different configurations in this study, listed in Table 2, Table 3 and Table 4, respectively. The final floor shape model with three rows of strongbacks, as an example, is shown in Figure 9.

5. Results and Discussion

5.1. Vibration Frequencies and Modes

It is assumed that tested floors should have very week coupling on other modes or local modes. Table 5 summarizes the first three-order natural frequencies of a series of floors in the vibrational test. The fundamental natural frequencies of tested floors almost remain the same at about 15 Hz. However, the first natural frequency measured from floor B is 0.2 Hz lower than the ones from other floors. The reason may be an increase in the stiffness of the integrate floor has a slight advantage to compensates for the increased mass of the floors, due to one strongback adding. Perhaps the slight difference of 0.2 Hz is from a measurement error in vibration mode and frequency tests. The fundamental natural frequencies of tested floors almost remain the same. The use of one strongback row at the mid-span (Floor B) only increased the frequency by 1 Hz for the second mode and by 2.4 Hz for the third mode compared to the floor without strongbacks (Floor A). The use of two strongback rows at the mid-span (Floor C) only increased the frequency of the floors by 1.9 Hz for the third mode compared to that of the floor with one strongback row at the mid-span (Floor B). The use of three strongback rows (Floor D, one for the mid-span and the other two rows for one-third of the span) compared to Floor B enhanced the second frequency by 1.3 Hz and the third frequency by 2 Hz. Based on three strongback rows (Floor D), the increase of one strongback row at the mid-span for Floor E only affected the third frequency with the increase of 2 Hz. These results indicated that an increase in the number and location of the strongbacks did not significantly affect the fundamental natural frequency but moderately influenced the second and third vibration mode frequencies. These results align with the reported findings in open metal-web joist floors [11].
As an important parameter of vibration performance, Figure 9 shows the experimental measured and numerical modeled fundamental natural frequencies for various floors. The fundamental natural frequency of a timber floor F1 has to be larger than 8 Hz, and the measured and modeled values meet the F1 requirements (≥8 Hz) Figure 10. The numerical predicted range (15.78~16.9 Hz) provides close agreement with the measured fundamental frequency range (14.8~15 Hz). The maximum error is from predicted and measured fundamental natural frequencies of Floor A without strongbacks (16.9 vs. 15 Hz) with errors of less than 12.7%. With the increase in the number of strongbacks from zero to four (Floor A–E), the predicted fundamental natural frequencies exhibited slight decreases of 0.01–0.34 Hz. In general, the different strongbacks did not change the fundamental natural frequencies of the floors. The reason is that for the low mass of timber floors, an increase in the stiffness due to an increase in the number of strongbacks compensates for the increased mass of the floors. However, the fundamental frequencies numerically modeled demonstrated slightly higher than the corresponding experimental values. That may be induced by a series of factors, including connection gaps existence in the process of fabrication of truss joist timber floor, discreteness of connection performance, variability of the natural materials (wood), and simplified numerical boundary.
Figure 11 illustrates three-order mode shapes from numerical and experimental results. The modeling results showed consistent with the experimental results. Despite different numbers and locations of strongbacks, the first three-order mode shapes were identical for all tested floors. The first-order mode shows vertical vibration throughout the floor. The second-order mode exhibits reverse vertical vibrations of two segments along the width direction, whereas the third-order mode exhibits fluctuations of three segments along the width direction (the middle and both sides showed opposite vibrations).

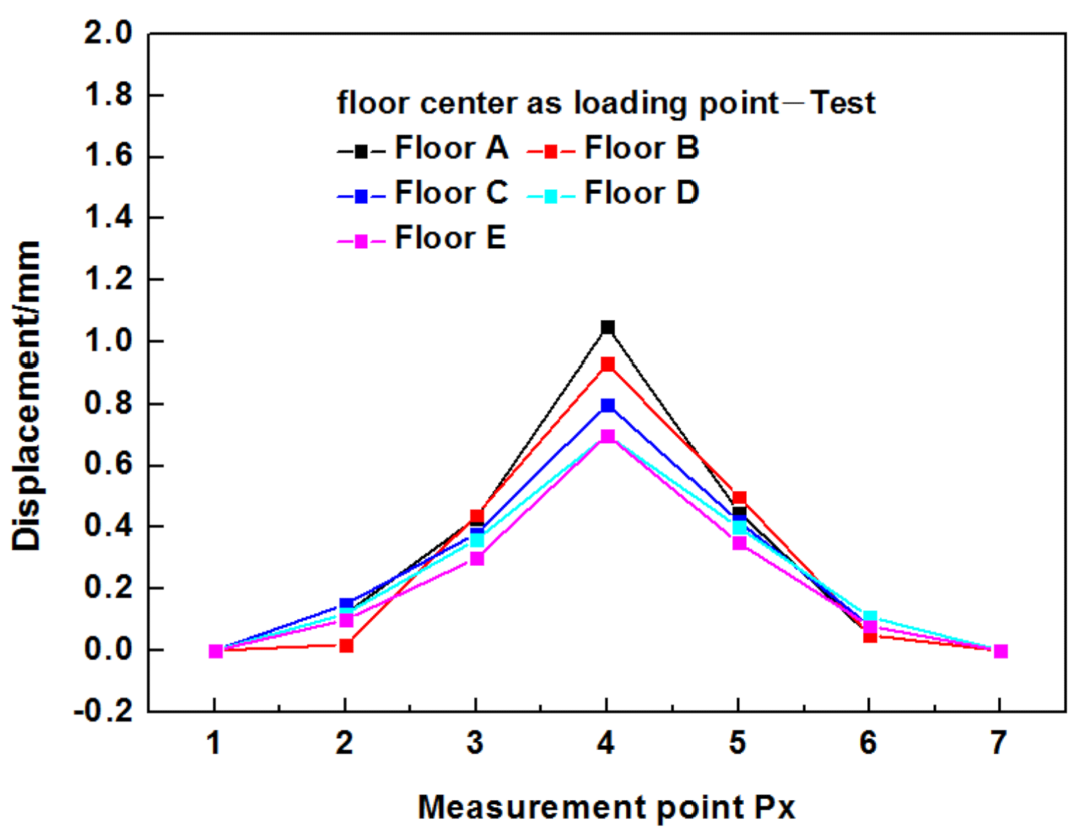
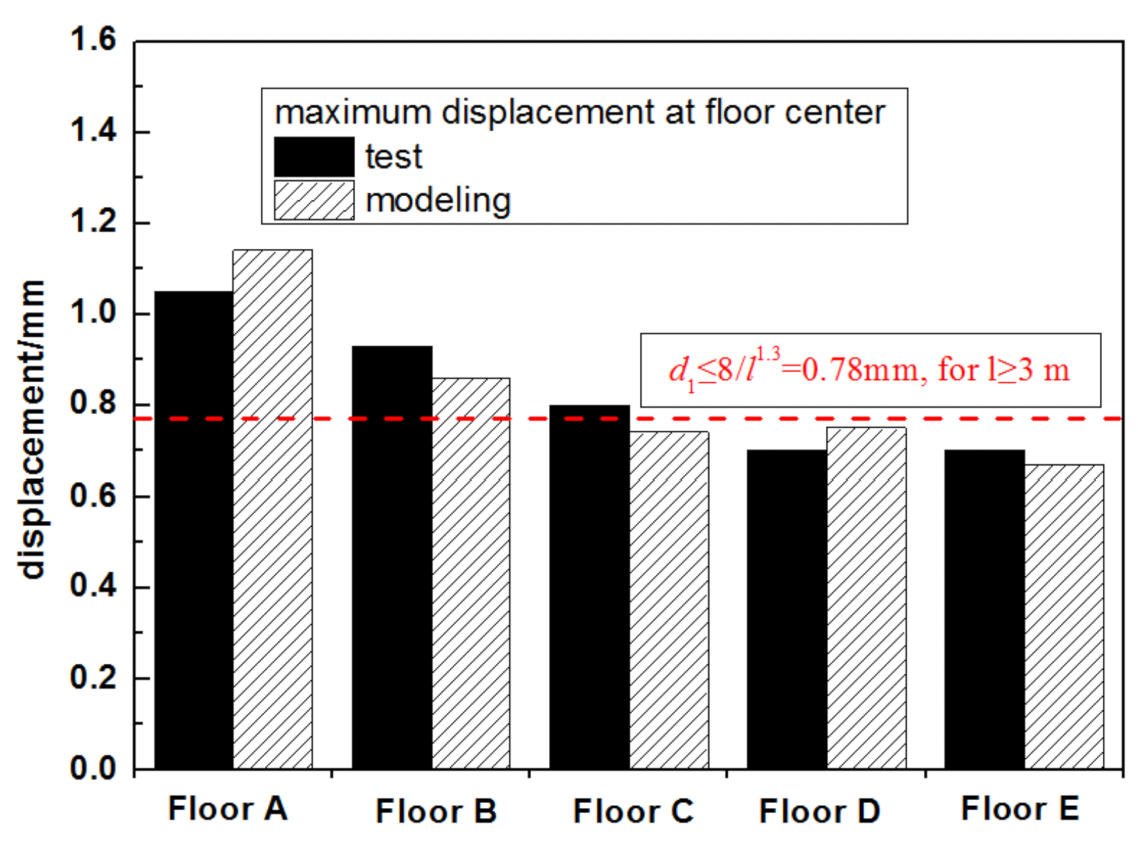
5.2. Point Load Deflections

Taking Floor A and Floor B as examples, the experimental and modeled deflections of under a concentrated load of 1 kN applied at the W series points (W1–W5) are shown in Figure 12 and Figure 13, respectively. The X axis stands for the measurement points (from P1 to P7). Square symbols point stands for the deformation values at different measurement points when W1 as loading point, the triangle symbols for W2 as loading point, the start symbols for W3 as loading point, the pentagon symbols for W4 as loading point and the solid sphere symbols for W5 as loading point. The black lines are used to connect the measured deformation values and the magenta lines are used to connect the numerically predicted deformation values at different measurement points. The modeled results were in good agreement with the experimental results in most cases.
Figure 14 demonstrates the experimental deflection values at different measurement points (from P1 to P7) for five tested floors when the floor center as loading point. The use of the strongbacks significantly decreased the maximum deformation on the sheathing at the joists. Adding one strongback rows at mid-span (Floor B) effectively decreased the maximum deformation at P4 compared to Floor A, from 1.05 to 0.93 mm with a decrease ratio of 11% (indicated in brackets hereafter). For the floors with two strongback rows at mid-span (Floor C) compared to Floor A, the center deformation (P4) significantly decreased from 1.05 to 0.8 mm (24%). For Floor D and Floor E, there is no significant effect of adding strongbacks at one-third of each span on decreasing the maximum deformation at the floor center (0.7 versus 0.7 mm).
As shown in Figure 15, the numerical prediction results also show similar trends. For Floor B compared to Floor A, the maximum displacement at the measurement point significantly decreased, from 1.14 to 0.86 mm (25%) at P4. Two strongback rows at the mid-span (Floor C) enhanced the floor stiffness compared to Floor A, the maximum displacement of P4 from 1.14 to 0.74 mm (35%). For Floor D and Floor C, minimal differences in reduction of the maximum deformation were observed. For Floor E, adding one strongback rows at mid-span based on Floor D slightly decreased the maximum deformation from 0.75 to 0.67 mm at P4. Thus, it indicated that the degree of increase in the stiffness largely depended on the location of the strongbacks. The closer the strongbacks were to the mid-span, the greater the degree of increase in the stiffness was. In addition, the minimal deflections (<0.2 mm) were observed three joists away from the loading point. For example, in Figure 14 and Figure 15, when the load applied at the floor center (the loading point W4), the peak deflections of the different floors were observed at P4. The negligible deflections occurred at P2 (<0.2 mm), which were located three joists space away from W4. Thus, the addition of the strongbacks did not greatly change the force transmission path normal to the joist and also did not greatly enhance the integrity of the floor system. The deformation effect of the unit point load was only observed within a three-joist distance, and the deformations effects on the other joists were negligible.
Figure 16 shows that the predicted maximum displacement at floor center provides good fit with the corresponding experimental values for five tested floors. The peak deformation induced by a concentrated live loads of engineered timber joists has been defined as follows in APA (2004) [34]:
dl ≤ 2 mm, for l < 3 m; and dl ≤ 8/l1.3, for l ≥ 3 m
where l is the span of the floor (m), dl represents the deflection at the floor center under a 1 kN point load. The results show that Floor D and Floor E meet the requirement based on the modeled and measured maximum displacement. Floor C is close to the serviceability requirement; the numerical estimation results meet the requirement (0.75 mm), but the measured results still had a gap of 0.02 mm to meet the requirement. Floors A and B do not meet the serviceability requirement based on the experimental measurements or numerical calculations.

5.3. Floor Vibration under Single Person Walking Loading

As illustrated in Figure 6, the cases of a person with the mass of 90 kg walking normal to the joist (W path) and along the joist (L path) on the floors were tested and simulated. Since a person may not always walk on the middle joist, a person walking along L path (100 mm vertical offset from the middle joist) was simulated. The normal walking speed was assumed as 0.455 s/step and each step length was assumed as 600 mm. The typical single footfall load–time function [24,35] was adopted in the analysis, shown in Figure 17.
The peak value depends on the stiffness and mass of the floor system determined by floor material, configuration, design, construction, and boundary conditions. Damping does not affect the peak acceleration during transient vibration, but controls decline degree of the vibration response before next footstep begins. A viscous damping ratio of 1–2% was obtained for solid lumber joist floor [4], and a damping ratio of 3% was adopted for the numerical simulation of solid lumber joist floor [25], and a damping ratio of 1% was recommended for structural analysis of metal web joist floors [20]. In the study, a damping ratio of 2% was used for transient vibration analysis of wood truss joist floor. In the associate tests, the vibration response at the floor center (measurement point A) was only measured, see Figure 6. In numerical simulation, different measuring points were selected to gain a comprehensive assessment of the dynamic behavior of the wood truss joist floors. The location of measurement point A is on the sheathing of the middle joist (floor center), and the position of measurement point B is on the sheathing at 200 mm in the vertical direction from A (between the joists), as shown in Figure 18. It gave considerations of different vibration performances induced by varied stiffness (on the sheathing on the joist and between the joists).
Due to the length limitation, taking Floor A, Floor B, and Floor D as examples, the measured and simulated different vertical time history acceleration responses at floor center (point A) in terms of W walking path and L walking path are presented in Figure 19, Figure 20 and Figure 21, respectively. A series of transient vibrations of the floor under a single person walking loading were observed and the numerically modeled acceleration response was basically close to the measured results. Different from vibration response of mass timber floor [25], each footstep on wood truss joist floors resulted in each clear transient vibration including stiff initial peaks and quickly decays. The vibration of wood truss joist floor induced by footstep load was most likely governed by transient response resulted from each touch between the footfall and the floor surface. It was also shown that L walking path resulted in greater acceleration response at floor center than that of W walking path for each tested floor.
The more details of peak accelerations at point A between the measured and the predicted data for tested floors in terms of W walking path and L walking path are illustrated in Figure 22. The predicted peak acceleration was basically consistent with the measured results with less than 15% error. Computer analysis estimated of vibration properties is given focus on discussion hereafter. In the aspect of the W walking path, the use of a strongback row at mid-span (Floor B) effectively decreased the peak acceleration of vibration at point A from 2.55 to 2.00 m/s2 in the simulation by a decrease ratio of 22%. The use of two strongback rows at mid-span (Floor C) had further decreased the peak acceleration to 1.44 m/s2 with the decrease ratio of 43% compared to Floor A. The case of walking along L path produced higher peak acceleration, about 1.5 times than that of walking along W path at the floor center. In the aspect of L path, addition of a strongback row at mid-span (Floor B) effectively decreased the peak acceleration at point A by a decrease of 6% in the simulation. The use of two strongback rows in Floor C still had the decrease effect on peak acceleration with the decrease ratio of 25% compared to Floor A. However, addition of three strongback rows of Floor D (one for the mid-span and one each at one-third of the span) had minimal influence on decreasing the vibration accelerations; and negligible influence on the acceleration reduction is observed for use of four strongback rows of floor E (two for the mid-span and one each at one-third of the span), see Figure 22. The closer the strongback was to the mid-span, the more significant the vibration acceleration reduction at point A was. Furthermore, the strongbacks mainly reduced the vibration on point A for the direction of perpendicular to the joists (W path) and the effect on the vibration reduction of point A for the direction of parallel to the joists (L path) was relatively weak.
Figure 23 shows predicted displacement response of measurement points A of different floors for W path and L path. Walking at the beginning and the end of W path minimally affected the deformation at the floor center (point A), with the deflection fluctuations were nearly horizontal. In terms of walking along L path, the footstep force was applied and transferred to the adjacent joist (the middle joist), causing frequent vibration displacement at the nearest joist. However, in the aspect of W path, the use of four strongbacks of floor E (two strongback rows at mid-span and one strongback row at one-third of each span) actually enhanced the integrity of the floors to a certain extent. The vibration amplitude at floor center displayed greater values when walking far from the center and the lower values when walking near to floor center compared to other floors.
Figure 24 displays the effect of strongbacks on reduction vibration displacement at floor center. It shows that walking along the L path results in higher vibration displacement than that of walking along W path. The use of one strongback at the midspan (Floor B) is beneficial to decrease the peak vibration displacement with a decrease of 28% for L walking path (0.97 versus 1.35 mm) and a decrease of 20% for W walking path (1.059 versus 0.85 mm). The addition of two strongback rows of Floor C still reduced the peak vibration by 37% for L walking path and 29% for W walking path compared to Floor A. However, there were no obvious advantages in improving the vibration displacement for the use of strongbacks for the midspan and one-third span compared to Floor C, regardless of number increase of strongbacks. The minimal reduction effect of vibration displacements at point A were still found for Floors D and E.
In order to comprehensively understand the vibration behavior of wood truss joist floor system, the vibration parameters of point B at a vertical distance of 200 mm from the middle joist (on the sheathing between the joists) were investigated numerically. Taking Floor B as an example of illustration, the predicted acceleration response at point B for W walking path and L walking path is plotted in Figure 25. Similar to the vibration acceleration response of point A, each transient vibration induced by each footstep contained a stiff initial peak and quickly decayed. However, in terms of the L walking path, the footstep effect caused stiffer peak acceleration of 6 m/s2 than that of point A (Figure 20b and Figure 25b). Similar to the displacement response at point A during vibration, the displacement response at point B for W walking path, and the L walking path is illustrated in Figure 26. It was found that the addition of strongbacks had a negligible influence on reducing the peak accelerations at point B on the sheathing between the joists, and the values were around 6 m/s2, see Figure 27.
However, the use of strongbacks is beneficial to reduce the displacement at point B on the sheathing between the joists. The use of a strongback row at mid-span (Floor B) significantly decreased the peak deformation of vibration at point B by a decrease of 21% for W path (from 1.067 to 0.839 mm) and by a decrease of 17% for L path (from 1.35 to 1.12 mm), compared to floor A. The addition of two strongback rows at mid-span of floor C decreased the peak deformation by a decrease ratio of 30% for W path (from 1.067 to 0.75 mm) and by a decrease of 23% for L path (from 1.35 to 1.04 mm), compared to Floor A. However, the addition of strongbacks at one-third of the span (Floor D and Floor E), a minimal influence on maximum displacement at B point was observed and the displacement values remained almost the same (about 1 for L path and 0.7 mm for the W path), in Figure 28.

6. Conclusions

The aim of this study was to use vibration testing combining with numerical simulations analysis to investigate the static and dynamic performance of wood truss joist floor systems related to vibration severability, especially the influences of strongbacks. The conclusions are as follows:
(1)
The use of strongbacks significantly can improve the floor stiffness and lower the peak deformation of the sheathing. The use of one strongback rows at mid-span and the use of two strongback rows at mid-span effectively decreased the maximum deformation of point loading at floor center by 11% and 24%, respectively. The effect of adding strongbacks at one-third of each span on decreasing the maximum deformation at the floor center was minimal. In addition, strongbacks does not improve greatly the integrity of the floor, and the deflection influence under point loading on other joists that are three joists spaces away is minimal.
(2)
The strongbacks do not significantly affect the fundamental natural frequency of wood truss joist floors. The increase in the stiffness of the floors due to addition of strongbacks compensated for the increased mass of the floors. All the tested wood truss joist floors have similar fundamental frequencies of about 15 Hz. However, strongbacks with the increase of the number from zero to four influenced the higher-order mode frequencies of the wood truss joist floors.
(3)
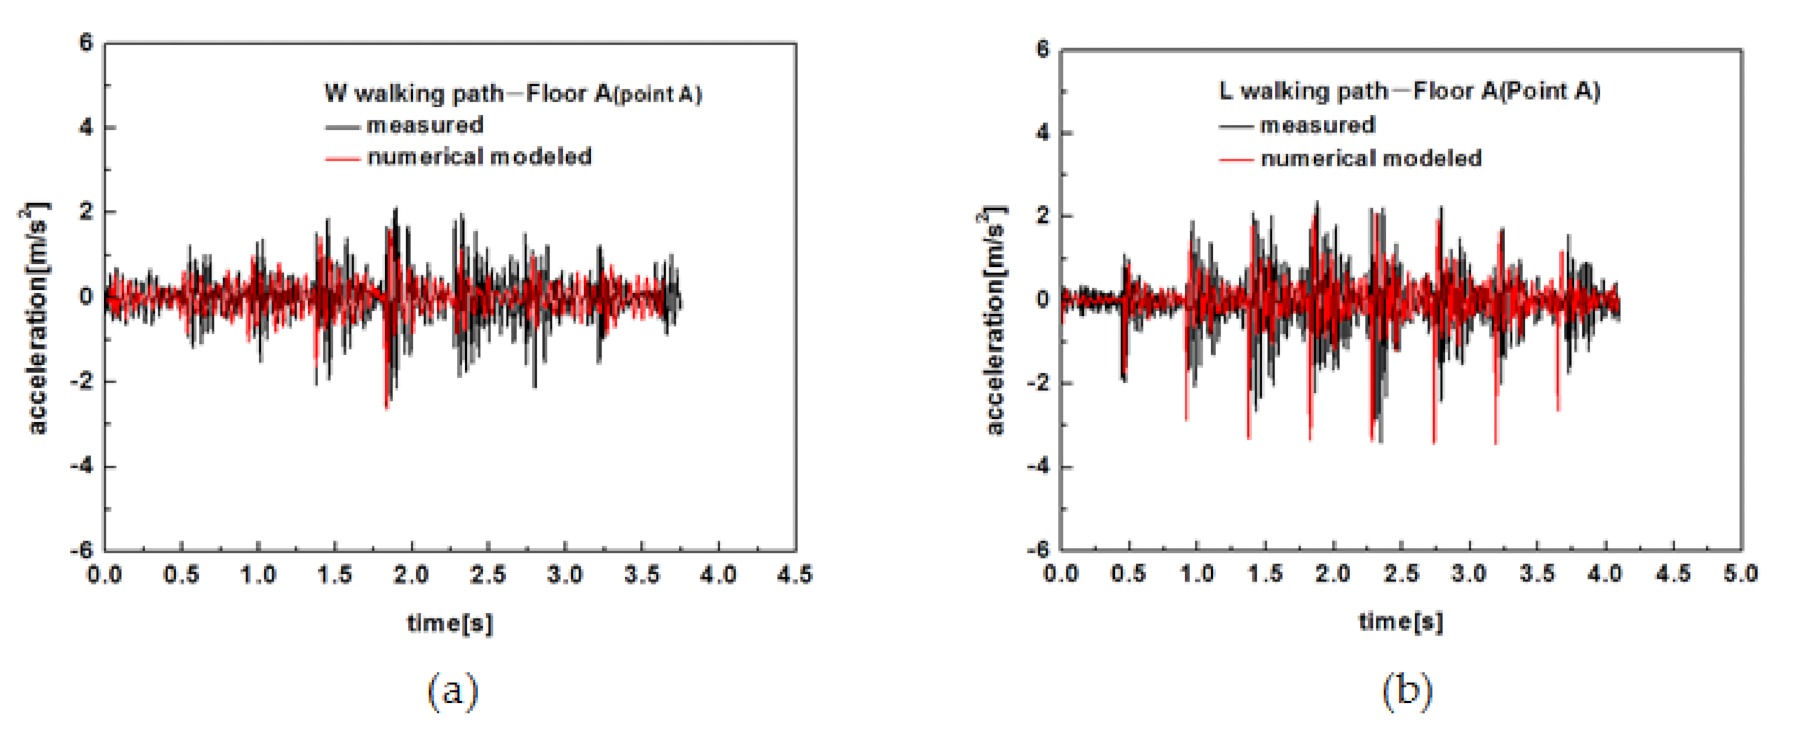
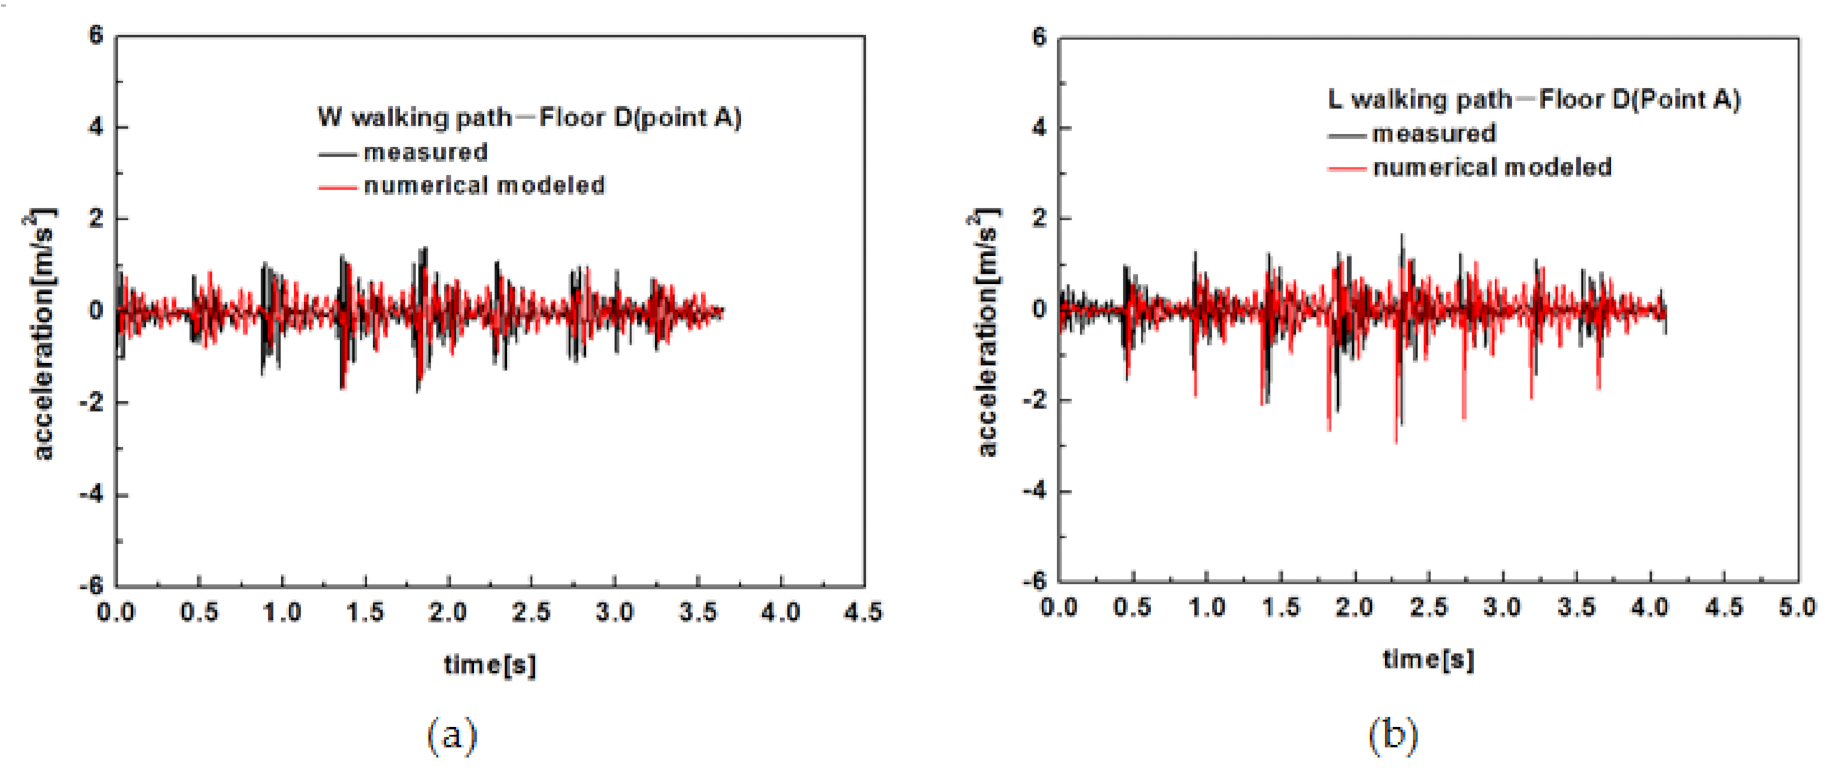
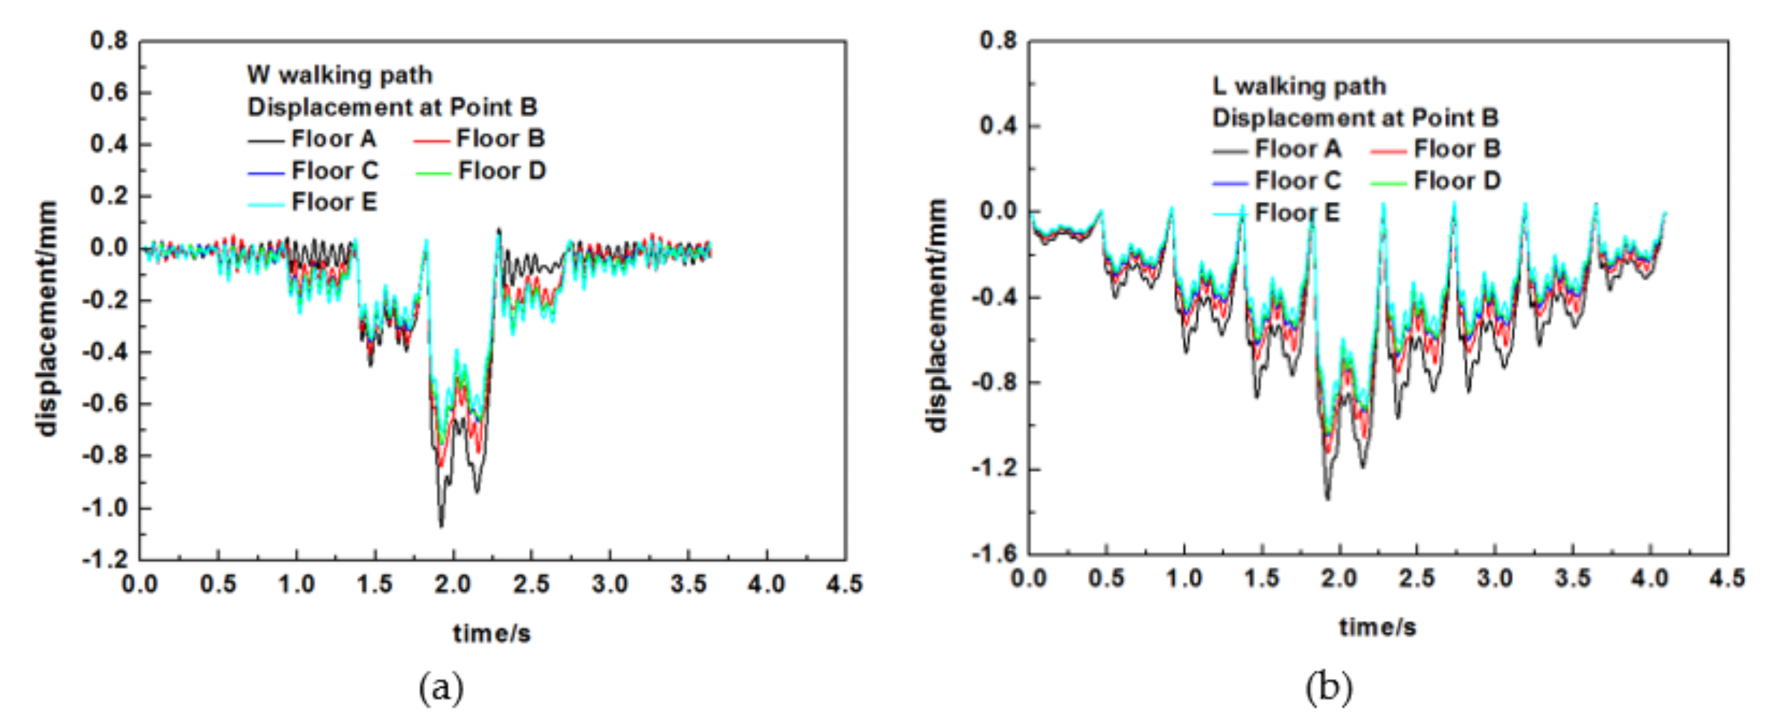
Each footstep on wood truss joist floors resulted in each clear transient vibration including a stiff initial peak and quickly decays. Walking along L path (parallel to the joist) produced higher vibration response at the floor center of wood truss joist floors than that of walking along W path (perpendicular to the joist).
(4)
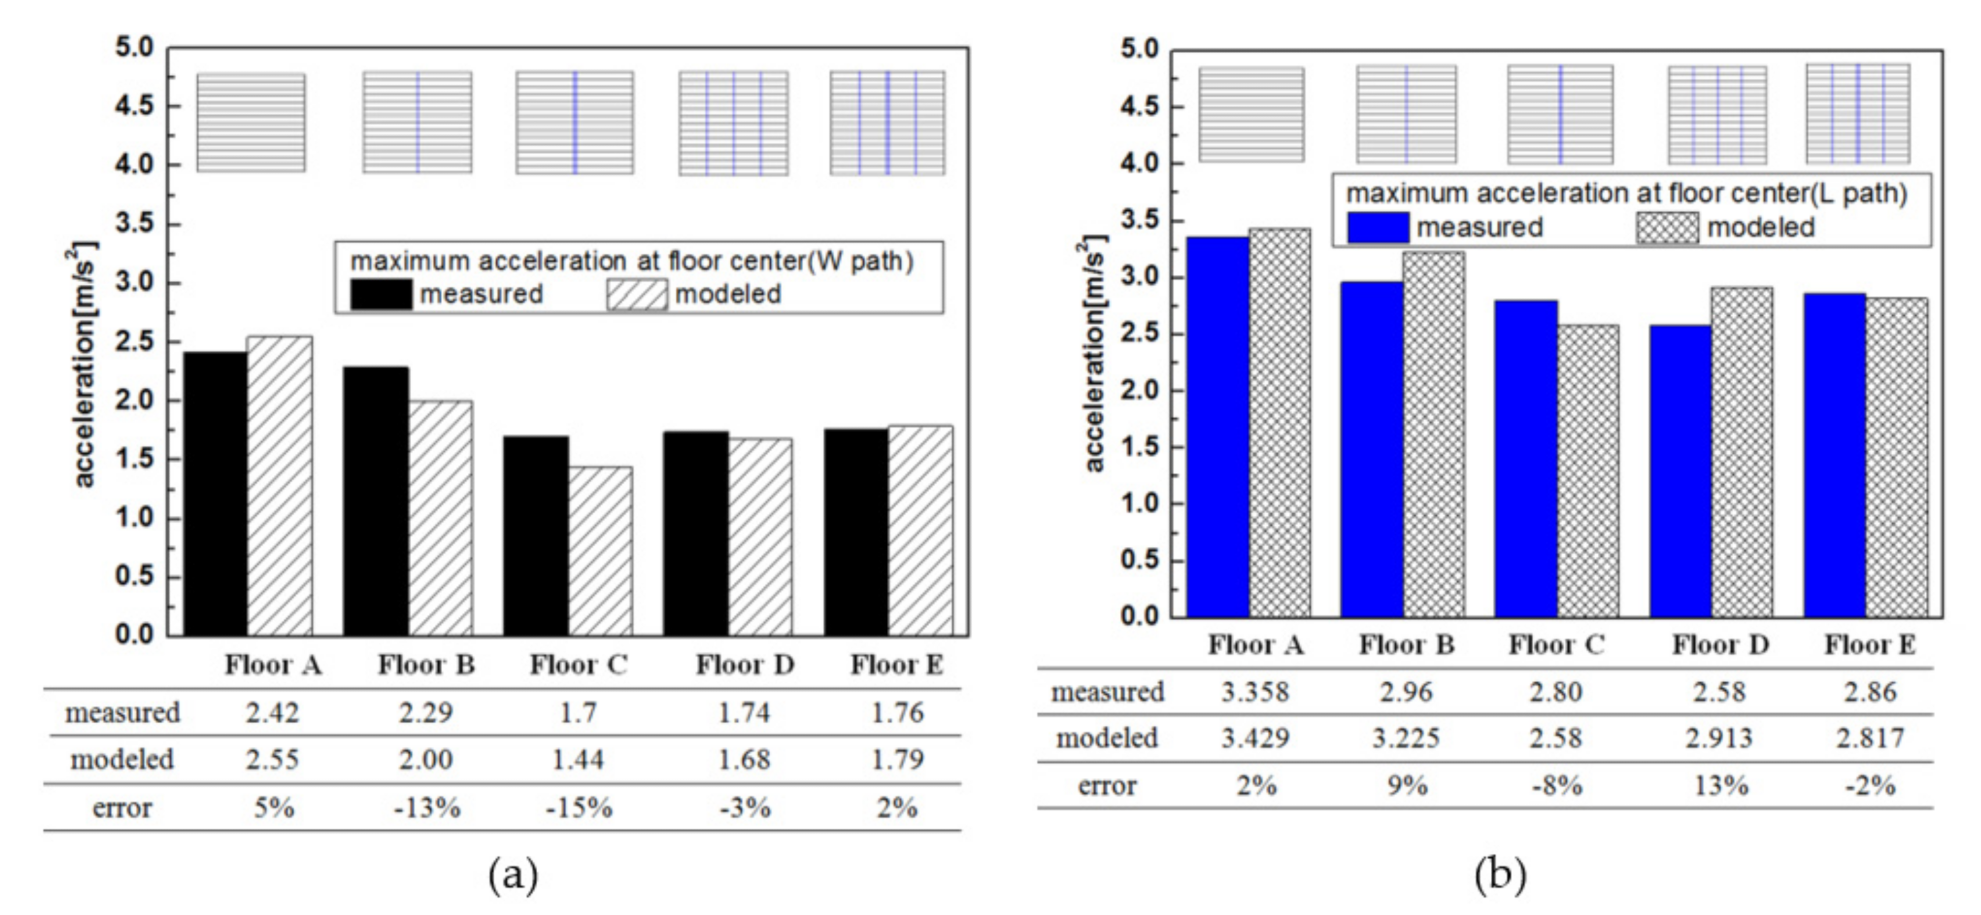
The strongbacks substantially reduced the peak acceleration of the sheathing at the joists. The closer placements of strongbacks were to the mid-span, the more significant reduction of vibration was. The use of a strongback row at mid-span effectively decreased the peak acceleration of vibration at floor center on the joists by a decrease of 22% for W path and 6% for L path. The use of two strongback rows at mid-span has further decreased the peak acceleration at floor center on the joists by 43% for W path and 25% for L path. The addition of strongbacks at one-third of each span had negligible influence on reducing the peak accelerations at floor center. Two strongback rows at mid-span perform best effect on reduction of vibration response at floor center.
(5)
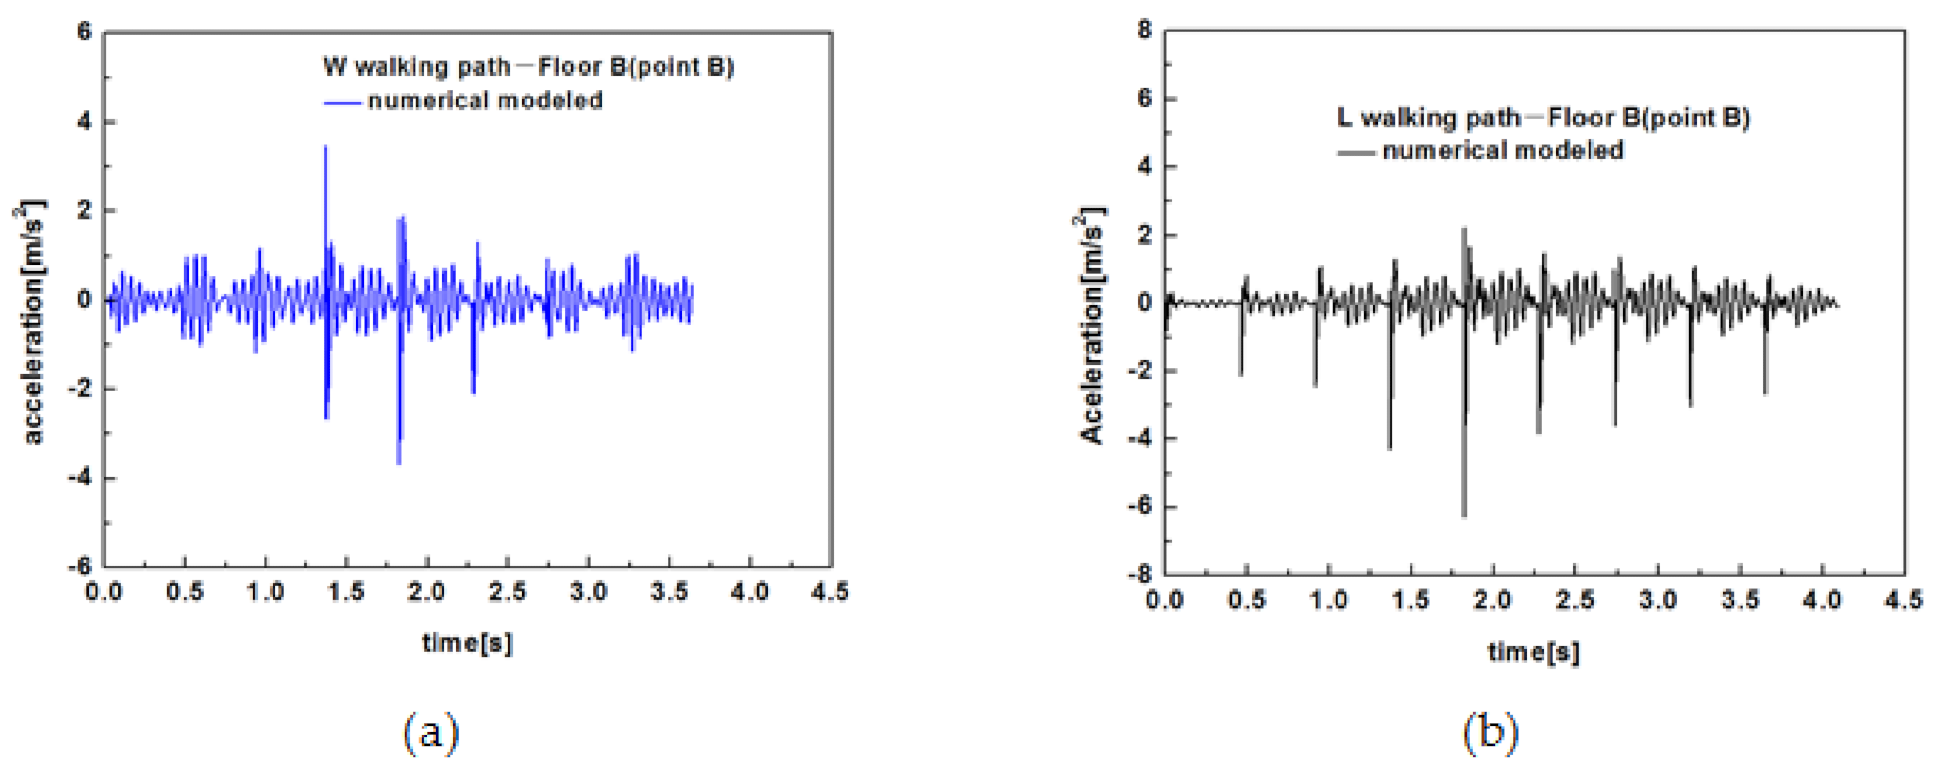
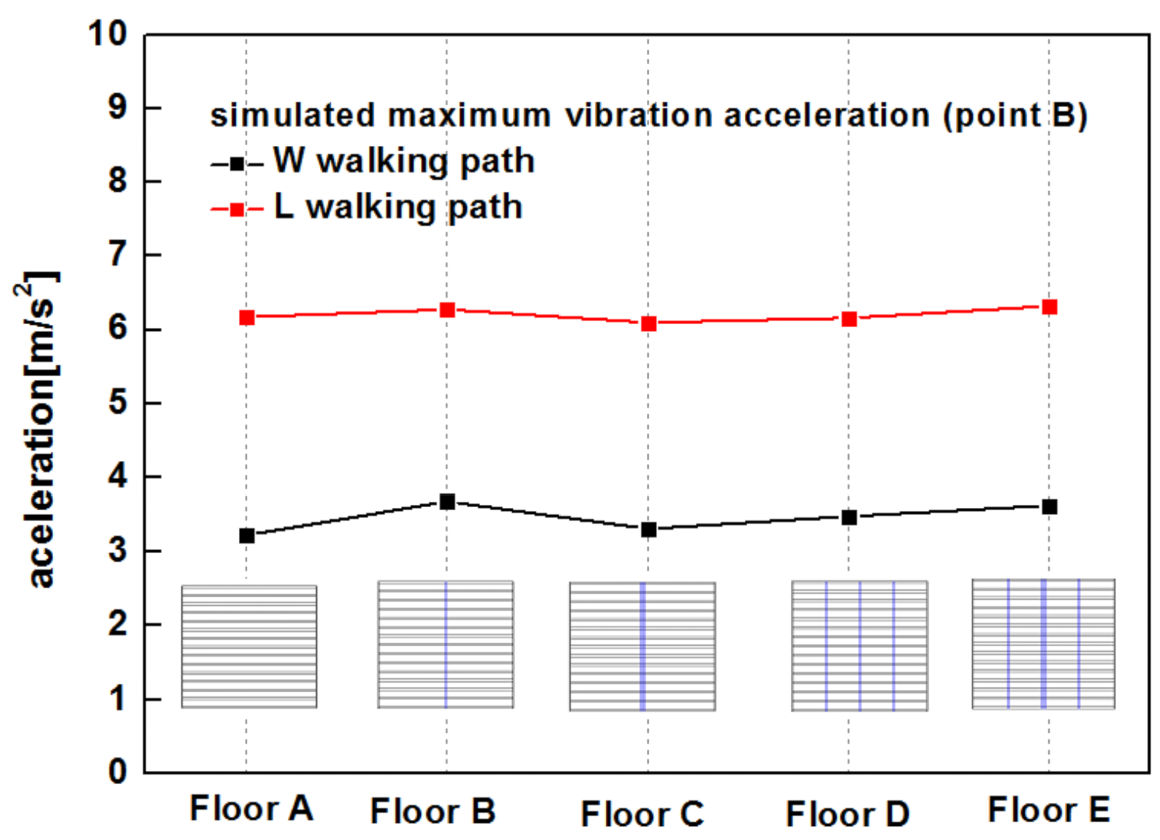
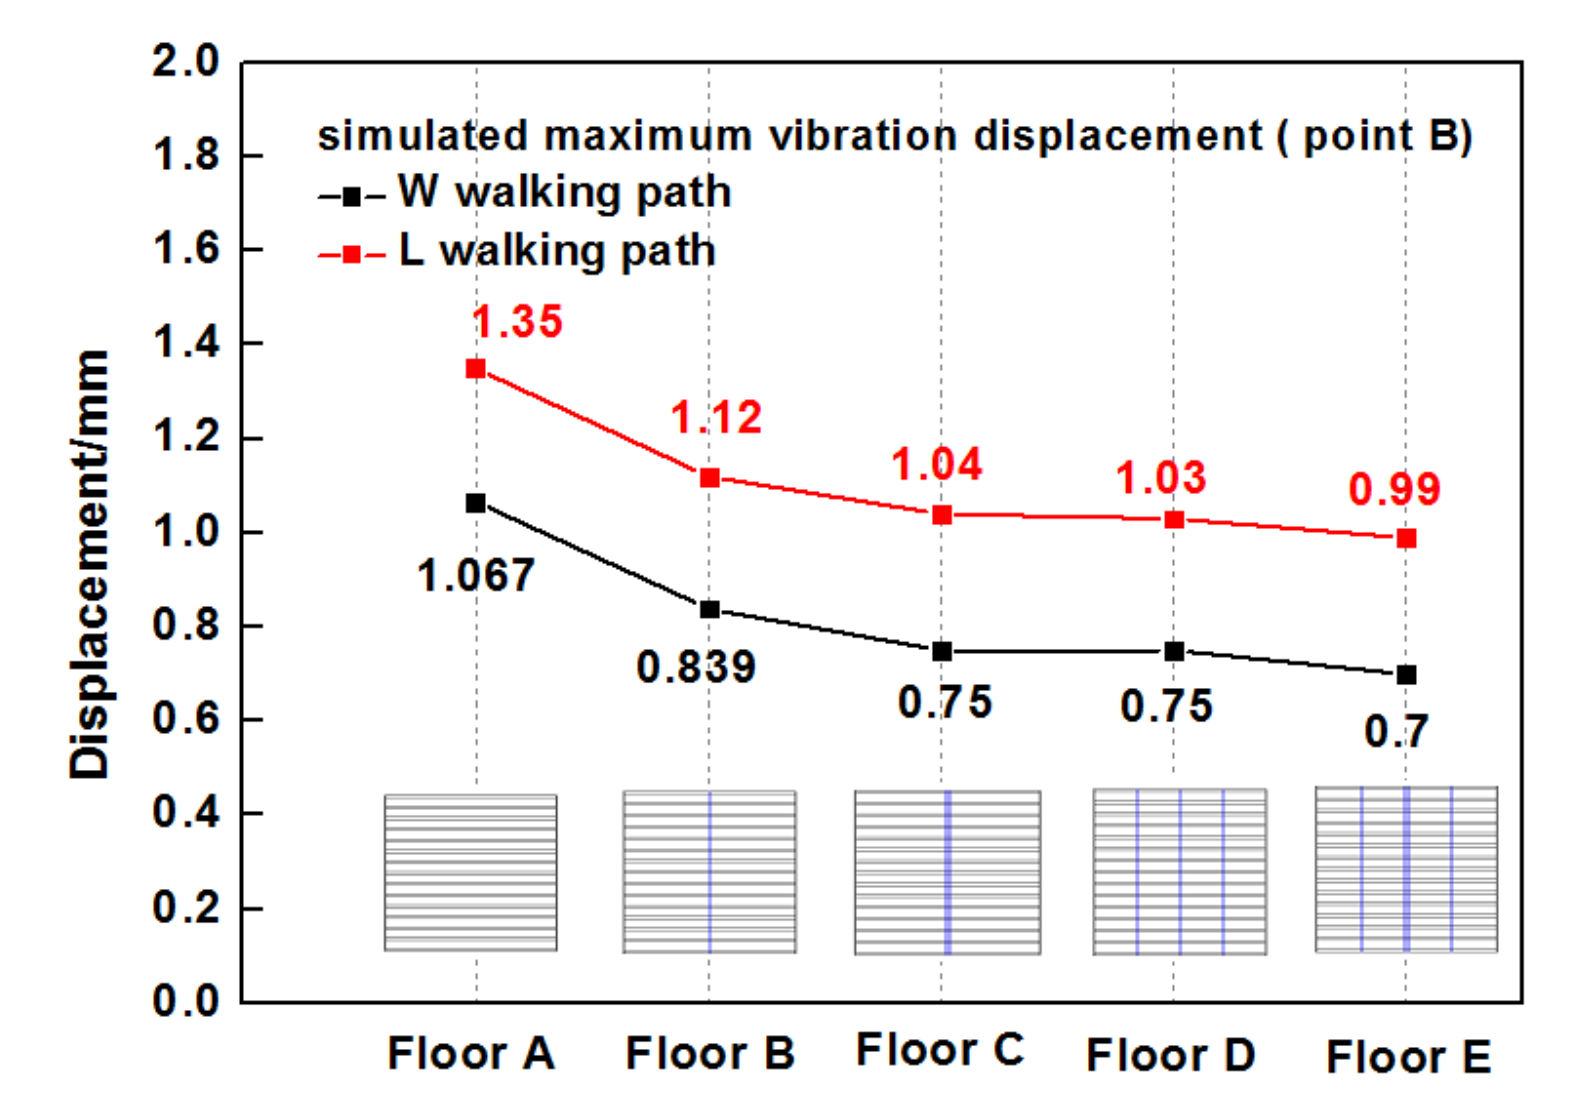
However, the strongbacks have limits of reduction peak acceleration of the sheathing between the joists. It was found that the addition of strongbacks had a negligible influence on reducing the peak accelerations at point B on the sheathing between the joists.
Although simplification of boundary conditions and hypothesis of homogeneous stiffness parameters of the metal plate connections were considered, the numerical models provided a very good correlation of the experimental vibration results of a series of wood truss joist floors. This was an attempt to create simple and refined numerical models of wood truss joist floor for later vibration serviceability and design optimization study. Further investigation and study are needed to consider the effects of strappings, various materials of subfloor, different size of floors, and more refined boundary conditions on the static and dynamic vibration response of truss joist floor system.

Author Contributions

Y.S. wrote the original draft of the manuscript and performed the most numerical analysis work. H.Z. supervised the research team and provided some ideas to research as well as revised the manuscript. S.X. performed the most of experiments. X.Y. and J.S. assisted with the computer analysis. C.G. provided technical suggestion to the research. All authors have read and agreed to the published version of the manuscript.

Funding

This project was supported by the National Natural Science Foundation of China (52008011, 31770603) and the Science and Technology Project of the Beijing Municipal Education Commission (KM201910005019).

Conflicts of Interest

The authors declare no conflict of interest.

References

  1. Ohlsson, S. Serviceability criteria-especially floor vibration criteria. In Proceeding of the International Timber Engineering Conference, London, UK, 2–5 September 1991; pp. I.58–I.65. [Google Scholar]
  2. European Committee for Standardization. Eurocode 5: Design of Timber Structures. General Common Rules and Rules for Buildings. BS EN 1995-1-1-2004+A1-2008; CEN: Brussels, Brussels, 2001; p. 53. [Google Scholar]
  3. Smith, I.; Chui, Y.H. Design of lightweight wooden floors to avoid human discomfort. Can. J. Civil. Eng. 1987, 5, 254–261. [Google Scholar] [CrossRef]
  4. Chui, Y.H. Vibrational Performance of Wooden Floors in Domestic Dwellings. Ph.D. Thesis, Brighton Polytechnic, Brighton, UK, 1987. [Google Scholar]
  5. Khokhar, A.M. Influence of Lateral Element Stiffness on Performance of Wooden Floors. Master’s Thesis, University of New Brunswick, Fredericton, NB, Canada, 2006. [Google Scholar]
  6. Weckendorf, J. Dynamic Response of Structural Timber Flooring Systems. Ph.D. Thesis, Edinburgh Napier University, Edinburgh, UK, 2009. [Google Scholar]
  7. Weckendorf, J.; Toratti, T.; Smith, I.; Tannert, T. Vibration serviceability performance of timber floors. Eur. J. Wood Prod. 2016, 74, 353–367. [Google Scholar] [CrossRef]
  8. Zhang, B.S. Parametric Study on the Design of Timber Floor Joists to Eurocode 5 and National Annex; Technical Document for BSI Technical Committee, B/525/5; BSI: London, UK, 2004. [Google Scholar]
  9. Zhang, B.S.; Bahadori, A.; Kermani, A. Influence of EC5 and the UK National Annex on the Design of Timber Flooring Systems Built with Multi-Webbed Engineered Joists and Solid Timber Joists; Technical Document for BSI Technical Committee B/525/5; BSI: London, UK, 2005. [Google Scholar]
  10. Zhang, B.S.; Kermani, A.; Fillingham, T. Vibrational performance of timber floors constructed with metal web joists. Eng. Struct. 2013, 56, 1321–1334. [Google Scholar] [CrossRef]
  11. Zhang, B.S.; Kermani, A.; Fillingham, T. Vibrations of metal web joist timber floors with strongbacks. Proc. Inst. Civ. Eng. (ICE)-Struct. Build. 2016, 169, 549–562. [Google Scholar] [CrossRef] [Green Version]
  12. Jarnero, K. Vibrations in Timber Floors: Dynamic Properties and Human Perception. Ph.D. Thesis, Linnaeus University, Växjö, Sweden, 2014. [Google Scholar]
  13. Jarnero, K.; Brandt, A.; Olsson, A. Vibration properties of a timber floor assessed in laboratory and during construction. Eng. Struct. 2015, 82, 44–54. [Google Scholar] [CrossRef]
  14. Bernard, E.S. Dynamic Serviceability in Lightweight Engineered Timber Floors. J. Struct. Eng. 2008, 134, 258–268. [Google Scholar] [CrossRef]
  15. Huang, H.Y.; Gao, Y.; Chang, W.S. Human-induced vibration of cross-laminated timber (CLT) floor under different boundary conditions. Eng. Struct. 2020, 204, 1–11. [Google Scholar] [CrossRef]
  16. Wang, C.; Chang, W.S.; Yan, W.M.; Huang, H.Y. Predicting the human-induced vibration of cross laminated timber floor under multi-person loadings. Structures 2021, 29, 65–78. [Google Scholar] [CrossRef]
  17. Norhayati, A.G.; Deam, B.; Fragiacomo, M. Dynamic Measurements of LVL Concrete Composite Floors. In Proceedings of the 13th Asia Pacific Vibration Conference, Christchurch, New Zealand, 22–25 November 2009. [Google Scholar]
  18. Skinner, J.; Martins, C.; Bregulla, J.; Harris, R.; Paine, K.; Walker, P.; Dias, A.M. Concrete upgrade to improve the vibration response of timber floors. Proc. Inst. Civ. Eng.-Struct. Build. 2014, 167, 559–568. [Google Scholar] [CrossRef] [Green Version]
  19. Santos, P.G.G.D.; Martins, C.E.D.J.; Skinner, J.; Harris, R.; Dias, A.M.P.G.; Godinho, L.M.C. Modal Frequencies of a Reinforced Timber-Concrete Composite Floor: Testing and Modeling. J. Struct. Eng. 2015, 141, 04015029. [Google Scholar] [CrossRef]
  20. Xie, Z.; Hu, X.M.; Du, H.; Zhang, X.Y. Vibration behavior of timber-concrete composite floors under human-induced excitation. J. Build. Eng. 2020, 32, 101744. [Google Scholar] [CrossRef]
  21. Basaglia, B.M.; Li, J.; Shrestha, R.; Crews, K. Response Prediction to Walking-Induced Vibrations of a Long-Span Timber Floor. J. Struct. Eng. 2021, 147, 04020326. [Google Scholar] [CrossRef]
  22. Hu, L.J. Prediction of Vibration Responses of Ribbed Plates by Modal Synthesis. Ph.D. Thesis, University of New Brunswick, Fredericton, NB, Canada, 1992. [Google Scholar]
  23. Eriksson, P.E. Vibration of Low-Frequency Floors-Dynamic Forces and Response Prediction. Ph.D. Thesis, Chalmers University of Technology, Gothenburg, Sweden, 1994. [Google Scholar]
  24. Weckendorf, J.; Zhang, B.; Kermani, A.; Reid, D. Finite element modeling of I-joist timber flooring systems to predict modal frequencies, modal shapes and static point load deflections. In Proceedings of the 11th World Conference on Timber Engineering (WCTE), Trentino, Italy, 20–24 June 2010. [Google Scholar]
  25. Glisovic, I.; Stevanovic, B. Vibrational behavior of timber floors. In Proceedings of the 11th World Conference on Timber Engineering (WCTE), Trentino, Italy, 20–24 June 2010. [Google Scholar]
  26. Shen, Y.L.; Zhou, H.B.; Xue, S.; Zhang, J.C. A Comparison on Numerical Simulation Models for Vibrational Performances of the Wood Truss Joist Floor System. Shock Vib. 2021, 2021, 5560554. [Google Scholar]
  27. International Organization for Standardization. Timber Structures-Test Methods-Floor Vibration Performance; ISO18324; ISO: Geneva, Switzerland, 2016. [Google Scholar]
  28. ASTM. ASTM2126. Standard Test Methods for Cyclic (Reversed) Load Test for Shear Resistance of Walls for Buildings; ASTM: West Conshohocken, PA, USA, 2011. [Google Scholar]
  29. CEN. EN12512 Timber Structures-Test Methods-Cyclic Testing of Joints Made with Mechanical Fasteners; CEN: Brussels, Brussels, 2001. [Google Scholar]
  30. Yasumura, M.; Kawai, N. Estimating seismic performance of wood-framed structures. In Proceedings of the World Conference on Timber Engineering (WCTE), Montreux, Switzerland, 17–20 August 1998; pp. 564–571. [Google Scholar]
  31. Commonwealth Scientific and Industrial Research Organization (CSIRO). Timber Evaluation of Mechanical Joint Systems-Part 3, Earthquake Loading; CSIRO: Melbourne, Australia, 1996. [Google Scholar]
  32. Karacabeyli, E.; Ceccotti, A. Quasi-static reversed cyclic testing of nailed joints. In Proceedings of the International Council for Building and Research Studies and Documentation Working Commission W18-Timber Structure, Vancouver, BC, Canada, 26–29 August 2013. [Google Scholar]
  33. Shen, Y.; Schneider, J.; Tesfamariam, S.; Stiemer, S.F.; Chen, Z. Cyclic behavior of bracket connections for cross-laminated timber (CLT): Assessment and comparison of experimental and numerical models studies. J. Build. Eng. 2021, 39, 102197. [Google Scholar] [CrossRef]
  34. The Engineered Wood Association. Minimizing Floor Vibrations by Design and Retrofit; Technical Note 70; APA: Tacoma, WA, USA, 2004. [Google Scholar]
  35. Ellingwood, B.; Tallin, A. Structural serviceability-floor vibrations. J. Struct. Eng. 1984, 110, 401–418. [Google Scholar] [CrossRef]
Figure 1. Sketch map of wood truss joist floor system.
Forests 12 01493 g001
Figure 2. Dimensions of single truss joist.
Forests 12 01493 g002
Figure 3. Connection details for the wood truss joist floor: (a) edge joists connecting to the framing walls; (b) the end of the joist connecting to the framing walls.
Forests 12 01493 g003
Figure 4. Vibration mode and frequency tests.
Forests 12 01493 g004
Figure 5. Distributions of the loading points (a) and monitoring points (b).
Forests 12 01493 g005
Figure 6. Walking direction and path: (a) perpendicular to the joist direction (W path); (b) parallel to the joist direction (L path).
Forests 12 01493 g006
Figure 7. Spring models for the metal plate connections (a) and the screwed connections (b).
Forests 12 01493 g007
Figure 8. Numerical modeling and test results for a single wood truss joist.
Forests 12 01493 g008
Figure 9. Floor shape model with three rows of strongbacks.
Forests 12 01493 g009
Figure 10. Fundamental frequencies obtained from the experiment and the models.
Forests 12 01493 g010
Figure 11. First three mode shapes obtained from the experiment (a) and the models (b).
Forests 12 01493 g011
Figure 12. Experimental and modeled results of deflections of Floor A under W series point loading.
Forests 12 01493 g012
Figure 13. Experimental and modeled results of deflections of Floor B under W series point loading.
Forests 12 01493 g013
Figure 14. Experimental deflections at measurement point when floor center as loading point.
Forests 12 01493 g014
Figure 15. Predicted deflections at measurement point when floor center as loading point.
Forests 12 01493 g015
Figure 16. Experimental and modeled maximum displacement at floor center.
Forests 12 01493 g016
Figure 17. Single footstep function.
Forests 12 01493 g017
Figure 18. Walking direction and path: (a) perpendicular to the joist direction (W path); (b) parallel to the joist direction (L path).
Forests 12 01493 g018
Figure 19. Acceleration responses at points A for Floor A: (a) W path and (b) L path.
Forests 12 01493 g019
Figure 20. Acceleration responses at points A for Floor B: (a) W path and (b) L path.
Forests 12 01493 g020
Figure 21. Acceleration responses at points A for Floor D: (a) W path and (b) L path.
Forests 12 01493 g021
Figure 22. Tested and simulated peak acceleration at points A for the floors: (a) W path and (b) L path.
Forests 12 01493 g022
Figure 23. Displacement responses at points A for tested floors: (a) W path and (b) L path.
Forests 12 01493 g023
Figure 24. Simulated peak displacement at points A for the floors.
Forests 12 01493 g024
Figure 25. Acceleration responses at points B for Floor B: (a) W path and (b) L path.
Forests 12 01493 g025
Figure 26. Displacement responses at points B for tested floors: (a) W walking path and (b) L walking path.
Forests 12 01493 g026
Figure 27. Simulated peak acceleration at points B for different floors.
Forests 12 01493 g027
Figure 28. Simulated peak displacement at points B for different floors.
Forests 12 01493 g028
Table 1. Tested and modeled floors with different configurations.
FloorJoist SpacingSheathing
Thickness
Strongback ConfigurationTestModeling
A400 mm15 mmNone
B400 mm15 mmOne strongback row at mid-span
C400 mm15 mmTwo strongback rows at mid-span
D400 mm15 mmOne strongback row at mid-span and one strongback row at one-third of the span
E400 mm15 mmTwo strongback rows at mid-span and one strongback row at one-third of the span
Table 2. Connections parameters for sheathing-to-joist connections.
Type of ConnectionsDirectionsDisp1
(m)
Load 1
(N)
Stiffness
(kN/m)
Single-shear screwed
OSB panel connections
OSB minor axis (shear)0.001807807
OSB major axis (shear)0.001863863
Table 3. Connections parameters for metal plate connections.
Type of ConnectionsDirectionsDisp1
(m)
Load 1
(N)
Stiffness
(kN/mm)
Metal plate connectionsMajor axis (shear)0.000158550034.80
Minor axis (tension)0.000158900056.96
Table 4. Model parameters of the engineered wood materials.
ItemsSPF TrussSPF StrongbackOSB SheathingLVL Rim Board
EL [MPa]87009000428013000
ER [MPa]66087020801000
ET [MPa]40071020801000
GLR [MPa]5006001000700
GLT [MPa]50060050700
GRT [MPa]53305760
μLR0.430.030.150.335
μLT0.470.20.30.03
μRT0.20.430.150.466
ρ [kg/m3]560540650600
Table 5. Frequencies of the first three modes in the tests.
FloorF1 (Hz)F2 (Hz)F3 (Hz)
A1517.821
B14.818.823.4
C1518.825.3
D1520.125.4
E1520.627.4
Publisher’s Note: MDPI stays neutral with regard to jurisdictional claims in published maps and institutional affiliations.

