Article

Defoliation, Recovery and Increasing Mortality in Italian Forests: Levels, Patterns and Possible Consequences for Forest Multifunctionality

1
Department of Agriculture, Food, Environment and Forestry (DAGRI), University of Firenze, 50142 Firenze, Italy
2
Arma dei Carabinieri, Comando per la Tutela della Biodiversità e dei Parchi, 00187 Roma, Italy
*
Author to whom correspondence should be addressed.
Forests 2021, 12(11), 1476; https://doi.org/10.3390/f12111476
Submission received: 14 September 2021 / Revised: 23 October 2021 / Accepted: 25 October 2021 / Published: 28 October 2021

Abstract

:
Forest health and multifunctionality are threatened by global challenges such as climate change. Forest health is currently assessed within the pan-European ICP Forests (International Co-operative Programme on Assessment and Monitoring of Air Pollution Effects on Forests) programme through the evaluation of tree crown conditions (defoliation). This paper analyses the results of a 24-year assessment carried out in Italy on 253 permanent plots distributed across the whole forested area. The results evidenced a substantial stability of crown conditions at the national level, according to the usual defoliation thresholds Defoliation > 25% and Defoliation > 60%, albeit with species-specific patterns. Within this apparent temporal stability, an increased fraction of extremely defoliated and dead trees was observed. Extreme defoliation mostly occurred in years with severe summer drought, whereas mortality was higher in the years after the drought. The results for singular species evidenced critical conditions for Castanea sativa Mill. and Pinus species, whereas Quercus species showed a progressive decrease in defoliation. Deciduous species, such as Fagus sylvatica L., Ostrya carpinifolia Scop. and Quercus pubescens Willd. suffer the loss of leaves in dry years as a strategy to limit water loss by transpiration but recover their crown in the following years. The recurrence of extreme heat waves and drought from the beginning of the XXI century may increase the vulnerability of forests, and increased tree mortality can be expected in the future.

1. Introduction

Crown defoliation is the most widespread parameter to assess the health and vitality of forest trees in worldwide monitoring programmes [1]. Defoliation is an unspecific parameter, integrating the intrinsic genetic variability of trees, site effects (soil fertility, climatic features, structure and composition of the forest stand) and external factors such as abiotic and biotic stresses [2,3]. The real significance of defoliation and its consequences on physiological functioning and growth, however, is not clear, although several studies have addressed this issue, often reaching contrasting results [4,5,6,7,8]. Defoliation is not necessarily equivalent to physiological damage and can be considered indicative of the dynamic equilibrium of a tree in its own environment, and we assume that the physiological responses may depend not only on the levels of defoliation itself, but also on year-by-year differences and species-specific strategies to cope with stress. The levels and fluctuation of tree defoliation at European levels are published and commented yearly in the ICP Forests Reports [9].
In recent years, attention was devoted to increased tree mortality at the world level, as a complex phenomenon connected to climate change [10,11]. Tree mortality is an essential ecological function that regulates the demographic processes within populations and communities [12,13]. In non-disturbed conditions, tree mortality is a consequence of competition processes and ageing, while occasional forest disturbances, such as fire, windstorms and droughts, and their combination can promote large-scale tree mortality [14]. Tree mortality induces dynamic changes in the structure and composition of forest stands, allowing the maintenance of the diversity and efficiency of forests and assuring in the long period their multifunctionality and provision of ecosystem services.
Climate change is expected to increase the rate of tree mortality and canopy dieback through the recurrence of catastrophic events (extreme heat and drought waves, windstorms, etc.) that weaken trees, making them vulnerable to the attacks of pests or fungal diseases that often represent the ultimate cause of tree death [15,16]. Widespread crown defoliation and mortality affect ecosystem functions and services at different levels: provisioning (loss of forest products), regulating (climate and water regulation) and cultural services (changes in landscape features and perception), as well as a loss of biodiversity and change in specific composition in the understorey and at the soil level.
Mitigation and recovery strategies require measures of proactive silviculture, including a controlled substitution of species according to the principles of assisted migration [17]. In this perspective, it is necessary to know the incidence over time of tree mortality. Tree mortality is assessed with remote sensing and terrestrial surveys, namely national forest inventories and the European transnational monitoring network ICP Forests [11]. Open questions concern the definition of tree mortality, which includes standing dead trees as well uprooted and fallen individuals, but sometimes also trees removed for phytosanitary purposes or planned forest interventions, according to the current definition adopted in the ICP Forests monitoring programme. Conifer trees with all dry leaves can be considered dead, but in many broadleaved species, death is not always a univocal event. Deciduous species may wilt and shed their leaves as a strategy to avoid summer drought, and then later restore their photosynthetic apparatus [18], whereas in other cases they can resprout by dormant buds [19], thus replacing the dead canopy. Another question concerns the temporal repetition of the investigation. Surveys carried out at pluriannual intervals, such as forest inventories, may underestimate the mortality that occurred during the interval between surveys. Yearly surveys on a common sample of trees [20] allow not only the detection of the actual annual rate of tree mortality, but also knowledge of the conditions of trees before death, the causes, as well the possible recovery of partial or completely defoliated (but not dead) trees.
Italian forests have great ecological and climatic variability, including Mediterranean, temperate and alpine regions, each of them with different specific compositions and different sensitivities to climatic and pathological stress. Climate changes and the occurrence of extreme events may have different characteristics in the various climatic and forest regions, but some common traits have been recognised [21,22,23,24]. A progressive increase in temperatures was registered in Italy from the 1980s. The overall precipitation on an annual basis showed no significant trends, but the distribution changed with a decrease in the rainy days and an increase in the intensity of precipitation for each rainy event. Moreover, an increase in springtime aridity and the frequency of extreme climatic events were also observed, including heat and drought waves and windstorms. In recent decades, the most important events were the dry spells in 2003 [25], 2008–2010 [26], 2012 [27,28] and 2017 [29] and the windstorm “Vaia” that affected the alpine regions in 2018 [30]. Many stress factors and their interactions are therefore implied in defoliation and mortality. Defoliation, as assessed in the ICP Forests pan-European programme, is considered a good predictor for tree mortality by [31].
In this paper, we analyse the patterns of defoliation and mortality, and possible causes, in Italian forests. We aimed to verify: (i) the background levels of tree mortality and possible increasing mortality over the years; (ii) the relationships between defoliation and mortality; and (iii) the possible processes of recovery after extreme defoliation events or, in other words, if extreme defoliation triggers an irreversible process leading to mortality. Our goal is to verify the usefulness of long-term surveys for the management of forests aimed at the maintenance of ecosystem services.

2. Materials and Methods

2.1. Dataset

The dataset refers to the Italian Level I network for crown condition assessment, consisting of 253 plots distributed across the country, on a 15 × 18 km grid with a mean of about 5000 trees each year, during the period 1997–2020. Standardised methods and common protocols were used for the field surveys [32,33,34]. Defoliation was evaluated according to a proportion scale in 5% intervals (0 = no defoliation; 5; 10; 15 … 100% = dead tree) by comparing the sampled trees with photographic standards of reference trees for the main forest species (i.e., photoguide method [35,36]). Dead trees (standing, fallen and uprooted trees) were no longer evaluated in the years following their death, so the values presented here are the actual yearly mortality (the death that occurred in the year before the survey). Yearly surveys were carried out during the summer months. Field crews were trained before each yearly assessment for comparability and repeatability of the scores [37,38].
The whole sampled population includes more than 60 species, but 80% of trees fall within 10 main tree species: 6 broadleaved (Fagus sylvatica L., Quercus pubescens Willd., Quercus cerris L., Castanea sativa Mill., Ostrya carpinifolia Scop., Quercus ilex L.) and 4 conifers (Picea abies (L.) Karst., Larix decidua L., Pinus sylvestris L. and Pinus nigra Arn.). The mean number of trees for each species is listed in Table 1.
Fagus sylvatica and C. sativa are (more or less) evenly distributed in all the country, whereas other species have a prevalent regional distribution: Q. cerris and Q. pubescens in central and southern regions; O. carpinifolia in northern and central regions; and Quercus ilex in the Mediterranean areas. Among conifers, Picea abies, Larix decidua and Pinus sylvestris are concentrated in the northern, alpine regions (Figure S1), whereas the distribution of P. nigra is irregular and depends on afforestation programs with the two subspecies P. nigra subsp. nigra and P. nigra subsp. laricio.

2.2. Data Analysis

The analyses of defoliation data were carried out by considering the percent of living trees beyond the following defoliation classes: Def ≤ 25% (no or light defoliation); Def > 25% (moderate); Def > 60% (severe); Def > 85% (extreme). Dead trees (Def = 100%) were considered in a separate class. The results are reported as temporal trends whose significances were calculated according to the Spearman coefficient of correlation (r). Levels of significance (p) are reported for p < 0.05 (significant), p < 0.01 (very significant) and p < 0.001 (highly significant). Ns = not significant.

3. Results and Discussion

3.1. Overall Results

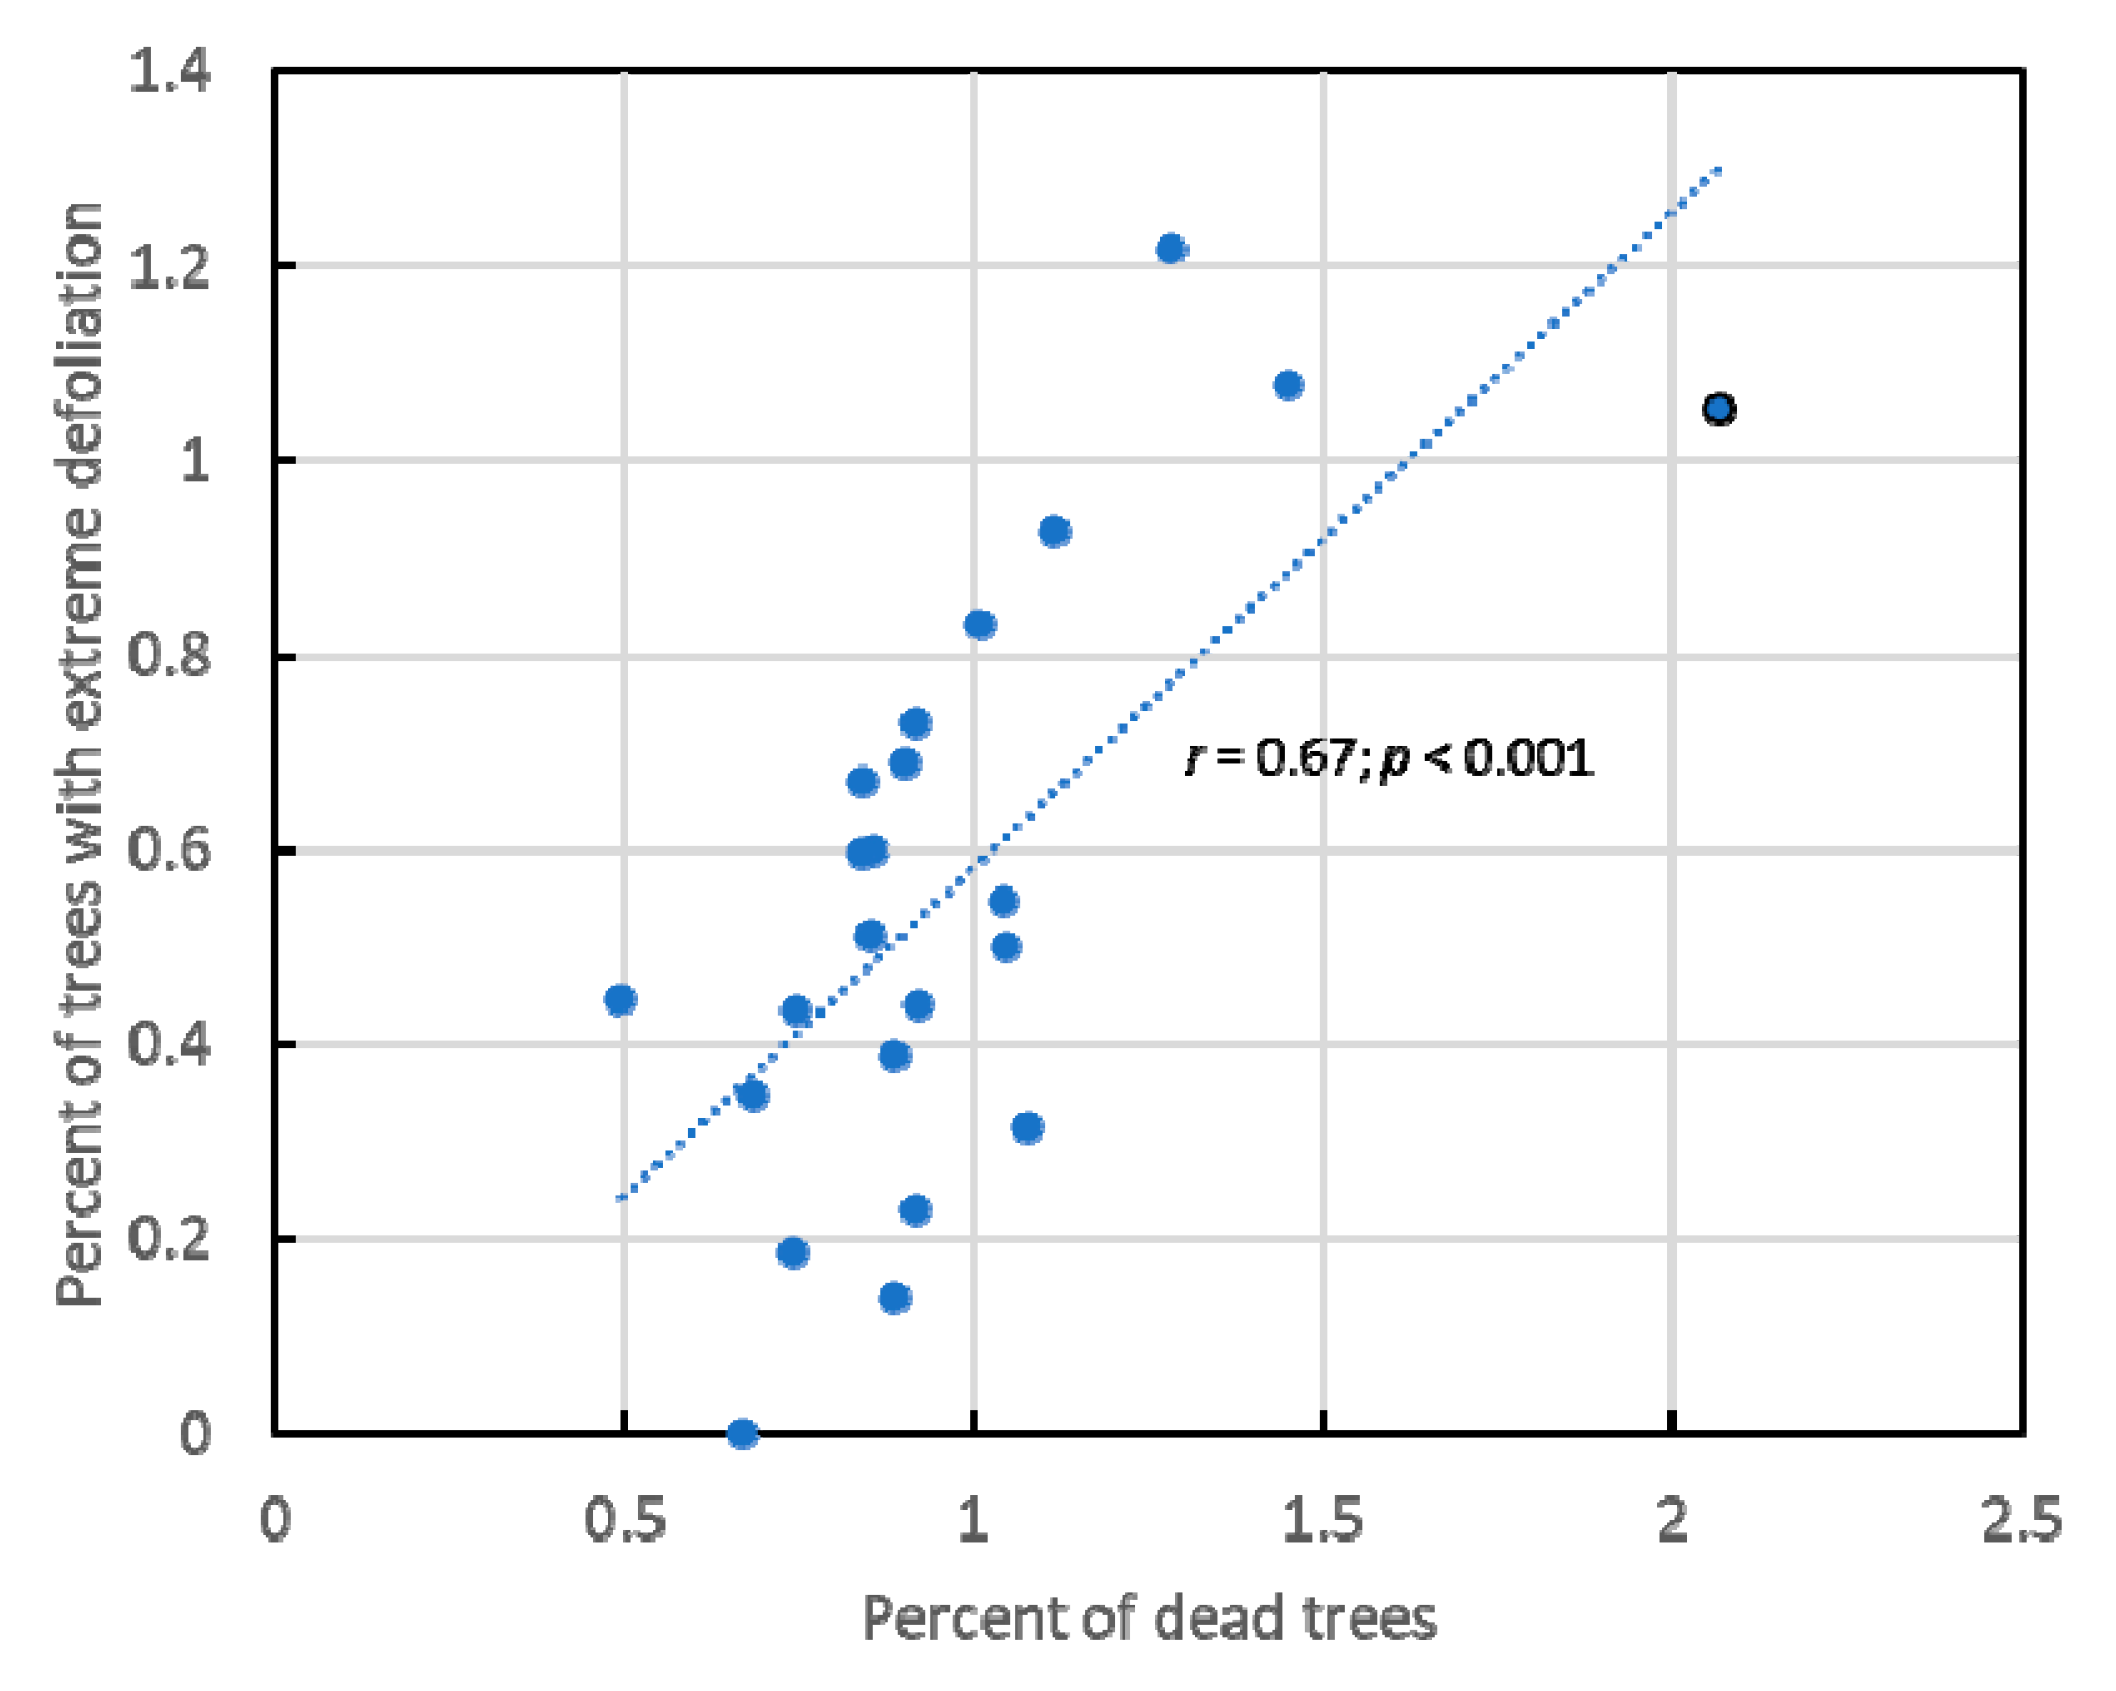
The temporal patterns of defoliated and severely defoliated trees (Def > 25 and Def > 60%, excluding dead trees) are not significant (Figure 1A), although the trees with Def > 25% (33.6% average in the 1997–2020 period) show a slightly decreasing trend (p < 0.1). The percent of trees with Def > 60% (4.06% average in the 1997–2020 period) shows a peak in the year 2017 (6.31%), corresponding to the extreme drought and heat wave occurring in this year in Italy [39,40,41]. There is a positive significant trend concerning the increase in trees with extreme defoliation (Def > 85%) and mortality (Def 100%) (Figure 1B). The average rate of extremely defoliated trees for the whole period was 0.96%, with a peak of 2.06 in 2017; mortality (24-years average: 0.57%) increased in subsequent years (2018: 1.05%; 2019: 1.07%), peaking in 2020 (1.21%). Secondary peaks of mortality in the years 2009–2010 occurred after the heat and drought events in 2008 [26]. No significant correlations were found between crown defoliation (for any defoliation threshold) and mortality during the same year, but there was a highly significant correlation (r = 0.67, p > 0.001) between mortality and the rate of extremely defoliated (but not dead) trees the year before (Figure 2).
The average levels of mortality are comparable with those reported in the literature. Bertini et al. [42] found, in Italian NFI (National Forest Inventories), that mortality rates by number of trees and by volume (m3 ha−1 y−1) amounted on average to 1.35% and 0.51%, respectively. Neumann et al. [43], analysing the data from the ICP Forests Level I network, found that the mean yearly mortality rate over Europe for the period 2000–2012 was 0.50% with differences among eco-regions, ranging from 0.31% in Central-Western Europe to 1.39% in South-Western Europe. In Switzerland, Etzold et al. [44] analysed over one century of data from forest inventories and found that the long-term average annual mortality rate was 1.5%, with differences between species, tree size and ecoregions, with no significant trends to increase in mortality except for Pinus sylvestris L. at low elevations.
Recurrent drought and heat waves are responsible for widespread tree mortality across biomes and climatic regions in the world [15,45,46]. Senf et al. [47], analysing high-resolution annual satellite-based canopy mortality maps across continental Europe from 1987 to 2016, observed that forest mortality was significantly related to drought, and concluded that, overall, drought caused approximately 500,000 ha of excess forest mortality in the same period. Regional impacts leading to crown dieback and mortality were described both for Mediterranean Europe [40,48,49] and Central European countries [50,51]. Delayed tree mortality, as observed in our study, is a phenomenon described in relation to fire and drought impacts [52,53], and it is supposed to be related to carbon starvation as a consequence of the altered pattern on carbon allocation [54].
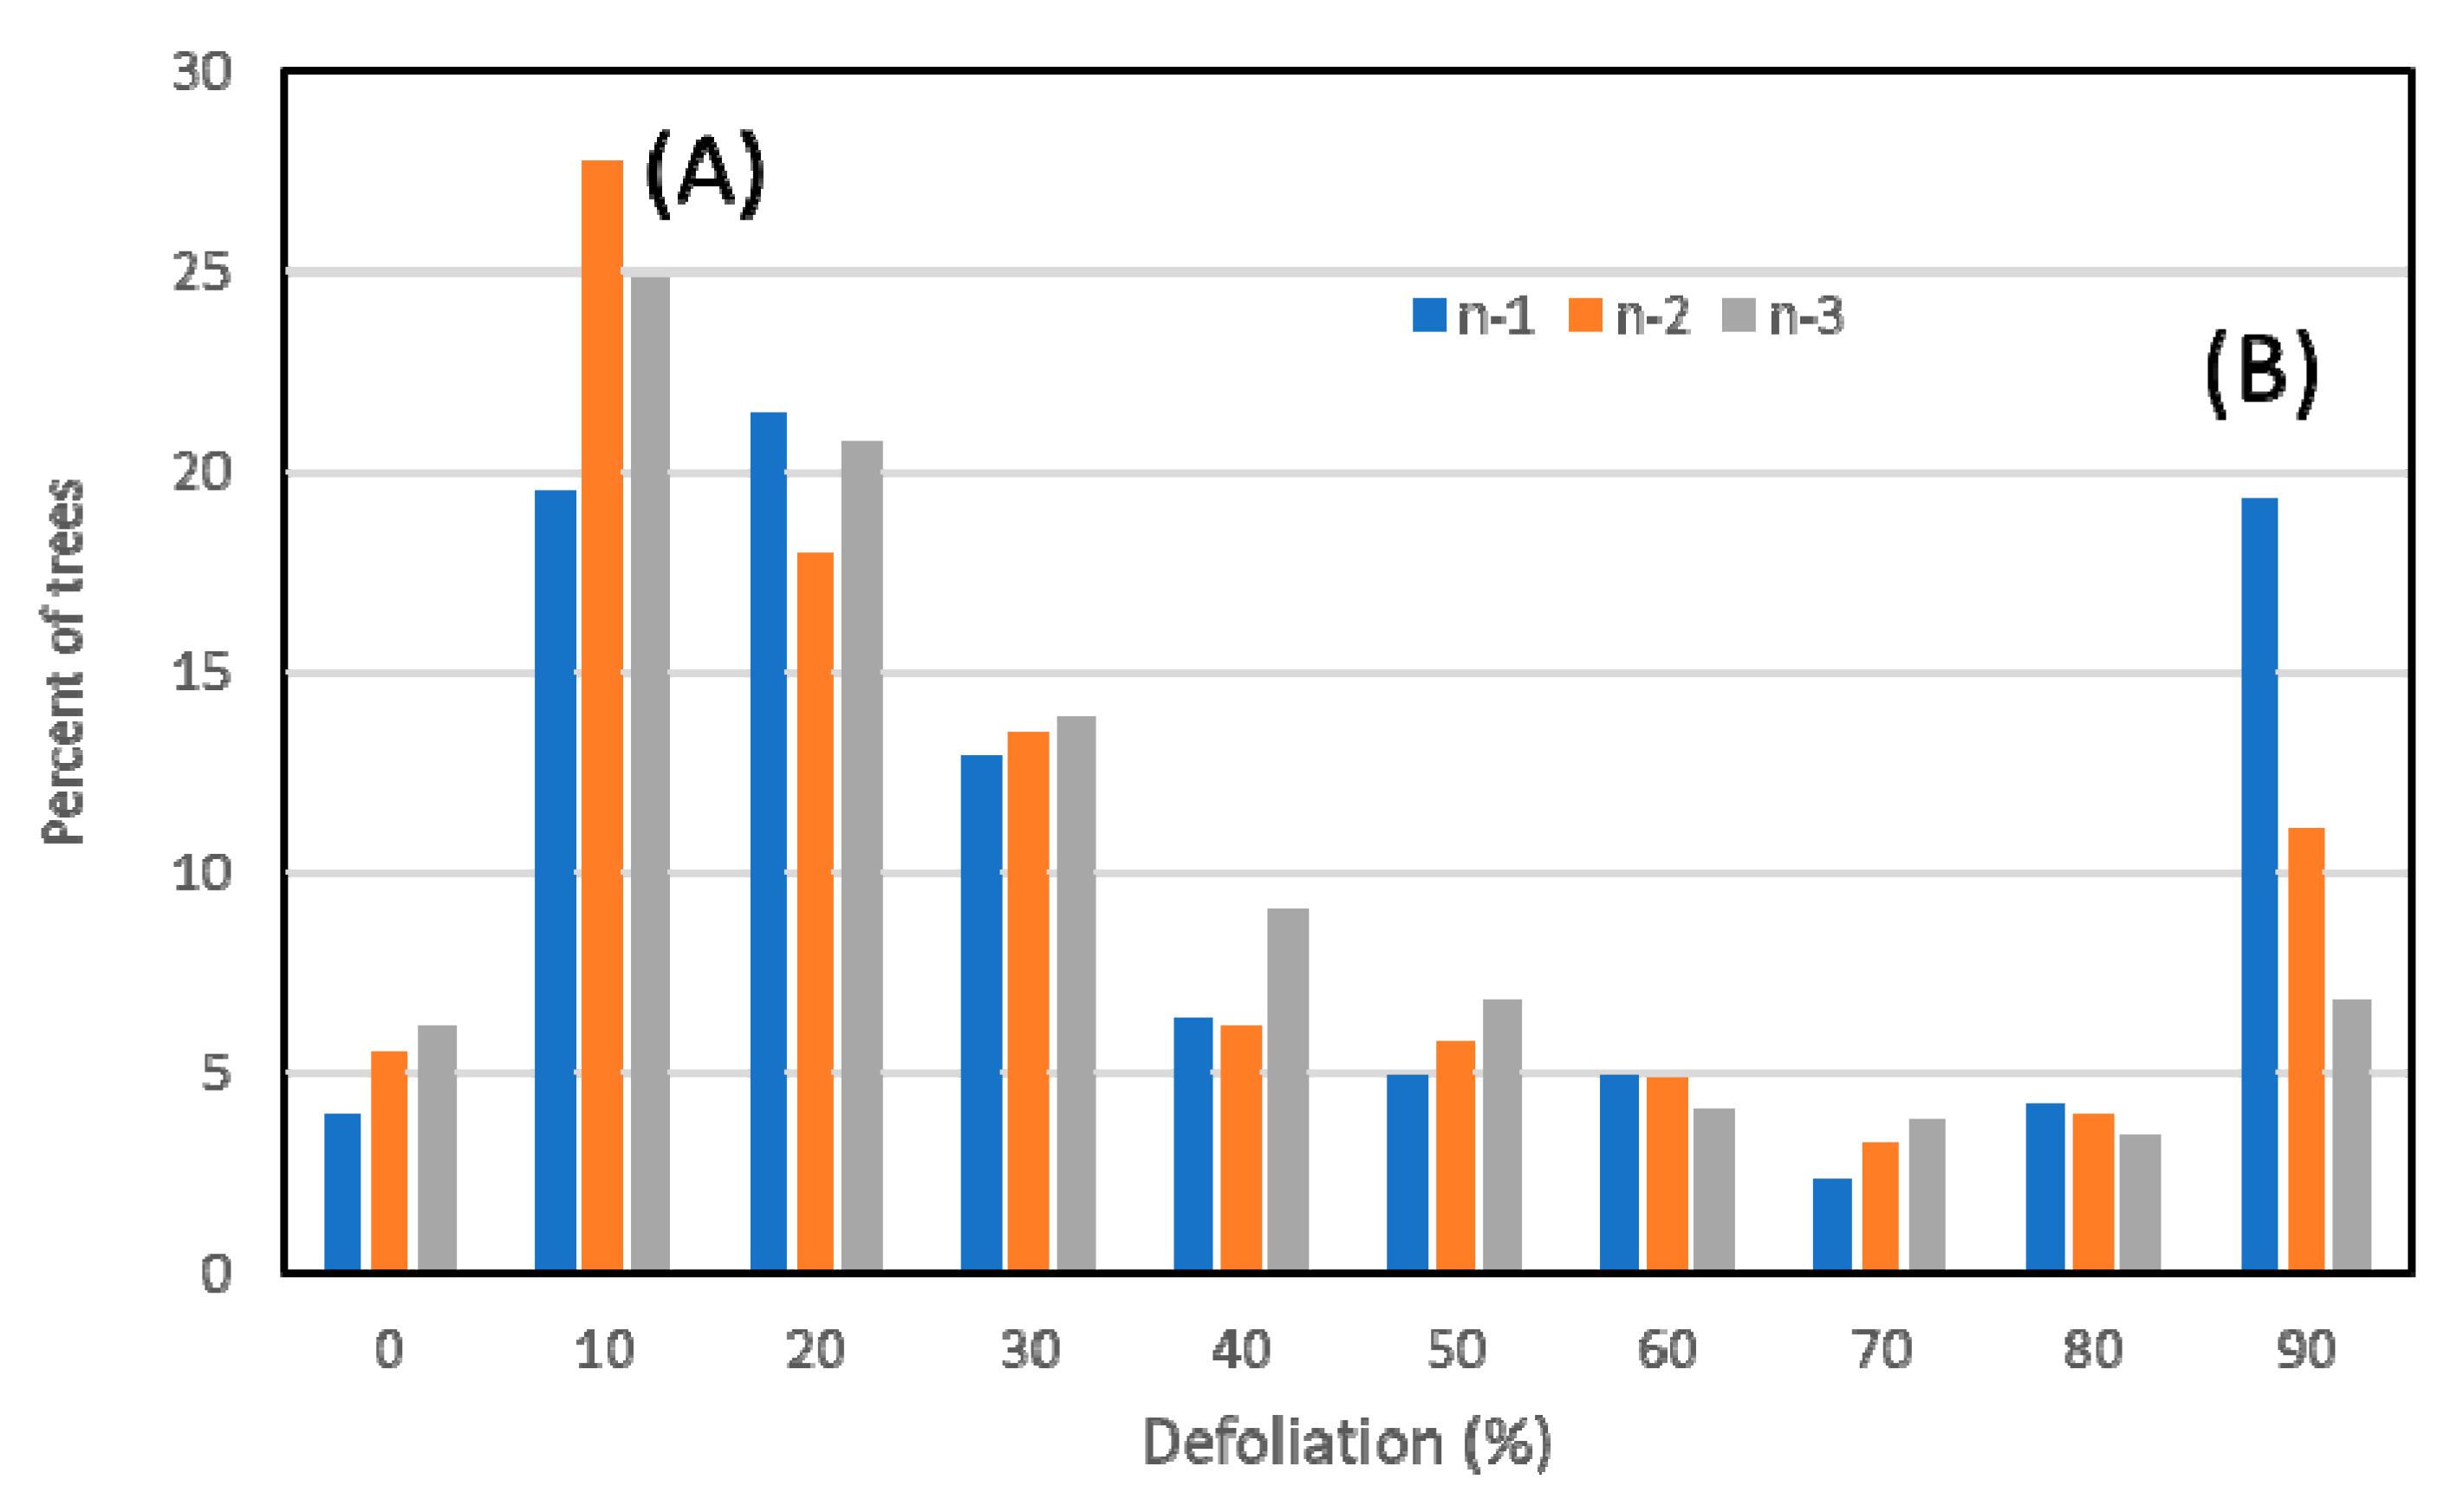
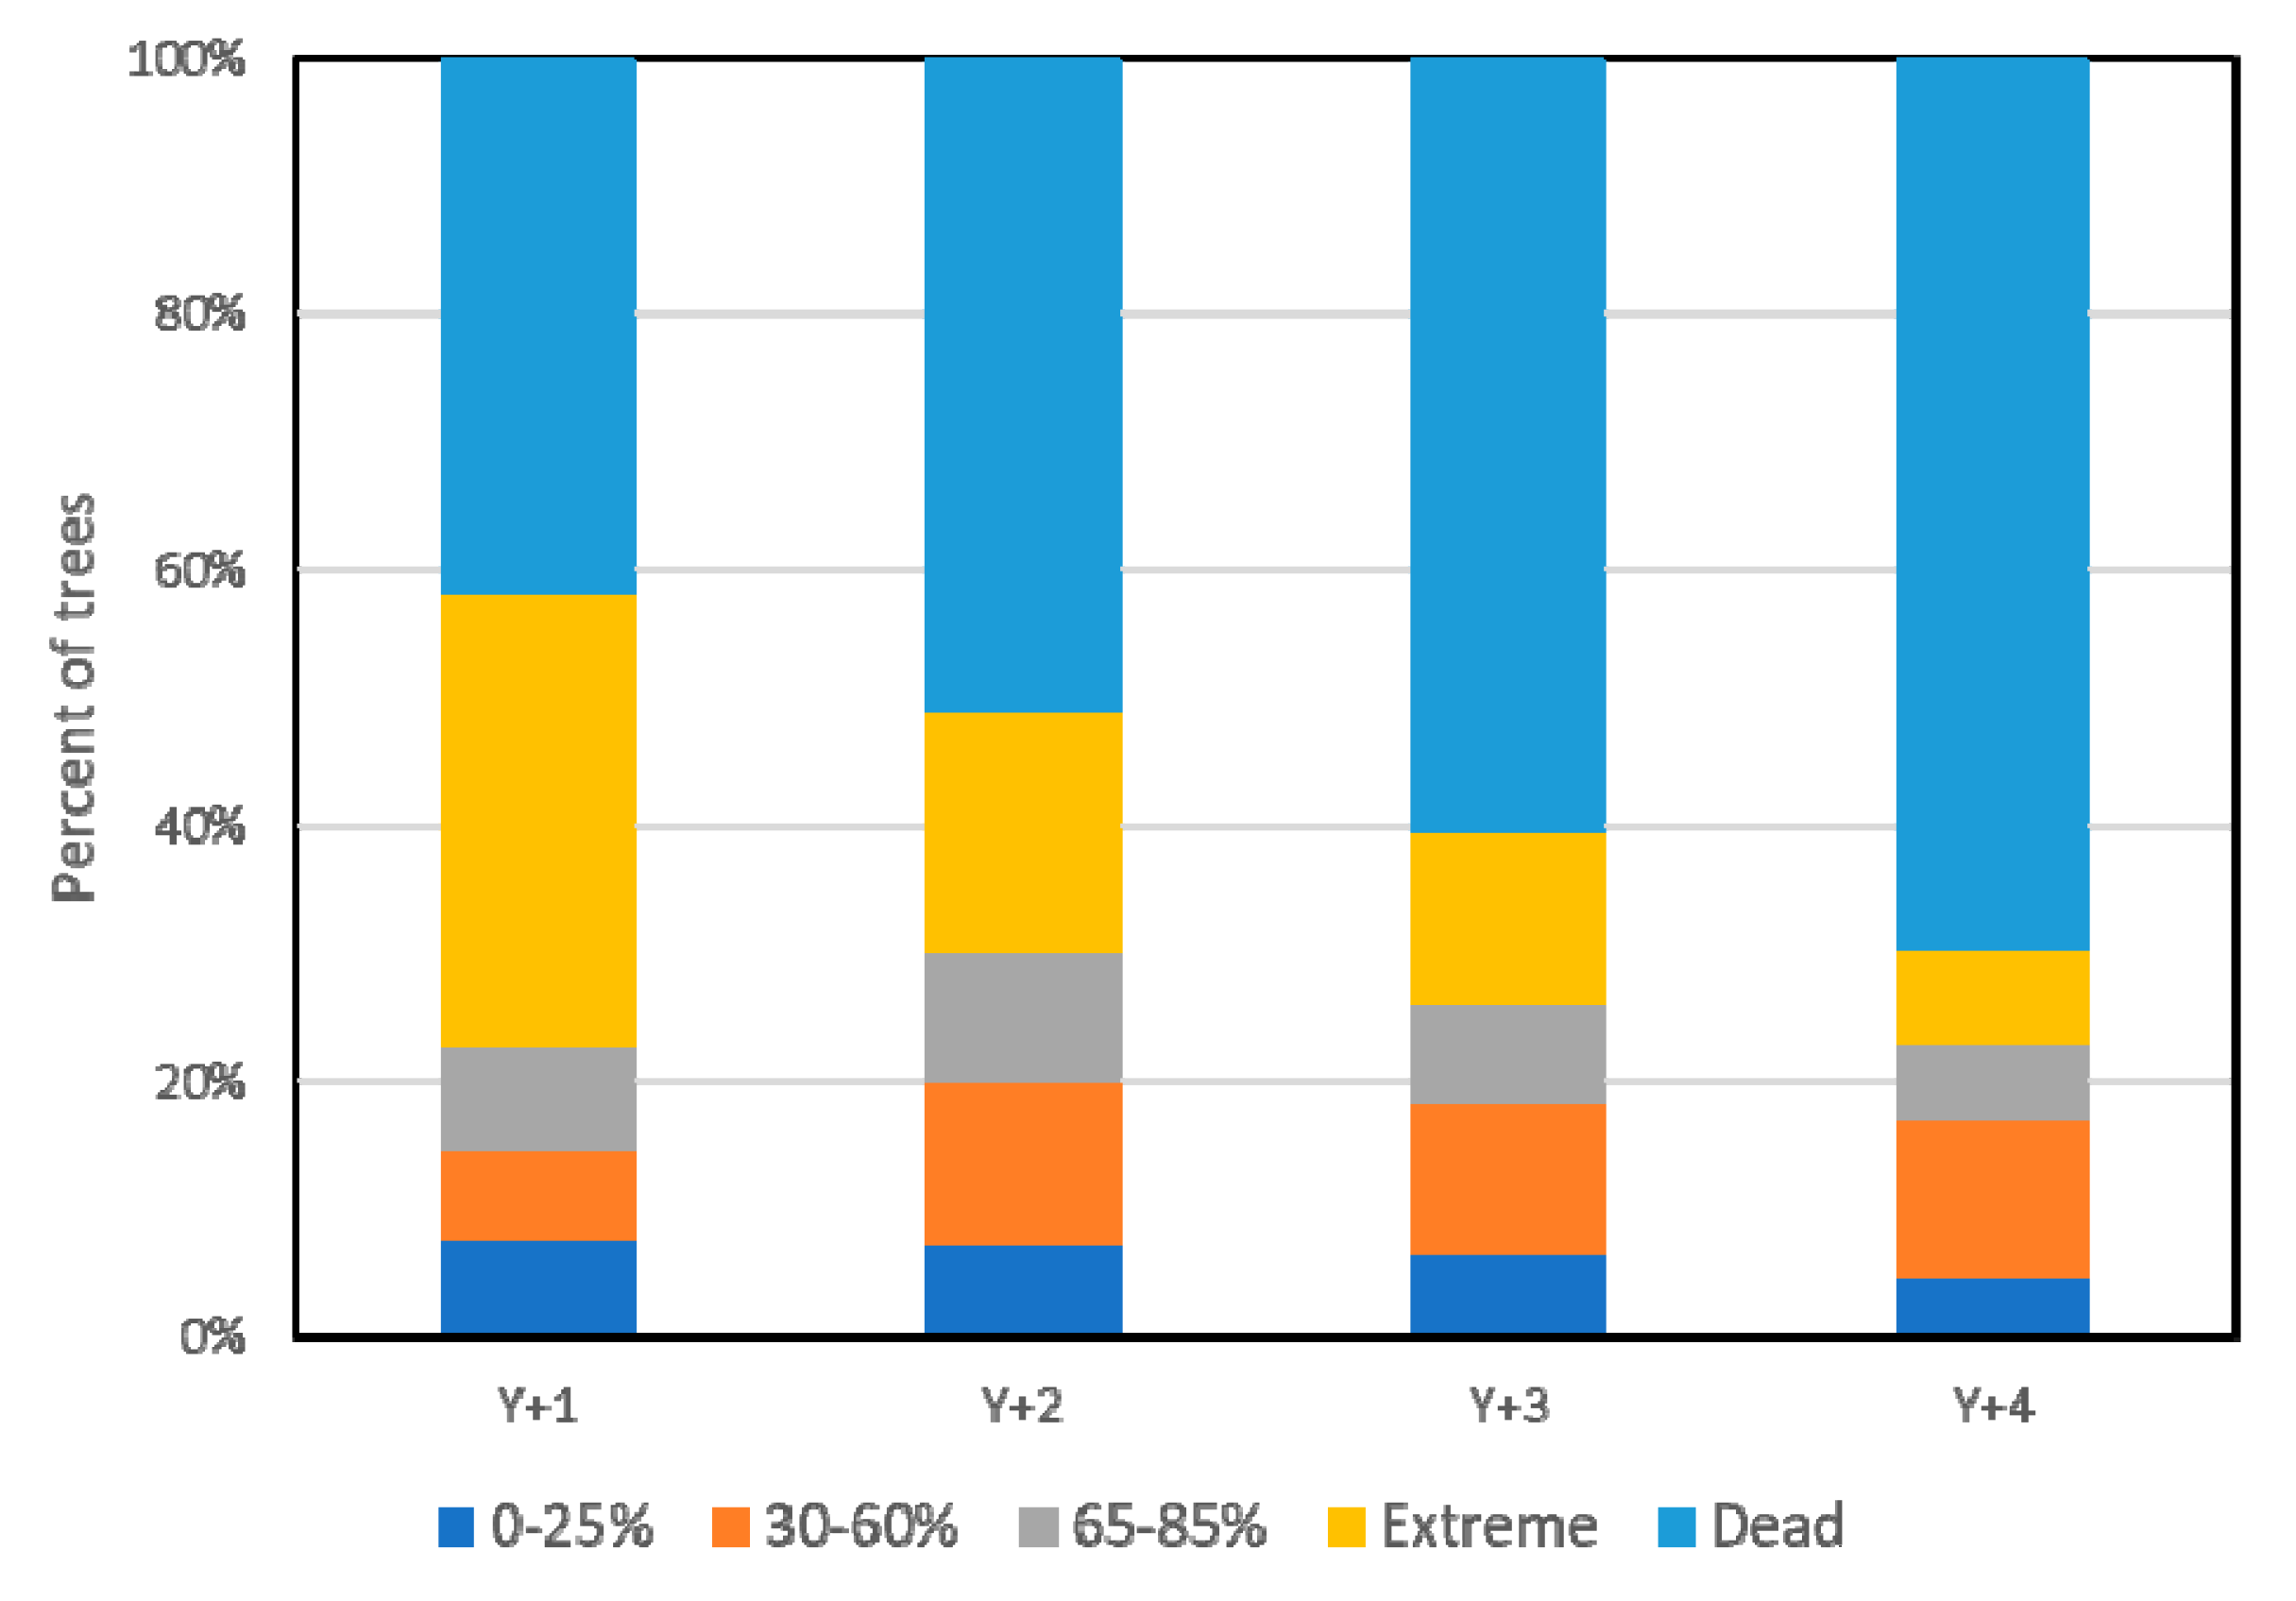
The conditions of trees in the years before their death can be assessed on the ICP Forests network. The levels of defoliation of trees in the 3 years before death are shown in Figure 3. Two groups of trees are recognisable: one group (A) shows low defoliation until a sudden death; the second group’s (B) levels of defoliation increase progressively. These behaviours can be connected to two distinct mortality patterns: death may be a consequence of specific sudden disturbances (for example, insect attacks, windstorms, etc.) on low-defoliated trees in group A or, alternatively, it may indicate a progressive decline until death (high defoliation before death) in group B. Trees with extreme defoliation (Def. > 85%) died in 38% of cases after one year and 70% after four years (Figure 4). However, a portion of trees (4 and 17%) showed light (<30%) and moderate (<65%) defoliation, respectively, after 4 years.

3.2. Results Per Species

The distribution of tree species reflects the different climatic and ecological regions (alpine, temperate, Mediterranean); therefore, defoliation (level and trend) can vary in relation to the intensity of impacts and sensitivity of different species. The levels of defoliation and mortality averaged for the whole assessment period (1997–2020) are shown in Table 1. The patterns of defoliation, i.e., the significance of the trends over the assessment period (1997–2020), are reported in Table 2. The pattern of each species is reported in detail in Supplementary Materials Figure S2.
Among broadleaves, C. sativa is the most defoliated species for any considered threshold, as well that with the highest mortality rates (1.08% per year). The trends are significantly positive (p < 0.001) for each threshold and mortality. High defoliation and mortality rates on C. sativa are connected to the phytopathologies affecting this species, including the attack of the Asian wasp Dryocosmus kuriphilus Yasumatsu in recent years [55]. In C. sativa, the ratio between dead and extremely defoliated trees is quite low.
Oak species show different defoliation levels. Q. pubescens shows high defoliation at the Def > 25% and Def > 60% threshold, whereas Q. cerris has low defoliation but high mortality. The ratio between dead and extremely defoliated trees is high for Q. cerris, indicating that trees with low defoliation levels are also susceptible to death. This behaviour can be related to the so-called “oak decline”, a complex phenomenon triggered by drought and fungal infection both in Central and Southern Europe [56] and also described in Italy [57,58]. Low levels of defoliation and mortality have been detected on Q. ilex. All the three Mediterranean oak species, both deciduous (Q. pubescens and Q. cerris) and evergreen (Q. ilex), show a negative significant pattern, with decreasing defoliation over time for the thresholds Def > 25% (all oak species) and Def > 60% (Q. pubescens and Q. ilex).
Fagus sylvatica, the most widespread tree species, shows no significant trends for defoliation levels and mortality. Ostrya carpinifolia shows high values of defoliation (especially for the Def > 60% and Def > 85% thresholds) but low levels of mortality. In this latter species, the ratio between dead and extremely defoliated trees is very low (0.23). Ostrya carpinifolia, a shallow-rooted species living on steep slopes, sheds its leaves in the driest months of the year as a strategy to withstand drought. This behaviour was described on O. carpinifolia by Pollastrini et al. [6] in the forests of Central Italy.
The early loss of leaves was strongly accentuated during the 2017 summer drought, when in O. carpinifolia Def > 60% reached the peak of 10.8% and extreme defoliation reached the peak of 3%. Fagus sylvatica and Q. pubescens increased their levels of severe and extreme defoliation in 2017 (Def > 60%: 7.8% for F. sylvatica and 8.9% for Q. pubescens; extreme defoliation: 3.6% for F. sylvatica and 3.4% for Q. pubescens, respectively), with low values of the ratios between dead and extremely defoliated trees. These species recovered partially in the subsequent years (Figure S2).
Among conifers, P. sylvestris shows the highest levels of defoliation and mortality, with significant trends over time. The condition of this species reflects its decline in the regions at the southern slopes of the Alps [59,60,61]. As dry conditions increase, P. sylvestris tends to be replaced by Q. pubescens [62]. Pinus nigra has the highest ratio between dead and extremely defoliated trees, indicating mortality not connected to defoliation. This behaviour may be connected to the ageing and decline of past afforestation programmes [63]. Alpine conifers (P. abies and L. decidua) have low defoliation levels (Def > 25%). In P. abies, there is a significant trend to increasing defoliation (Def > 60%) and mortality, with a high ratio between dead and extremely defoliated trees, probably in relation to frequent biotic [64] and abiotic disturbances (windstorms [30]) causing relevant damage to conifer forests.

3.3. What Have We Learned?

The general conditions of the forests in Italy appear quite stable at the national level across time, despite the recurrent disturbances and extreme climatic events. This apparent stability, however, is the result of different and contrasting species- and site-specific patterns and behaviours, leading to the overall homeostatic capacity of the forests. Whereas some species, such as C. sativa and P. sylvestris, showed a sharp decline, the conditions of the most important species (F. sylvatica, Q. cerris, Q. pubescens) are stable or even improving according to the usual descriptors of tree health. This stability, however, is threatened by the drought events that in recent years induced an increase in defoliation.
Despite this apparent stability, an increasing fraction of extremely defoliated (Def > 85%) and dead trees is recognisable. Extreme defoliation and mortality are scattered events that may interest singular trees or groups of trees in response to a progressive decline or to sudden stress factors, on ecologically fragile sites and critical tree species. Such situations can expand as a consequence of recurring extreme climate events or new exotic invasive pests. Besides the case of C. sativa, the most critical conditions are those affecting the pinewoods (the mountain pines, P. sylvestris and P. nigra in this paper) and the Alpine conifers (P. abies).
The highest levels of mortality were recorded in the 2018–2020 period, i.e., delayed with respect to the year of the drought event (2017). Delayed mortality may be a consequence of the depletion of the reserves of carbon (NSC, non-structural carbohydrates), which reduces the ability of plants to cope with environmental conditions [65,66]. The restoration of carbon reserves may take several years [67], during which trees are vulnerable and potentially sensitive to additional stress factors in the near future. The increasing frequency of recurrent drought events [68,69,70,71] can trigger irreversible processes of forest decline that, although still localised, can involve an increasing fraction of trees. It is noticeable that in the last year of observation, 2020, the recovery is still partial for many species (Figure S2). Therefore, it is plausible to hypothesise increasing tree mortality in the following years.
It is noticeable that no anomalies in tree mortality were observed after the extremely dry summer in 2003, but mortality increased after the following events of 2008 and, especially, 2017. A singular event of extreme drought, therefore, may not be sufficient to trigger high tree mortality. Magno et al. [39] report that the 2017 event lasted several months, from November 2016 to October 2017. Moreover, the period of recurrence of drought events (each 4–5 years from the beginning of the century [39]) may be too short to allow the complete physiological recovery of the trees.

4. Conclusions

This 24-year study indicates that the increasing risks for the efficiency of forests can be represented by the rate of dead and extremely defoliated trees, whereas defoliation at the thresholds of Def > 25% or Def > 60% can reflect the acclimatisation of trees to the environmental conditions (including the presence of pests). In this view, the lowering levels of defoliation of xeric Mediterranean oak (both deciduous and evergreen) species may also be indicative of progressive acclimation. The current levels of mortality are not far from the background ones as reported from previous studies [42], but their increasing trend suggests more risks in the future. It is therefore necessary to continue and to improve the current monitoring programmes, enhancing their informative potential with the definition and application of more specific physiological indicators [72,73,74].
Open questions concern the assessment of relevant but localised events such as the impact of the extreme drought on Q. ilex and Mediterranean vegetation in Southern Tuscany in 2017 [40], and the assessment of the potential upcoming risks from alien invasive pests. Future studies require a comprehensive analysis of the environmental conditions that can increase the risks for forests, as well an approach that combines the current field-routine surveys with remote sensing and activities based on citizen science.

Supplementary Materials

The following are available online at https://www.mdpi.com/article/10.3390/f12111476/s1, Figure S1: Distribution of monitoring the plots in Italy (conifers, broadleaves, mixed), Figure S2: Patterns of defoliation of individual forest species.

Author Contributions

F.B.: conceptualisation, statistical analyses, writing original draft. E.C.: data curation, assistance in data acquisition in the field work. D.B.: data curation, assistance in data acquisition in the field work. G.I.: statistical analyses. M.P.: writing and editing. G.P.: coordination of the whole project. D.D.M., C.C. (Cristiana Cocciufa), C.C. (Claudia Cindolo): technical coordination of the project. All authors have read and agreed to the published version of the manuscript.

Funding

This research was funded and carried out within SMART4Action LIFE+ project “Sustainable Monitoring and Reporting to Inform Forest and Environmental Awareness and Protection” LIFE13 ENV/IT/000813.

Data Availability Statement

Data are available in the ICP Forests repository.

Acknowledgments

We are grateful to the personnel of Carabinieri Forestale for the collection of field data. Thanks to Giacomo Colle (Effetreseizero srl) for the re-organisation of the Level I-ICP Forests data for the Italian plots.

Conflicts of Interest

The authors declare no conflict of interest.

References

  1. Ferretti, M.; Fisher, R. Forest Monitoring, Methods for Terrestrial Investigations in Europe with an Overview of North America and Asia; Develop. Environ. Sci. 12 Series; Krupa, S., Ed.; Elsevier: Amsterdam, The Netherlands, 2013; p. 507. [Google Scholar]
  2. Iacopetti, G.; Bussotti, F.; Selvi, F.; Maggino, F.; Pollastrini, M. Forest ecological heterogeneity determines contrasting relationships between crown defoliation and tree diversity. For. Ecol. Manag. 2019, 448, 321–329. [Google Scholar] [CrossRef]
  3. Toïgo, M.; Nicolas, M.; Jonard, M.; Croisé, L.; Nageleisene, L.M.; Jactel, H. Temporal trends in tree defoliation and response to multiple biotic and abiotic stresses. For. Ecol. Manag. 2020, 477, 118476. [Google Scholar] [CrossRef]
  4. Gottardini, E.; Cristofolini, F.; Cristofori, A.; Camin, F.; Calderisi, M.; Ferretti, M. Consistent response of crown transparency shoot growth and leaf traits on Norway spruce (Picea abies (L.) H. Karst.) trees along an elevation gradient in northern Italy. Ecol. Ind. 2016, 60, 1041–1044. [Google Scholar] [CrossRef]
  5. Gottardini, E.; Cristofolini, F.; Cristofori, A.; Pollastrini, M.; Camin, F.; Ferretti, M. A multi-proxy approach reveals common and species-specific features associated with tree defoliation in broadleaved species. For. Ecol. Manag. 2020, 467, 118–151. [Google Scholar] [CrossRef]
  6. Pollastrini, M.; Feducci, M.; Bonal, D.; Fotelli, M.; Gessler, A.; Gossiord, C.; Guyot, V.; Jactel, H.; Nguyen, D.; Radoglou, K.; et al. Physiological significance of forest tree defoliation: Results from a survey in a mixed forest in Tuscany (central Italy). For. Ecol. Manag. 2016, 361, 170–178. [Google Scholar] [CrossRef]
  7. Tallieu, C.; Badeau., V.; Allard., D.; Nageleisen, L.M.; Bréda., N. Year-to-year crown condition poorly contributes to ring width variations of beech trees in French ICP level I network. For. Ecol. Manag. 2020, 465, 118071. [Google Scholar] [CrossRef]
  8. Ferretti, M.; Bacaro, G.; Brunialti, G.; Calderisi, M.; Croisé, L.; Frati, L.; Nicolas, M. Tree canopy defoliation can reveal growth decline in mid-latitude temperate forests. Ecol. Ind. 2021, 127, 107749. [Google Scholar] [CrossRef]
  9. Michel, A.; Prescher, A.K.; Schwärzel, K. Forest Condition in Europe: The 2020 Assessment. In ICP Forests Technical Report under the UNECE Convention on Long-Range Transboundary Air Pollution (Air Convention); Thünen Institute: Eberswalde, Germany, 2020. [Google Scholar]
  10. Hartmann, H.; Moura, C.F.; Anderegg, W.R.L.; Ruehr, N.K.; Salmon, Y.; Allen, C.D.; Arndt, S.K.; Breshears, D.D.; Davi, H.; Galbraith, D.; et al. Research frontiers for improving our understanding of drought-induced tree and forest mortality. New Phytol. 2018, 218, 15–28. [Google Scholar] [CrossRef] [Green Version]
  11. Hartmann, H.; Schuldt, B.; Sanders, T.G.M.; Macinnis-Ng, C.; Boehmer, H.J.; Allen, C.D.; Bolte, A.; Crowther, T.W.; Hansen, M.C.; Medlyn, B.E.; et al. Monitoring global tree mortality patterns and trends. Report from the VW symposium ‘Crossing scales and disciplines to identify global trends of tree mortality as indicators of forest health’. New Phytol. 2018, 217, 984–987. [Google Scholar] [CrossRef] [Green Version]
  12. Franklin, J.F.; Shugart, H.H.; Harmon, M.E. Tree death as an ecological process. BioScience 1987, 37, 550–556. [Google Scholar] [CrossRef]
  13. Harmon, M.E.; Bell, D.M. Mortality in Forested Ecosystems: Suggested Conceptual Advances. Forests 2020, 11, 572. [Google Scholar] [CrossRef]
  14. Anderegg, W.R.L.; Kane, J.M.; Anderegg, L.D.L. Consequences of widespread tree mortality triggered by drought and temperature stress. Nat. Clim. Chang. 2013, 3, 30–36. [Google Scholar] [CrossRef]
  15. Anderegg, W.R.L.; Hicke, J.A.; Fisher, R.A.; Allen, C.D.; Aukema, J.; Bentz, B.; Hood, S.; Lichstein, J.W.; Macalady, A.K.; McDowell, N.; et al. Tree mortality from drought, insects, and their interactions in a changing climate. New Phytol. 2015, 208, 674–683. [Google Scholar] [CrossRef]
  16. Das, A.J.; Stephenson, N.L.; Davis, K.P. Why do trees die? Characterizing the drivers of background tree mortality. Ecology 2016, 97, 2616–2627. [Google Scholar] [CrossRef] [PubMed]
  17. Bussotti, F.; Pollastrini, M.; Holland, V.; Brüggemann, W. Functional traits and adaptive capacity of European forests to climate change. Environ. Exp. Bot. 2015, 111, 91–113. [Google Scholar] [CrossRef]
  18. Rohner, B.; Kumar, S.; Liechti, K.; Gessler, A.; Ferretti, M. Tree vitality indicators revealed a rapid response of beech forests to the 2018 drought. Ecol. Ind. 2020, 120, 106903. [Google Scholar] [CrossRef]
  19. Zeppel, M.J.B.; Harrison, S.P.; Adams, H.D.; Kelley, D.I.; Li, G.; Tissue, D.T.; Dawson, T.E.; Fensham, R.; Medlyn, B.E.; Palmer, A.; et al. Drought and resprouting plants. New Phytol. 2015, 206, 583–589. [Google Scholar] [CrossRef]
  20. ICP-Forests. 30 Years of Monitoring the Effects of Long Range Transboudary Air Pollution on Forests in Europe and beyond. 2016. Available online: http://icp-forests.net/ (accessed on 10 July 2021).
  21. Brunetti, M.; Buffoni, L.; Mangianti, F.; Maugeri, M.; Nanni, T. Temperature, precipitation and extreme events during the last century in Italy. Glob. Plan. Chang. 2004, 40, 141–149. [Google Scholar] [CrossRef] [Green Version]
  22. Brunetti, M.; Maugeri, M.; Monti, F.; Nanni, T. Temperature and precipitation variability in Italy in the last two centuries from homogenised instrumental time series. Int. J. Clim. 2006, 26, 345–381. [Google Scholar] [CrossRef]
  23. Fratianni, S.; Acquaotta, F. The Climate of Italy. In Landscapes and Landforms of Italy; Soldati, M., Marchetti, M., Eds.; Springer: Cham, Switzerland; pp. 29–38.
  24. Bartolini, G.; Betti, G.; Gozzini, B.; Iannuccilli, M.; Magno, R.; Messeri, G.; Spolverini, N.; Torrigiani, T.; Vallorani, R.; Grifoni, D. Spatial and temporal changes in dry spells in a Mediterranean area: Tuscany (central Italy), 1955–2017. Int. J. Clim. 2021, 1, 1–22. [Google Scholar]
  25. Breda, N.; Huc, R.; Granier, A.; Dreyer, E. Temperate forest trees and stands under severe drought: A review of ecophysiological responses, adaptation processes and long-term consequences. Ann. For. Sci. 2006, 63, 625–644. [Google Scholar] [CrossRef] [Green Version]
  26. Fontana, G.; Toreti, A.; Ceglar, A.; De Sanctis, G. Early heat waves over Italy and their impacts on durum wheat yields. Nat. Hazards Earth Syst. Sci. 2015, 15, 1631–1637. [Google Scholar] [CrossRef] [Green Version]
  27. Lorenzini, G.; Pellegrini, E.; Campanella, A.; Nali, C. It’s not just the heat and the drought: The role of ozone air pollution in the 2012 heat wave. Agrochimica 2014, 58, 40–42. [Google Scholar]
  28. Brilli, L.; Moriondo, M.; Ferrise, R.; Dibari, C.; Bindi, M. Climate change and Mediterranean crops: 2003 and 2012, two possible examples of the near future. Agrochimica 2014, 58, 20–33. [Google Scholar]
  29. Rita, A.; Camarero, J.J.; Nolè, A.; Borghetti, M.; Brunetti, M.; Pergola, N.; Serio, C.; Vicente-Serrano, S.M.; Tramutoli, V.; Ripullone, F. The impact of drought spells on forests depends on site conditions: The case of 2017 summer heat wave in southern Europe. Glob. Chang. Biol. 2020, 26, 851–863. [Google Scholar] [CrossRef] [PubMed]
  30. Dalponte, M.; Marzini, S.; Solano-Correa, Y.T.; Tonon, G.; Vescovo, L.; Gianelle, D. Mapping Forest windthrows using high spatial resolution multispectral satellite images. Int. J. Appl. Earth Obs. Geoinf. 2020, 93, 102206. [Google Scholar] [CrossRef]
  31. Dobbertin, M.; Brang, P. Crown defoliation improves tree mortality models. For. Ecol. Manag. 2001, 141, 271–284. [Google Scholar] [CrossRef]
  32. Eichhorn, J.; Roskams, P.; Potocic, N.; Timermann, V.; Ferretti, M.; Mues, V.; Szepesi, A.; Durrant, D.; Seletkovic, I.; Schröck, H.W.; et al. Part IV: Visual Assessment of Crown Condition and Damaging Agents. In Manual on Methods and Criteria for Harmonized Sampling, Assessment, Monitoring and Analysis of the Effects of Air Pollution on Forests; UNECE ICP Forests Programme Coordinating Centre, Ed.; Thünen Institute of Forest Ecosystems: Eberswalde, Germany, 2016; p. 54. ISBN 978-3-86576-162-0. Available online: http://www.icp-forests.org/Manual.htm (accessed on 10 July 2021).
  33. Bussotti, F.; Bettini, D.; Cenni, E.; Ferretti, M.; Sarti, C.; Nibbi, R.; Capretti, P.; Stergulc, F.; Tiberi, R. PARTE 2—Valutazione della condizione delle chiome. In Procedure di Rilievo Nelle Aree di Saggio e Valutazione della Condizione delle Chiome. Manuale di Campagna; Ministero delle Politiche Agricole, Alimentari e Forestali: Roma, Italy, 2016. [Google Scholar]
  34. Gasparini, P.; Di Cosmo, L.; Rizzo, M. PARTE 1—Procedure di rilievo nelle aree di saggio di Livello I. In Procedure di Rilievo nelle Aree di Saggio e Valutazione della Condizione delle Chiome. Manuale di Campagna; Ministero delle Politiche Agricole, Alimentari e Forestali: Roma, Italy, 2016. [Google Scholar]
  35. Müller, E.; Stierlin, H.R. Tree Crown Photos. In Sanasilva; Swiss Federal Institute for Forest Snow and Landscape Research: Birmensdorf, Switzerland, 1990. [Google Scholar]
  36. Ferretti, M. (Ed.) Mediterranean Forest Trees. IA Guide for Crown Assessment; CEC-UN/ECE: Brussels, Belgium; Geneva, Switzerland, 1994. [Google Scholar]
  37. Ferretti, M.; Bussotti, F.; Cenni, E.; Cozzi, A. Implementation of Quality Assurance procedures in the Italian programs of forest condition monitoring. Water Air Soil Poll. 1999, 116, 371–376. [Google Scholar] [CrossRef]
  38. Bussotti, F.; Cozzi, A.; Cenni, E.; Bettini, D.; Sarti, C.; Ferretti, M. Measurement errors in monitoring tree crown conditions. J. Environ. Monit. 2009, 11, 769–773. [Google Scholar] [CrossRef]
  39. Magno, R.; De Filippis, T.; Di Giuseppe, E.; Pasqui, M.; Rocchi, L.; Gozzini, B. Semi-Automatic Operational Service for Drought Monitoring and Forecasting in the Tuscany Region. Geosciences 2018, 8, 49. [Google Scholar] [CrossRef] [Green Version]
  40. Pollastrini, M.; Puletti, N.; Selvi, F.; Iacopetti, G.; Bussotti, F. Widespread crown defoliation after a drought and heat wave in the forests of Tuscany (central Italy) and their recovery—A case study from summer 2017. Front. For. Glob. Chan. 2019, 2, 74. [Google Scholar] [CrossRef] [Green Version]
  41. Puletti, N.; Mattioli, W.; Bussotti, F.; Pollastrini, M. Monitoring the effects of extreme drought events on forest health by Sentinel-2 imagery. J. Appl. Remot. Sen. 2019, 13, 020501. [Google Scholar] [CrossRef]
  42. Bertini, G.; Ferretti, F.; Fabbio, G.; Raddi, S.; Magnani, F. Quantifying tree and volume mortality in Italian forests. For. Ecol. Manag. 2019, 444, 42–49. [Google Scholar] [CrossRef]
  43. Neumann, M.; Mues, V.; Moreno, A.; Hasenauer, H.; Seidl, R. Climate variability drives recent tree mortality in Europe. Glob. Chang. Biol. 2017, 23, 4788–4797. [Google Scholar] [CrossRef]
  44. Etzold, S.; Ziemińska, K.; Rohner, B.; Bottero, A.; Bose, A.K.; Ruehr, N.K.; Zingg, A.; Rigling, A. One Century of Forest Monitoring Data in Switzerland Reveals Species and Site-Specific Trends of Climate-Induced Tree Mortality. Front. Plant Sci. 2019, 10, 307. [Google Scholar] [CrossRef] [Green Version]
  45. Allen, C.D.; Macalady, A.K.; Chenchouni, H.; Bachelet, D.; McDowell, N.; Vennetier, M.; Kitzberger, T.; Rigling, A.; Breshears, D.D.; Hogg, E.H.; et al. A global overview of drought and heat-induced tree mortality reveals emerging climate change risks for forests. Forest Ecol. Manag. 2010, 259, 660–684. [Google Scholar] [CrossRef] [Green Version]
  46. Taccoen, A.; Piedallu, C.; Seynave, I.; Perez, V.; Gégout-Petit, A.; Nageleisen, L.M.; Bontemps, J.D.; Gégout, J.C. Background mortality drivers of European tree species: Climate change matters. Proc. R. Soc. 2019, 286, 20190386. [Google Scholar] [CrossRef] [Green Version]
  47. Senf, C.; Pflugmacher, D.; Yang, Z.; Sebald, J.; Knorn, J.; Neumann, M.; Hostert, P.; Seidl, R. Canopy mortality has doubled in Europe’s temperate forests over the last three decades. Nat. Commun. 2018, 9, 4978. [Google Scholar] [CrossRef] [PubMed]
  48. Carnicer, J.; Coll, M.; Ninyerola, M.; Pons, X.; Sánchez, G.; Peñuelas, J. Widespread crown condition decline, food web disruption, and amplified tree mortality with increased climate change-type drought. Proc. Natl. Acad. Sci. USA 2011, 108, 1474–1478. [Google Scholar] [CrossRef] [Green Version]
  49. Ruiz-Benito, P.; Lines, E.R.; Gómez-Aparicio, L.; Zavala, M.A.; Coomes, D.A. Patterns and drivers of tree mortality in Iberian forests: Climatic effects are modified by competition. PLoS ONE 2013, 8, e56843. [Google Scholar] [CrossRef] [Green Version]
  50. Schuldt, B.; Buras, A.; Arend, M.; Vitasse, Y.; Beierkuhnlein, C.; Damm, A.; Gharun, M.; Grams, T.E.E.; Hauck, M.; Hajek, P.; et al. A first assessment of the impact of the extreme 2018 summer drought on Central European forests. Basic Appl. Ecol. 2020, 45, 84–103. [Google Scholar] [CrossRef]
  51. Brun, P.; Psomas, A.; Ginzler, C.; Thuiller, W.; Zappa, M.; Zimmermann, N.E. Large-scale early-wilting response of Central European forests to the 2018 extreme drought. Glob. Chang. Biol. 2020, 26, 7021–7035. [Google Scholar] [CrossRef] [PubMed]
  52. Bigler, C.; Gavin, D.G.; Gunning, C.; Veblen, T.T. Drought induces lagged tree mortality in a subalpine forest in the Rocky Mountains. Oikos 2007, 116, 1983–1994. [Google Scholar] [CrossRef]
  53. Furniss, T.J.; Larson, A.J.; Kane, V.R.; Lutz, J.A. Wildfire and drought moderate the spatial elements of tree mortality. Ecosphere 2020, 11, e03214. [Google Scholar] [CrossRef]
  54. Trugman, A.T.; Detto, M.; Bartlett, M.K.; Medvigy, D.; Anderegg, W.R.L.; Schwalm, C.; Schaffer, B.; Pacala, S.W. Tree carbon allocation explains forest drought-kill and recovery patterns. Ecol. Lett. 2018, 21, 1552–1560. [Google Scholar] [CrossRef]
  55. Battisti, A.; Benvegnù, I.; Colombari, F.; Haack, R.A. Invasion by the chestnut gall wasp in Italy causes significant yield loss in Castanea sativa nut production. Agric. For. Entomol. 2014, 16, 75–79. [Google Scholar] [CrossRef]
  56. Thomas, F.M.; Blank, R.; Hartmann, G. Abiotic and biotic factors and their interactions as cause of oak decline in Central Europe. Forest Path. 2002, 32, 277–307. [Google Scholar] [CrossRef]
  57. Gentilesca, T.; Camarero, J.J.; Colangelo, M.; Nolè, A.; Ripullone, F. Drought-induced oak decline in the western Mediterranean region: An overview on current evidences, mechanisms and management options to improve forest resilience. iFor. Biogeosci. For. 2017, 10, 796–806. [Google Scholar] [CrossRef] [Green Version]
  58. Colangelo, M.; Camarero, J.J.; Borghetti, M.; Gentilesca, T.; Oliva, J.; Redondo, M.A.; Ripullone, F. Drought and Phytophthora Are Associated With the Decline of Oak Species in Southern Italy. Front. Plant Sci. 2018, 9, 1595. [Google Scholar] [CrossRef]
  59. Minerbi, S.; Cescatti, A.; Cherubini, P.; Hellrigl, K.; Markart, G.; Saurer, M.; Mutinelli, G. Scots Pine dieback in the Isarco Valley due to severe drought in the summer of 2003. Forest Obs. 2006, 2/3, 89–144. [Google Scholar]
  60. Vacchiano, G.; Garbarino, M.; Borgogno, M.; Mondino, E.; Motta, R. Evidences of drought stress as a predisposing factor to Scots pine decline in Valle d’Aosta (Italy). Eur. J. Forest Res. 2012, 131, 989–1000. [Google Scholar] [CrossRef]
  61. Rigling, A.; Bigler, C.; Eilmann, B.; Feldmeyer-Christe, E.; Gimmi, U.; Ginzler, C.; Graf, U.; Mayer, P.; Vacchiano, G.; Weber, P.; et al. Driving factors of a vegetation shift from Scots pine to pubescent oak in dry Alpine forests. Glob. Chang. Biol. 2013, 19, 229–240. [Google Scholar] [CrossRef]
  62. Eilmann, B.; Weber, P.; Rigling, A.; Eckstein, D. Growth reactions of Pinus sylvestris L. and Quercus pubescens Willd. to drought years at a xeric site in Valais, Switzerland. Dendrochronologia 2006, 23, 121–132. [Google Scholar] [CrossRef]
  63. Cenni, E.; Bussotti, F.; Galeotti, L. The decline of Pinus nigra Arn. reforestation stand on a limestone substrate: The role of nutritional factors examined by means of foliar diagnosis. Ann. Sci. For. 1998, 55, 567–576. [Google Scholar] [CrossRef]
  64. Netherer, S.; Kandasamy, D.; Jirosová, A.; Kalinová, B.; Schebeck, M.; Schlyter, F. Interactions among Norway spruce, the bark beetle Ips typographus and its fungal symbionts in times of drought. J. Pest Sci. 2021, 94, 591–614. [Google Scholar] [CrossRef]
  65. Hartmann, H.; Trumbore, S. Understanding the roles of nonstructural carbohydrates in forest trees—From what we can measure to what we want to know. New Phytol. 2016, 211, 386–403. [Google Scholar] [CrossRef] [PubMed] [Green Version]
  66. Wang, Z.; Zhou, Z.; Wang, C. Defoliation-induced tree growth declines are jointly limited by carbon source and sink activities. Sci. Total Environ. 2021, 762, 143077. [Google Scholar] [CrossRef]
  67. Galiano, L.; Martinez-Vilalta, J.; Sabaté, S.; Lloret, F. Determinants of drought induced effects on crown condition and their relationship with depletion of carbon reserve in a Mediterranean holm oak forest. Tree Physiol. 2012, 32, 478–489. [Google Scholar] [CrossRef] [Green Version]
  68. Spinoni, J.; Vogt, J.V.; Naumann, G.; Barbosa, P.; Dosio, A. Will drought events become more frequent and severe in Europe? Int. J. Climatol. 2018, 38, 1718–1736. [Google Scholar] [CrossRef] [Green Version]
  69. Spinoni, J.; Naumann, G.; Vogt, J.V. Pan-European seasonal trends and recent changes of drought frequency and severity. Glob. Plan. Chang. 2017, 148, 113–130. [Google Scholar] [CrossRef]
  70. Hari, V.; Rakovec, O.; Markonis, Y.; Hanel, M.; Kumar, R. Increased future occurrences of the exceptional 2018–2019 Central European drought under global warming. Sci. Rep. 2020, 10, 12207. [Google Scholar] [CrossRef] [PubMed]
  71. Moravec, V.; Markonis, Y.; Rakovec, O.; Svoboda, M.; Trnka, M.; Kumara, R.; Hanel, M. Europe under multi-year droughts: How severe was the 2014–2018 drought period? Environ. Res. Lett. 2021, 16, 034062. [Google Scholar] [CrossRef]
  72. Bussotti, F.; Pollastrini, M. Observing climate change impacts on European forests: What works and what does not in ongoing long-term monitoring networks. Front. Plant Sci. 2017, 8, 629. [Google Scholar] [CrossRef] [PubMed] [Green Version]
  73. Bussotti, F.; Pollastrini, M. Traditional and novel indicators of climate change impacts on European forest trees. Forests 2017, 8, 137. [Google Scholar] [CrossRef] [Green Version]
  74. Bussotti, F.; Pollastrini, M. Revisiting the concept of stress in forest trees at the time of global change and issues for stress monitoring. Plant Stress 2021, 2, 100013. [Google Scholar] [CrossRef]
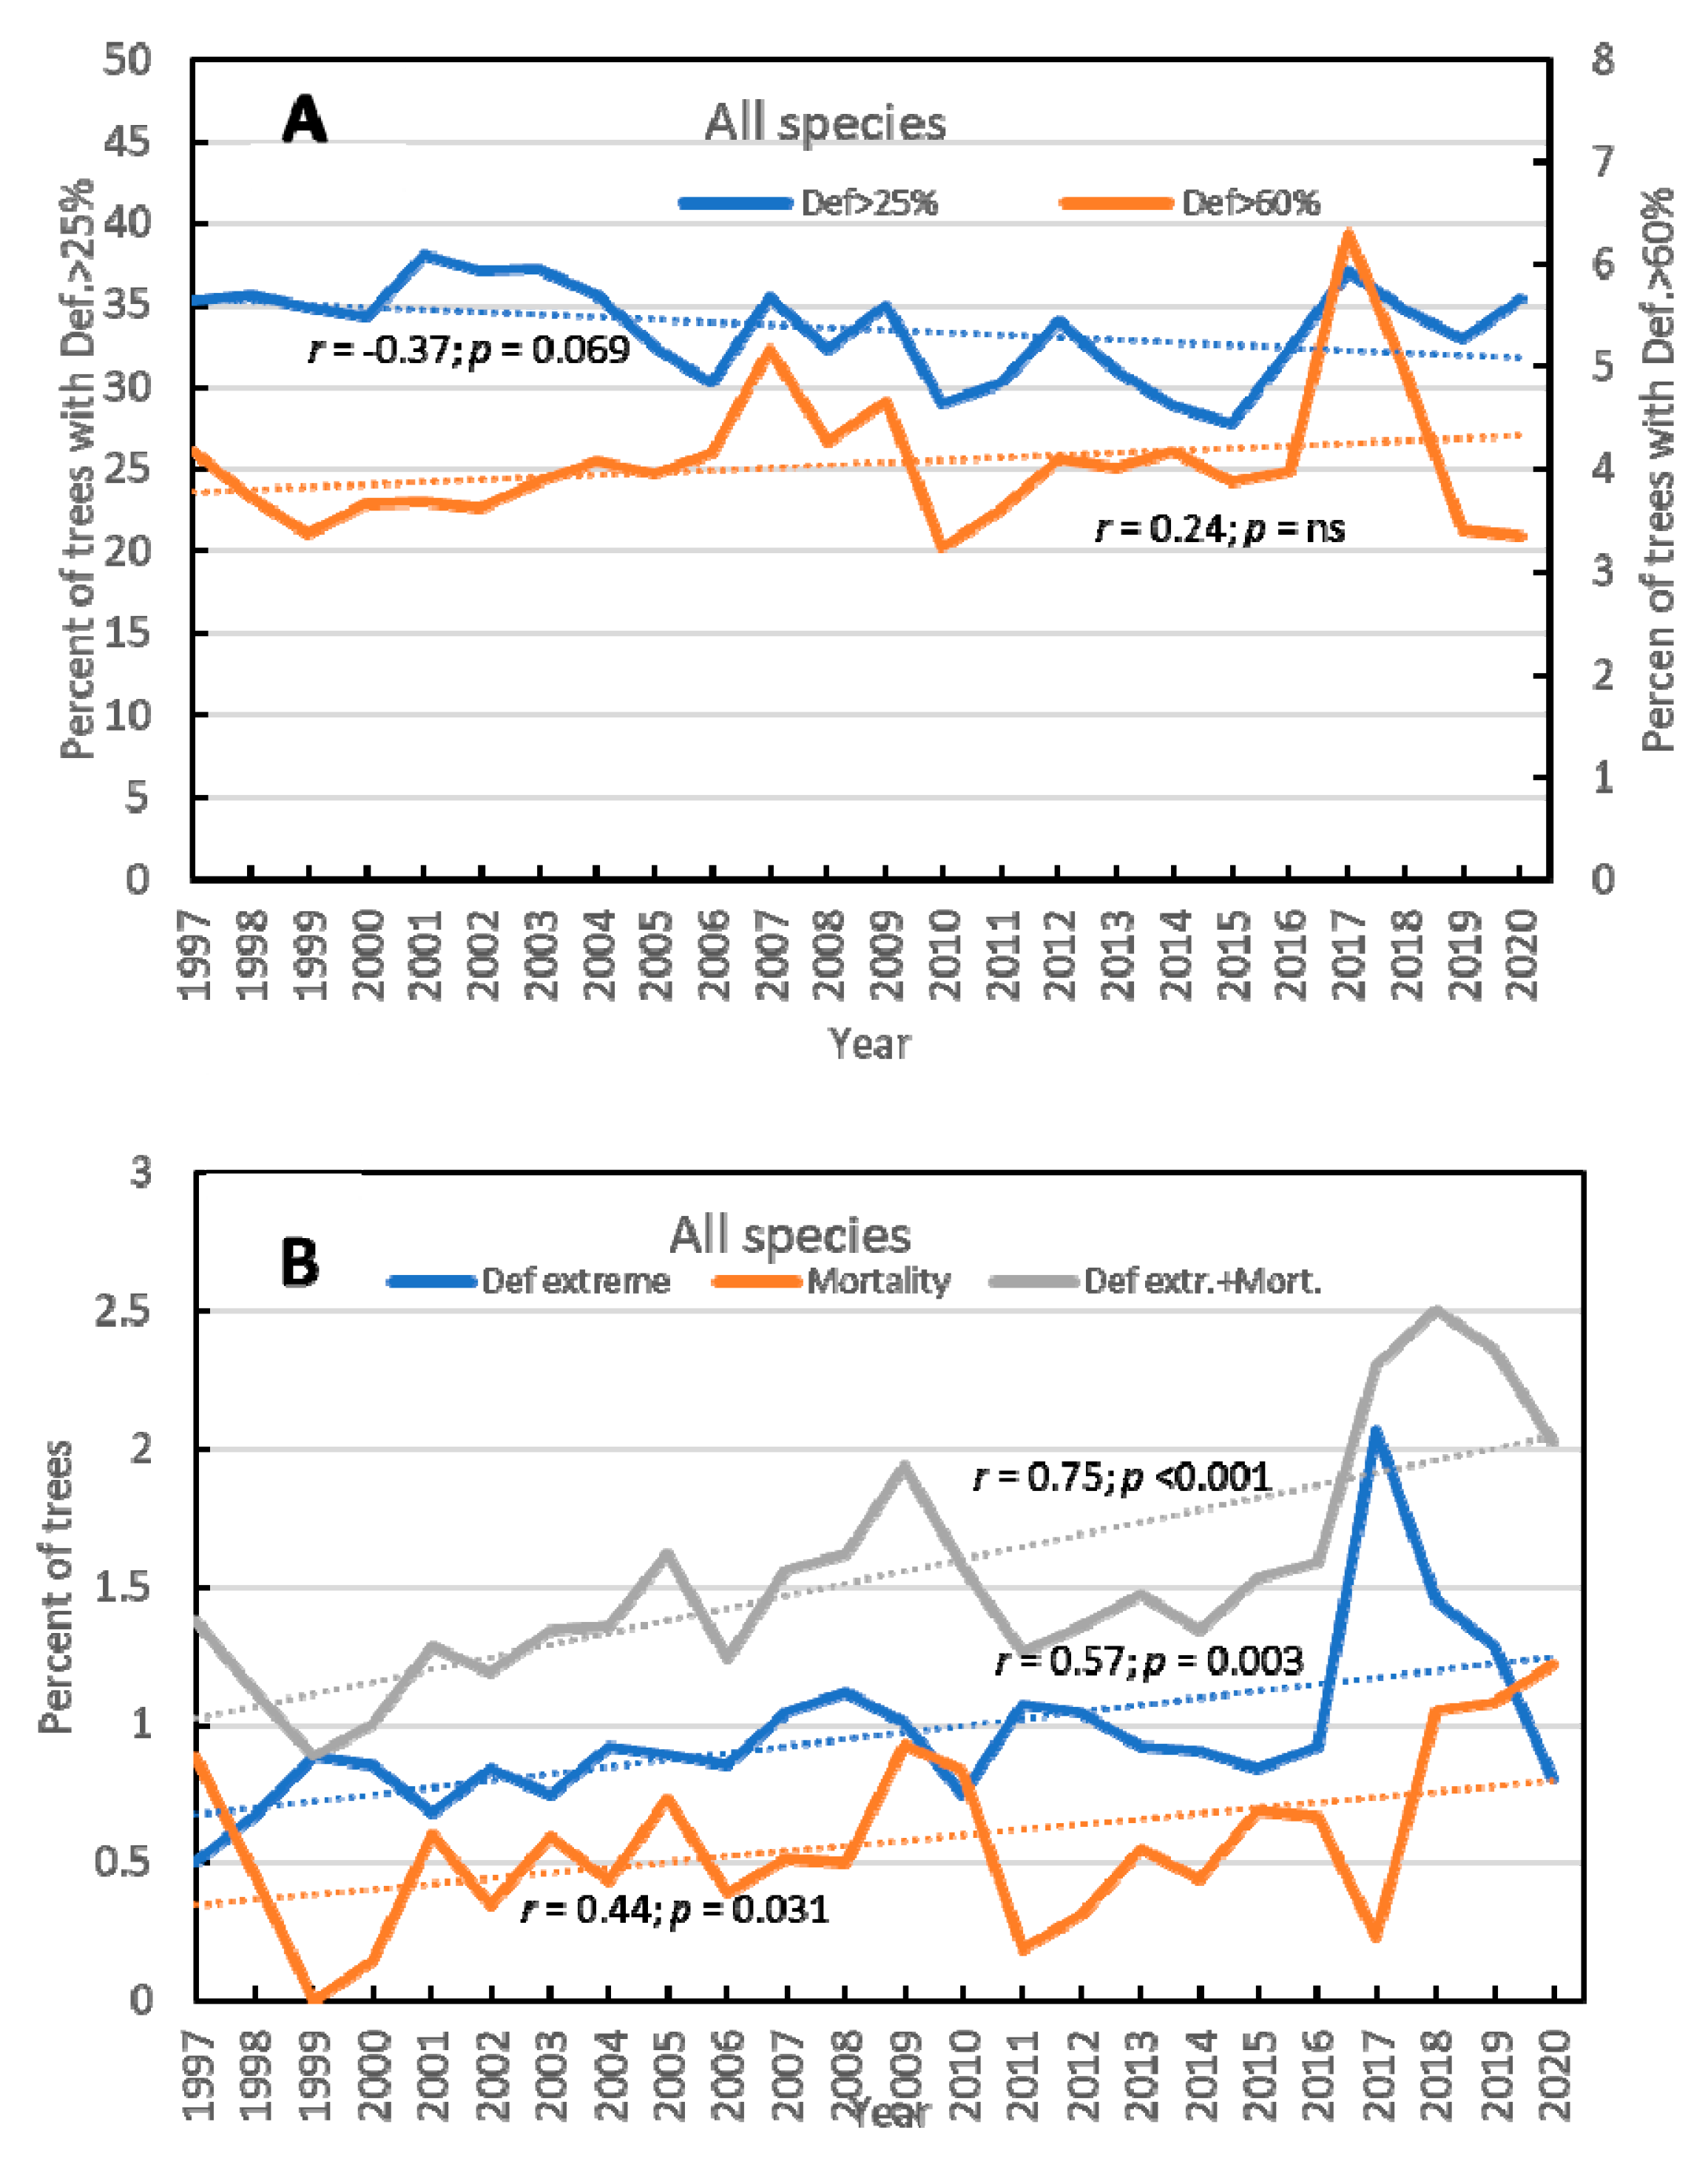
Figure 1. Defoliation and mortality trends (correlation between year and defoliation) over the 1997–2020 period (all species pooled). (A) Annual rate of trees with defoliation >25%, and trees with defoliation >60. (B) Annual rate of extremely defoliated trees, with defoliation >85%, and dead trees.
Forests 12 01476 g001
Figure 2. Correlation between the percent of the dead trees assessed during a yearly survey (year n) and percent of extremely defoliated trees the year before (year n − 1). All species pooled.
Forests 12 01476 g002
Figure 3. Levels of defoliation of the trees in the three years before a tree death (n = death year; n − 1, n − 2, n − 3 =, respectively, 1, 2, 3 years before death). One group (A) shows low defoliation until a sudden death; the second group’s (B) levels of defoliation increase progressively.
Forests 12 01476 g003
Figure 4. Defoliation rates in the four years after extreme defoliation occurred (Y + 1, ….. Y + 4), according to the usual defoliation classes (0–25%: not or slightly defoliated; 25–60%: moderately defoliated; 60–85%: severely defoliated; 85–100%: extremely defoliated; 100%: dead).
Forests 12 01476 g004
Table 1. General data for the main tree species. N = Number of trees. Percent of defoliated trees beyond the following thresholds: Def > 25% (moderate + severe), Def > 60% (severe), Def > 85% (extreme). Percent of dead trees (Def 100%). Percentages of extreme defoliation and dead trees are also presented cumulatively (Def 85–100%). The ratio Dead/Extr expresses the incidence of mortality in relation to extreme defoliation. The data are the mean per species over the period 1997–2020.
SpeciesNDef > 25%Def > 60%Def > 85%Def 100%Def 85–100% Dead/Extr
Castanea sativa Mill.475.0861.3612.983.521.084.600.31
Fagus sylvatica L.1099.0430.212.960.920.421.340.45
Ostrya carpinifolia Scop.329.7534.916.071.490.341.830.23
Quercus cerris L.589.9625.081.060.220.490.712.18
Quercus ilex L.220.1323.271.120.110.080.190.72
Quercus pubescens Willd.718.8851.825.080.980.461.440.47
Larix decidua L.348.0019.932.170.650.591.240.90
Picea abies (L.) Karst.544.2919.391.790.280.500.781.74
Pinus nigra Arn.192.8824.922.860.330.751.082.24
Pinus sylvestris L.205.4634.193.420.581.061.641.85
Table 2. Trends (correlation with year) of tree defoliation and death over the period 1997–2020 (see explication in Table 1).
SpeciesDef > 25%Def > 60%Def > 85%Def 100%85 + 100%
Castanea sativa0.829***0.820***0.733***0.577**0.751***
Fagus sylvatica−0.178ns0.196ns0.314ns0.250ns0.389(*)
Ostrya carpinifolia0.208ns−0.101ns−0.136ns0.422*0.043ns
Quercus cerris–0.497*0.299ns0.310ns−0.036ns0.055ns
Quercus ilex−0.680***−0.494*−0.066ns−0.094ns−0.093ns
Quercus pubescens−0.729***−0.468*0.366(*)−0.029ns0.311ns
Larix decidua0.208ns−0.101ns−0.136ns0.422*0.043ns
Picea abies0.240ns0.439*0.308ns0.584**0.722***
Pinus nigra−0.090ns−0.499*0.208ns0.469*0.519**
Pinus sylvestris0.417*0.524**0.224ns0.202ns0.305ns
The coefficients of correlation r (Pearson) and p level are shown. * = p < 0.05 (significant); ** = p < 0.01 (very significant); *** = p < 0.001 (highly significant); (*) = p < 0.1 (not significant but indicative of a trend). Ns = not significant.
Publisher’s Note: MDPI stays neutral with regard to jurisdictional claims in published maps and institutional affiliations.