Article

Influence of Plunger Stress on Resilient Modulus of Forest Subgrade Soils Obtained from Cyclic CBR Test

1
Department of Landscape Management, Faculty of Forestry and Wood Technology, Mendel University in Brno, Zemědělská 3, 613 00 Brno, Czech Republic
2
Department of Civil Engineering, Institute of Technology and Business in České Budějovice, Okružní 517/10, 370 01 České Budějovice, Czech Republic
*
Author to whom correspondence should be addressed.
Forests 2021, 12(11), 1456; https://doi.org/10.3390/f12111456
Submission received: 1 October 2021 / Revised: 21 October 2021 / Accepted: 22 October 2021 / Published: 26 October 2021
(This article belongs to the Section Forest Operations and Engineering)

Abstract

:
The low load-bearing capacity of subgrade soils is typical for forest roads. For the determination of the resilient modulus Mr of unbound natural as well as recycled materials, a laboratory triaxial test with cyclic loading is generally preferred. For low volume roads, including forest roads, an alternative method of the cyclic CBR test, which uses standard CBR devices for repeated loading, is being tested and applied in practice. For forest subgrade soils, the procedure for determining the modulus Mr based on cyclic loading of the specimen to a constant penetration depth of 2.54 mm was verified. This procedure was tested on an extensive dataset obtained from 11 forest roads in the Czech Republic, which was then statistically evaluated. The obtained results showed disproportionately high mean values as well as high random variability. Further data analysis revealed that the reason seemed to be the chosen test methodology. When using this procedure for forest soils, high values of plunger stress can occur, which for many types of soils greatly exceed their maximum load-bearing capacity. As result, the modulus Mr is determined at unrealistically high plunger stress values and in many cases on the disrupted specimen. The necessary solution to this shortcoming is to censor the results of the cyclic CBR test, i.e., to exclude unrealistic values of the modulus Mr determined at plunger stresses exceeding the limit values.

1. Introduction

Forest management efficiency and the accessibility of landscape areas require a huge forest road network. Forest roads provide access to landscape areas for economic and recreational reasons, as well as to ensure area accessibility outside of public transport. For forest roads, pavement construction uses mainly natural materials, e.g., natural aggregates of various fractions, lime, etc., but also recycled materials are used. The quality, durability, service life, and damage ratio of forest roads are fundamentally influenced by the subgrade soil quality described by its load-bearing capacity. There are many uncertain factors or events of natural origin that directly affect subgrade soils, especially the humidity and unfavorable water regime as well as the variable material compaction level. The forest road pavement design requires a proper estimate of the resilient modulus Mr, because it plays a crucial role in optimizing the design of the pavement structure layers.
The composition of pavement structure layers of all types and categories of roads in the Czech Republic is designed according to valid regulations and standards, namely the ČSN 736114 Road Pavements: Basic Requirements for Design [1], TP 170 Design of Pavement Structures [2], TP 43385 Catalog of Field Roads [3], and The Methodical Guide to the Design and Implementation of Pavement of Low Volume Roads [4]. The method for the actual pavement design is based on an empirical approach and the knowledge of the California Bearing Ratio (% CBR) of the subgrade [5,6] for all traffic load levels.
Among others, the methodology of the AASHTO (American Association of State Highway and Transportation Officials) is an important regulation for pavement design, where design procedures and laboratory methods for determining the required material characteristics are recommended. The resilient modulus Mr is considered to be the basic deformation characteristic of the subgrade. The original Guide for Design of Pavement Structures (GDPS) [7] based on the empirical design method was modified in 2004 and extended to the Mechanistic–Empirical Pavement Design Guide (MEPDG) based on the mechanistic–empirical method [8]. For the determination of the modulus Mr, the laboratory triaxial test with cyclic loading (cyclic triaxial test) is preferred [9].
For less loaded roads, including forest roads, where the daily intensity is a maximum of 400 heavy vehicles, the cyclic triaxial test can be replaced by a suitable laboratory method using cyclic loading and providing a sufficiently accurate and reliable estimate of the modulus Mr [10]. In addition to meeting the requirement of cyclic loading, it is of course required that this method must be time- and money-saving to create an alternative to the financially and economically demanding triaxial test. As an alternative methods to the cyclic triaxial test, various prediction models obtained from regression analysis based on relationships among the modulus Mr and other soil properties [11,12] or different modifications of cyclic CBR tests [13] are applied and verified in practice. The theoretical basis of the cyclic CBR test [14], which uses standard CBR devices for repeated loading, assumes that this procedure gives relatively accurate deformation characteristics of tested materials to obtain an estimate of the modulus Mr, while allowing specimens to be prepared at different humidity conditions, varying compaction rates, or different plunger stress magnitudes, modeling different loadings from vehicles moving. For the conditions of the Czech Republic, the procedure for determining the modulus Mr estimate proposed at Delft University [13] was selected as a usable alternative. This procedure was tested and subsequently modified in the laboratories of Mendel University in Brno (MENDELU) and the geotechnical laboratory GEOSTAR s.r.o. in Brno.
The original priority of the study was to verify the applicability of this procedure for forest soils, as the random variability of the soil modulus showed a dominant influence on the resulting behavior of forest roads and therefore on the reliability of the structure as a whole in numerical analyzes based on the finite element method [15,16]. The obtained modulus was analyzed in order to determine the intervals of occurrence for the main soil classes as well as to possibly determine representative values of the modulus for individual soil classes and to simplify the preparation of the adequate input characteristics that reflect the real traffic loading conditions [17] and as realistically as possible predict the future behavior of the material in the forest road pavement structure.

2. Materials and Methods

2.1. Study Area, Forest Road Samples, and Geotechnical Analysis

The deformation behavior of unbound natural subgrade materials was studied on soils taken from the active zone of forest road pavement at a depth of about 500 mm below the structural layers forming the pavement. Sampling was performed to represent the widest possible range of soils according to the Unified Soil Classification System (USCS) [18,19]. The following types of geological areas of the Czech Republic were included:
Eluvial rocks:
Metamorphic rocks—siSa, grsiSa, siGr soil class;
Igneous rocks—csaCl, sagrSi, siSa, clGr soil class;
Diagenetic lithificated sediments of sandstone, greywacke—Cl, siCl, csaCl, sagrSi, grsaCl soil class;
Devonian limestone—csaCl, sagrSi, clSa, siSa, siGr soil class;
Paleogenic diagenetic lithificated sediments—Cl, grsaCl soil class.
Sediments:
Cretaceous clays and sands—Cl, siCl, saclSi soil class;
Neogenic and Quarternary clays—saciSi, csaCl, grsaCl soil class.
Sampling was carried out from 11 forest roads at different localities in the Czech Republic. A total of 46 samplings of subgrade materials was carried out, which were classified into nine soil classes. As a result, soils taken from all geological environments were represented; however, due to the naturally high variability of their properties, the individual soil types were not represented evenly [20].
For each sample, the geotechnical tests necessary for classification according to the relevant European standards were performed. Geotechnical tests consisted of the moisture test according to standard [21], determination of grain size and a density test according to standard [22], and determination of consistency limits (yield strength and plasticity limit), namely Atterberg tests, according to standard [23]. The tests were used for the basic classification of soils on the basis of their particle size distribution and consistency limits for the classification of soils according to the Unified Soil Classification System (USCS).
From each sample, 6 specimens were subsequently prepared for testing, i.e., a total of 276 specimens were tested. The specimens were compacted into test mortars for CBR tests with a diameter of 152 mm and a height of 117 mm by Proctor Standard energy and were prepared for optimal humidity and maximum dry density according to [24]. The specimens were subjected to a cyclic CBR test, and a set of six values of the estimate of the modulus Mr was statistically evaluated. After performing the cyclic test, the control dry density and humidity were determined on each specimen, and their mean values for the individual soil classes were determined. A basic overview of the sample classification and the corresponding mean values of density and humidity are given in Table 1.

2.2. Laboratory Analysis—Cyclic CBR Test

To determine the estimate of the resilient modulus Mr—hereinafter referred to as the effective resilient modulus Mr,eff—a variant of the cyclic CBR test from Delft University primarily designed for testing unbound base and sub-base materials [13] was adopted. The principle of this cyclic test consists of the application of repeated loading, simulating the effect of vehicle moving by a plunger on a sample of material. Loading is performed on a standard device for the CBR test according to valid standards for specimen preparation [24] and for realization of the CBR standard test [6], i.e., the penetration at standard speed 1.27 mm/min with a plunger of 50 mm diameter to a penetration depth of 2.54 mm. In the cyclic test thus designed, the specimen is always loaded to the penetration depth of 2.54 mm, then unloaded until the load drops to zero, and reloaded until the desired penetration is regained. This process is repeated until the value of the elastic displacement reaches a constant value.
This procedure was modified at MENDELU for use on various soil types. Unlike the former method, the standard mold size was used because it is suitable not only for soils, but also, for example, for testing gravel material of the Gr class according to USCS up to a grain size of 22.5 mm. For the calculation of the modulus Mr,eff, the effect of friction was adjusted using the mean values of the constants C1, C2, C3 [25]. The following equation was used:
M r , eff = C 1 ( 1 μ C 2 ) σ 0 a w C 3
where
  • Mr,eff = resilient modulus estimate of the material tested (MPa),
  • w′ = elastic displacement (mm),
  • a = radius of the circular plunger (mm),
  • σ0 = stress under the plunger (kPa),
  • µ = Poisson’s ratio of the material tested,
  • C′1 = 1.5865,
  • C′2 = 1.0875,
  • C′3 = 1.0920.

2.3. Statistical Analysis

For each data set consisting of six specimens of the sample, the following statistics were determined: mean value, standard deviation, coefficient of variation, and minimum and maximum values. The mean value indicates what value of the modulus Mr,eff we can expect, the standard deviation and the coefficient of variation the assumed scattering of values from the mean value, and the minimum and maximum values the expected interval in which the values can occur.
In addition to the fact that each sample was statistically evaluated, each soil class according to the relevant classification was also similarly evaluated. The number of samples and therefore the number of analyzed specimens were different for each soil class (see Table 1), which depended, of course, on how many samples after their geotechnical classification were classified into the given soil class.
To determine the correlation between the quantities, the Spearman rank correlation coefficient was used [26]:
r s = 1 6 i d i 2 N ( N 1 ) ( N + 1 )
where
  • di = the difference between the rank numbers of the first and the second variable,
  • N = the number of observations.
The advantage of this nonparametric statistic is that it is able to determine the correlation even for random variables not showing Normal (Gauss) probability distribution and/or between variables with the nonlinear relationship.

3. Results

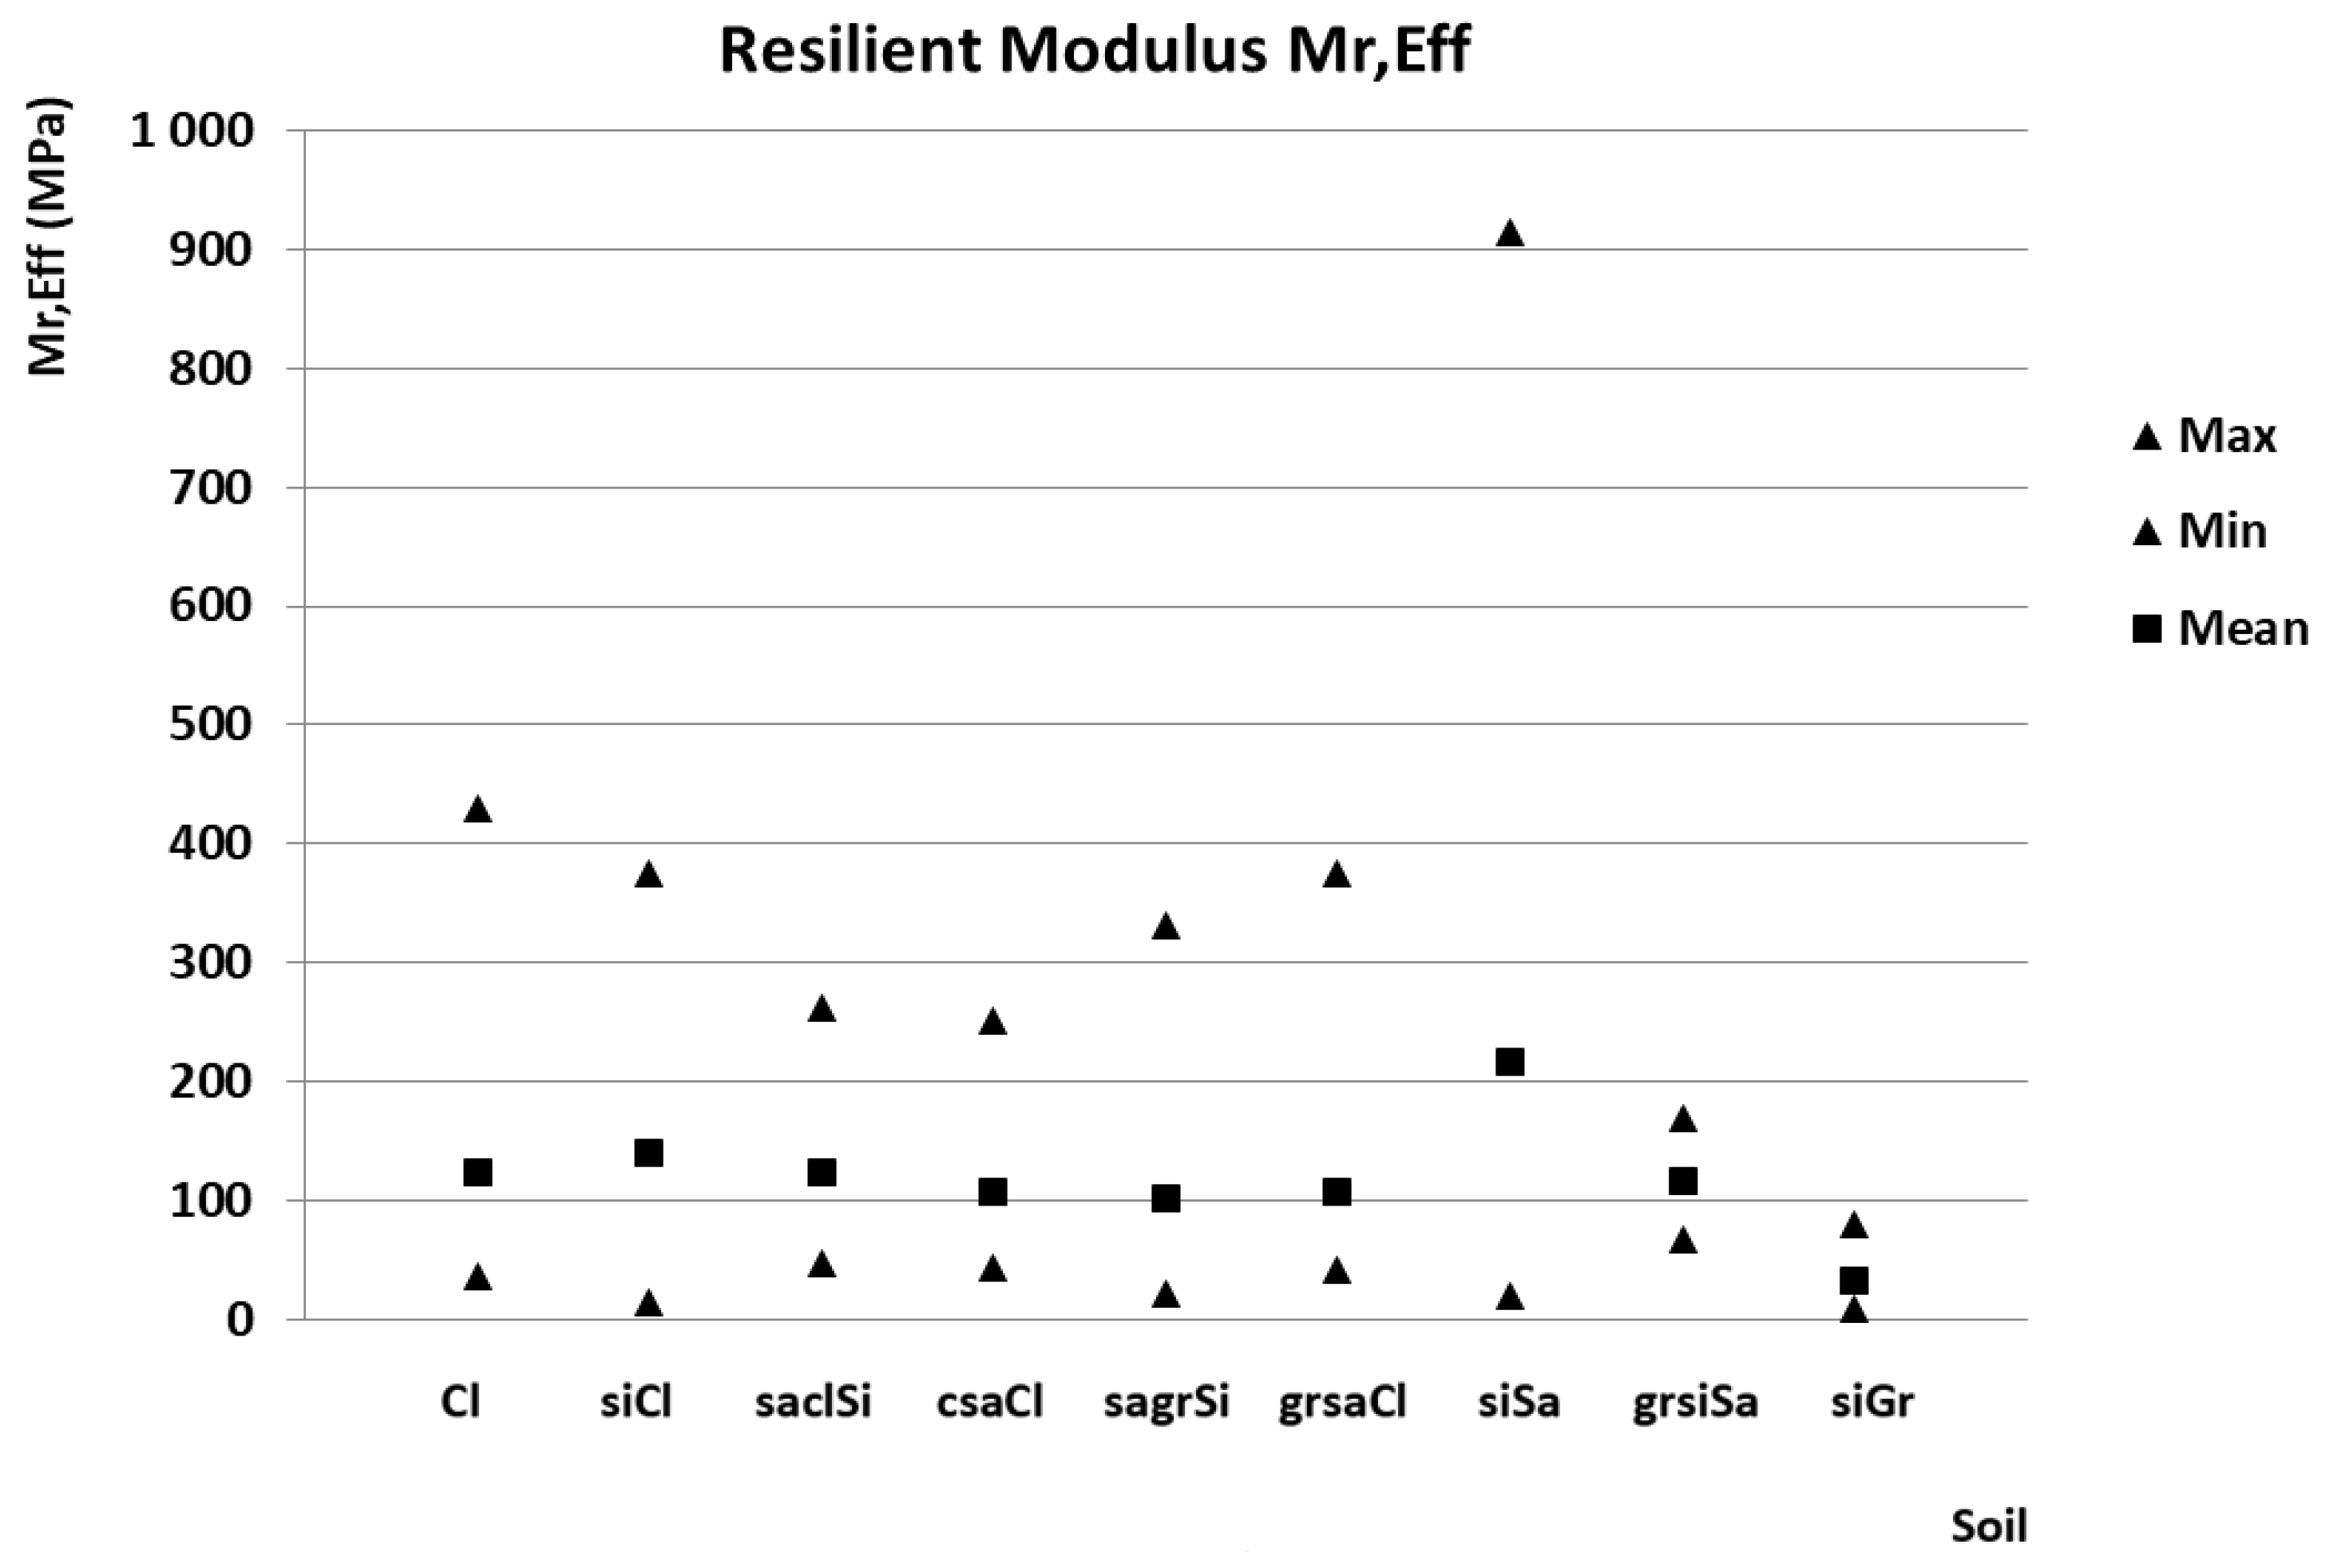
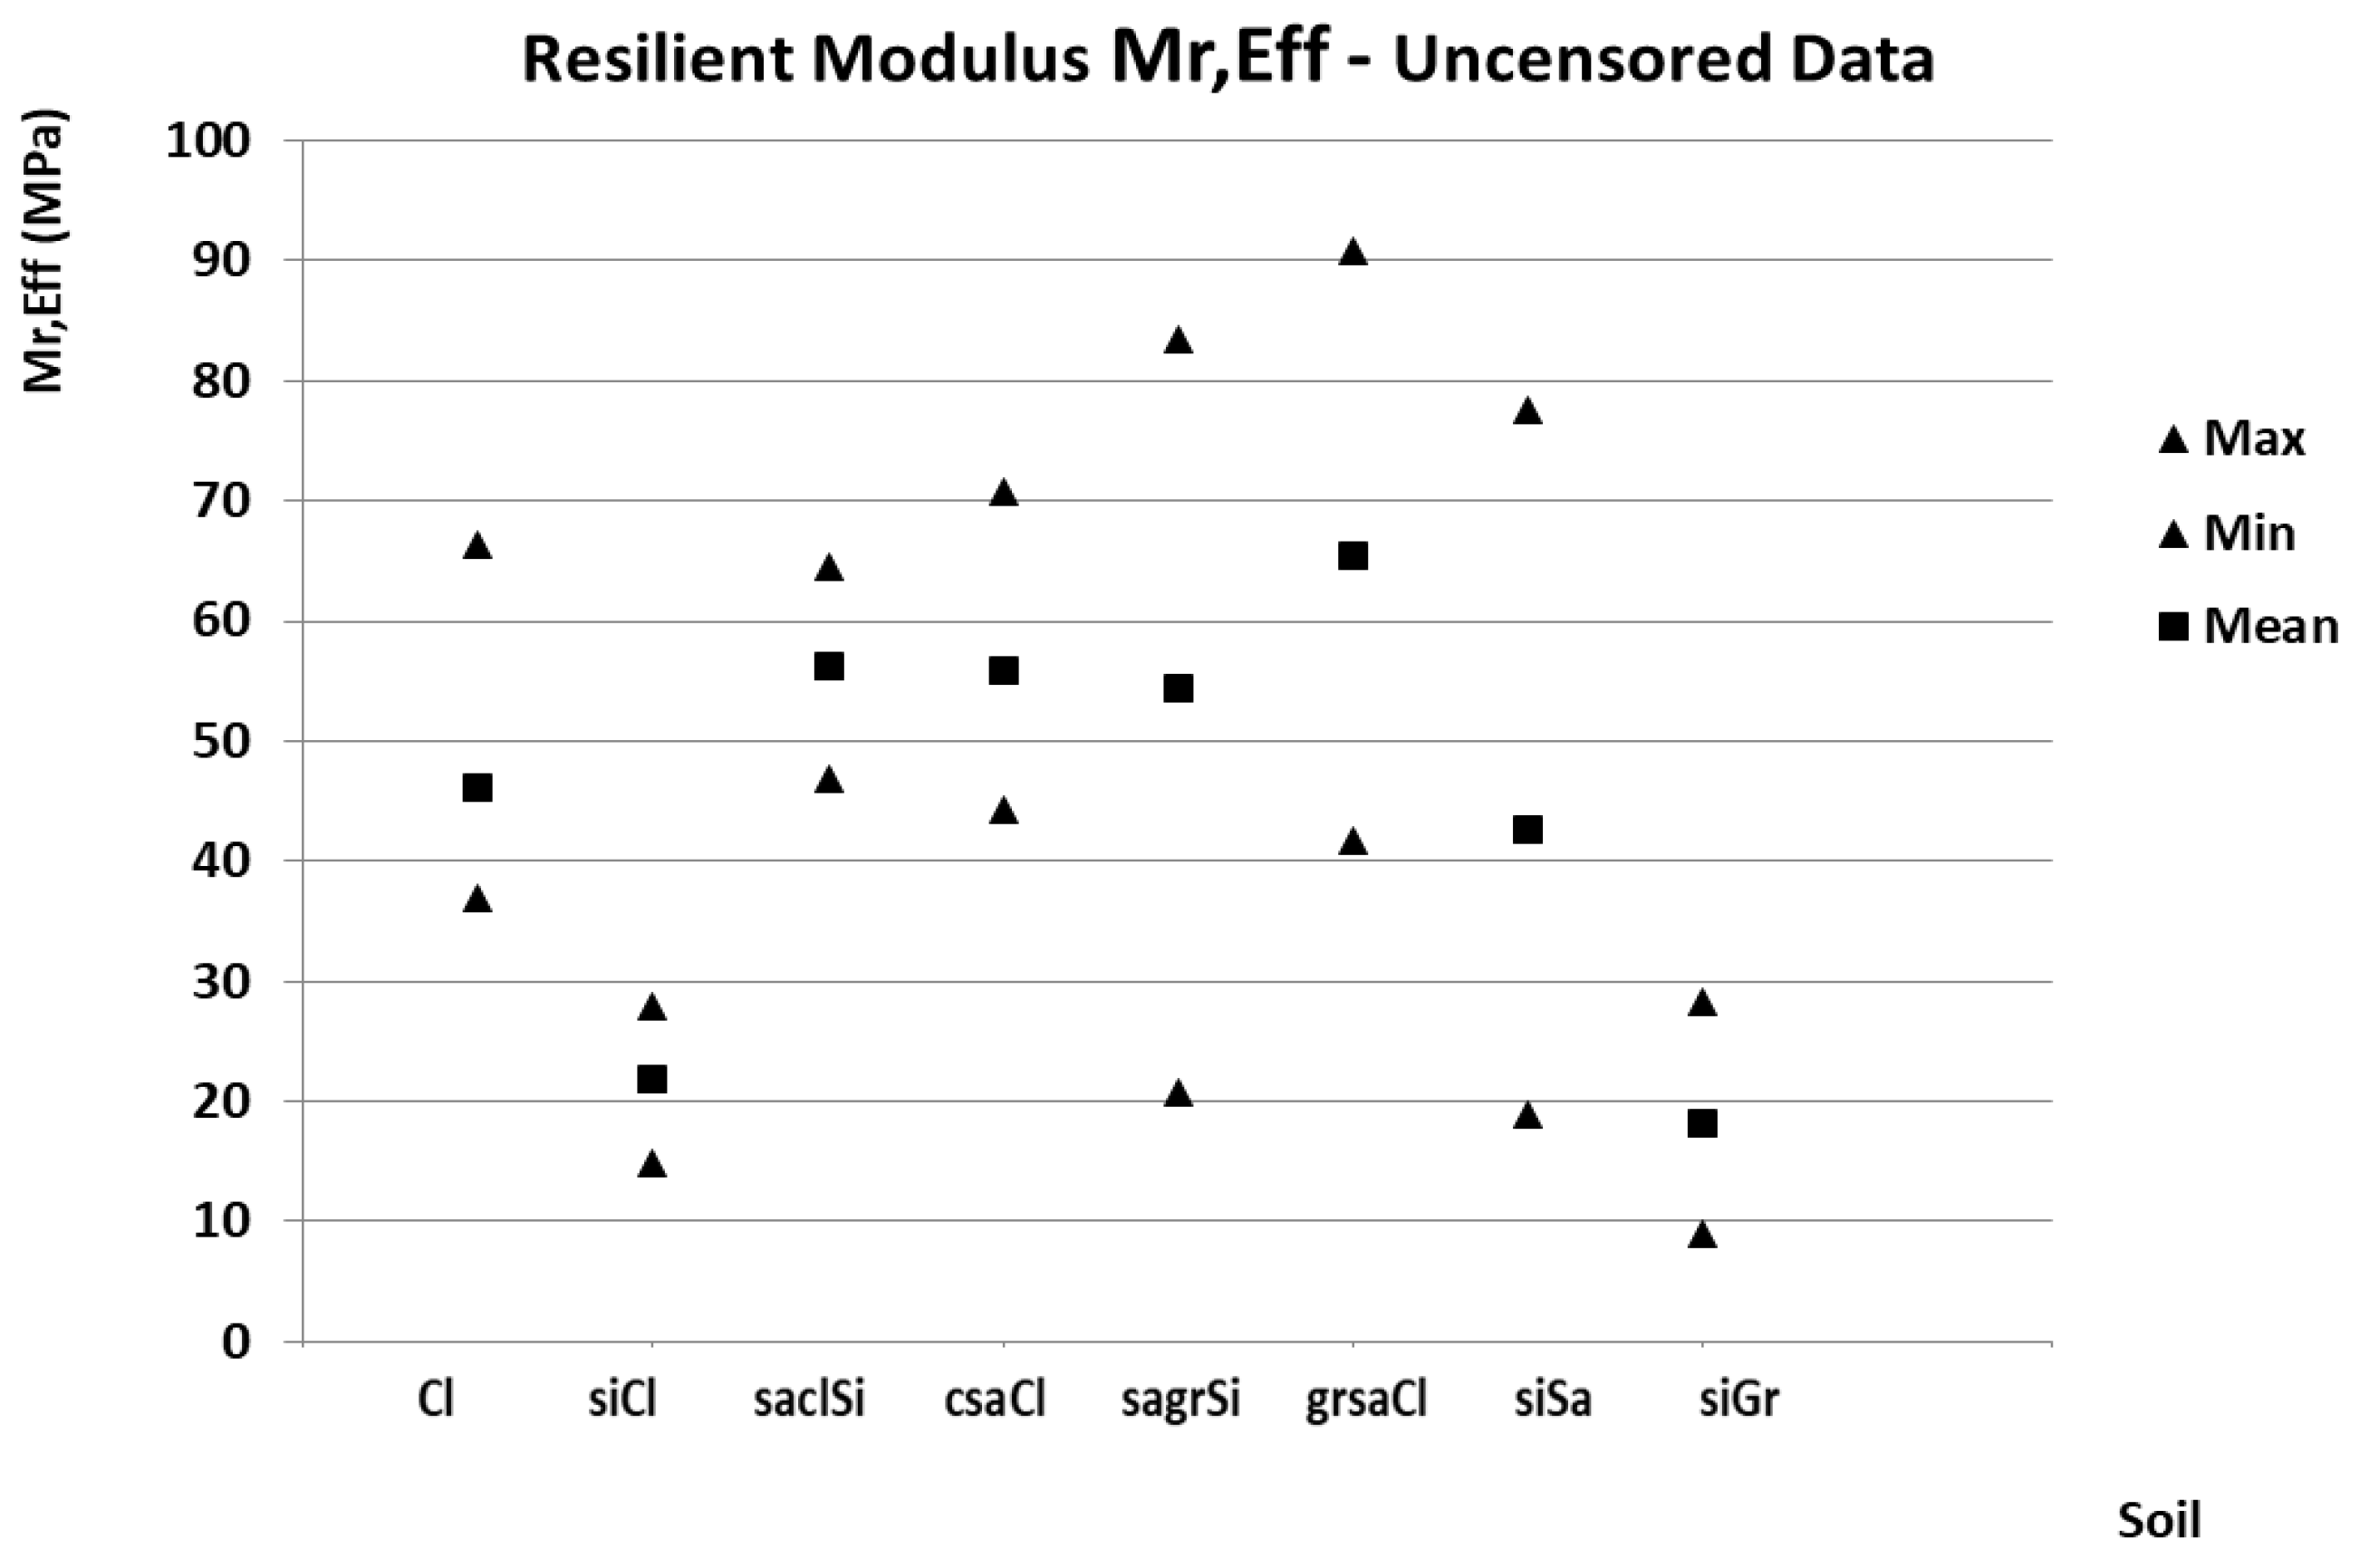
3.1. Results—Resilient Modulus Mr,eff from Cyclic CBR Test

The results of the statistical analysis are summarized in Table 2, where the following statistics are given for each soil class:
  • Mean—mean value of Mr,eff,
  • Min Mean, Max Mean—minimum and maximum, respectively, mean value Mr,eff of individual samples of the given soil class,
  • Var—coefficient of variation of Mr,eff,
  • Min, Max—minimum and maximum, respectively, value of Mr,eff.
Furthermore, these statistics are summarized for all soil classes in Figure 1.
The mean values of Mr,eff of individual soil classes—see Mean statistics (Table 2)—were very high (with the exception of the siGr class) and ranged from about 100 to 200 MPa. Additionally, there were fundamental differences in the mean values of Mr,eff obtained from individual samples within one class—see Min Mean and Max Mean statistics (Table 2). The mean value obtained from one sample could be more than ten times the mean value obtained from another sample of the same class. Unusually high values of the coefficient of variation were also observed—see Var statistic (Table 2). It is not surprising that we can expect high random variability for geotechnical materials. However, only for the grsiSa class was an acceptable value reached, but it was negated by the fact that for this class, the results were based on only two samples. High random variability was more aptly characterized by the interval between minimum and maximum values—see Min and Max statistics (Table 2). For some classes, the maximum values were more than twenty-five times the minimum values. The intervals of possible occurrence of Mr,eff values also more or less overlapped between individual classes.
It is also worth mentioning how many loading cycles were needed to reach the desired state, when there was no change in elastic displacements and it was possible to end the test. It is generally assumed that this state is reached in approximately 50 cycles. For the tested subgrade materials, an increase in test duration was evident, and for many specimens, up to 200 cycles was needed. This was due to the unfavorable properties of the soils, namely their cohesion, greater elasticity, and low load-bearing capacity compared to the materials used in the base and sub-base.

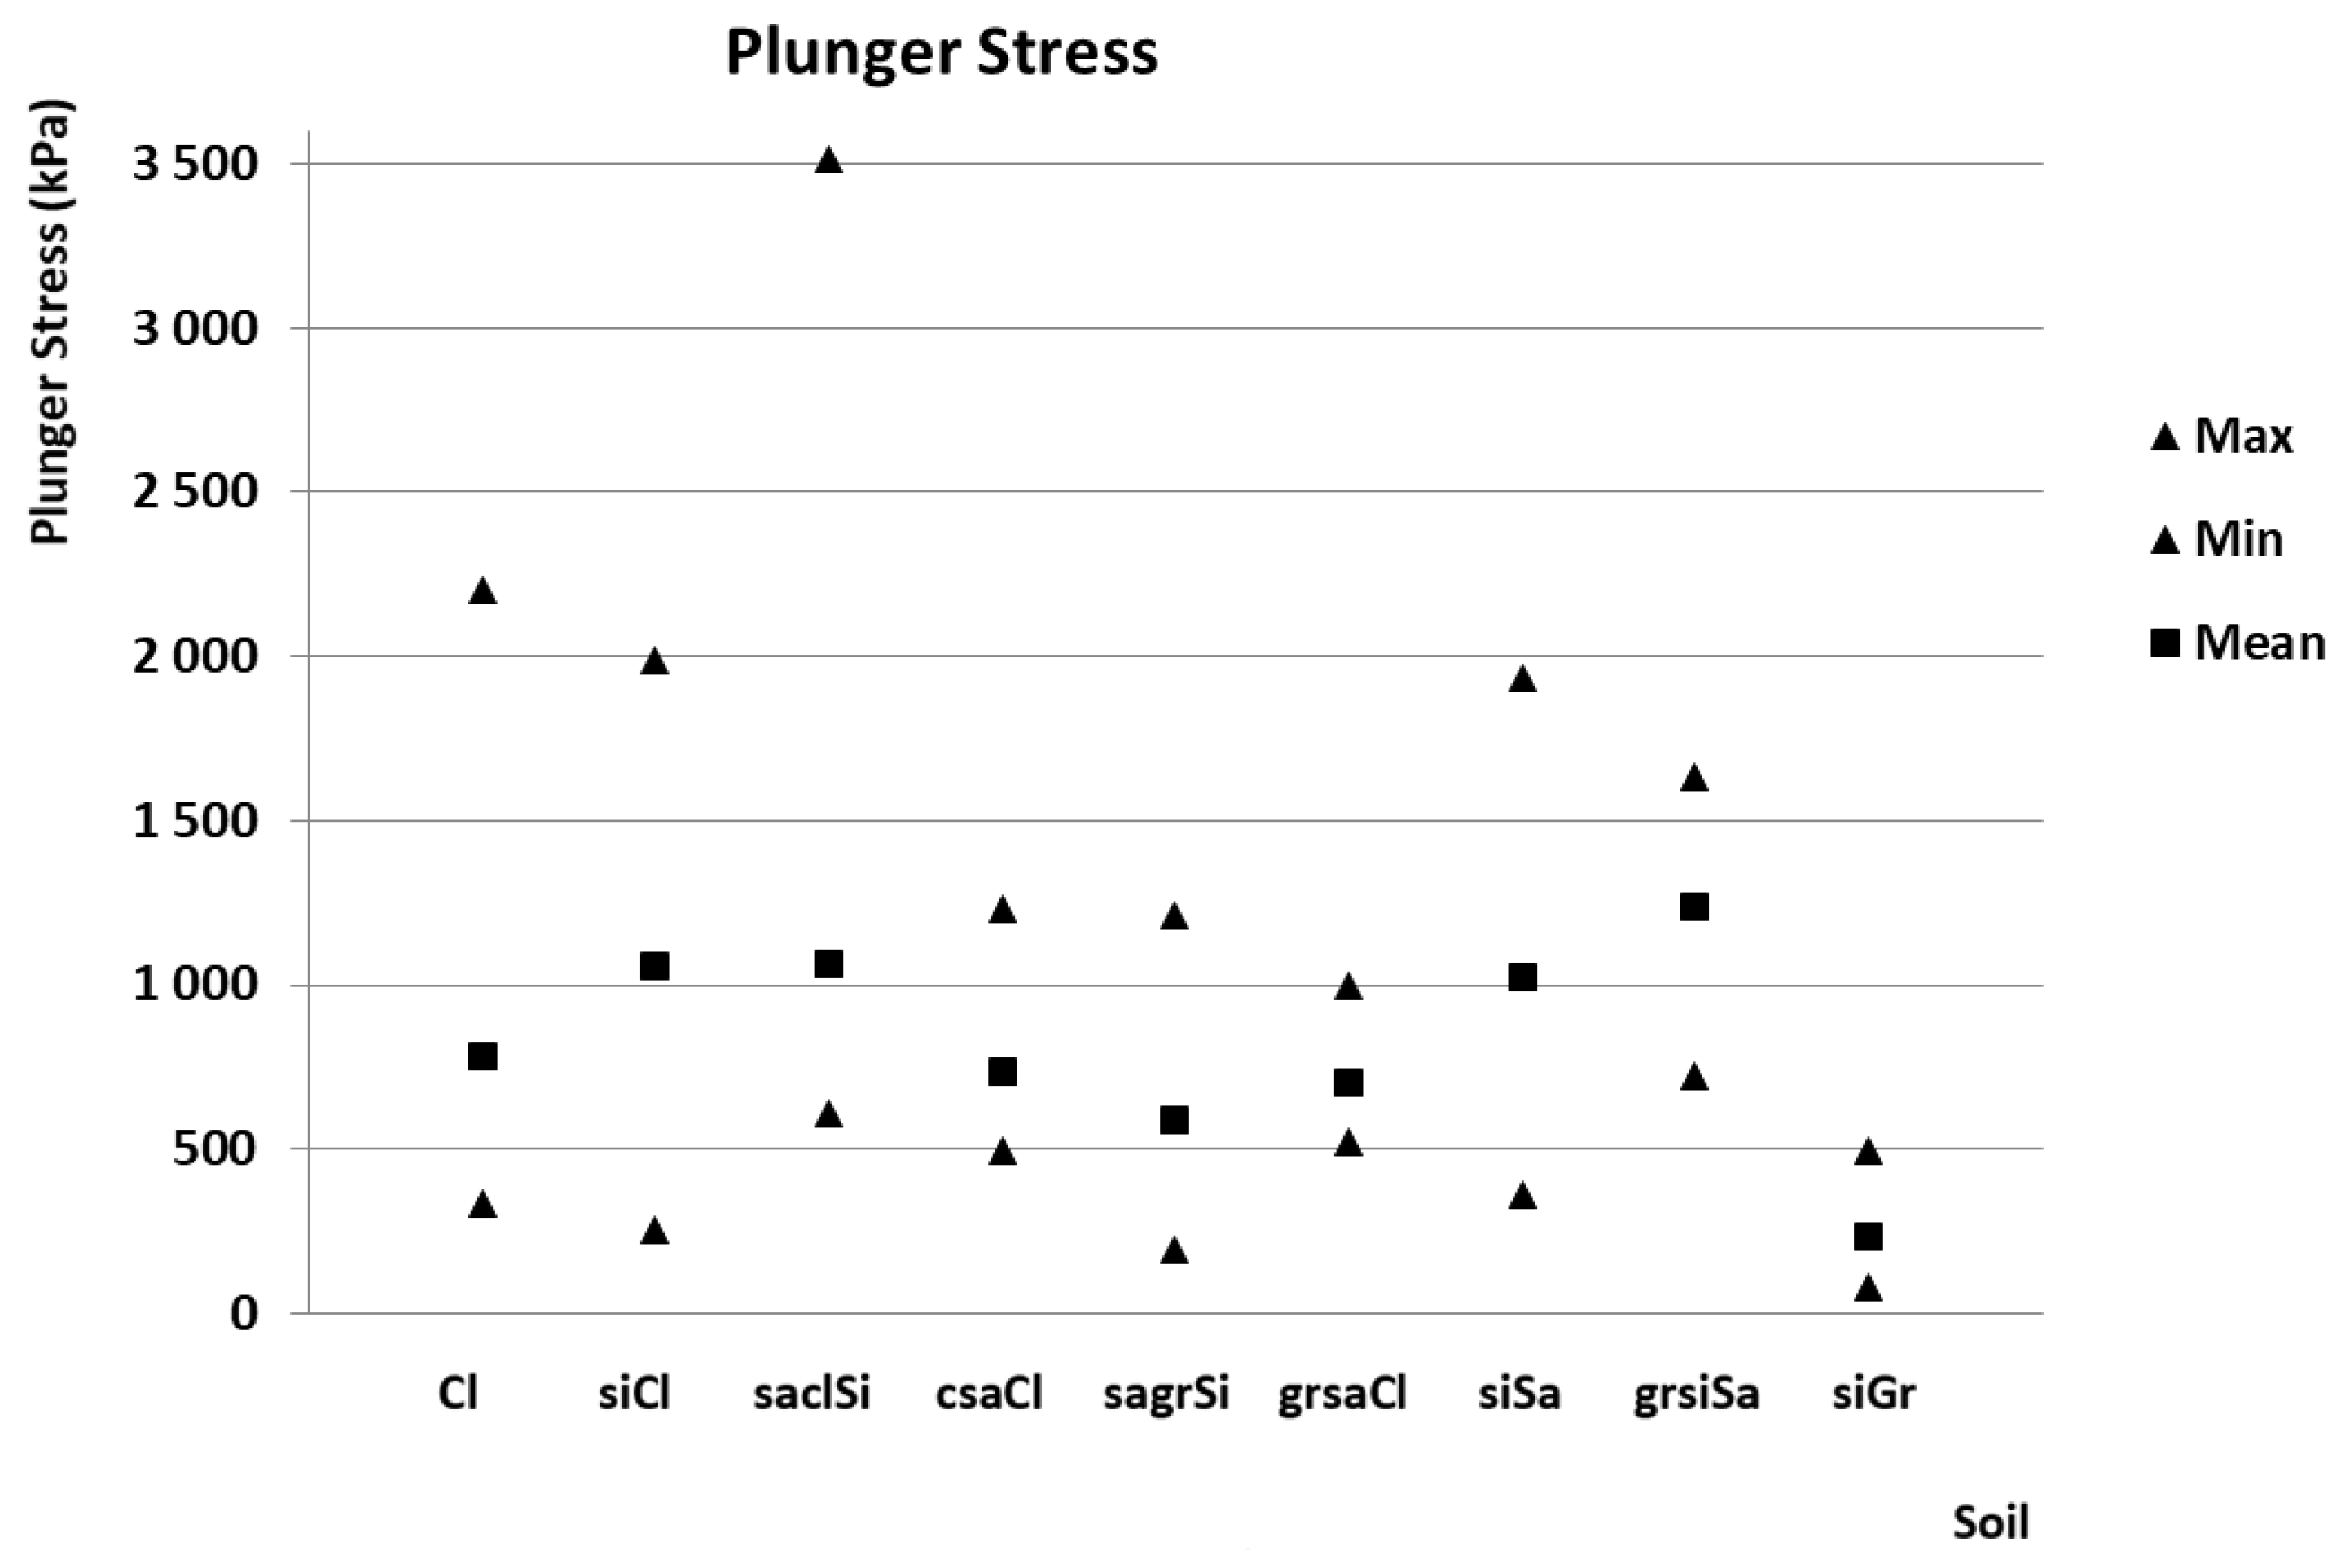
3.2. Results—Plunger Stress Analysis

The detected high variability of the modulus Mr,eff was analyzed. The basic parameters of individual specimens were monitored, including humidity, density, and plunger stress, to possibly explain the reasons for the above findings. The actual humidity and density of the specimens did not differ much from the determined optimum humidity and maximum density according to the Proctor Standard energy. Therefore, these parameters were not further investigated. On the contrary, the plunger stress values in which the values of elastic displacements used to calculate the modulus Mr,eff are obtained were interesting and significant. The plunger stress values at the end of cycling were determined for each of 276 tested specimens, and the obtained intervals for individual soils classes are shown in Figure 2.
The most important fact resulting from Figure 2 is a very wide interval of plunger stress, which was achieved during the test both within one soil class as well as within individual samples and specimens. Specimens were exposed to different stress values, i.e., different stress levels, one at a time. If we exposed one and the same specimen of material to different plunger stresses, we also obtained different values of the modulus Mr,eff. Furthermore, the greater variability of the applied stress naturally increased the variability of the Mr,eff values. In addition to the inherent random variability of physical–mechanical properties of unbound materials, the pseudo-random effect of plunger stress variability was added at which the modulus Mr,eff was calculated. Additionally, the positive correlation between the stress and the modulus Mr,eff could be expected, i.e., there was a generally high probability that the Mr,eff value would increase with increasing plunger stresses.
The maximum values of the plunger stress reached up to 2000 kPa and in the case of one soil class up to 3500 kPa. If we would have compared the stress values with the assumed maximum load-bearing capacity of the soils according to Terzagi’s theory, the maximum value of soil load-bearing capacity would have been between 150 and 650 kPa [27] according to soil type [25]; in many cases, these limit values were exceeded many times during testing. Thus, the modulus Mr,eff for a large number of specimens was determined on the damaged material. Furthermore, even in the case of specimens for which the plunger stress did not exceed this limit, there were stress values that could not occur in the properly designed pavement structure. Thus, the basic requirement for determining this deformation characteristic of unbound materials was not met—to perform testing on intact specimens and optimally under a state of stress corresponding to the future real state of stress in the material used in the pavement structure.
As part of the plunger stress analysis, the statistical analysis of the plunger stress as well as the corresponding Mr,eff values were performed. For each soil type, mean value, standard deviation, coefficient of variation, minimum and maximum value of plunger stress, and the value of the correlation coefficients (2) between the stress and the corresponding Mr,eff value were calculated. The results of the statistical analysis are summarized in Table 3, where the following statistics are given for each soil class:
  • Mean—mean value of plunger stress,
  • Var—coefficient of variation of plunger stress,
  • Min, Max—minimum and maximum, respectively, value of plunger stress,
  • Cor—correlation coefficient between plunger stress and corresponding Mr,eff value.
Mean values of plunger stress—see Mean statistics (Table 3)—were very high (with exception of the siGr class) and generally exceeded the assumed maximum load-bearing capacity of soils. In addition, random variability—see Var statistic (Table 3)—was significant. The values of the correlation coefficient (with exception of the grsiSa class) ranged from 0.66 to 0.94, which means high to dominant statistical dependence. This confirmed the previously stated assumption about the existence of a positive correlation of the plunger stress and the modulus Mr,eff.

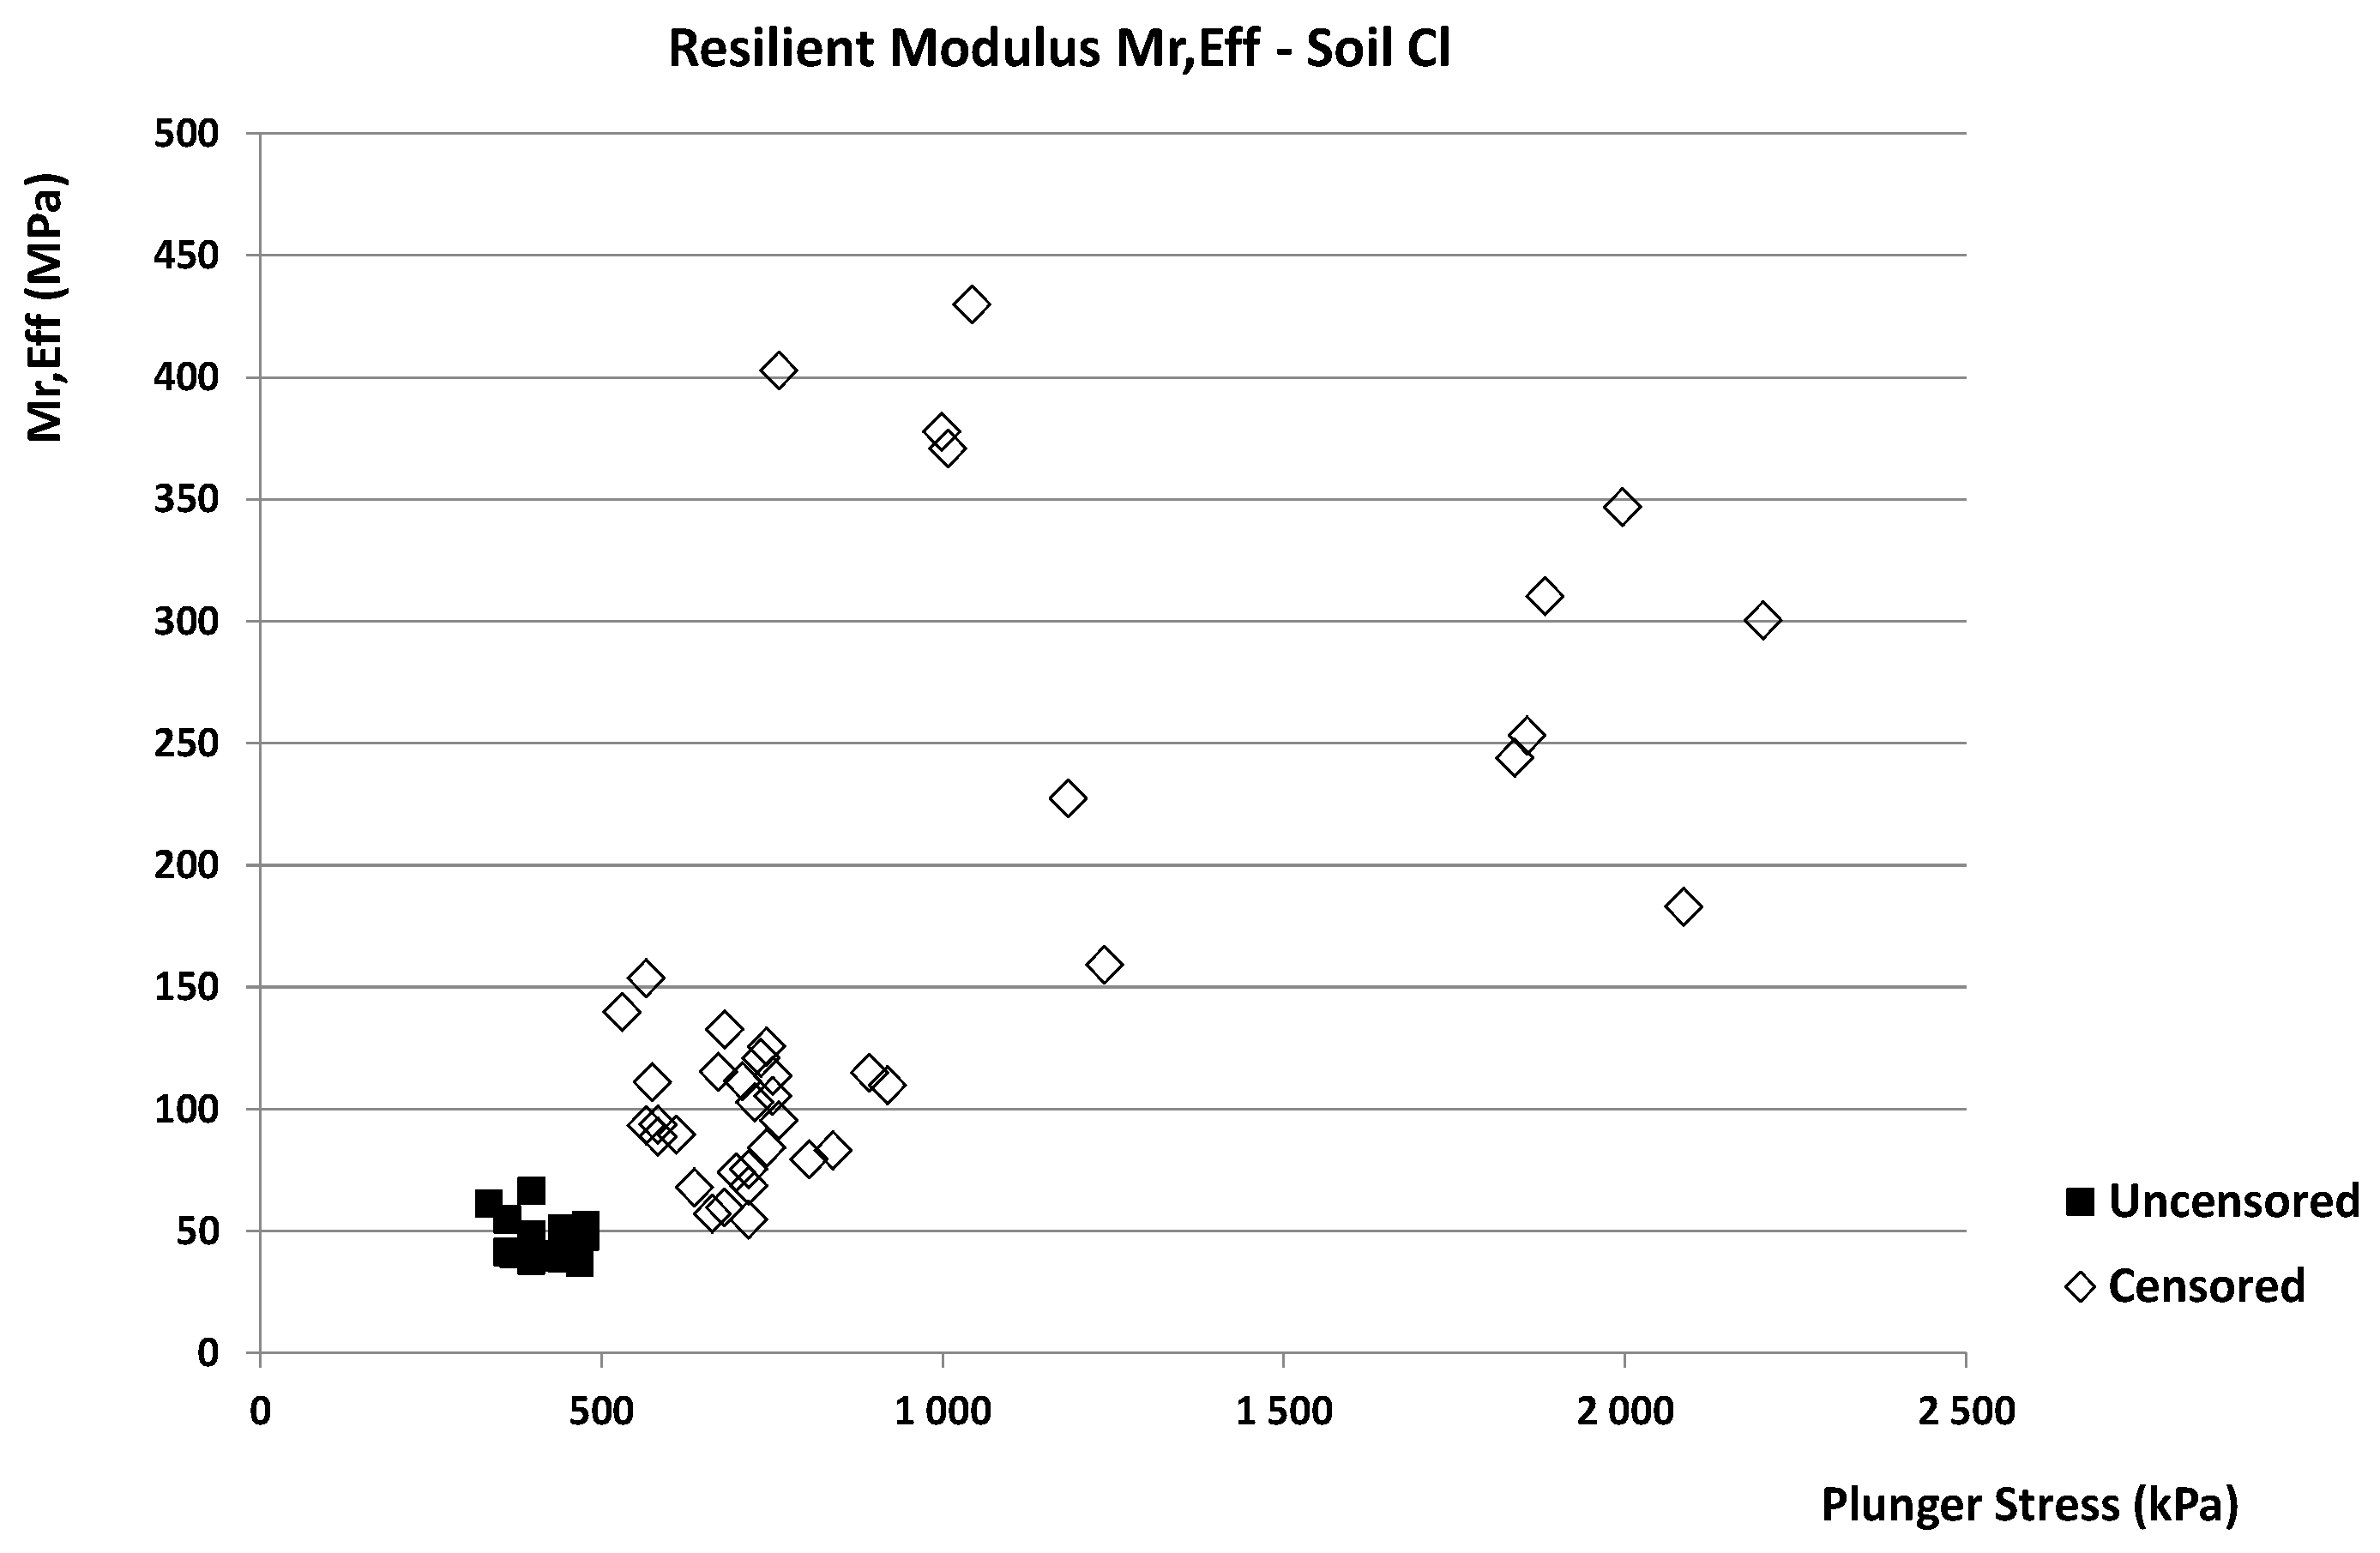
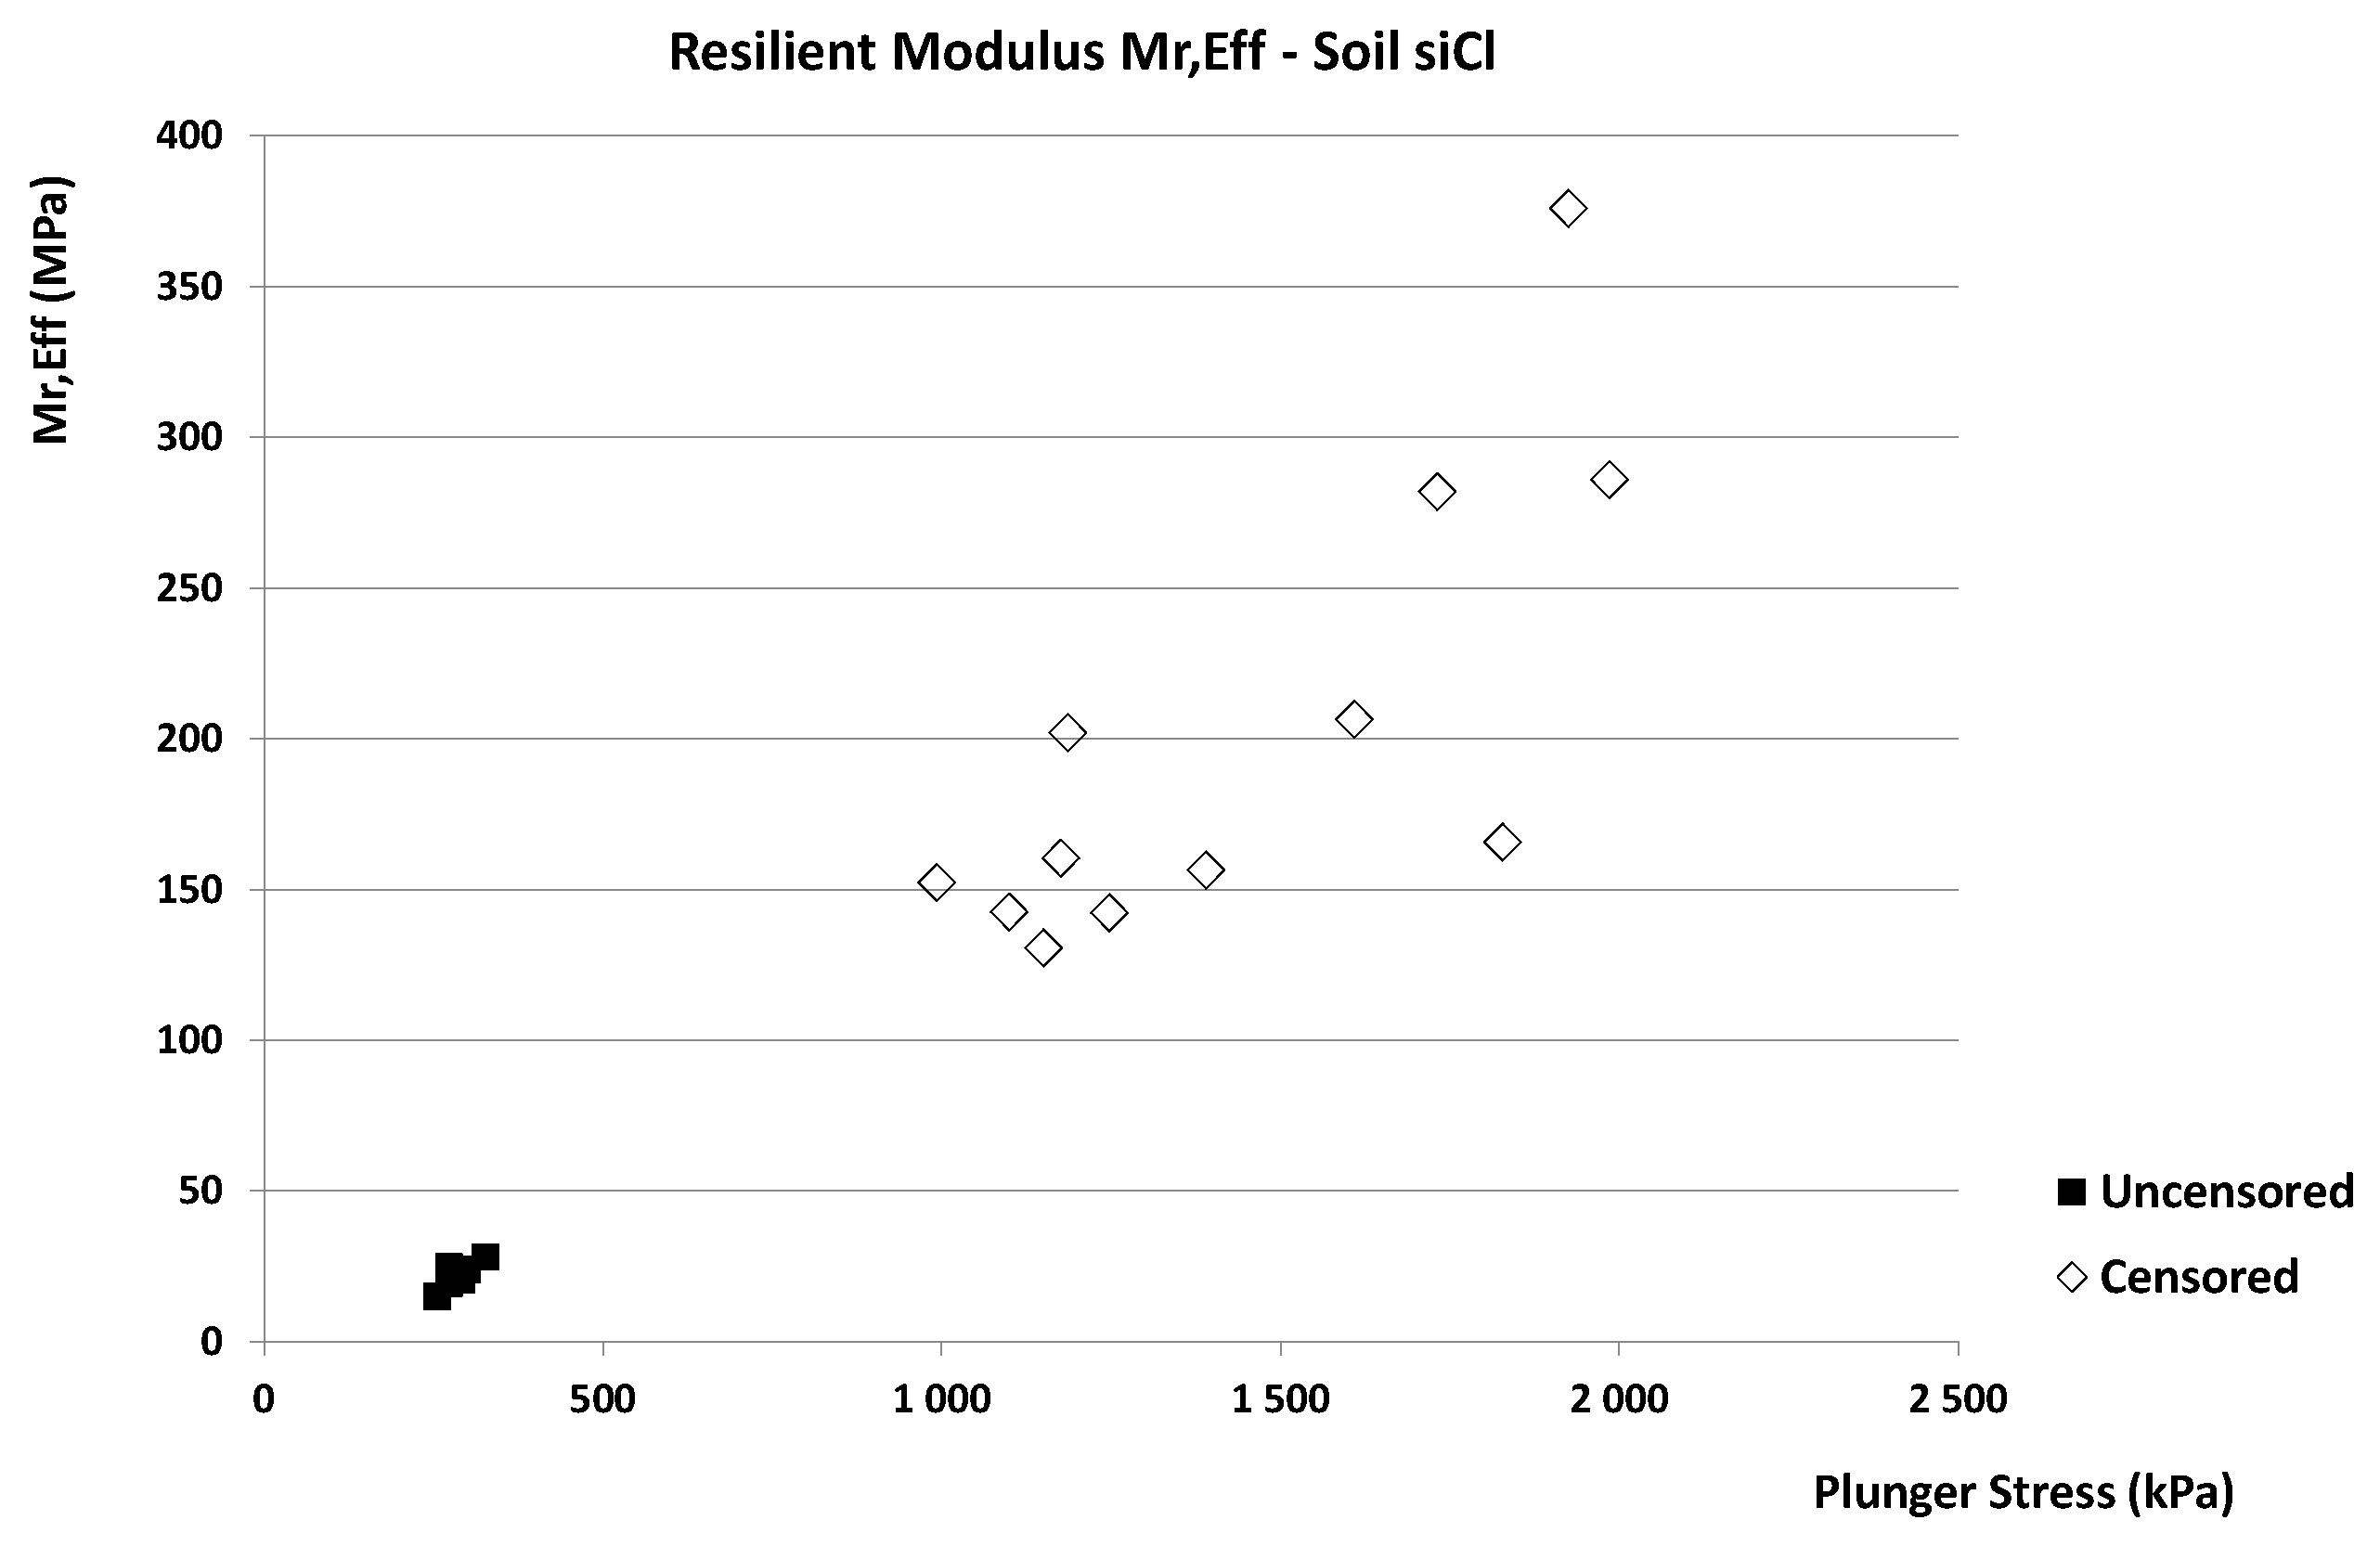
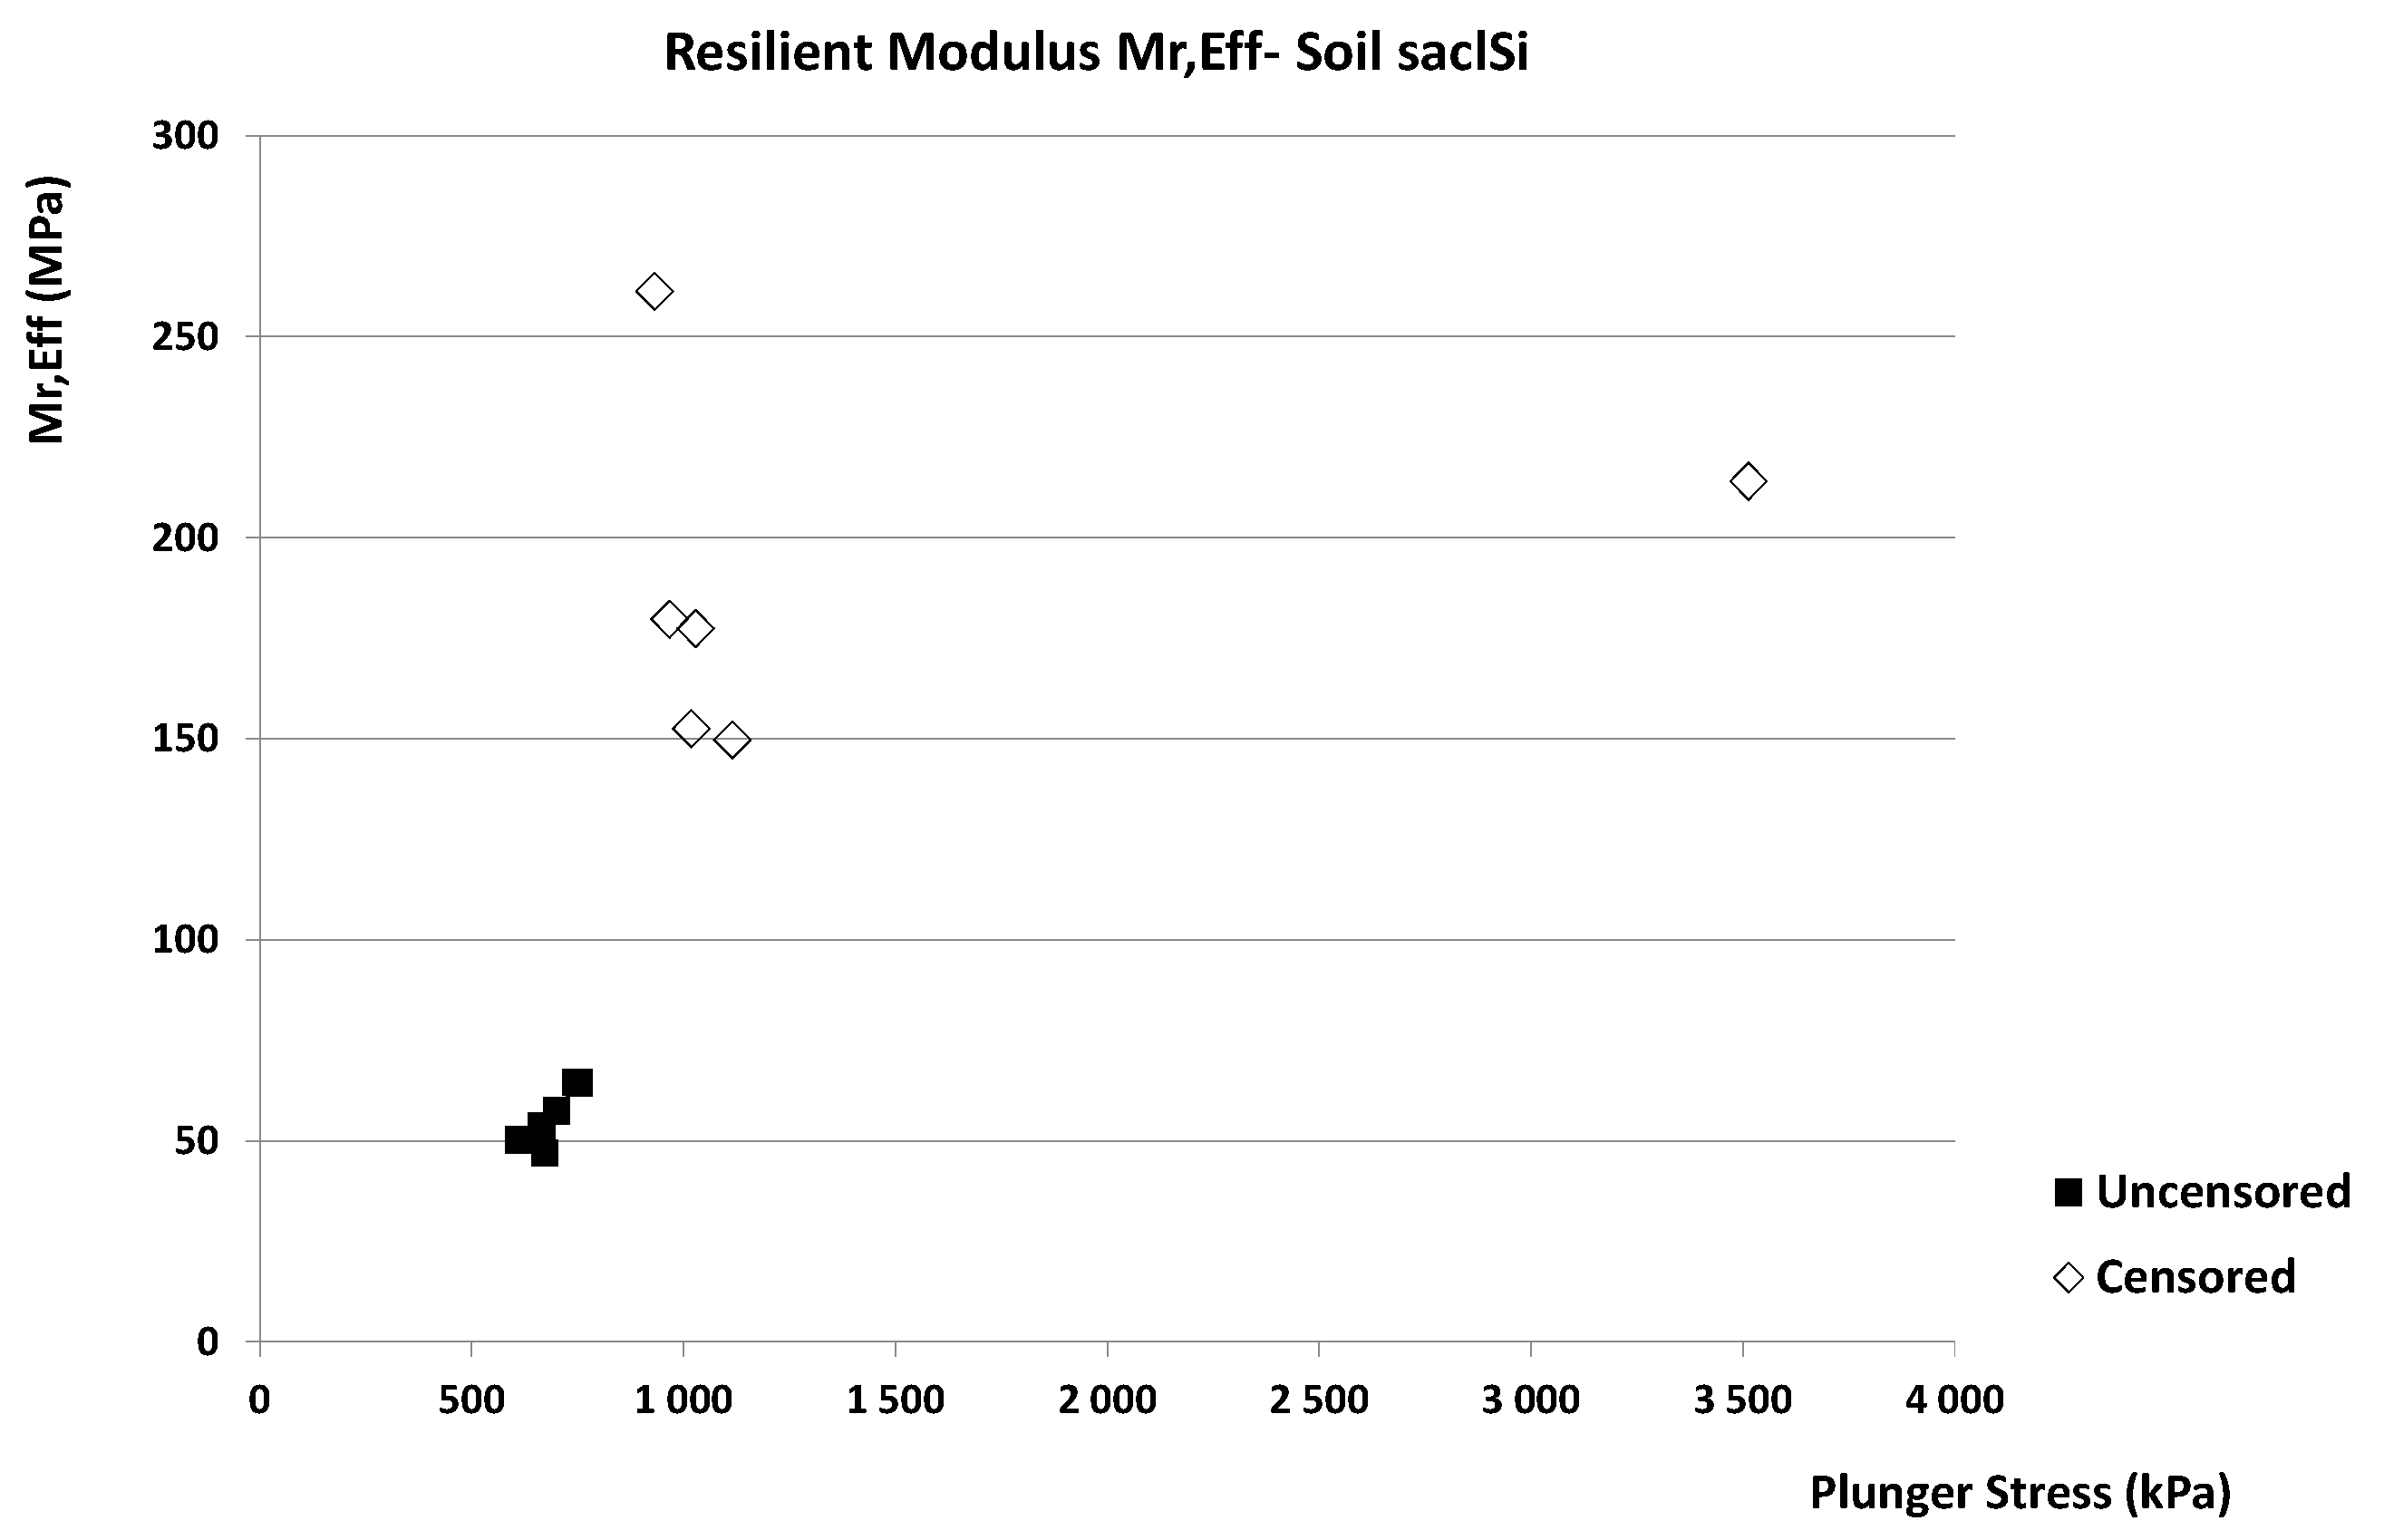
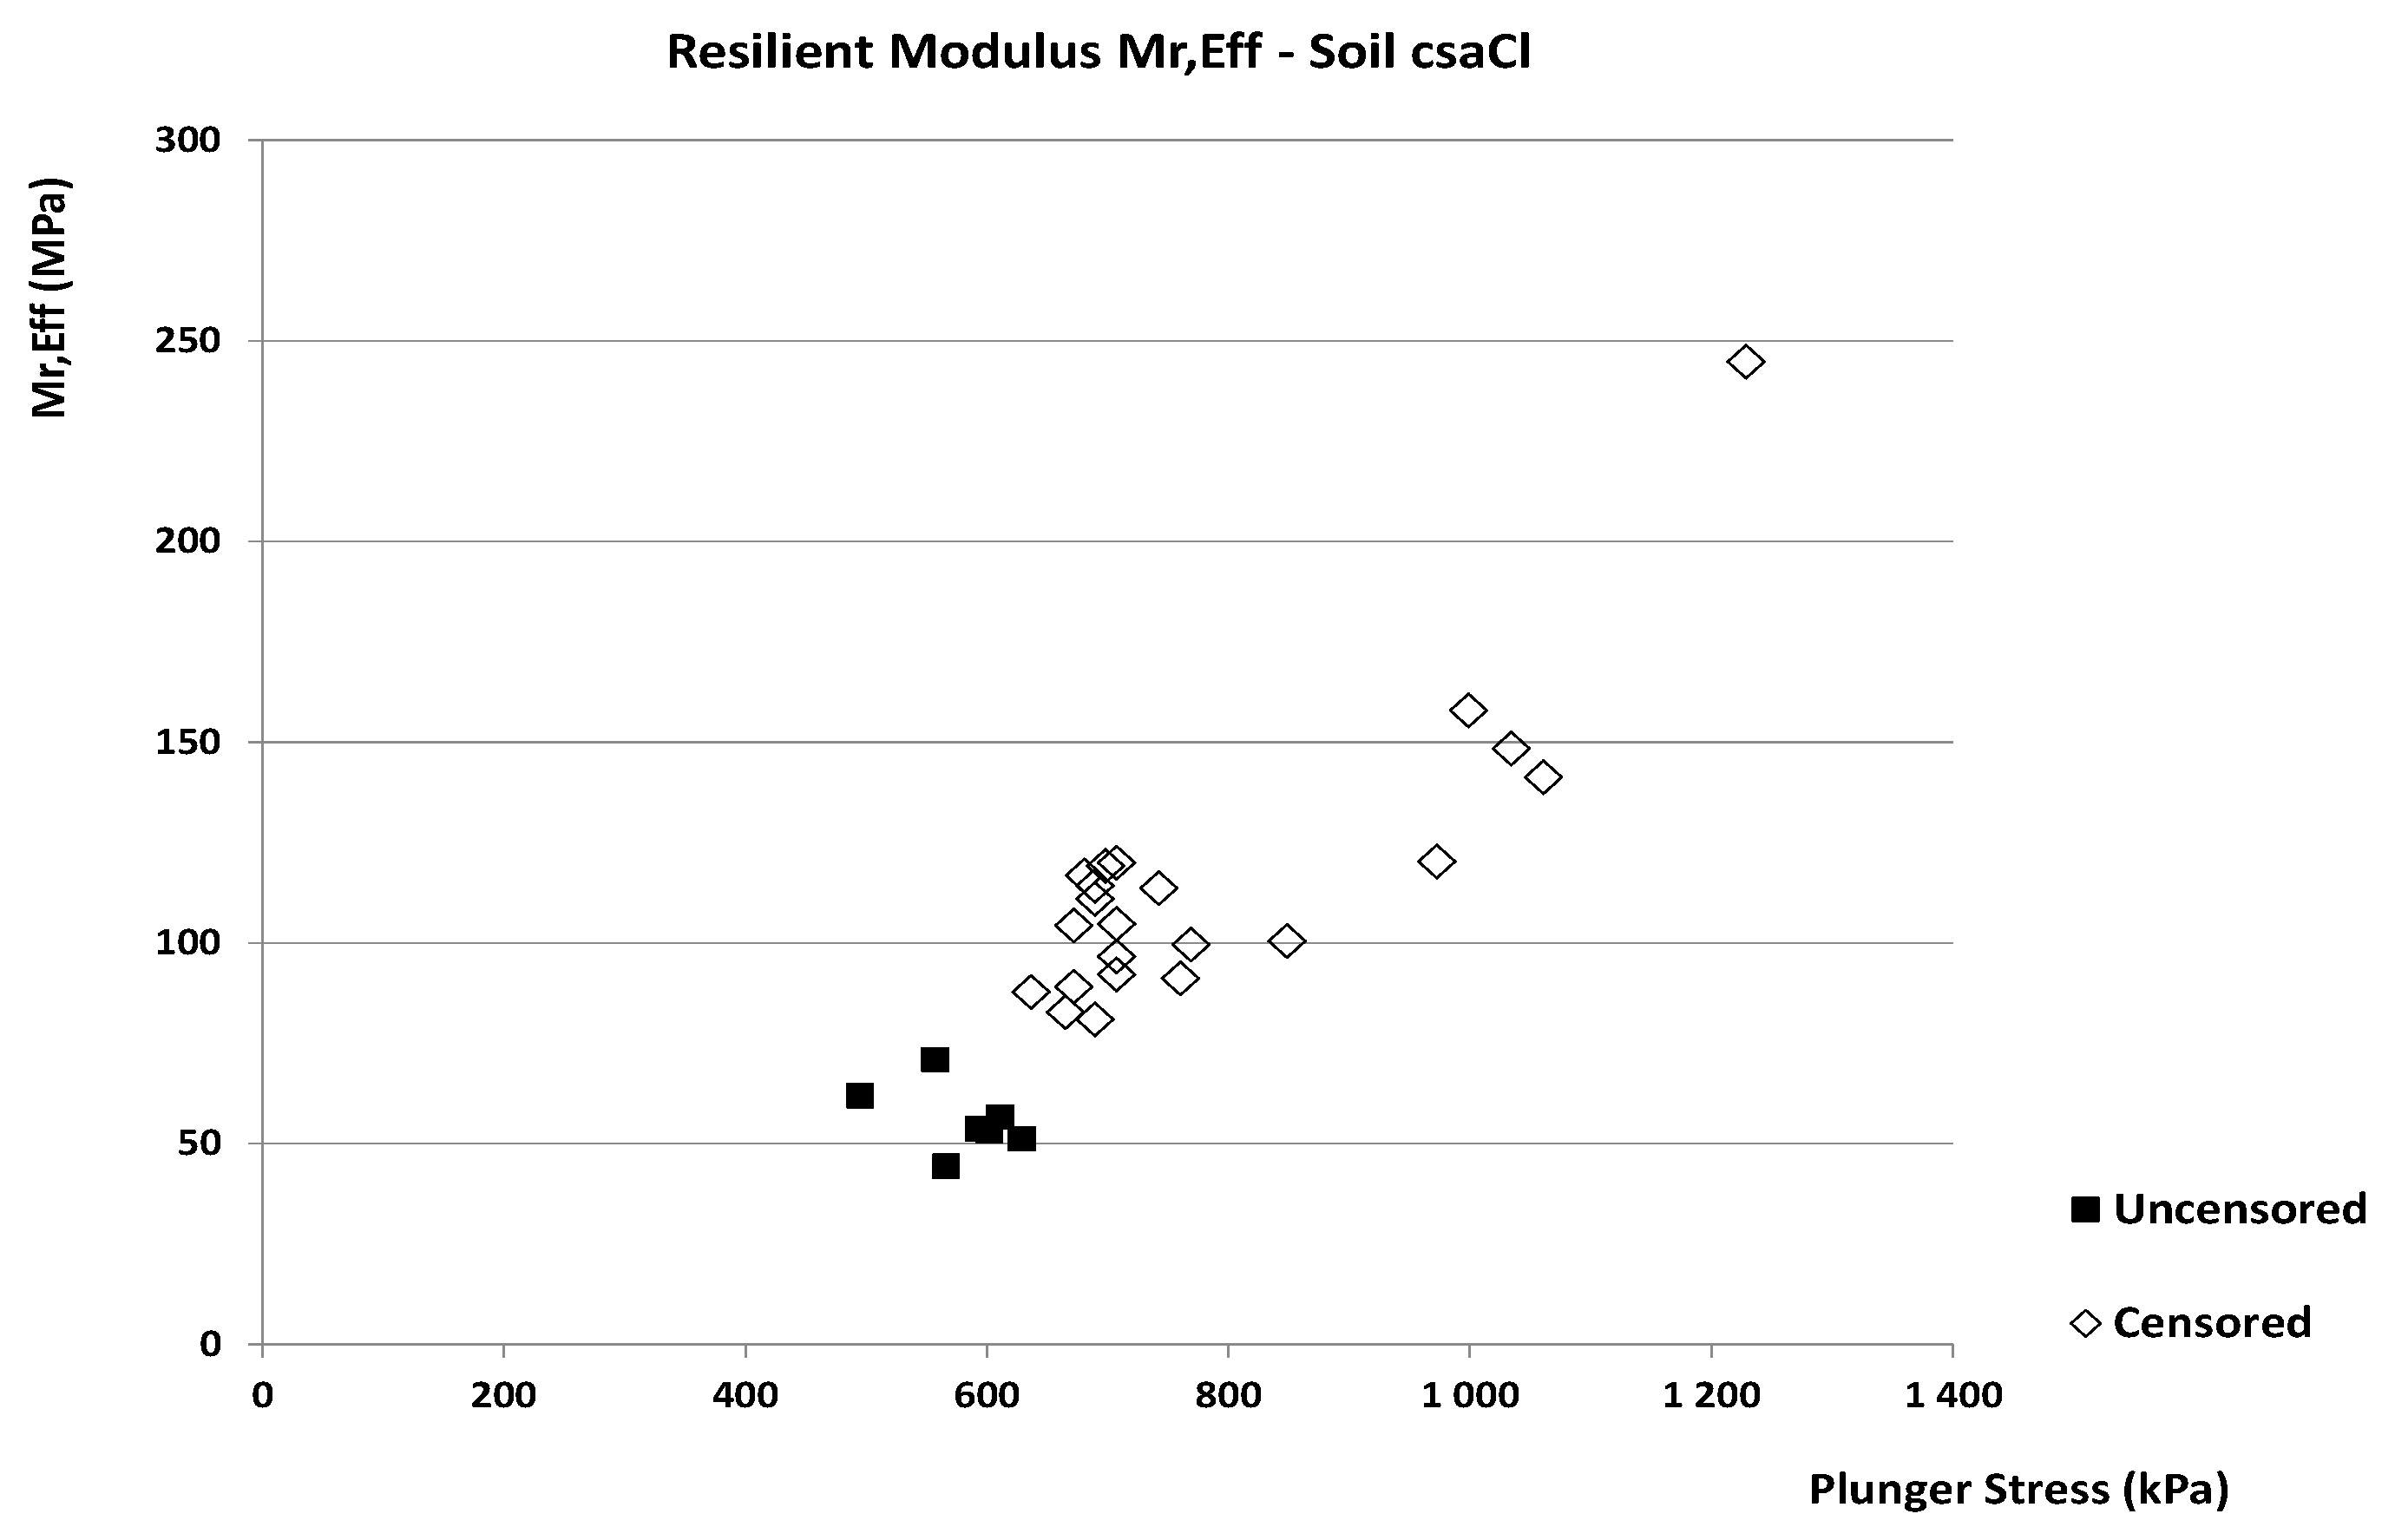
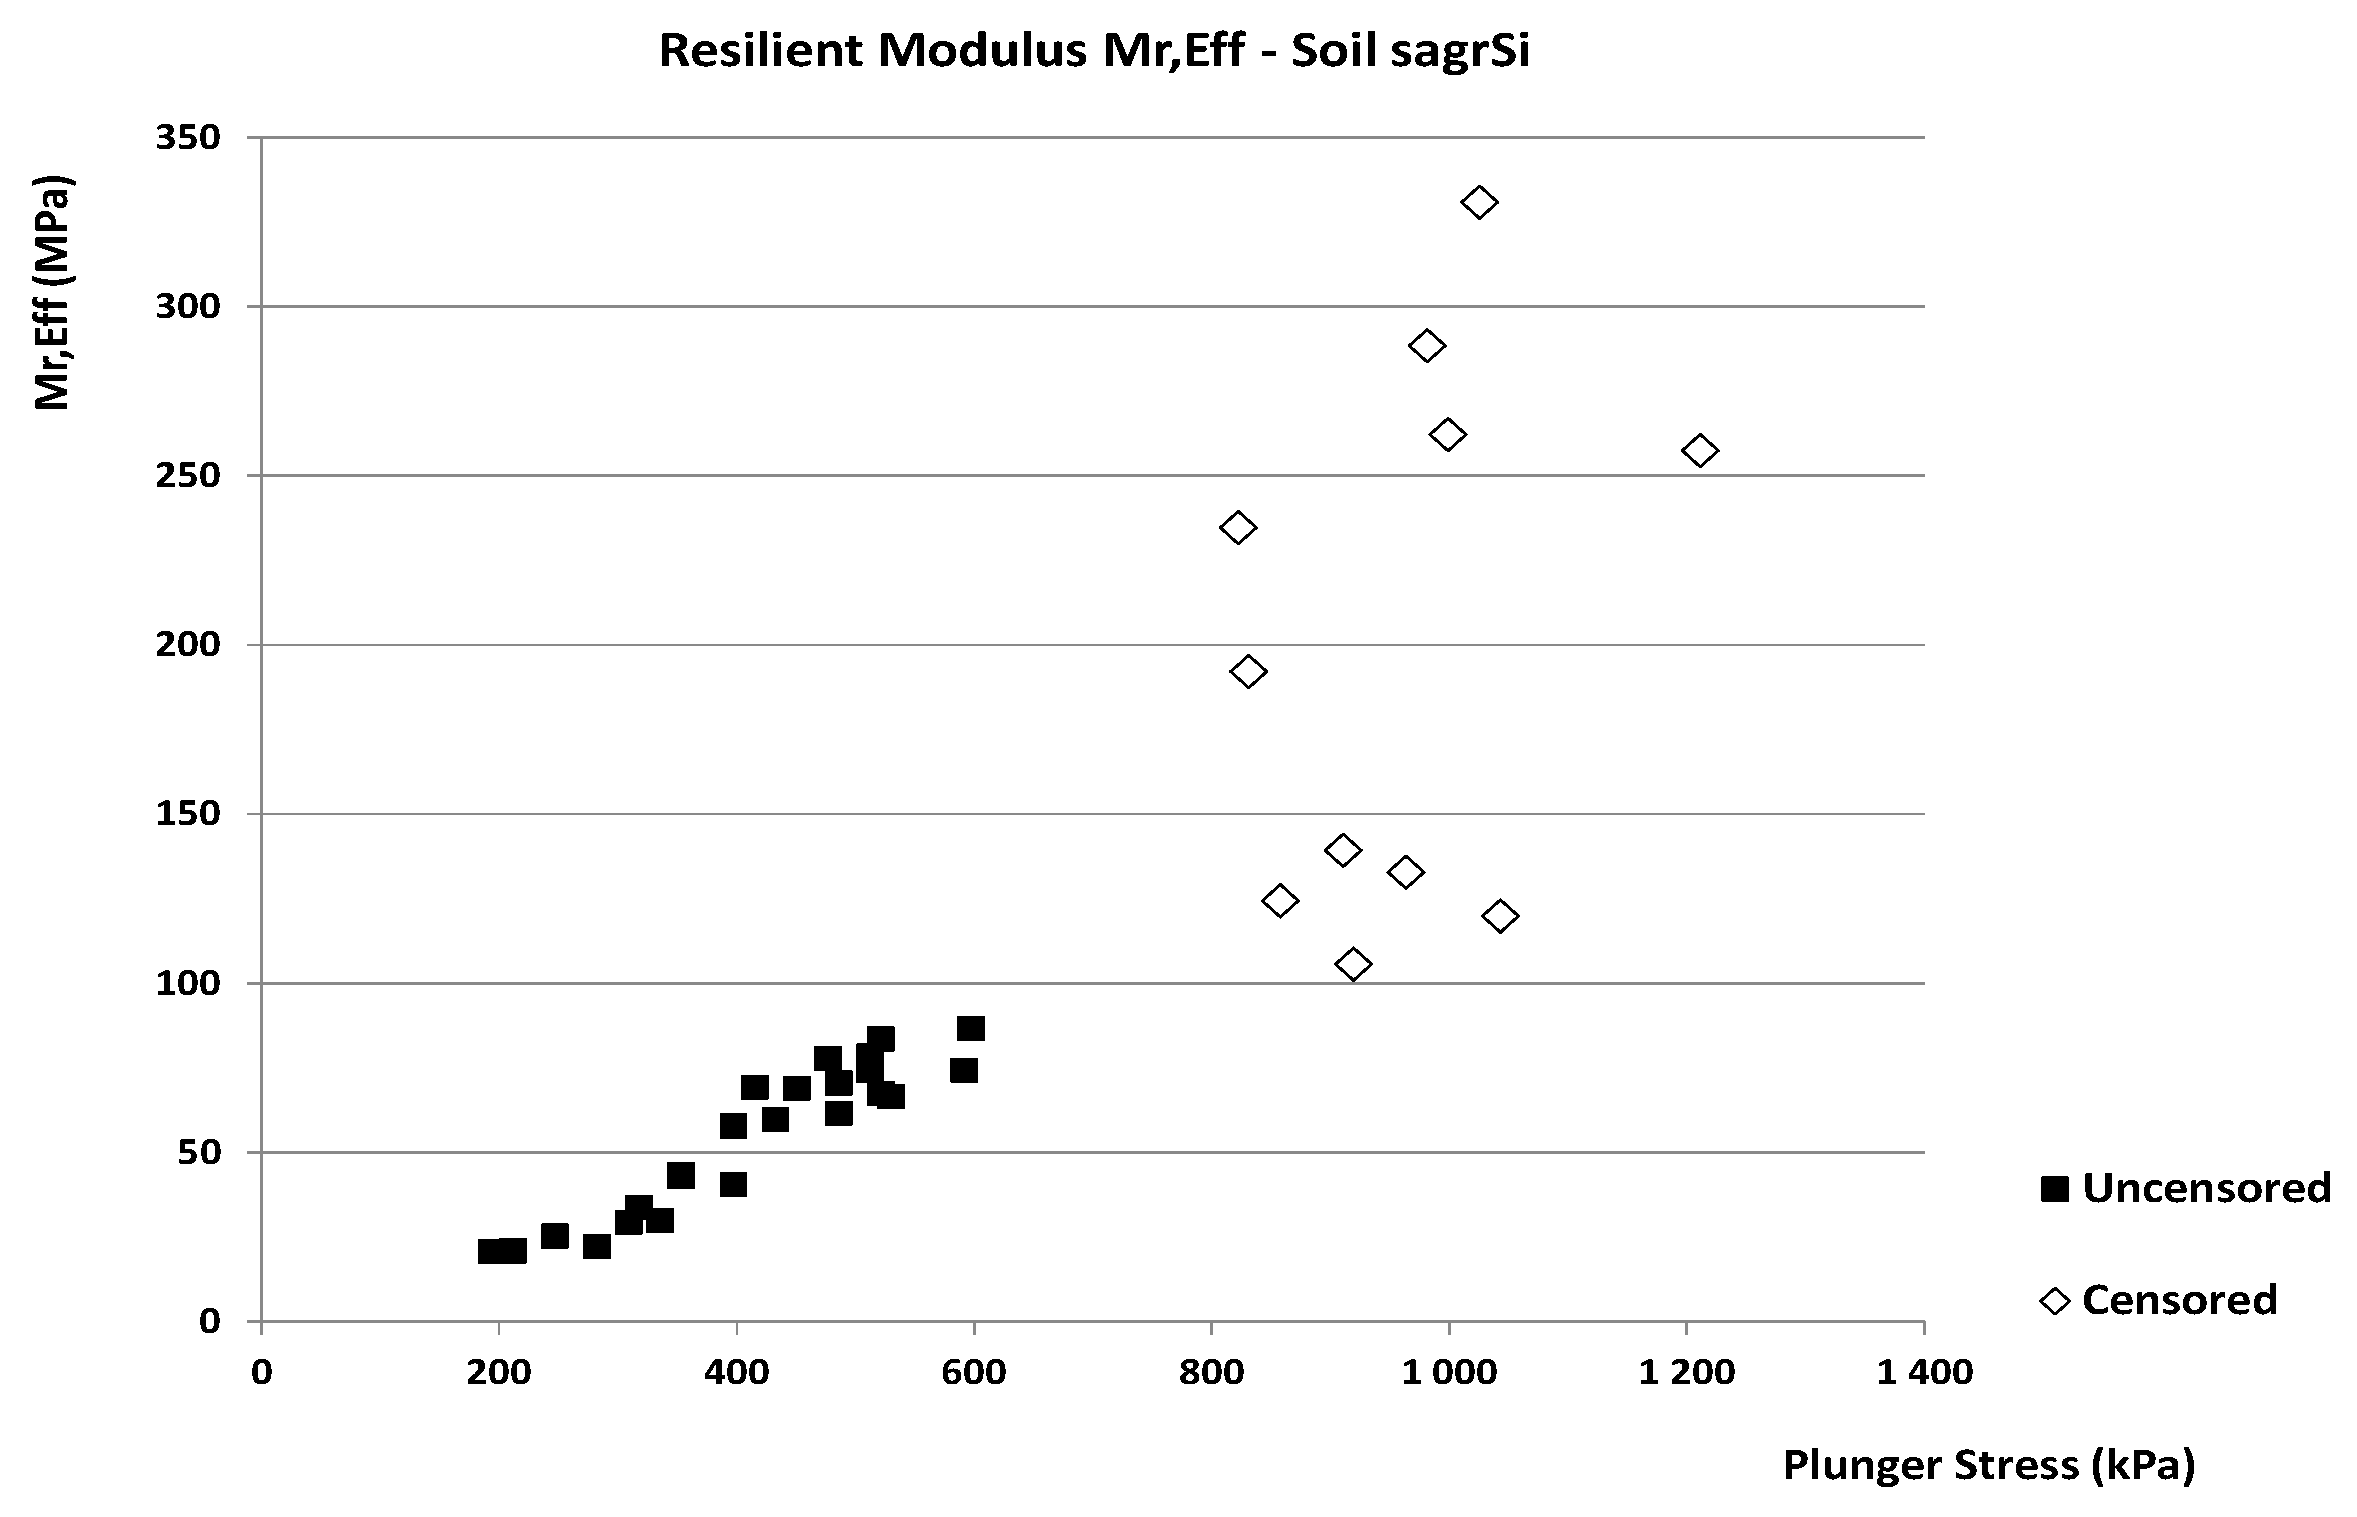
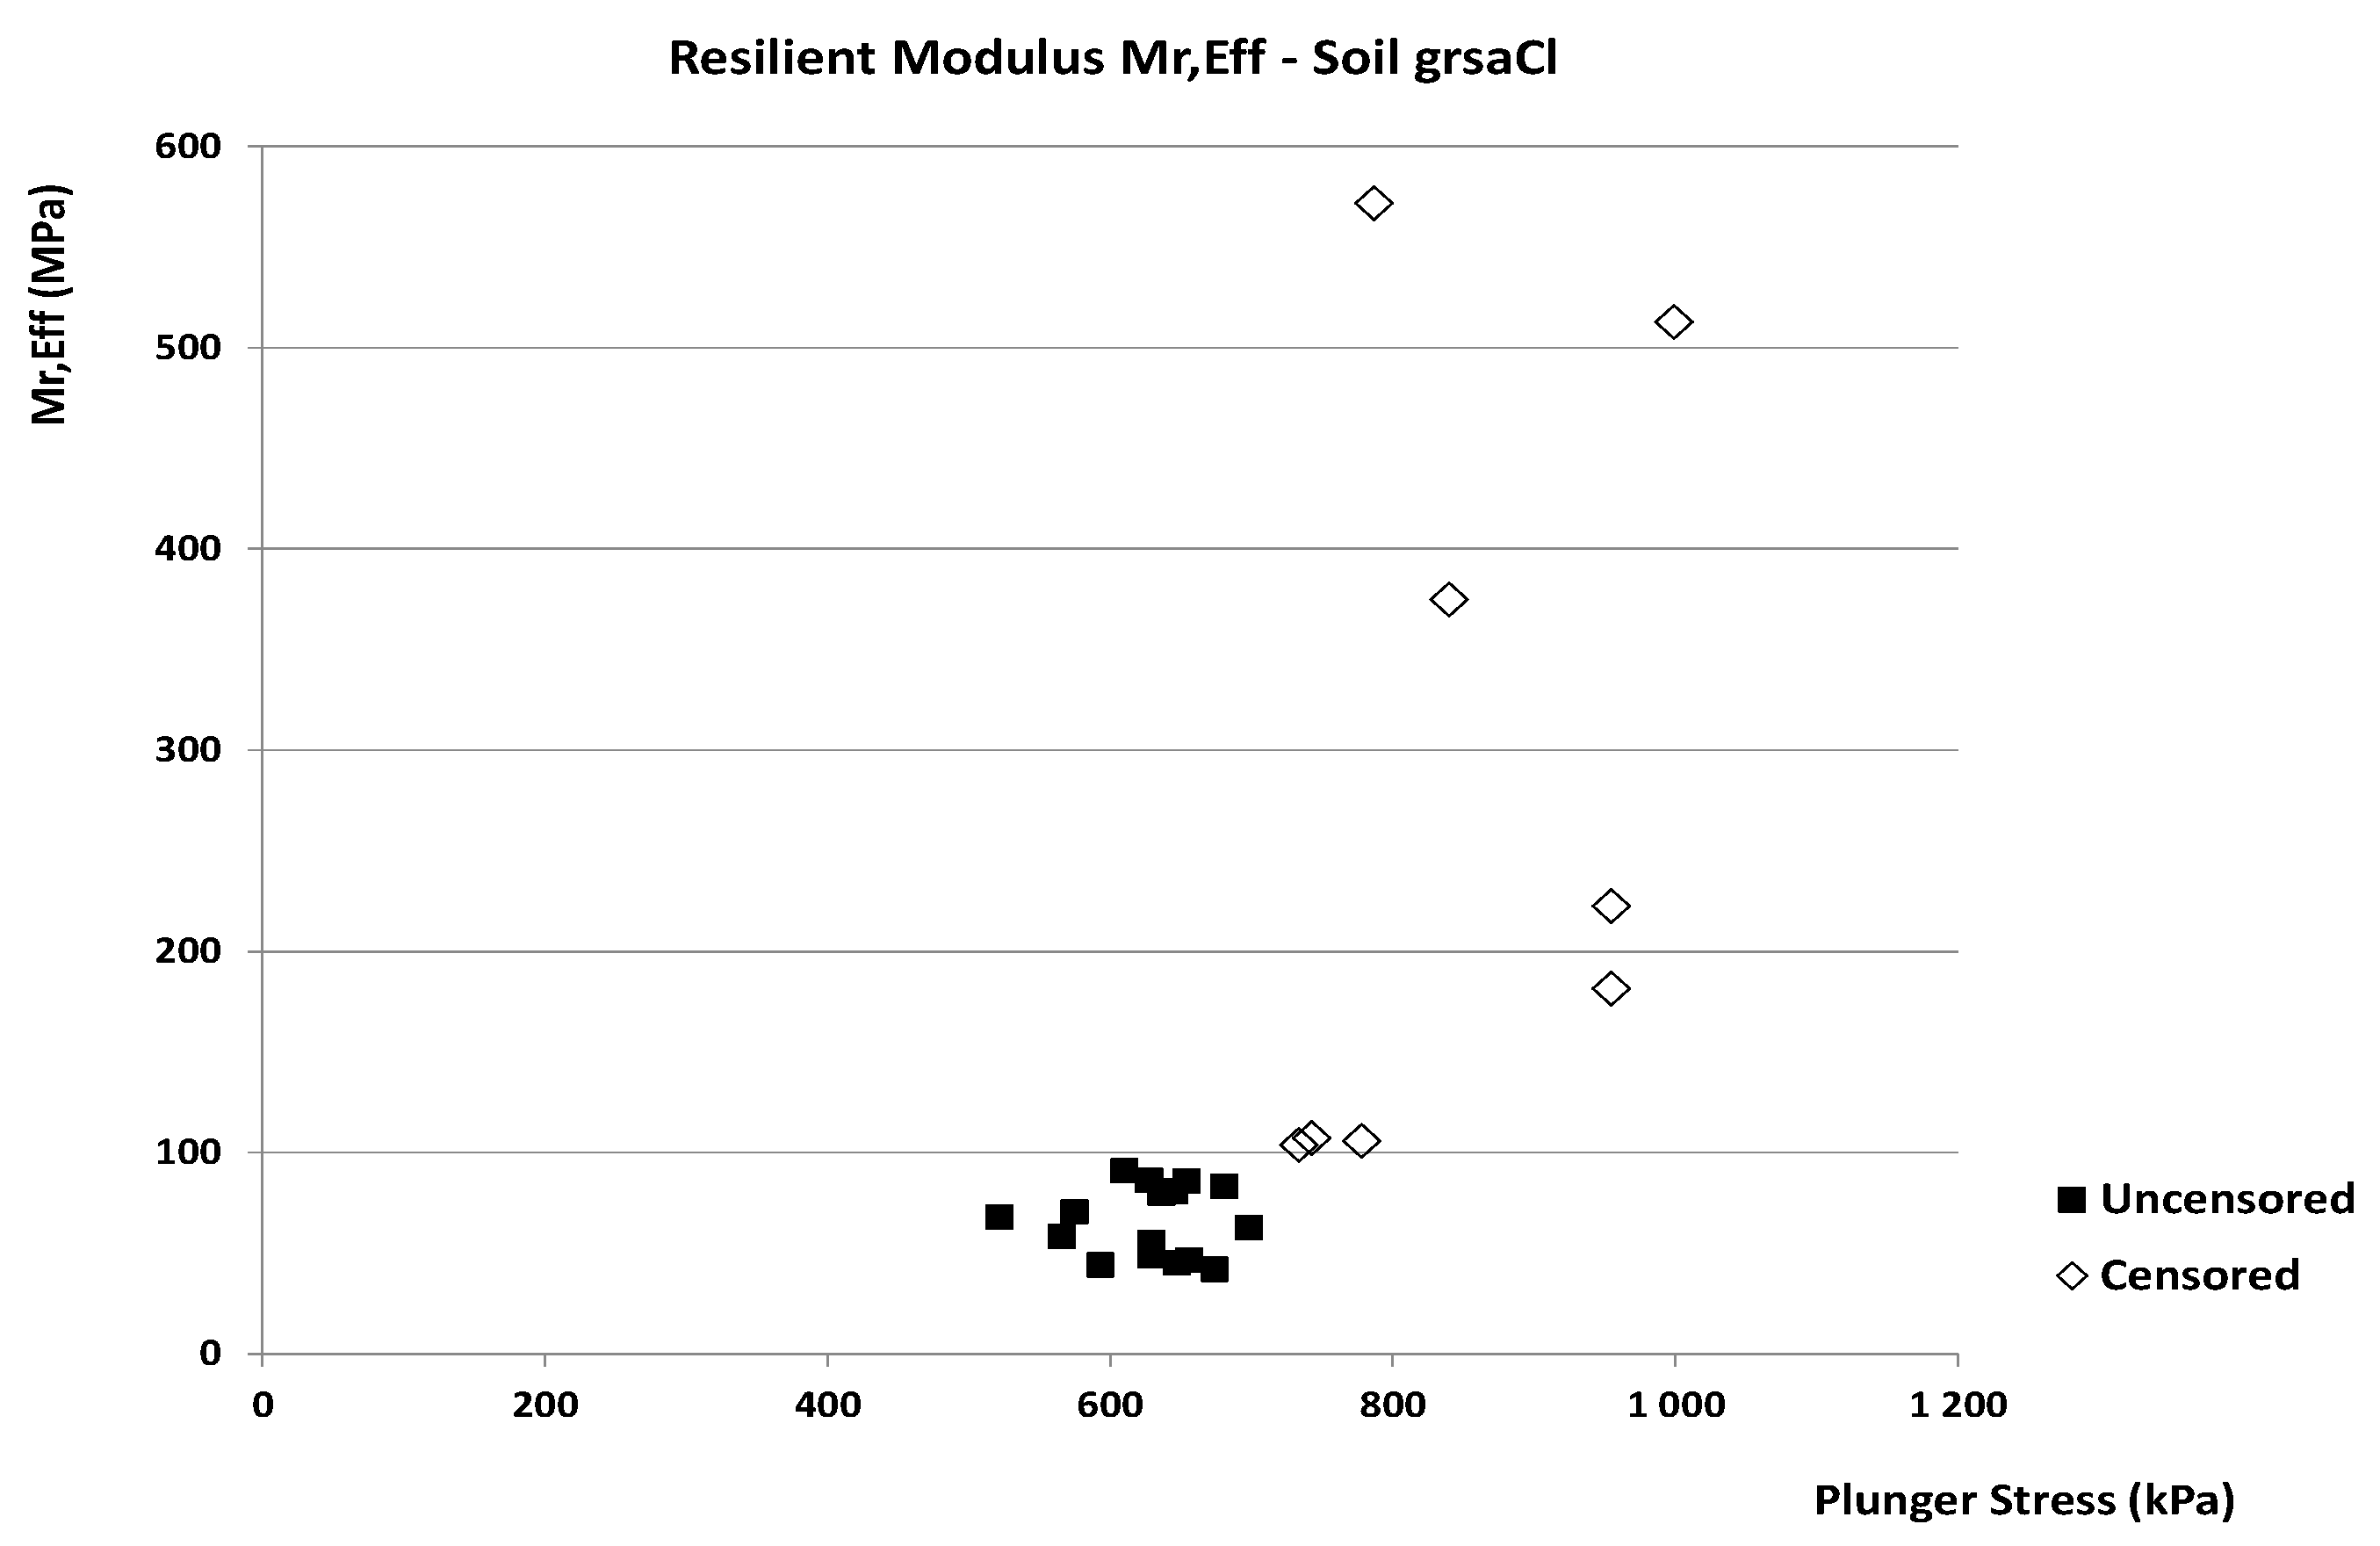
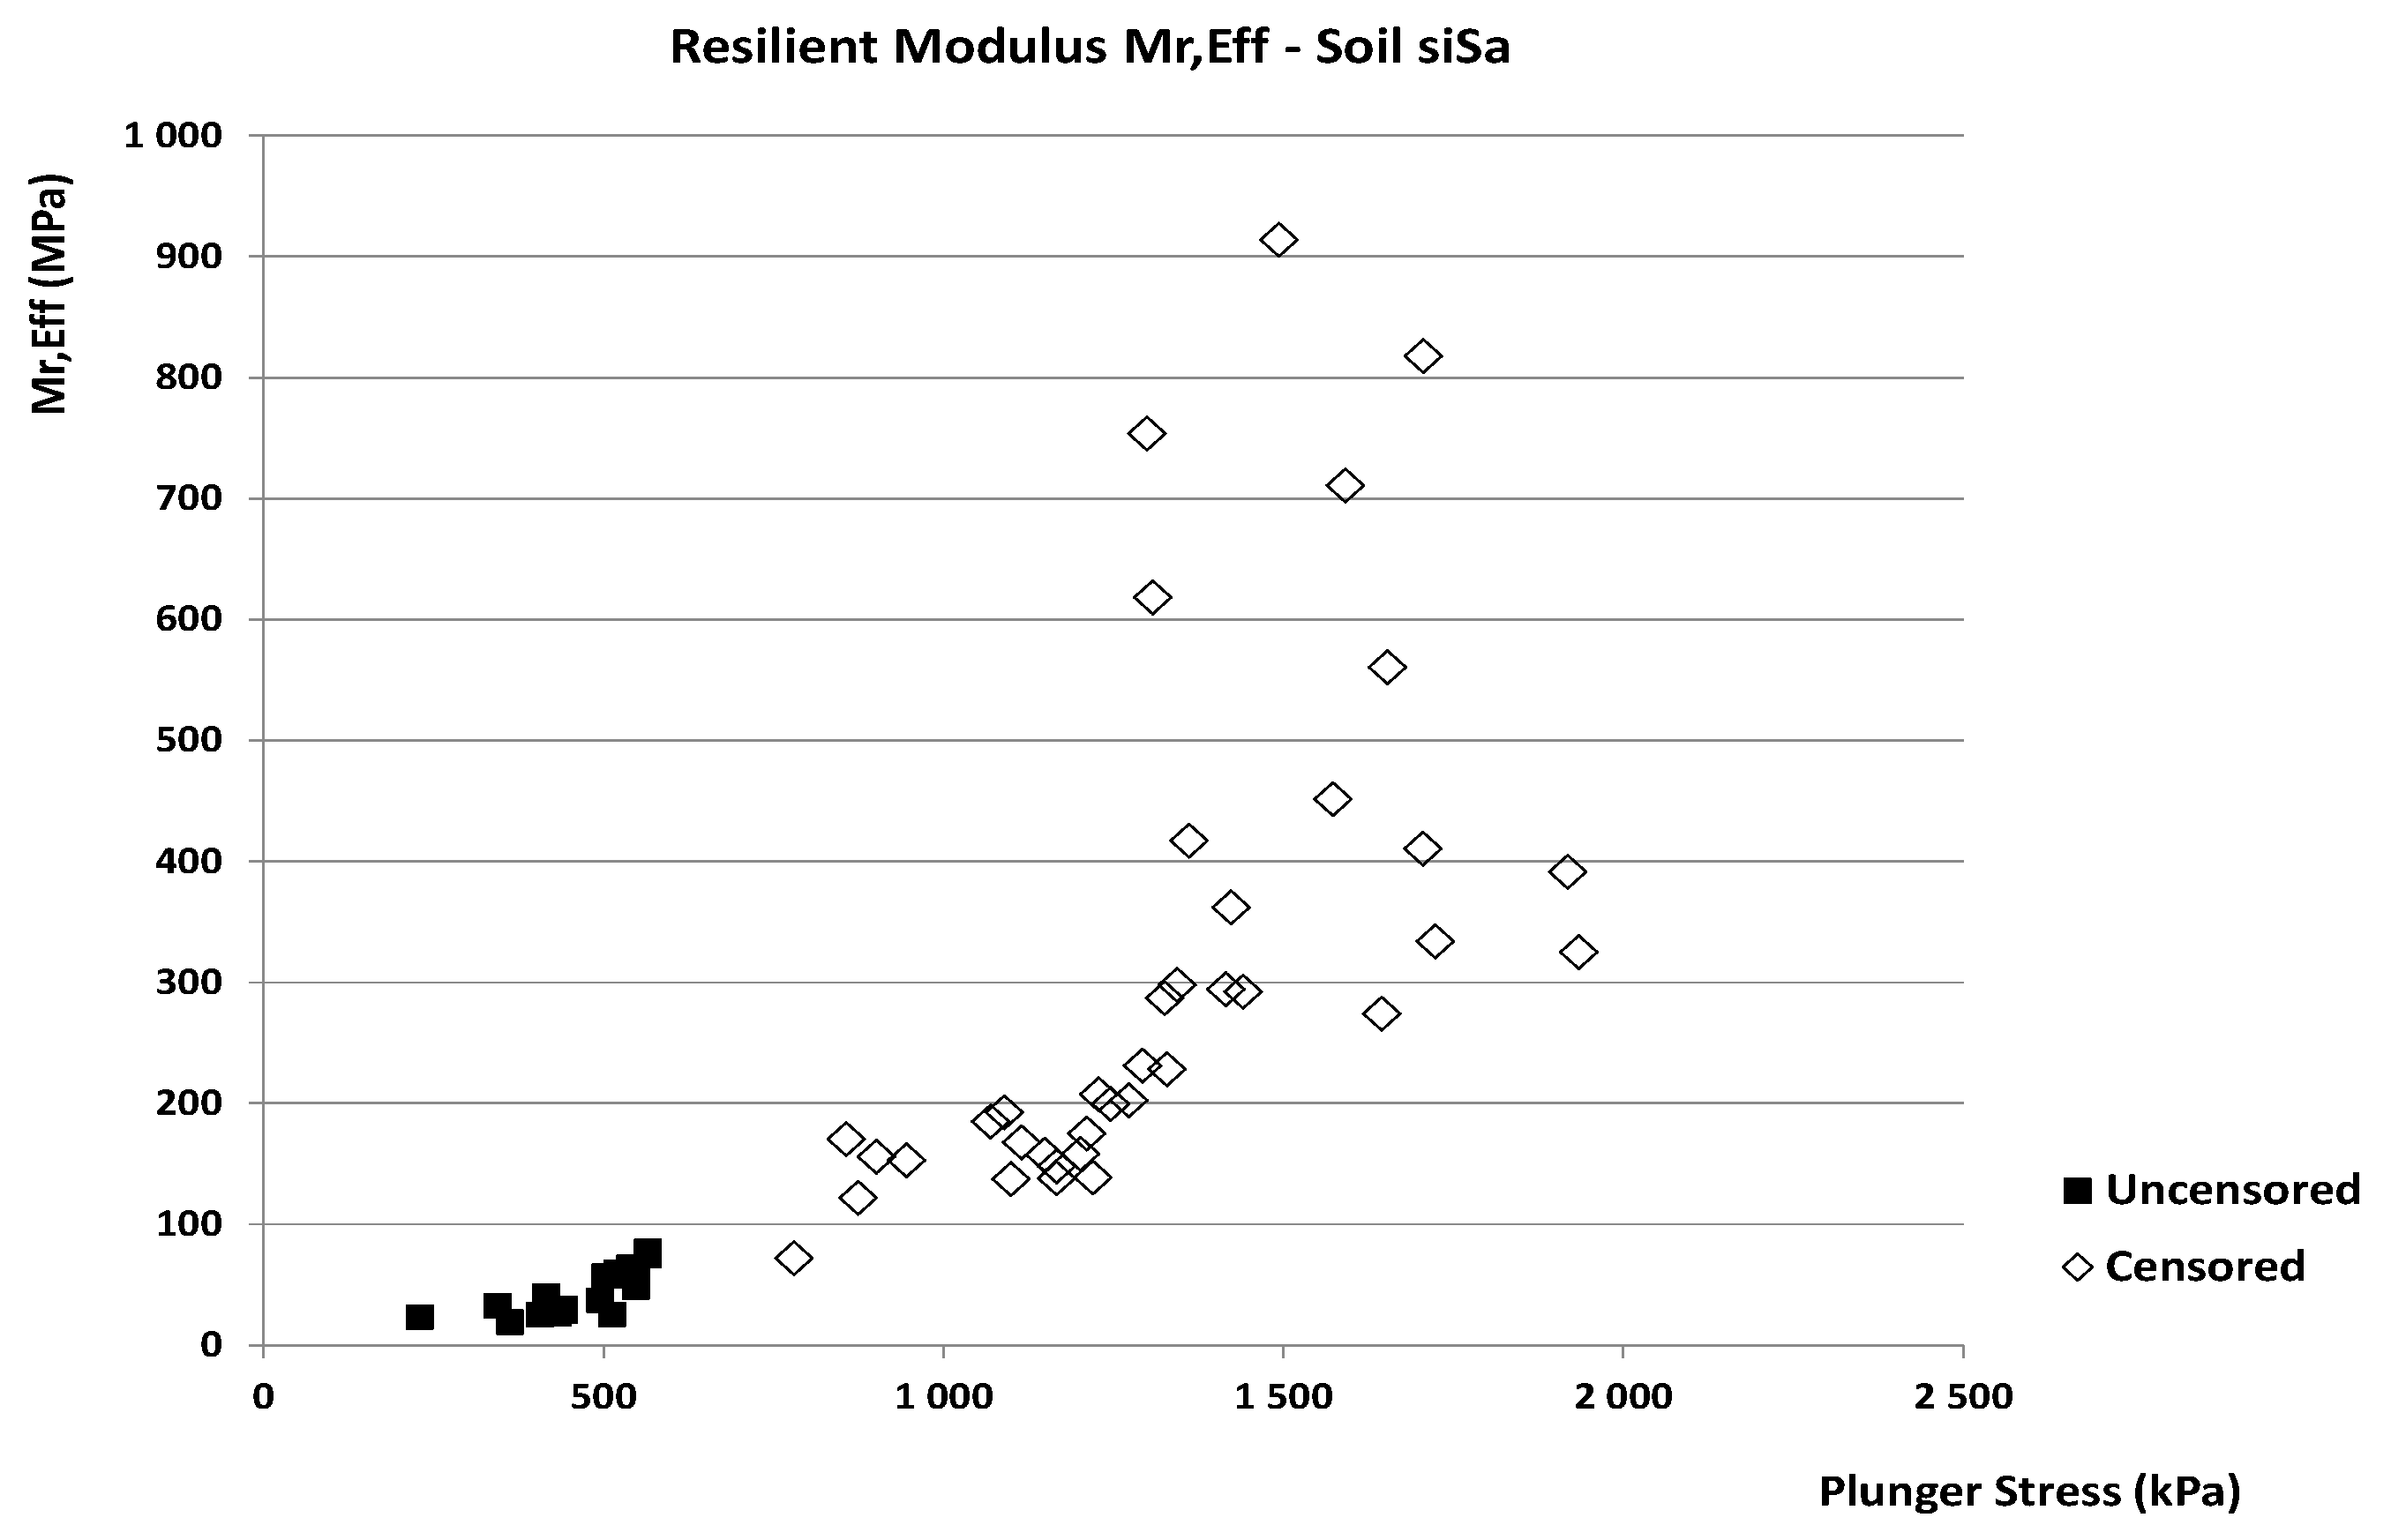
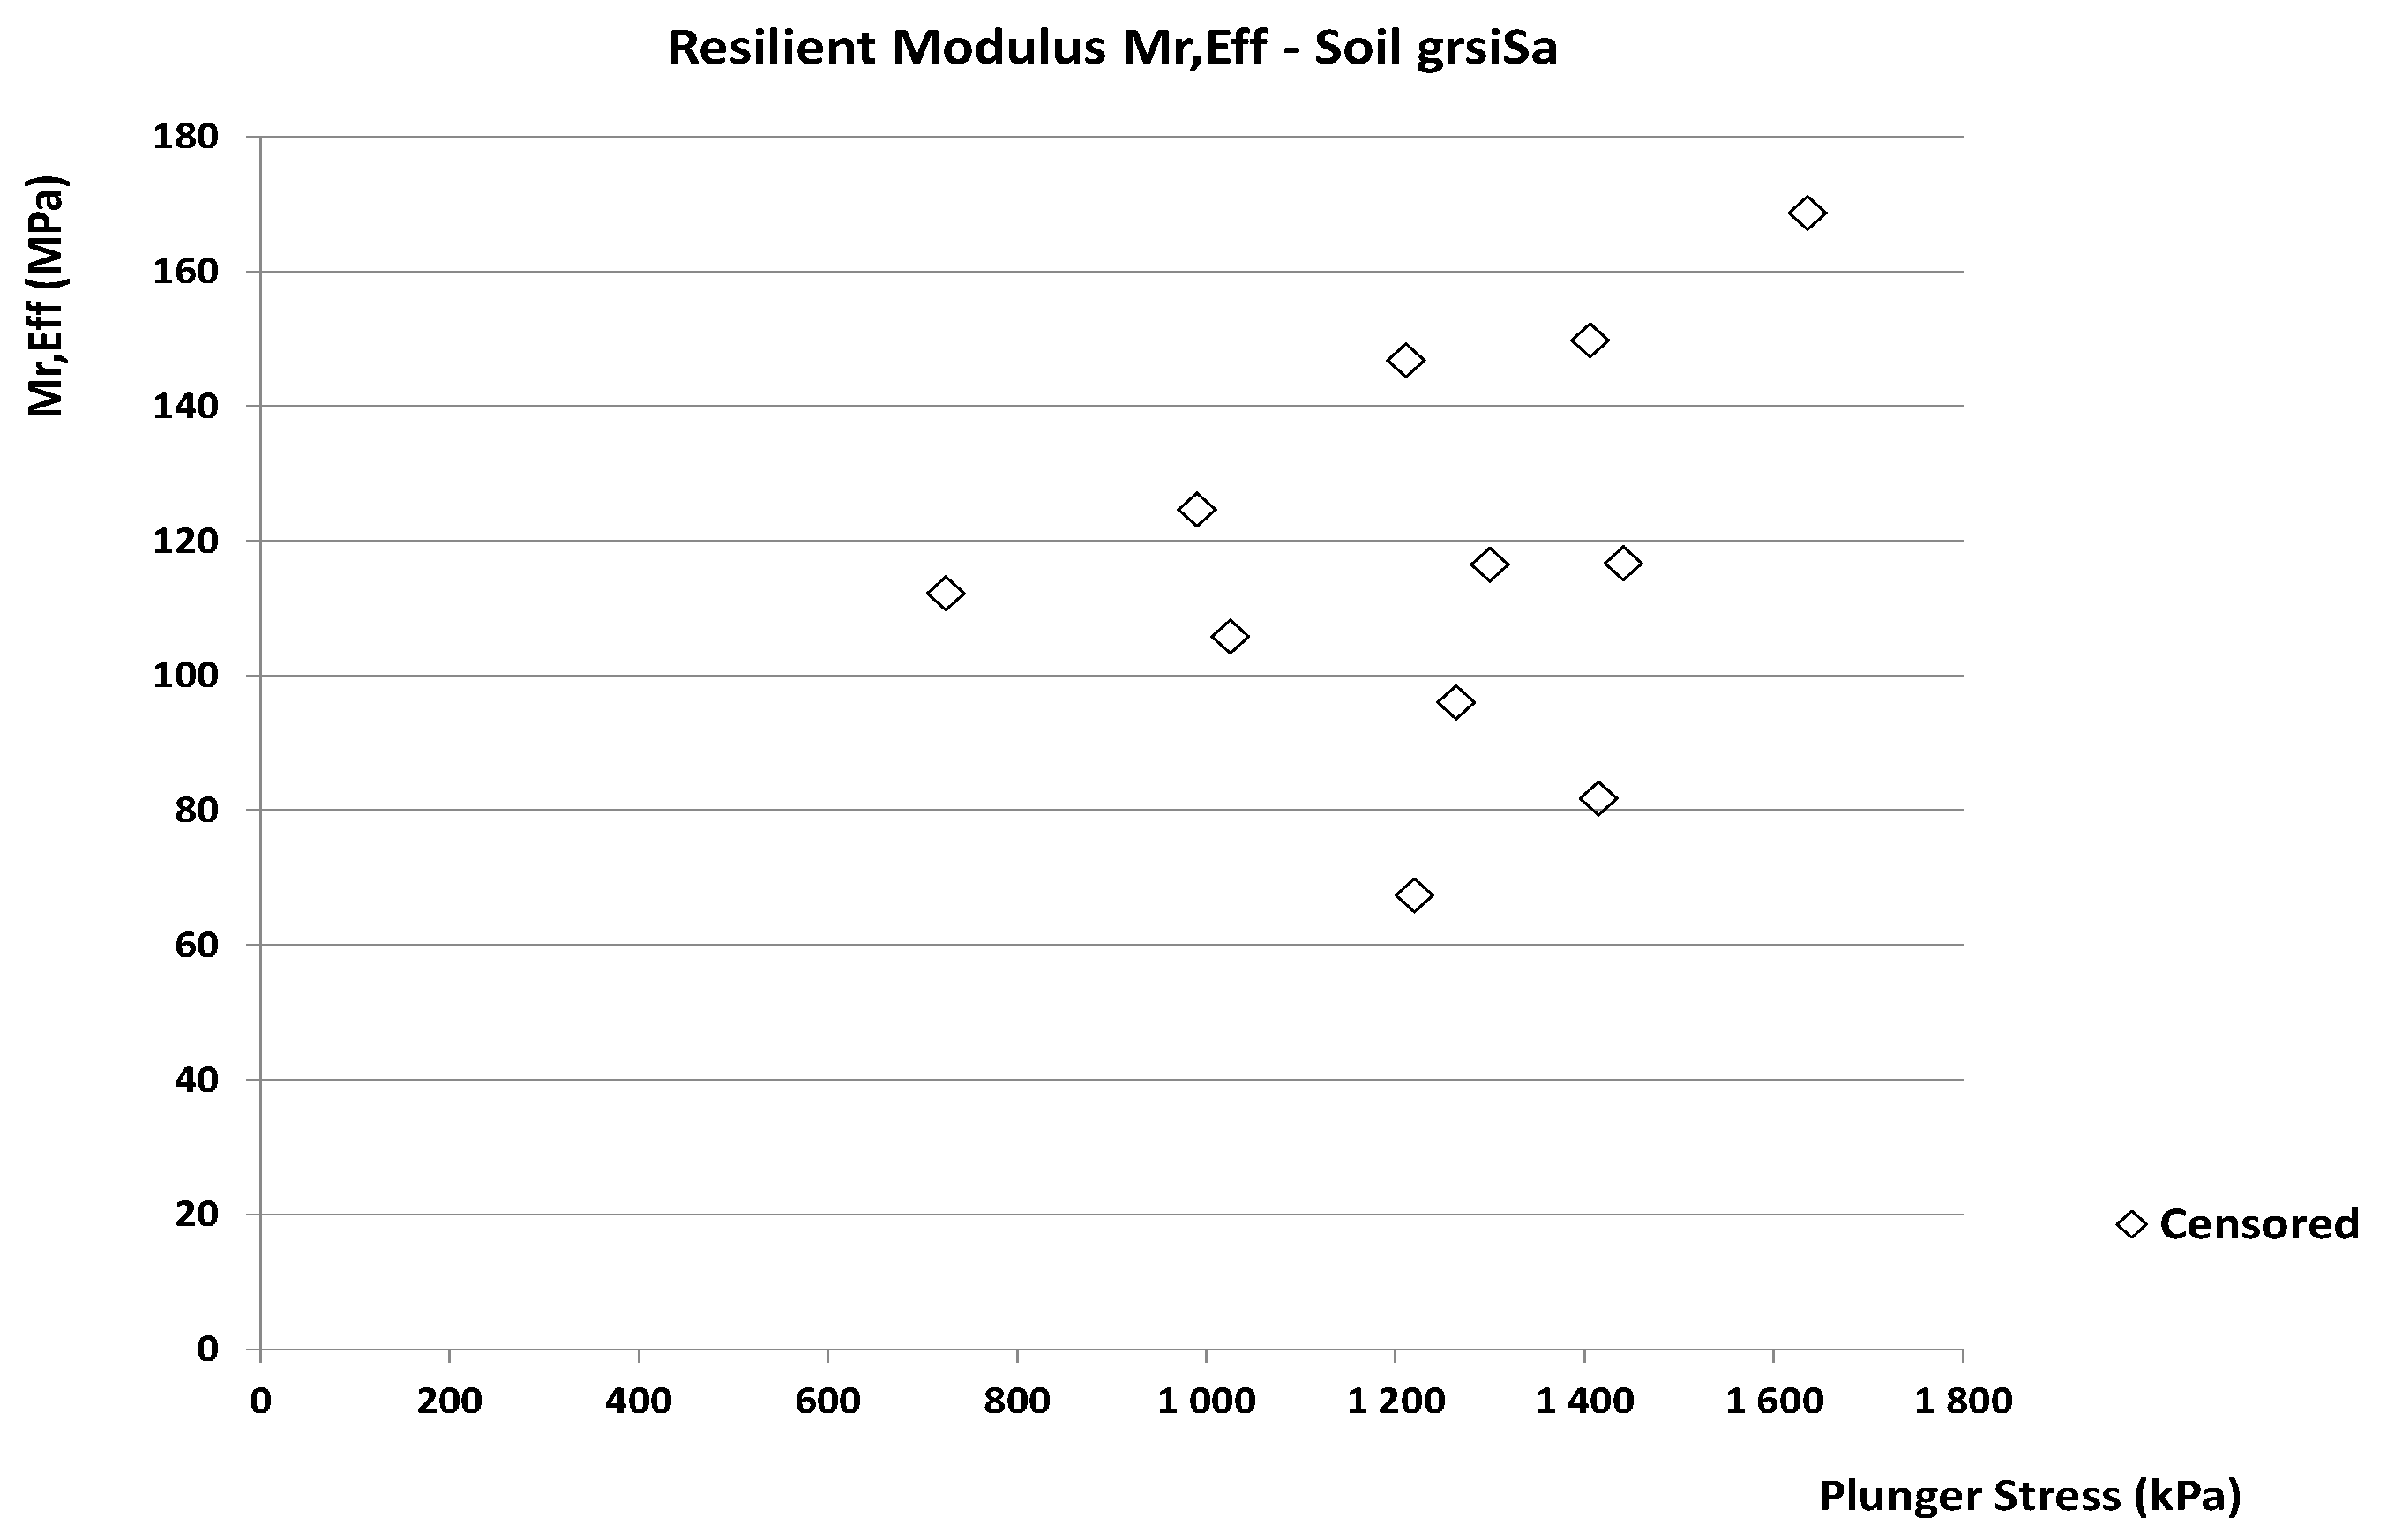
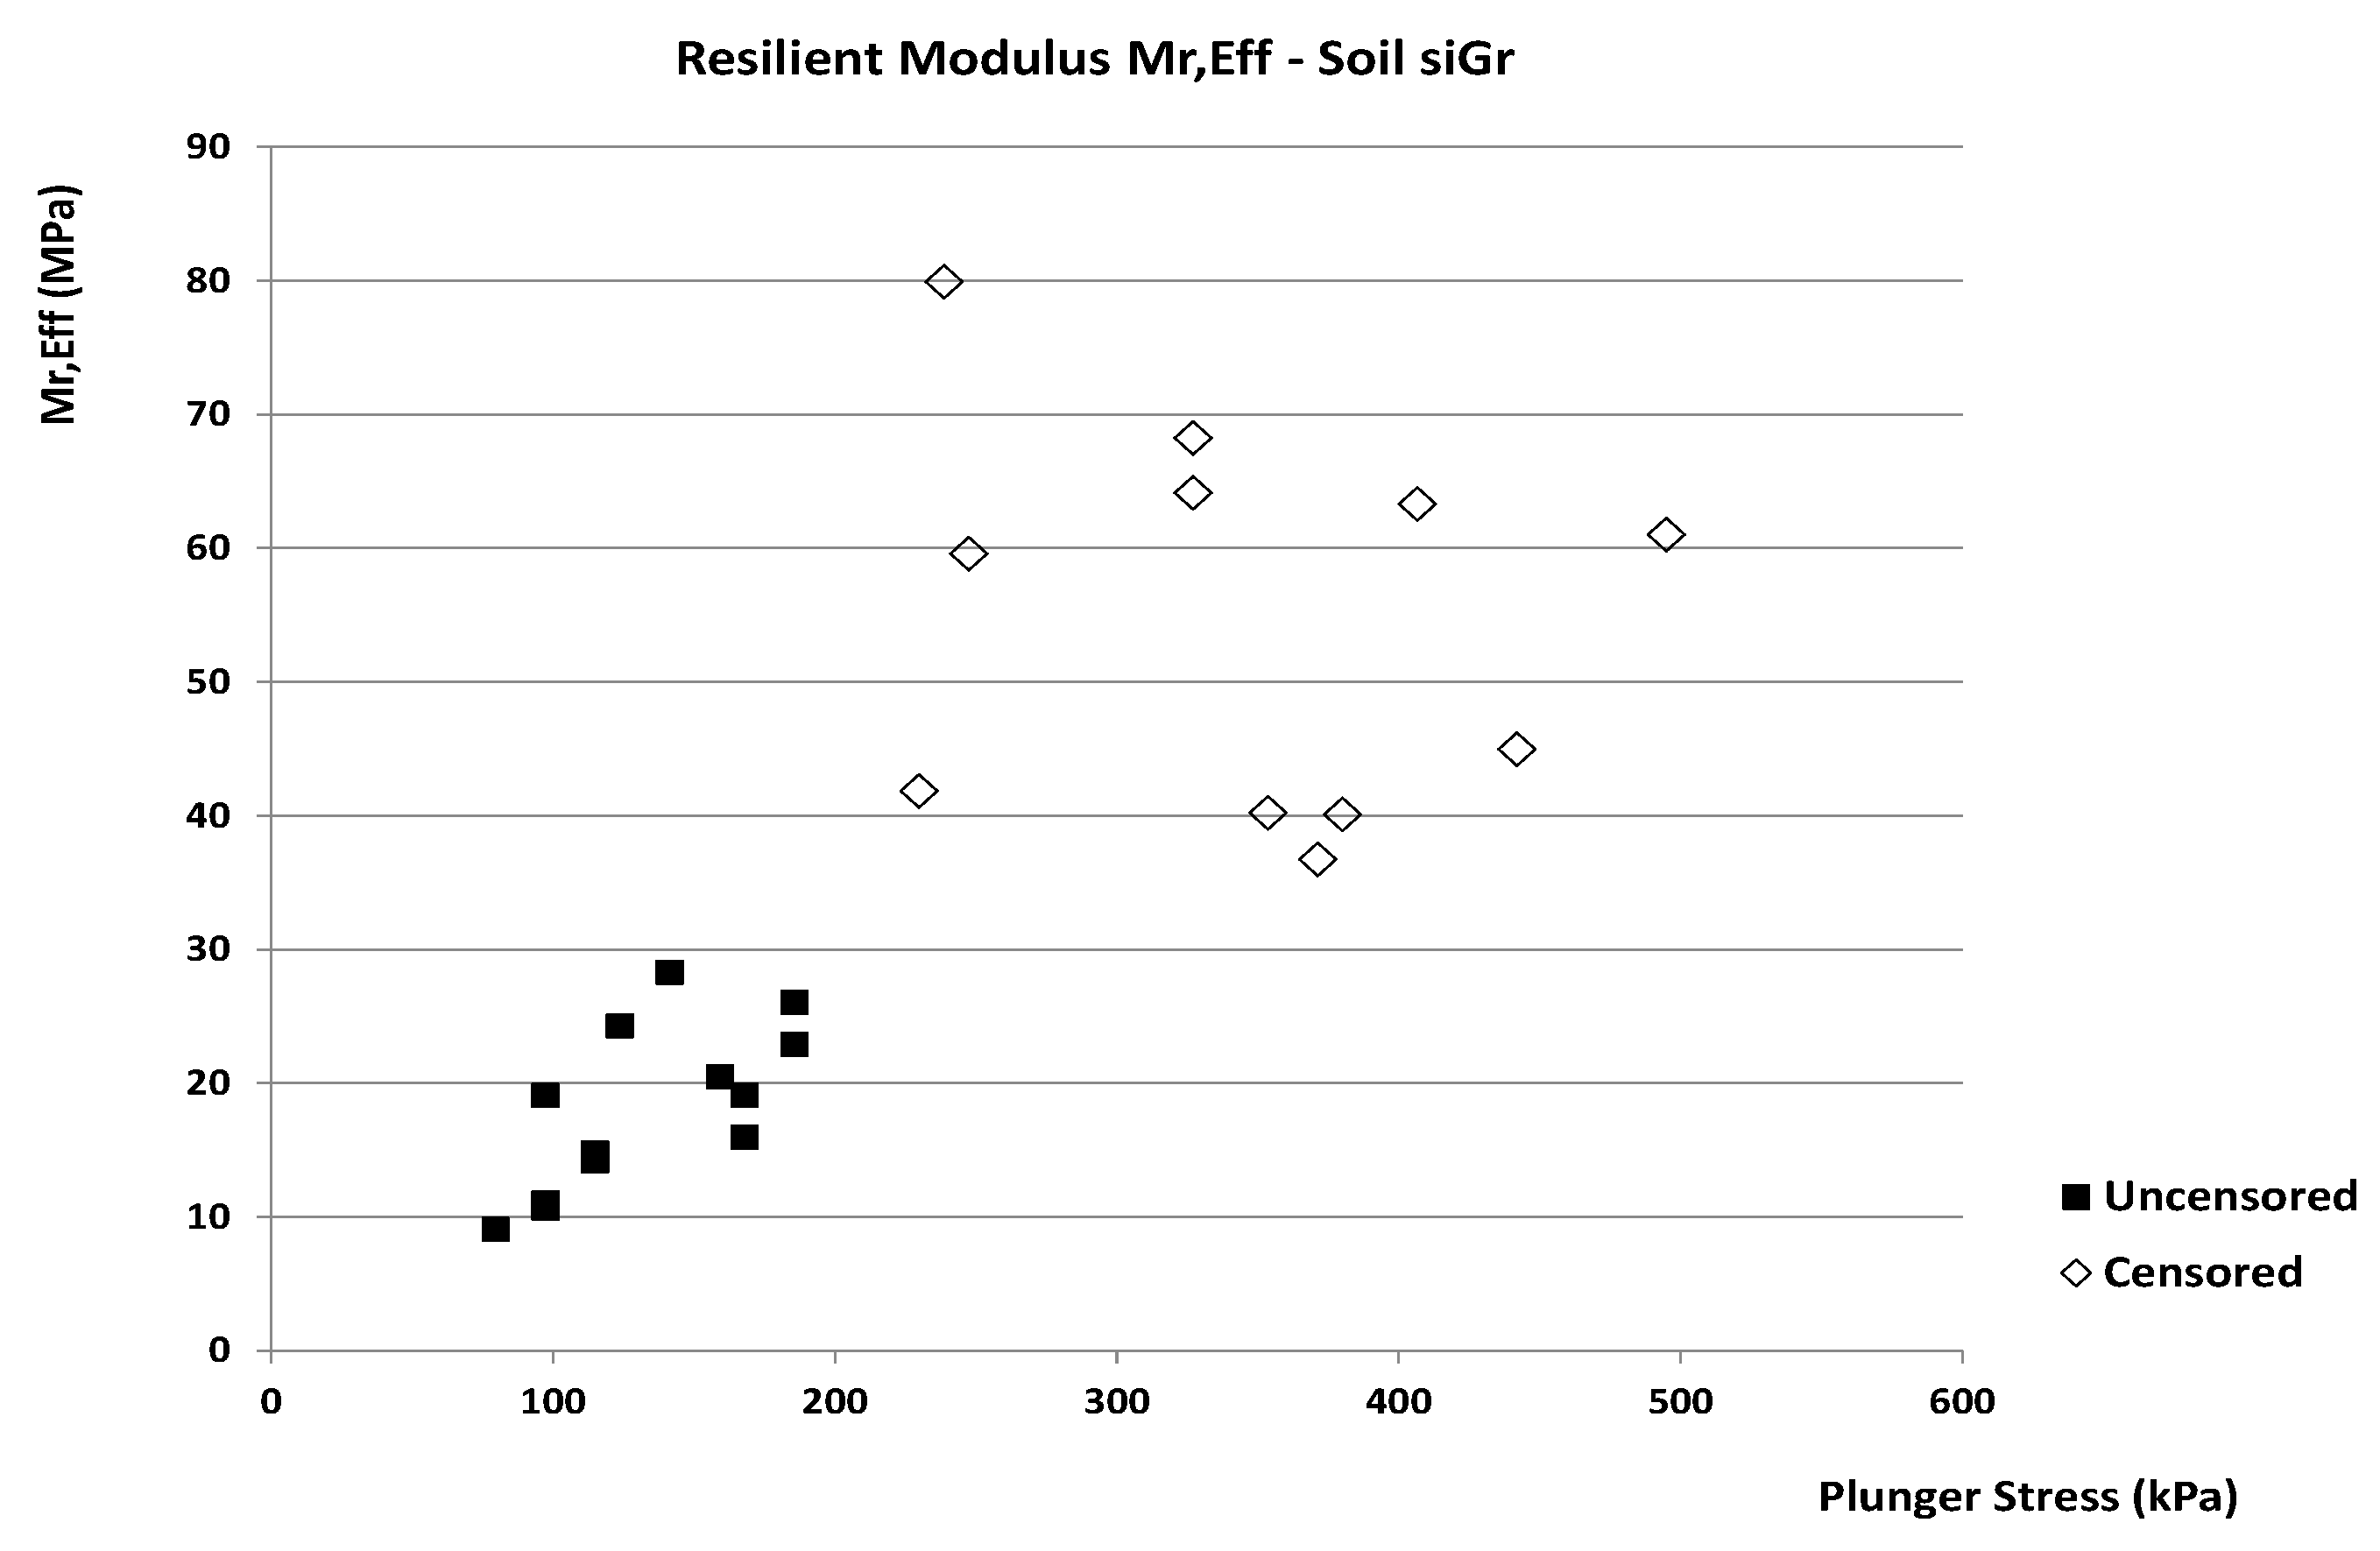
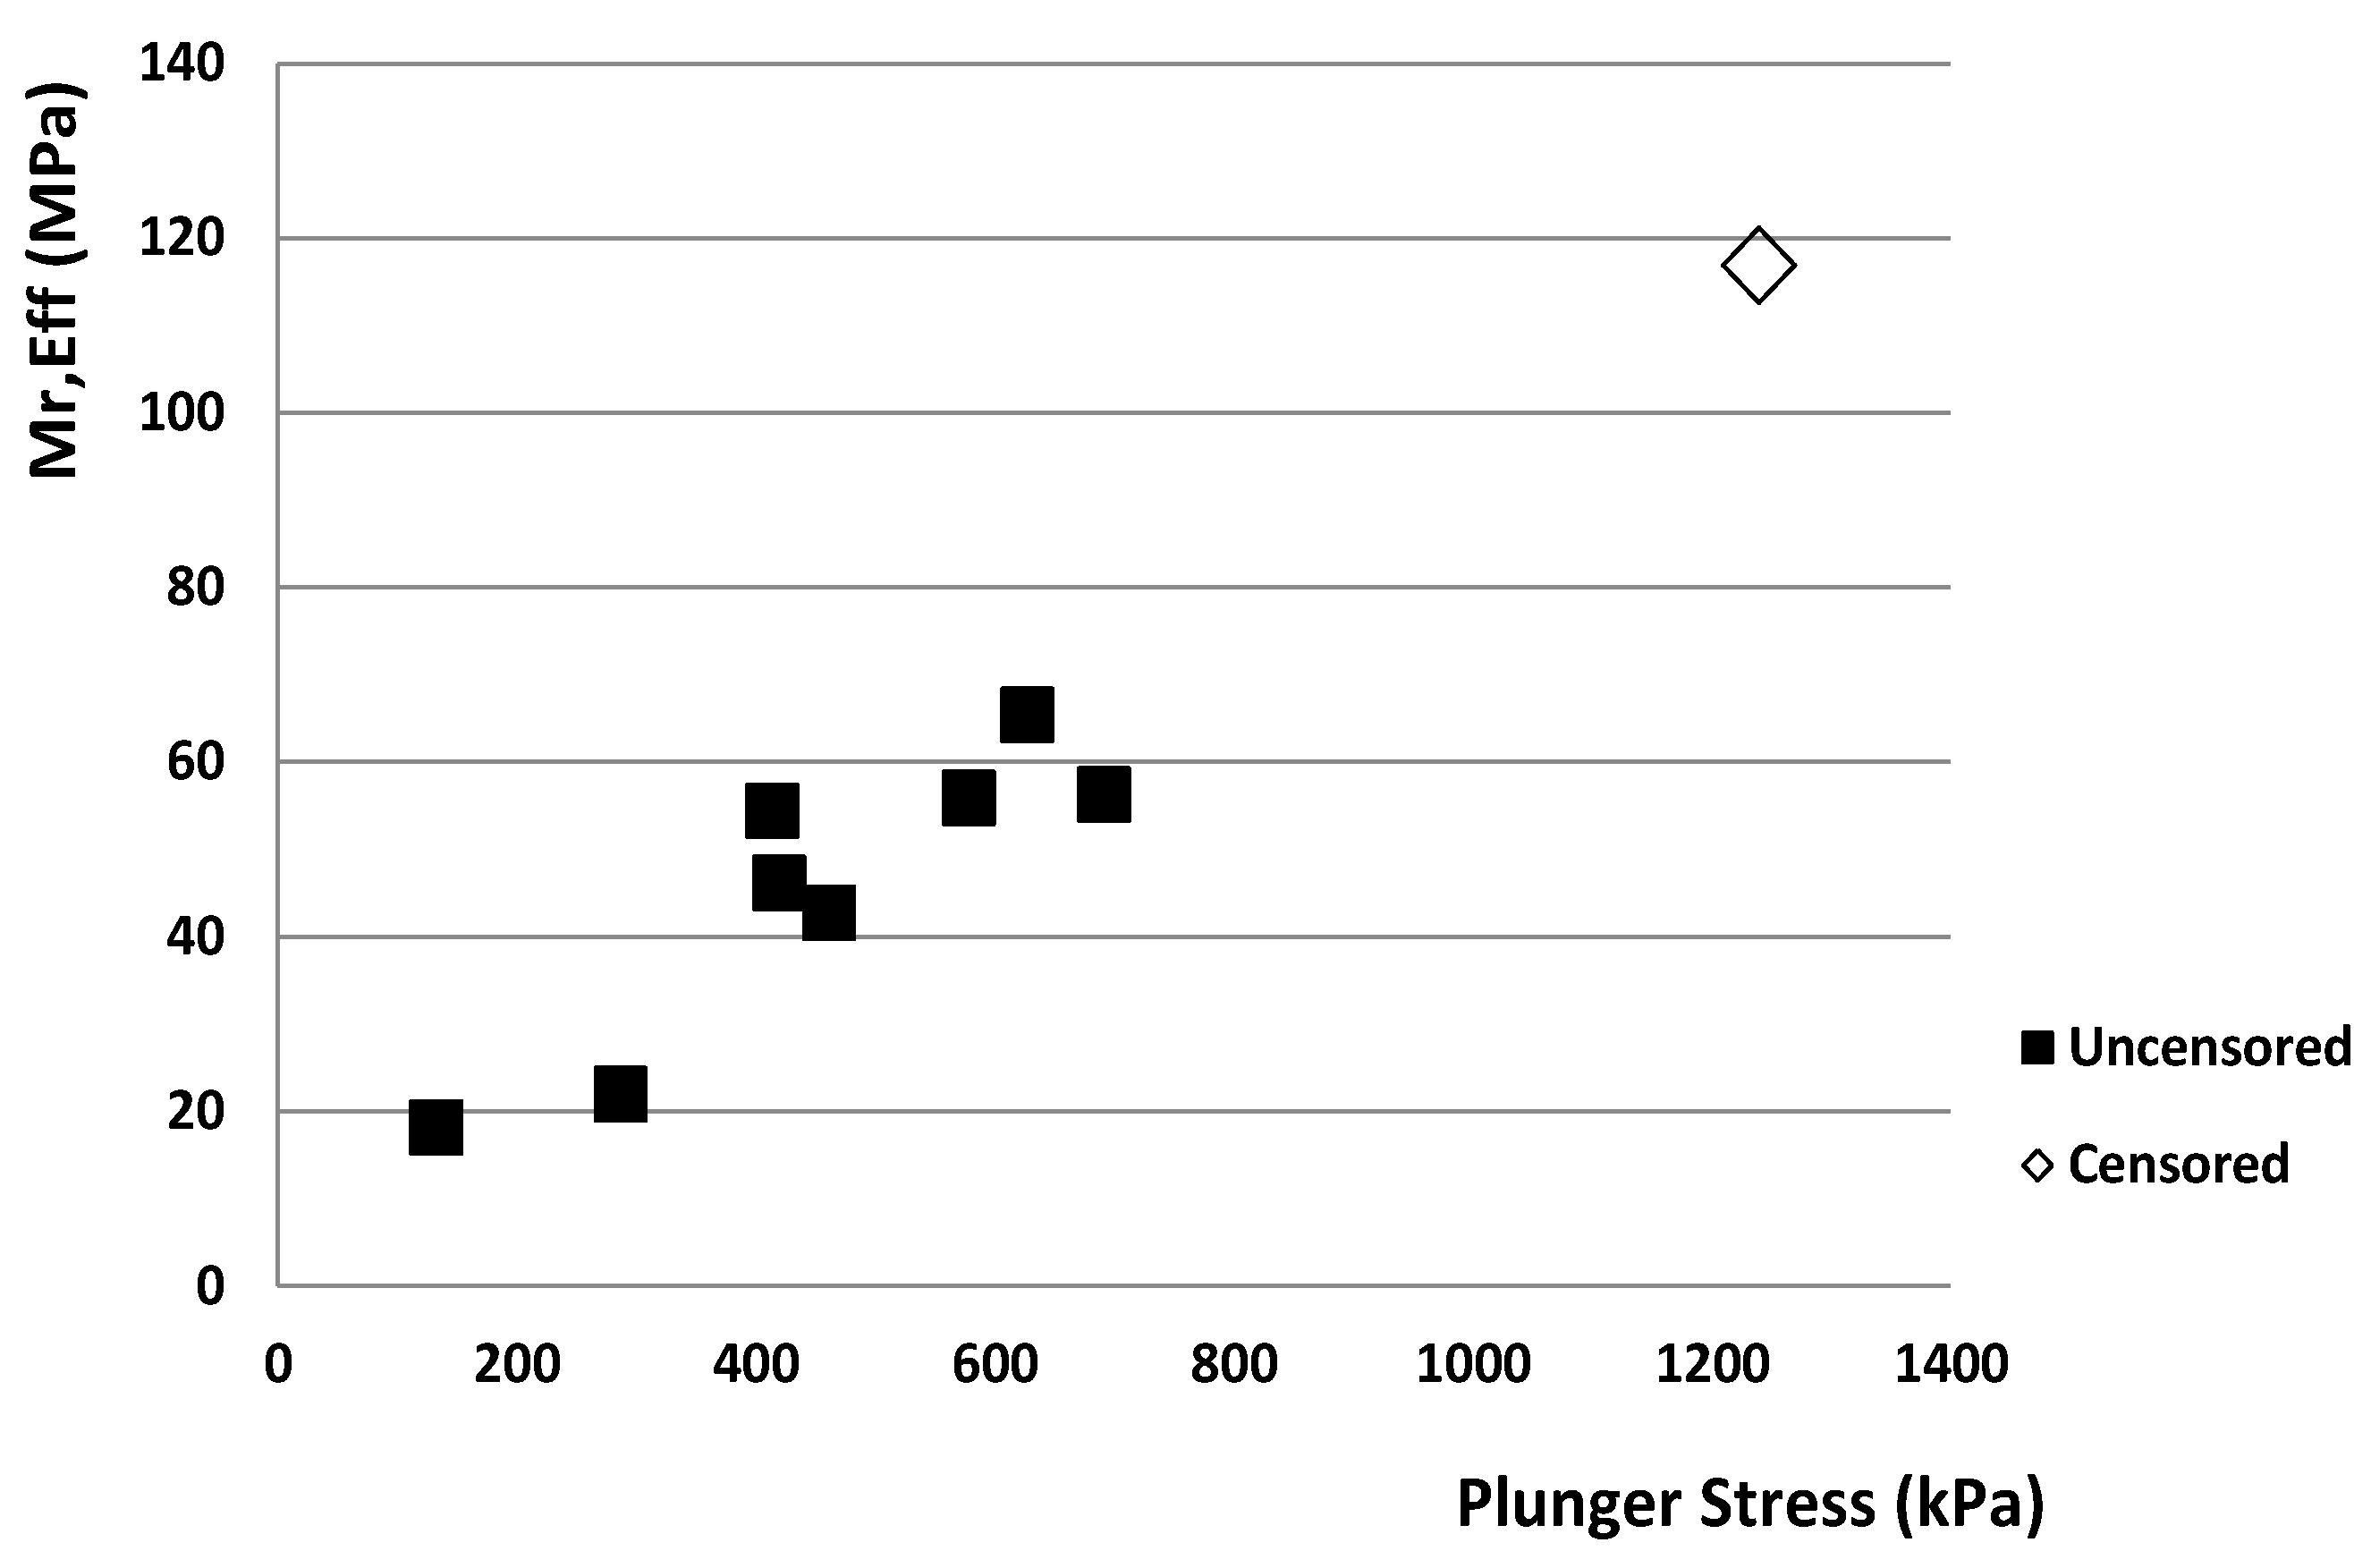
3.3. Results—Censoring of Resilient Modulus Mr,eff

The detected high values of plunger stress, which subsequently cause high values of modulus Mr,eff, raised the question of what the values of modulus Mr,eff would be if the stresses were within real limits not exceeding the load-bearing capacity of soils according to Terzagi’s theory. Therefore, the limit values of plunger stress were determined for individual soil classes, of which it was possible to assume with a high probability that the modulus Mr,eff was not determined on the damaged material. The values of the modulus Mr,eff found at stresses up to this limit are hereinafter referred as uncensored; on the contrary, values above this limit are referred as censored. Censored data were ignored, and uncensored data were subjected to the same statistical analysis as the original data—see Section 3.1. Thus, mean value Mean, the coefficient of variation Var, the minimum and maximum value Min and Max, respectively, were calculated. The results for individual soil classes are shown in Figure 3, Figure 4, Figure 5, Figure 6, Figure 7, Figure 8, Figure 9, Figure 10 and Figure 11. The results for all analyzed soil classes are summarized in Figure 12 and Table 4.
Soil Cl
The Cl class contained in total 10 samples and 60 specimens. From these, 18 specimens were cycled at a mean stress of 420 kPa with a maximum limit of 480 kPa, which is also the limit within which the material could be considered intact (see Figure 3). Uncensored data showed in comparison with the original data (see Table 2) lower values of modulus, less random variability, and also a smaller interval in which the modulus could occur. The mean value of modulus Mr,eff was equal to 46.1 MPa compared to 123.3 MPa of the original dataset, the coefficient of variation was equal to 0.18 compared to 0.83, and the minimum and maximum values were equal to 36.9 MPa and 66.4 MPa, respectively, compared to 429.9 MPa.
Soil siCl
The siCl class contained in total 3 samples and 18 specimens. From these, six specimens were cycled at a mean stress of 287 kPa with a maximum limit of 330 kPa, which is also the limit within which the material can be considered intact (see Figure 4). Uncensored data showed in comparison with the original data (see Table 2) lower values of modulus, less random variability, and also a smaller interval in which the modulus could occur. The mean value of modulus Mr,eff was equal to 21.9 MPa compared to 140.8 MPa of the original data set, the coefficient of variation was equal to 0.21 compared to 1.08, and the minimum and maximum values were equal to 14.9 MPa and 28.0 MPa, respectively, compared to 375.9 MPa.
Soil saclSi
The saclSi class contained in total 2 samples and 12 specimens. From these, six specimens were cycled at a mean stress of 692 kPa with a maximum limit of 760 kPa, which is also the limit within which the material can be considered intact (see Figure 5). Uncensored data showed in comparison with the original data (see Table 2) lower values of modulus, less random variability, and also a smaller interval in which the modulus could occur. The mean value of modulus Mr,eff was equal to 56.2 MPa compared to 122.7 MPa of the original dataset, the coefficient of variation was equal to 0.13 compared to 0.59, and the minimum and maximum values were equal to 46.9 MPa and 64.5 MPa, respectively, compared to 261.3 MPa.
Soil csaCl
The csaCl class contained in total 5 samples and 30 specimens. From these, six specimens were cycled at a mean stress of 579 kPa with a maximum limit of 630 kPa, which is also the limit within which the material can be considered intact (see Figure 6). Uncensored data showed in comparison with the original data (see Table 2) lower values of modulus, less random variability, and also a smaller interval in which the modulus could occur. The mean value of modulus Mr,eff was equal to 55.8 MPa compared to 106.9 MPa of the original dataset, the coefficient of variation was equal to 0.15 compared to 0.46, and the minimum and maximum values were equal to 44.2 MPa and 70.8 MPa, respectively, compared to 250.8 MPa.
Soil sagrSi
The sagrSi class contained in total 6 samples and 36 specimens. From these, 24 specimens were cycled at a mean stress of 414 kPa with a maximum limit of 600 kPa, which is also the limit within which the material can be considered intact (see Figure 7). Uncensored data showed in comparison with the original data (see Table 2) lower values of modulus, less random variability, and also a smaller interval in which the modulus could occur. The mean value of modulus Mr,eff was equal to 54.4 MPa compared to 101.8 MPa of the original dataset, the coefficient of variation was equal to 0.41 compared to 0.78, and the minimum and maximum values were equal to 20.7 MPa and 83.5 MPa, respectively, compared to 330.7 MPa.
Soil grsaCl
The grsaCl class contained in total 4 samples and 24 specimens. From these, 19 specimens were cycled at a mean stress of 628 kPa with a maximum limit of 700 kPa, which is also the limit within which the material can be considered intact (see Figure 8). Uncensored data showed in comparison with the original data (see Table 2) lower values of modulus, less random variability, and also a smaller interval in which the modulus could occur. The mean value of modulus Mr,eff was equal to 65.4 MPa compared to 107.9 MPa of the original dataset, the coefficient of variation was equal to 0.26 compared to 0.82, and the minimum and maximum values were equal to 41.8 MPa and 90.8 MPa, respectively, compared to 374.9 MPa.
Soil siSa
The siSa class contained in total 10 samples and 60 specimens. From these, 20 specimens were cycled at a mean stress of 462 kPa with a maximum limit of 570 kPa, which is also the limit within which the material can be considered intact (see Figure 9). Uncensored data showed in comparison with the original data (see Table 2) lower values of modulus, less random variability, and also a smaller interval in which the modulus could occur. The mean value of modulus Mr,eff was equal to 42.7 MPa compared to 216.5 MPa of the original dataset, the coefficient of variation was equal to 0.42 compared to 0.98, and the minimum and maximum values were equal to 19.0 MPa and 77.5 MPa, respectively, compared to 913.6 MPa.
Soil grsiSa
The siSa class contained in total 2 samples and 12 specimens, which were cycled at stresses in the range of 700 to 1635 kPa with the mean stress of 1240 kPa (see Figure 10). At this stress level, it was not possible to obtain a sufficiently representative dataset for further analysis, and therefore all data were marked as censored. The mean value of modulus Mr,eff of the original dataset was equal to 116.9 MPa, the coefficient of variation was equal to 0.24, and the minimum and maximum values were equal to 67.4 MPa and 168.7 MPa, respectively.
Soil siGr
The siGr class contained in total 4 samples and 24 specimens. From these, 13 specimens were cycled at a mean stress of 133 kPa with a maximum limit of 190 kPa, which is also the limit within which the material can be considered intact (see Figure 11). Uncensored data showed in comparison with the original data (see Table 2) lower values of modulus, less random variability, and also a smaller interval in which the modulus could occur. The mean value of modulus Mr,eff was equal to 18.1 MPa compared to 32.2 MPa of the original dataset, the coefficient of variation was equal to 0.34 compared to 0.60, and the minimum and maximum values were equal to 9.0 MPa and 28.3 MPa, respectively, compared to 79.9 MPa. It is worth noting for this soil class that all 13 specimens were cycled at a plunger stress less than 190 kPa, which did not occur for any other class.

4. Discussion

From the analysis results of the plunger stress in the cyclic CBR test with a constant penetration depth of 2.54 mm, a similar trend can be observed for behavior of all specimens of all soil classes. If the plunger stress increases, both the value of the modulus Mr,eff as well as its random variability increase (see Figure 3, Figure 4, Figure 5, Figure 6, Figure 7, Figure 8, Figure 9, Figure 10 and Figure 11). The coefficient of variation ranged (with exception of the grsiSa class) in the range of 0.46–1.08, the mean value (with exception of the siGr class) in the range of 101.8–216.5 MPa, and the maximum value (with exception of the siGr class) in the range of 168.7–913.6 MPa (see Table 2). The dominant influence of the plunger stress on the appropriate value of the modulus Mr,eff is proved by the values of the correlation coefficient ranging from 0.66 to 0.94 for individual soil classes (see Table 3). This means that with a high probability, the high value of plunger stress will lead to the high value of the modulus Mr,eff. However, these modulus values cannot really exist, as they were obtained on a specific laboratory device under conditions that do not exist in reality—they were achieved at stress levels exceeding the load-bearing capacity of the soil. If we include thus the obtained values of the modulus Mr,eff among the valid results, the mean value as well as the random variability of the modulus Mr,eff determined on a cyclic CBR test with a constant penetration depth will of course increase. Thus, it can be expected with certainty that the values of the modulus Mr,eff will be higher than the modulus values obtained from the cyclic triaxial test and also higher than the real values of the resilient modulus Mr.
After results censoring by the reduction of the plunger stress magnitude below the load-bearing capacity of the soil, the values of the modulus Mr,eff reached more realistic limits (see Figure 12). The coefficient of variation ranged from 0.13 to 0.42, the mean value was in the range of 18.1–65.4 MPa, and the maximum value was in the range of 28.0–90.8 MPa (see Table 4). There is still an evident positive correlation of the modulus Mr,eff with the plunger stress (see Figure 13).
The obtained results can be supported by other studies performed on cyclic CBR devices without reducing the plunger stress and without the results censoring. The results of two unbound materials are known, namely coarse-grained material of the grSa class and clay of the Cl class [13]. The modulus obtained for the grSa class ranged from 210 MPa to 900 MPa, on MENDELU from 100 to 900 MPa. Clay was tested on only one sample with a modulus value of 40 MPa, and on MENDELU the interval of occurrence of modulus for the Cl class ranged from 14 to 429 MPa. Another study of unbound base materials (both natural and recycled) provides estimates of the resilient modulus with values ranging from 156 MPa to 2600 MPa [14]. In this research, the plunger stress reached values of up to 9000 kPa, while the adequacy of this stress was not commented on. By comparing the results, it can be said that the results for similar materials are comparable with the modulus Mr,eff obtained at MENDELU without the results censoring. Additionally, a similar feature of variability of the modulus Mr,eff values obtained from the corresponding tests on a cyclic CBR device can be observed. It is also evident that none of the above-mentioned research paid attention to possible overloading of the tested specimens above their load-bearing capacity.
If we compare the results obtained from the cyclic CBR test with the results obtained from the cyclic triaxial test, then from studies performed between 2008 and 2016 it is obvious that the modulus Mr values from the triaxial tests are lower than those obtained from CBR tests without reduction of the plunger stress [13,14,15,28,29,30]. At the same time, the modulus Mr,eff obtained on the CBR equipment at MENDELU occurred at realistic intervals after the reduction of applied plunger stresses and after the censoring of the results cycled above the load-bearing capacity of soils.
The latest studies also present the modulus values taking into account the influence of the applied axial stress [31]. The obtained results for the sasiCl class show that there is an evident relationship between increases of the modulus values and increases of the applied stress. At stress values up to 550 kPa, the modulus values from the CBR test ranged up to 500 MPa. After specimen overloading above 1000 kPa, the modulus reached unrealistic values above 800 MPa. The studies also confirm that cyclic triaxial tests cannot be directly compared with cyclic CBR tests, and that the modulus obtained from triaxial tests is lower than the modulus from CBR tests.
The main problem of the standard cyclic CBR tests used for testing forest roads soils as well as for testing any unbound material seems to be the loading of the specimen to a fixed defined penetration depth without knowledge of the immediate plunger stress and the possibility to change it. Only a partial solution of this shortcoming is to censor the results obtained from the cyclic CBR test, i.e., to exclude unrealistic values of the modulus Mr,eff determined at plunger stress values exceeding the limit values. However, even in this case, results are still determined under pseudo-randomly varying stress values. This stress variability due to the existing correlation between stress and modulus artificially distorts values of the modulus Mr,eff obtained from the test, because in addition to the inherent random variability of physical–mechanical properties of the soil, the effect of pseudo-randomly varying plunger stress applies too. The solution of this shortcoming would be to ensure the constant plunger stress level according to the expected traffic load during the whole cyclic loading. A modified variant of the cyclic CBR procedure is currently being intensively tested on a huge dataset at the MENDELU.

5. Conclusions

Forest road pavement design requires a proper estimate of the resilient modulus Mr, because it plays a crucial role in optimizing the road construction layers design The quality, durability, service life, and damage ratio of forest roads are fundamentally influenced by the subgrade soil quality described by its load-bearing capacity. The materials of the subgrade as well as pavement structure layers are exposed to repeated loads of various sizes, which are transmitted to them by movement of vehicles. In order to take into account the cyclic nature of the loads as well as the non-linear behavior of the materials, many experimental studies have been performed, both on real-scale models and on specimens tested under laboratory conditions, to adequately determine the resilient modulus Mr. The specific material in the pavement structure is soil. It is a natural, heterogeneous, and discontinuous environment, whose variability of deformation behavior, strength, and physical–mechanical properties depends on many factors, including genesis, soil type, load-bearing capacity, density, humidity, degree and method of compaction, number and size of loads, the amount of liquid phase [32,33,34], etc. The procedure for obtaining the soil resilient modulus Mr—and even its estimate—must reflect the above-mentioned factors [28]. The modulus must be obtained from an adequate laboratory test, which realistically simulates the future loading by repeated vehicular movement under a state of stress corresponding to the reality of the future pavement structure. At the same time, of course, the test must not damage the specimen and exceed the maximum load-bearing capacity of the soil [35]. Although these requirements are met by the resilient modulus Mr obtained from the cyclic triaxial test, alternative methods [30] are still being sought due to its huge time and economic demands.
In this context, it is worth noting that the modulus Mr is not a constant property of materials, but depends on many factors. Depending on the type of material, it is mostly affected by the density, the water content, the magnitude of transverse stresses, the magnitude of the applied load, etc. Taking into account their variability, the determination of one value of the modulus Mr for one type of soil cannot be assumed, because there is an infinite number of values depending on the test conditions. It also should be kept in mind that the modulus Mr obtained by any above-mentioned method is in fact not a characteristic of the material as such, but a characteristic of a specimen prepared from it [34].
Verification of the procedure based on cyclic loading of the specimen on the standard CBR machine to a constant penetration depth of 2.54 mm showed that using this procedure for forest subgrade soils results in high values of plunger stress, which for many forest soil types exceed the expected maximum load-bearing capacity. Even in the case of lower plunger stresses, the specimens were tested at significantly different stress levels, which generally have nothing to do with the real state of stress in the forest road pavement structure. The inconsistent behavior of the proposed procedure caused by the uncontrollable value of plunger stress results from the test methodology. In this methodology the plunger penetrates to a predefined depth, taking no account of an unpredictable increase of plunger stress during cyclic loading. The high probability exists that overloading and even failure of the specimen will occur during a fixed constant penetration. Another disadvantage is the inability to influence the stress conditions under cyclic loading.

Author Contributions

L.Š. initiated the investigation and drafted the manuscript and methodology. A.F. carried out the statistical analysis and reviewed the methodology. J.Ž. reviewed the statistical analysis, carried out the methodology of the manuscript, and revised the manuscript. All authors have read and agreed to the published version of the manuscript.

Funding

This research received no external funding.

Data Availability Statement

The data presented in this study are available on request from the corresponding author. The data are not publicly available due to privacy restrictions.

Conflicts of Interest

The authors declare no conflict of interest.

References

  1. ČSN 736114. Road Pavements. Basic Requirements for Design; Ministry of Transportation: Prague, Czech Republic, 1995.
  2. TP 170. Design of Pavement Structures; Ministry of Transportation: Prague, Czech Republic, 2011.
  3. TP 43385. Catalog of Field Roads; Ministry of Agriculture: Prague, Czech Republic, 2011.
  4. 23327/2015-MZE-16222/M108. The Methodical Guide to the Design and Implementation of Pavement of Low Volume Roads; Certified Methodology; Mendel University in Brno: Brno, Czech Republic, 2015. [Google Scholar]
  5. AASHTO. Guidelines for Geometric Design of Very Low-Volume Local Roads; American Association of State Highway and Transportation Officials: Washington, DC, USA, 2001. [Google Scholar]
  6. ČSN EN ISO 13286-47. Unbound and Hydraulically Bound Mixtures–Part 47: Test Method for the Determination of California Bearing Ratio, Immediate Bearing Index and Linear Swelling; Institute for Technology Standardization, Metrology and State Testing: Prague, Czech Republic, 2015. [Google Scholar]
  7. AASHTO. Guide for Design of Pavement Structures; American Association of State Highway and Transportation Officials: Washington, DC, USA, 1993. [Google Scholar]
  8. AASHTO. Mechanistic-Empirical Pavement Design Guide (MEPDG); American Association of State Highway and Transportation Officials: Washington, DC, USA, 2008. [Google Scholar]
  9. ČSN EN 13286-7. Unbound and Hydraulically Bound Mixtures—Part 7: Cyclic Load Triaxial Test for Unbound Mixtures; Institute for Technology Standardization, Metrology and State Testing: Prague, Czech Republic, 2004. [Google Scholar]
  10. Diaz, M.M.; Peréz, I. Mechanistic-empirical pavement design guide: Features and distinctive elements. Rev. Constr. 2015, 14, 32–40. [Google Scholar] [CrossRef] [Green Version]
  11. Rahman, M.M.; Islam, K.M.; Gassman, S. Estimation of Resilient Modulus for Coarse-Grained Subgrade Soils from Quick Shear Tests for Mechanistic-Empirical Pavement Designs. Designs 2019, 3, 48. [Google Scholar] [CrossRef] [Green Version]
  12. Qian, J.; Yao, Y.; Li, J.; Xiao, H.; Luo, S. Resilient Properties of Soil-Rock Mixture Materials: Preliminary Investigation of the Effect of Composition and Structure. Materials 2020, 13, 1658. [Google Scholar] [CrossRef] [PubMed] [Green Version]
  13. Molenaar, A.A.A. Repeated Load CBR Testing, a Simple but Effective Tool for the Characterization of Fine Soils and Unbound Materials; Delft University of Technology: Delft, The Netherlands, 2008. [Google Scholar]
  14. Araya, A.A. Characterization of Unbound Granularmaterials for Pavements. Ph.D. Thesis, Delft University of Technology, Delft, The Netherlands, 2011. [Google Scholar]
  15. Pěnčík, J.; Florian, A.; Karásková, S. Computer Simulation of Cyclic-Load Triaxial Testing with Respect to Uncertainties in Input Parameters; MSM 0021630511, MSM 0021630519; Technical University of Brno: Brno, Czech Republic, 2004. [Google Scholar]
  16. Ševelová, L.; Kozumplíková, A. The numerical model for parametric studies of forest haul roads pave-ments. Acta Univ. Agric. Et Silvic. Mendel. Brun. 2010, 58, 361–367. [Google Scholar] [CrossRef] [Green Version]
  17. Jayakumar, M.; Sing, L.H. Experimental Studies on Treated Sub-base Soil with Fly Ash and Cement for Sustainable Design Recommendations. World Acad. Sci. Eng. Technol. Int. J. Civ. Environ. Eng. 2012, 6, 611–614. [Google Scholar]
  18. ČSN EN ISO 14688-2. Geotechnical Investigation and Testing-Identification and Classification of Soil—Part 2: Principles for a Classification; Institute for Technology Standardization, Metrology and State Testing: Prague, Czech Republic, 2005. [Google Scholar]
  19. ČSN EN ISO 14689-1. Geotechnical Investigation and Testing-Dentification and Classification of Rock—Part 1: Identification and Description; Institute for Technology Standardization, Metrology and State Testing: Prague, Czech Republic, 2004. [Google Scholar]
  20. Ševelová, L.; Florian, A.; Hrůza, P. Using Resilient Modulus to Determine the Subgrade Suitability for Forest Road Construction. Forests 2020, 11, 1208. [Google Scholar] [CrossRef]
  21. ČSN EN ISO 17892-1. Geotechnical Investigation and Testing—Laboratory Testing of Soil—Part 1: Determination of Water Content; Institute for Technology Standardization, Metrology and State Testing: Prague, Czech Republic, 2015. [Google Scholar]
  22. ČSN EN ISO 17892-4. Geotechnical Investigation and Testing-Laboratory Testing of Soil—Part 4: Determination of Particle Size Distribution; Institute for Technology Standardization, Metrology and State Testing: Prague, Czech Republic, 2017. [Google Scholar]
  23. ČSN EN ISO 17892-12. Geotechnical Investigation and Testing—Laboratory Testing of Soil—Part 12: Determination of the Liquid and Plastic Limits; Institute for Technology Standardization, Metrology and State Testing: Prague, Czech Republic, 2018. [Google Scholar]
  24. ČSN EN ISO 13286-2. Unbound and Hydraulically Bound Mixtures—Part 2: Test Methods for the Determination of the Laboratory Reference Density and Water Content-Proctor Compaction; Institute for Technology Standardization, Metrology and State Testing: Prague, Czech Republic, 2015. [Google Scholar]
  25. De Zarate, G.O.; Ševelová, L. The statistical analysis of the resilient modulus. In Public Recreation and Landscape Protection—With Man Hand in Hand; Mendel University in Brno: Prague, Czech Republic, 2015; pp. 258–264. [Google Scholar]
  26. Florian, A.; Navrátil, J. Reliability Analysis of the Cable Stayed Bridge in Construction and Service Stages. In Proceedings of the ICOSSAR’93, Innsbruck, Austria, 9–13 August 1993; pp. 869–877. [Google Scholar]
  27. Hauser, J.; Kozumplíková, A.; Ševelová, L. The Influence of the Soil Treatment on the CBR Test Values. In Proceedings of the International Conference on Ground Improvement and Ground Control: Transport Infrastructure Development and Natural Hazards Mitigation-ICGI 2012, Singapore, 30 October–2 November 2012; pp. 1623–1628. [Google Scholar]
  28. Leunga, G.L.M.; Wong, A.W.G.; Wanga, Y.H. Prediction of resilient modulus of compacted saprolitic soils by CBR approach for road pavement subgrade: A re-examination. Int. J. Pavement Eng. 2013, 14, 403–417. [Google Scholar] [CrossRef]
  29. Guzzarlapudi, S.D.; Adigopula, V.K.; Kumar, R. Comparative studies of lightweight deflectometer and Benkelman beam deflectometer in low volume roads. J. Traffic Transp. Eng. 2016, 3, 438–447. [Google Scholar] [CrossRef] [Green Version]
  30. Emre, V.; Saltan, M.; Gokalp, I. Feasibility of Using 4th Power Law in Design of Plastic Deformation Resistant Low Volume Roads. In Proceedings of the 3rd International Conference on Transportation Geotechnics (ICTG 2016), Guimarães, Portugal, 4–7 September 2016; pp. 961–970. [Google Scholar]
  31. Sas, W.; Głuchowski, A.; Miturski, M. Studies on resilient modulus value from cyclic loading tests for cohesive soil. J. Ann. Wars. Univ. Life Sci.-SGGW. Land Reclam. 2017, 49, 117–127. [Google Scholar] [CrossRef] [Green Version]
  32. Florian, A.; Ševelová, L.; Žák, J. Influence of environmental humidity on mechanical properties of natural and recycled unbound materials. Acta Univ. Agric. Silvic. Mendel. Brun. 2015, 63, 405–409. [Google Scholar] [CrossRef] [Green Version]
  33. Hauser, J.; Ševelová, L.; Matula, R.; Zedník, P. Optimization of low volume road pavement design and construction. J. For. Sci. 2018, 64, 74–85. [Google Scholar]
  34. Anguas, P.G.; López, J.A.G.; Martínez, J.A.S. Mecánica de Materiales Para Pavimentos; Publicación Técnica No. 197; Instituto Mexicano del Transporte: Sanfandila, Mexico, 2002.
  35. Brinch Hansen, J. A General Formula for Bearing Capacity; Bulletin No. 11; Geoteknisk Institut, Institute Akademict for de Tekniske Videuskaber: Copenhagen, Denmark, 1961. [Google Scholar]
Figure 1. Resilient modulus Mr,eff for individual soil classes.
Forests 12 01456 g001
Figure 2. Plunger stress for individual soil classes.
Forests 12 01456 g002
Figure 3. Resilient modulus Mr,eff for soil Cl.
Forests 12 01456 g003
Figure 4. Resilient modulus Mr,eff for soil siCl.
Forests 12 01456 g004
Figure 5. Resilient modulus Mr,eff for soil saclSi.
Forests 12 01456 g005
Figure 6. Resilient modulus Mr,eff for soil csaCl.
Forests 12 01456 g006
Figure 7. Resilient modulus Mr,eff for soil sagrSi.
Forests 12 01456 g007
Figure 8. Resilient modulus Mr,eff for soil grsaCl.
Forests 12 01456 g008
Figure 9. Resilient modulus Mr,eff for soil siSa.
Forests 12 01456 g009
Figure 10. Resilient modulus Mr,eff for soil grsiSa.
Forests 12 01456 g010
Figure 11. Resilient modulus Mr,eff for soil siGr.
Forests 12 01456 g011
Figure 12. Resilient modulus Mr,eff for individual soil classes—uncensored data.
Forests 12 01456 g012
Figure 13. Dependence of resilient modulus Mr,eff on plunger stress for uncensored data.
Forests 12 01456 g013
Table 1. Sample classification and the corresponding mean values of density and humidity.
Soil Type USCSSample NumberSpecimen NumberMean Density kg·m−3Mean Humidity %
Cl10601598.823.8
siCl3181655.920.7
saclSi2121748.318.6
csaCl5301813.715.7
sagrSi6361858.513.4
grsaCl4241635.521.5
siSa10601796.014.7
grsiSa2121827.313.6
siGr4241929.612.7
Table 2. Statistics of resilient modulus Mr,eff for individual soil classes.
Soil TypeMeanMin MeanMax Mean
MPa
VarMinMax
MPaMPaMPaMPa
Cl123.343.2327.90.8336.9429.9
siCl140.821.9226.51.0814.9375.9
saclSi122.756.2189.10.5946.9261.3
csaCl106.951.8177.20.4644.2250.8
sagrSi101.828.5260.90.7820.8330.7
grsaCl107.946.9272.40.8241.8374.9
siSa216.525.7675.70.9819.0913.6
grsiSa116.9116.8117.10.2467.4168.7
siGr32.213.845.00.609.079.9
Table 3. Statistics of plunger stress for individual soil classes.
Soil TypeMeanVarMinMaxCor
kPakPakPa
Cl779.80.59336.02202.80.83
siCl1058.40.59256.41986.30.93
saclSi1060.70.75611.23514.10.80
csaCl737.80.23495.11229.00.79
sagrSi586.00.48194.51211.30.93
grsaCl701.50.18521.7999.10.66
siSa1023.20.46362.51935.30.94
grsiSa1240.00.20725.01635.70.25
siGr231.40.5479.6495.10.86
Table 4. Statistics of resilient modulus Mr,eff for uncensored data.
Soil TypeMeanVarMinMax
MPaMPaMPa
Cl46.10.1836.966.4
siCl21.90.2114.928.0
saclSi56.20.1346.964.5
csaCl55.80.1544.270.8
sagrSi54.40.4120.883.5
grsaCl65.40.2641.890.8
siSa42.70.4219.077.5
grsiSa----
siGr18.10.349.028.3
Publisher’s Note: MDPI stays neutral with regard to jurisdictional claims in published maps and institutional affiliations.

