Article

Comparison of Intra-Annual Xylem and Phloem Formation of Picea crassifolia Stands at Two Latitudes in Northwest China

1
Key Laboratory of Vegetation Restoration and Management of Degraded Ecosystems, South China Botanical Garden, Chinese Academy of Sciences, Guangzhou 510650, China
2
Guangdong Provincial Key Laboratory of Applied Botany, South China Botanical Garden, Chinese Academy of Sciences, Guangzhou 510650, China
3
Core Botanical Gardens, Chinese Academy of Sciences, Guangzhou 510650, China
4
College of Ecology and Environment, Ningxia University, Yinchuan 750021, China
*
Author to whom correspondence should be addressed.
Forests 2021, 12(11), 1445; https://doi.org/10.3390/f12111445
Submission received: 8 September 2021 / Revised: 18 October 2021 / Accepted: 20 October 2021 / Published: 23 October 2021

Abstract

:
Understanding the changes in xylem and phloem formation of trees and their relationship along latitudes are important for evaluating and predicting how fragile forests may respond to climate change; however, corresponding studies are still relatively scarce. This study investigated the intra-annual dynamics of xylem and phloem formation of Picea crassifolia and their relationship at two latitudes of arid and semi-arid forests in China. The results showed that both xylem and phloem formation varied at different latitudes. Xylem formation at the low-latitude site (Luoshan) started two weeks earlier than that at the high-latitude site (Helanshan) but ended one week later, resulting in an extended growing season at the low-latitude site. Phloem formation preceded cambium activity and xylogenesis at both sites by 24.6 days in Luoshan, which had warmer conditions, and by 17.3 days in Helanshan. In Luoshan, compared to Helanshan, there occurred significantly more enlarging and wall thickening cells, during (relatively wet) June–August, but significantly fewer enlarging and wall thickening cells as well as total xylem cells, during (relatively dry) April–May. Sample trees produced significantly fewer early phloem cells during the early growing season (April–May) in Luoshan, but generated significantly more late phloem cells during the late growing season in Helanshan. Additionally, different trade-offs between xylem and phloem formation were observed at different sites. The longer duration of early phloem formation might have shortened the duration of xylem lignification in Helanshan; in Luoshan, the date that late phloem reached its maximum growth rate was significantly positively correlated with the date when xylem lignification ended. The results revealed the plasticity of xylem and phloem formation under changing environmental conditions and a complex and site-specific relationship between xylem and phloem formation. These findings could help us better understand and predict the future growth of arid and semi-arid forests in China in response to climate change.

1. Introduction

In the context of global climate change, uneven temperatures and precipitation patterns have resulted in increased frequency of extreme climatic events, such as droughts, sandstorms, and floods, which profoundly affect the forest ecosystems that human beings rely on [1,2,3,4]. As the main component of forest ecosystems, trees play a key role as windbreaks and in sand fixation, water conservation, and climate regulation [5,6,7]. In the face of the challenges posed by climate change, understanding how trees grow and respond to climate change is of great significance for predicting and scientifically managing forests in the future, especially fragile forests [8,9].
Tree growth depends on the division and differentiation of cambial cells [10,11]. Cambial cells outwardly divide into phloem cells and inwardly give rise to xylem cells [12]. Xylem and phloem are two long-distance conducting tissues for the transport of water and solutes throughout a plant and play a key role in the carbon sequestration of forests [13]. Besides providing structural support, xylem carries water and nutrients absorbed by the root system to above-ground tissues (e.g., shoots and leaves) to affect plant physiological and ecological functioning [13]. Tree productivity and overall performance depend heavily on the amount of water supplied through the xylem [14]. Phloem delivers photoassimilates (carbohydrates) from source tissues (e.g., mature leaves) to respiring and growing tissue, providing a source of metabolic energy or transferring defensive and signaling compounds (e.g., hormones) [13,15,16]. Although the functions of xylem and phloem differs, they are closely related [17,18,19], and whole-tree survival and functionality, including carbon sequestration, depend on the interplay between xylem and phloem [20,21].
To date, many studies have been conducted on the intra-annual dynamics of xylem formation [22,23,24,25], but studies on the dynamics of phloem formation are still relatively scarce. Previous studies on conifers or deciduous tree species generally concluded that phloem formation precedes cambium activity and xylogenesis, and phloem production culminates before xylem production by about 3–4 weeks [23,26,27]. The production of xylem and phloem cells is determined by the duration and rate of cambial cell division [28]. Compared to xylem formation, which is highly influenced by abiotic and biotic environmental factors, the rate of phloem formation is quite stable throughout the growing season and across years [22,26,29,30]; hence, phloem formation is considered less responsive to environmental changes and is more endogenously controlled [31]. However, differences in phloem phenology at different sites have demonstrated that phloem formation is at least partly affected by local climate [27]. Under normal conditions, cambium division is more intense on the xylem side than on the phloem side [12]; therefore, the number of xylem cells produced by the cambium is generally greater than the number of phloem cells derived from the cambium. Under adverse environmental conditions, limited carbon availability may lead to carbon allocation trade-offs between different competing sinks [14]. The number of formed xylem cells decreases due to the diminished vitality of a tree; thus, the ratio of xylem to phloem cells progressively decreases to maintain the tree’s survival [12,32]. A decreased xylem–phloem ratio indicates the decrease in tree vitality [33]; hence, the xylem–phloem ratio is regarded as a good indicator for estimating tree growth [27,32,34].
The altered dynamics of xylem and phloem formation, including phenology and yield, probably relate to environmental changes [22,23,25]. Temperature and precipitation are considered as two essential climatic factors affecting the kinetics of cell differentiation and ultimately affecting the radial growth of trees [14,35,36,37]. Temperature is generally considered an important factor in stimulating growth onset of temperate and boreal trees after winter dormancy [38]. Because a majority of a root system needs to be warmed up in spring for its activities recovery after winter dormancy [39], low temperatures during the early growing season limit the functioning of fine roots [40,41] and water uptake, thus reducing sap flow in stems [42]. Warming in spring could enhance root activities, and directly elevate water resorption and availability [43,44] as well as sap ascent [45]. In addition, warming during spring potentially increases the production of hormones (e.g., cytokinin) in roots [46], which could then be transported up to stem and leaves for cell division and bud differentiation [47,48]. Thus, temperature can affect tree phenology by influencing carbohydrate metabolism through enzymatic kinetics [49]. According to previous studies, contrasting temperatures prevailing at the beginning of the growing season are the main factor in causing variability in xylem and phloem phenology across years [23,26], and temperature is the key factor driving cambial reactivation after winter dormancy [50,51,52,53]. Higher temperatures generally promote the beginning of xylogenesis [54,55]. Studies conducted at various latitudes or altitudes have shown that the phenology (e.g., onset and end dates) of xylem and phloem formation is mainly driven by temperature [23,55]. Additionally, precipitation has an important effect on cambium activities and thus largely determines xylem and phloem formation, especially under stressful water conditions [56,57,58]. An increase in precipitation during the dry early growing season (e.g., April–May) typically favors the radial growth of trees [59]; by contrast, a decrease in water availability constrains cambial cell expansion and can directly limit cambial activity, consequently resulting in reduced cell expansion [56]. Drought can therefore affect plant growth directly at the cellular level by limiting cell enlargement (a turgor-driven process) and inhibiting cambial cell division [60].
Although studies on the intra-annual dynamics of xylem and phloem formation for tree species have markedly increased in the last decade [61], studies on the relationship between xylem and phloem formation of trees remain scarce [12,34,61]. How they coordinate in response to climate warming, through phenology or the number of cells produced, or both, is still unclear, especially in fragile forest ecosystems (e.g., forests in arid and semi-arid areas). To solve this issue, we monitored the intra-annual xylem and phloem formation of a dominant tree species (Picea crassifolia Kom.) at two latitudes (for characterizing climate warming by spatial variation) in arid and semi-arid forests in northwest China. The number of phloem and xylem cells was counted and the critical timings of the different phenological events were monitored. The specific objectives were: (1) to compare the intra-annual dynamics of xylem and phloem formation and (2) to explore the xylem–phloem relationship at the two latitudes. According to previous studies, warming can advance the onset of cambium activity and prolong the duration of xylem formation [54,55]. Additionally, under adverse environmental conditions, through regulating the allocation of carbon resources, plants could alter the number of xylem and phloem produced by cambium, thus changing the ratio of xylem to phloem cells [14,22,23,25]. Therefore, we hypothesized: (1) xylem and phloem formation at low-latitude sites (relatively warmer) start earlier and both have a longer growing season and more cells generated than that at high-latitude sites; and (2) xylem formation relates to phloem formation, and their phenology and the ratio of cells produced vary at different latitudes.

2. Materials and Methods

2.1. Study Area

The study was conducted in the Helanshan (105°49′–106°41′ E, 38°19′–39°22′ N) and Luoshan (106°04′–106°24′ E, 37°11′–37°25′ N) National Nature Reserves in China. The Helanshan Nature Reserve (HNR) is located in northwest Ningxia and has a continental monsoon climate. Based on the meteorological data between 1953–2018 from the nearest Yinchuan Weather Station (106°12′ E, 38°20′ N), the average annual air temperature of HNR was 9.2 °C, with the warmest and coldest months occurring in July (maximum temperature 23.8 °C) and January (minimum temperature −7.9 °C), respectively [62]. The mean annual total precipitation was 195.1 mm, mainly distributed from July to September (accounting for 60% of annual precipitation) [62]. With rich biodiversity and obvious vertical zoning of vegetation, HNR is a typical mountain ecosystem located in the semi-arid and arid regions of the middle temperate zone of China. The HNR is intended to protect the natural ecosystem and biodiversity, ensure water conservation in forests dominated by Picea crassifolia, and protect typical natural areas with a vertical band distribution of forest vegetation in arid mountainous areas.
Luoshan Nature Reserve (LNR) is located in the arid zone of central Ningxia and has a temperate continental semi-arid climate. The mean values of meteorological data during 1955–2018 from Zhongning Weather Station (105°24′ E, 37°17′ N), nearest to LNR, showed that, the average annual temperature of LNR was 9.7 °C, the highest monthly average maximum temperature was −23.8 °C (in July), and the lowest monthly average minimum air temperature was −6.8 °C (in January) [62]. The mean annual total precipitation is 208.1 mm. Precipitation occurring in July–September accounts for 60.3% of the annual precipitation. LNR is also an important water conservation forest area in Ningxia. Pure coniferous forest is the most stable forest vegetation community and is the climax of forest vegetation succession in LNR. One of the main objectives of the LNR is to protect typical forest ecosystems that have P. crassifolia and Pinus tabulaeformis Carr. community species.

2.2. Sampling and Sample Preparation

In the study, 10 and 8 healthy P. crassifolia trees with upright trunks were selected from the Helanshan and Luoshan sampling sites, respectively. Information about the sampling sites and sample trees is shown in Table 1.
The study began in 2019. Repeated micro-sampling of the stem at breast height was conducted using a Trephor with a diameter of 2 mm [63]. Microcore samples were taken from March to November in Helanshan and from March to October in Luoshan. To identify more accurate critical timings of xylem and phloem formation, samples were taken on a 3–5-day cycle from March to May (from cambium dormancy to the early growing season), and then taken weekly from June onward in 2019. Samples were extracted from tree stems following a spiral trajectory, with the distance of 2–3 cm from previous sampling points to avoid anatomical malformation or disturbance due to previous sampling. Each microcore sample included the latest tree ring as well as at least three recently formed tree rings [64] and bark (phloem), and was placed in an Eppendorf microtube filled with 50% ethanol solution for fixation and conservation, then marked and stored at 4 °C.
All microcores were dehydrated in a graded series of ethanol (70%, 90%, 95% and 100%) and D-limonene, and embedded in paraffin (melting point at 60 °C) [63]. Transverse sections of 8–9 μm were prepared using a Leica RM2235 rotary microtome with Feather A35 microtome blades. Protein glycerin adhesive was used as mounting medium. The prepared transverse sections were dried at 40 °C, and then the residual paraffin was removed by immersing the slides in D-limonene and ethanol. Sections were stained using 0.06% cresyl violet acetate. All stained sections were observed under an optical microscope with polarized light at magnifications of 400× g to identify cambium activities (dormancy and division) and developing xylem cells (including radial enlarging, wall thickening, and mature cells) [63] as well as phloem cells (including early and late phloem cells) (Figure 1). The birefringence of the secondary cell wall of enlarging and wall thickening xylem cells showed different rendering under polarized light [65]. Wall thickening xylem cells with secondary walls showed birefringence [65]. When xylem cells finished lignification, the color altered from violet to blue [63]. Early and late phloem sieve cells were separated by an axial parenchyma band with dark stained contents in the cell lumina [22,26]. The tangential wall of the first early phloem cells was adjacent to the crushed sieve cells of the previous year [29], and the late phloem cells were produced after the tangential band of axial parenchyma cells formed [22].

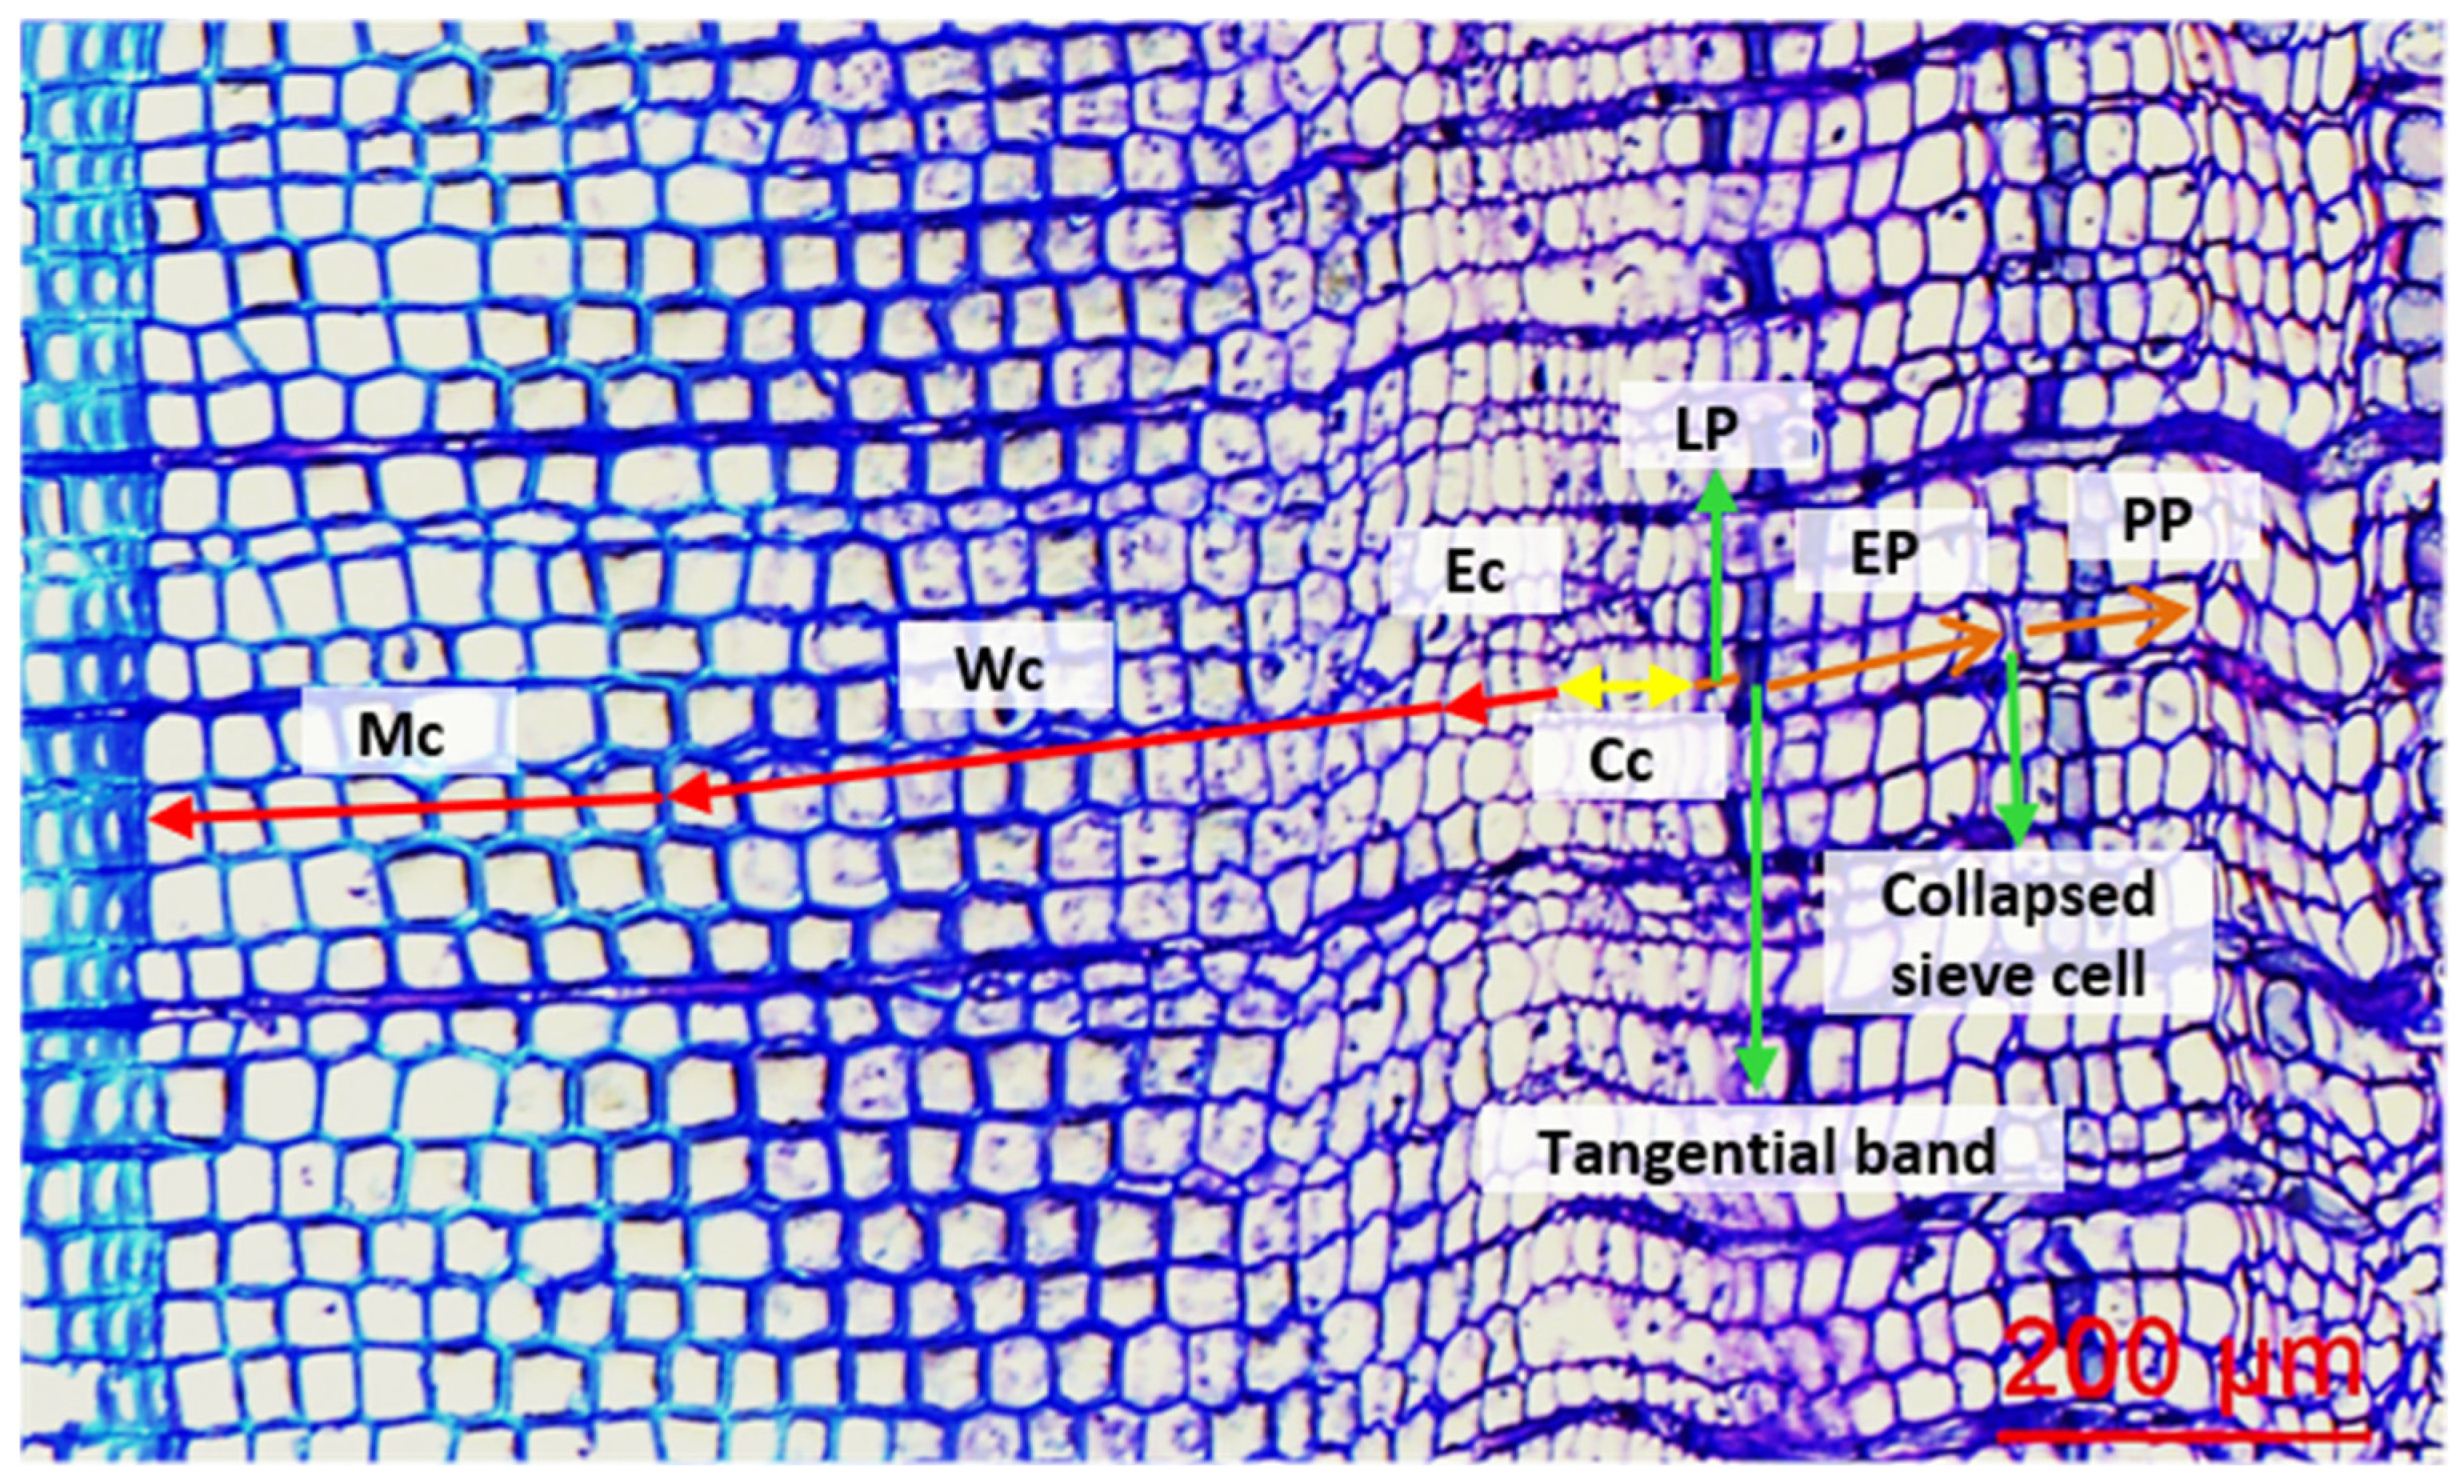
2.3. Cellular Measurements

Three radial files per sample were selected to measure the cambial cells, differentiating (radial enlarging and wall thickening) cells, mature xylem cells, and early and late phloem cells. The total number of xylem cells formed at each sampling date was calculated as the sum of differentiating (radial enlarging and wall thickening) and mature xylem cells [66]. The total number of conducting, non-collapsed phloem cells formed at each sampling date was calculated as the sum of early and late phloem cells in a conducting stage, without taking the axial parenchyma cells in consideration [31].
The key phenological dates of xylem formation at the tree level were computed automatically using the CAVIAR R package, including: (1) the beginning of cell enlarging (bE), cell wall thickening (bL), and mature phase (bM); (2) the cessation of cell enlarging (cE) and cell wall thickening phase (cL); and (3) the duration (number of days between the onset and end of the corresponding phase) of cell enlarging (dE = cE − bE) and maturing phase (dL = cL − bL); and the total duration of xylogenesis (dX = cL − bE) [67]. The starts and ends of critical timings were recorded as days of the year (DOY) [66,68].

2.4. Meteorological Data Collection

In March 2019, two small weather stations in Helanshan (105°55′07″ E, 38°46′52″ N) and Luoshan (106°15′28″ E, 37°16′28″ N) were built near to the Helanshan and Luoshan sampling sites to collect climate data, respectively. The climate data were monitored every five minutes per day, including air temperature and precipitation values.

2.5. Statistical Analysis

2.5.1. Growth Dynamic Fitting and Biological Parameters Computing

According to previous studies, Gompertz functions were good for fitting cumulative cell count data [26,69]; therefore, Gompertz functions were applied to model the intra-annual growth dynamics of mature cells, total xylem cells, and early phloem cells, which were cumulative. The Gompertz function was defined as
Nt = a·exp[−e(bκt)]
where Nt is the number of cells at sampling date t. Parameter a represents the upper asymptote of the final number of cells, b is the x-axis placement parameter reflecting the location of the origin, and k is the growth rate parameter determining the spread of the curve along the time axis. The residuals of parameters were regressed onto the partial derivatives until the estimates converged. For each parameter, several possible starting values were specified, and a nonlinear least squares (“nls”) procedure was used to estimate the parameter. The 95% confidence intervals of the estimated parameters (a, b, and k) were calculated based on a 1000-time bootstrapping for each dataset. The coefficient of determination (R square) was computed to determine the goodness of fit of the model (Table S1).
The biological parameters from the Gompertz equations were computed, including (1) the date at which 5% of the cells were produced (t5), (2) the date of the inflection point (tip), (3) the date at which 95% of the cells were produced (t95), (4) the duration between 5 and 95% of the produced cells (Dt90 = t95 − t5) (Figure S1A), (5) the maximal growth rate (rmax), and (6) the mean growth rate computed between 5 and 95% of the produced cells (r90) (Figure S1B). The equations were defined as:
t5 = (b − log(−log(0.05)))/k
tip = b/k
t95 = (b − log(−log(0.95)))/k
Dt90 = log(log(0.05)/log(0.95))/k
rmax = (k*a)/exp(1)
r90 = (0.9*k*a)/(log(log(0.05)/log(0.95)))
where a, b, and k are the parameters in the Gompertz equations.
Generalized additive models (GAMs) were suitable for evaluating highly non-linear and non-monotonic relationships between the responses and the explanatory variables [28]. Because the growth curves of differentiating xylem cells (radial enlarging and wall thickening cells) and late phloem cells (caused by collapsing sieve cells) were non-linear change and non-S-shaped growth curves, GAMs were used to model the growth dynamics of differentiating xylem and late phloem cells, as well as total phloem cells. In this study, the GAMs were expressed as:
Nd = α + s(d) + ε
where Nd is the vector of the number of cells counted at sampling date d (the corresponding day of the year), s is an unspecified smooth function, α is the intercept, and ε is the error term. GAMs were fitted using the mgcv R package [70]. The R squared was also computed to estimate the goodness of fit of the GAMs (Table S1).
Furthermore, the maximum predicted cell production (Pmax) and its date of appearance (TPmax) were determined using the fitted GAMs, and then the first date for 5% of maximum production (t5) and 95% of maximum production (t95), and the duration between 5% and 95% of the maximum produced (Dt90) were calculated (Figure S1C). The first derivative of fitted GAMs was computed to obtain the growth rate and the maximum growth rate (rmax). The date of rmax (Trmax) and the average rate between t5 and t95 (r90) were also calculated (Figure S1D).

2.5.2. The Between-Site Comparison of Xylem and Phloem Formation

Mixed-effects models are useful tools for analyzing repeated measure data [71]. To test whether xylem and phloem formation varied in different time periods (April–May, June–August, and September–November) and/or differed between sites, mixed-effects models and analysis of variance (ANOVA) were used to compute the effects of sites (Site), periods (T), and their interactive effects (Site × T) on xylem and phloem formation, including tree as the random effect and the first-order autoregressive error in the repeated measurement over time within trees. The division of periods was based on the start and end date of phloem and xylem formation, and the climatic characteristics of the regions, for which the temperatures from June to August (summer) and from December to following-year February (winter) were the highest and lowest within a year, respectively. Linear mixed-effects models were also used to (1) compare the intra-annual xylem and phloem formation during different periods at each site, respectively, and (2) analyze the relationships between different critical timings of xylem and phloem formation at each sampling site, in which tree was the random effect. The Wilcox test was used to compare critical timings between sites, including the critical dates and durations calculated using the CAVIAR R package and the parameters computed from the fitting functions (Gompertz functions and GAMs). All statistical analyses mentioned above were performed, and diagrams were produced, using R 4.0.4 (R Development Core Team, 2007).

3. Results

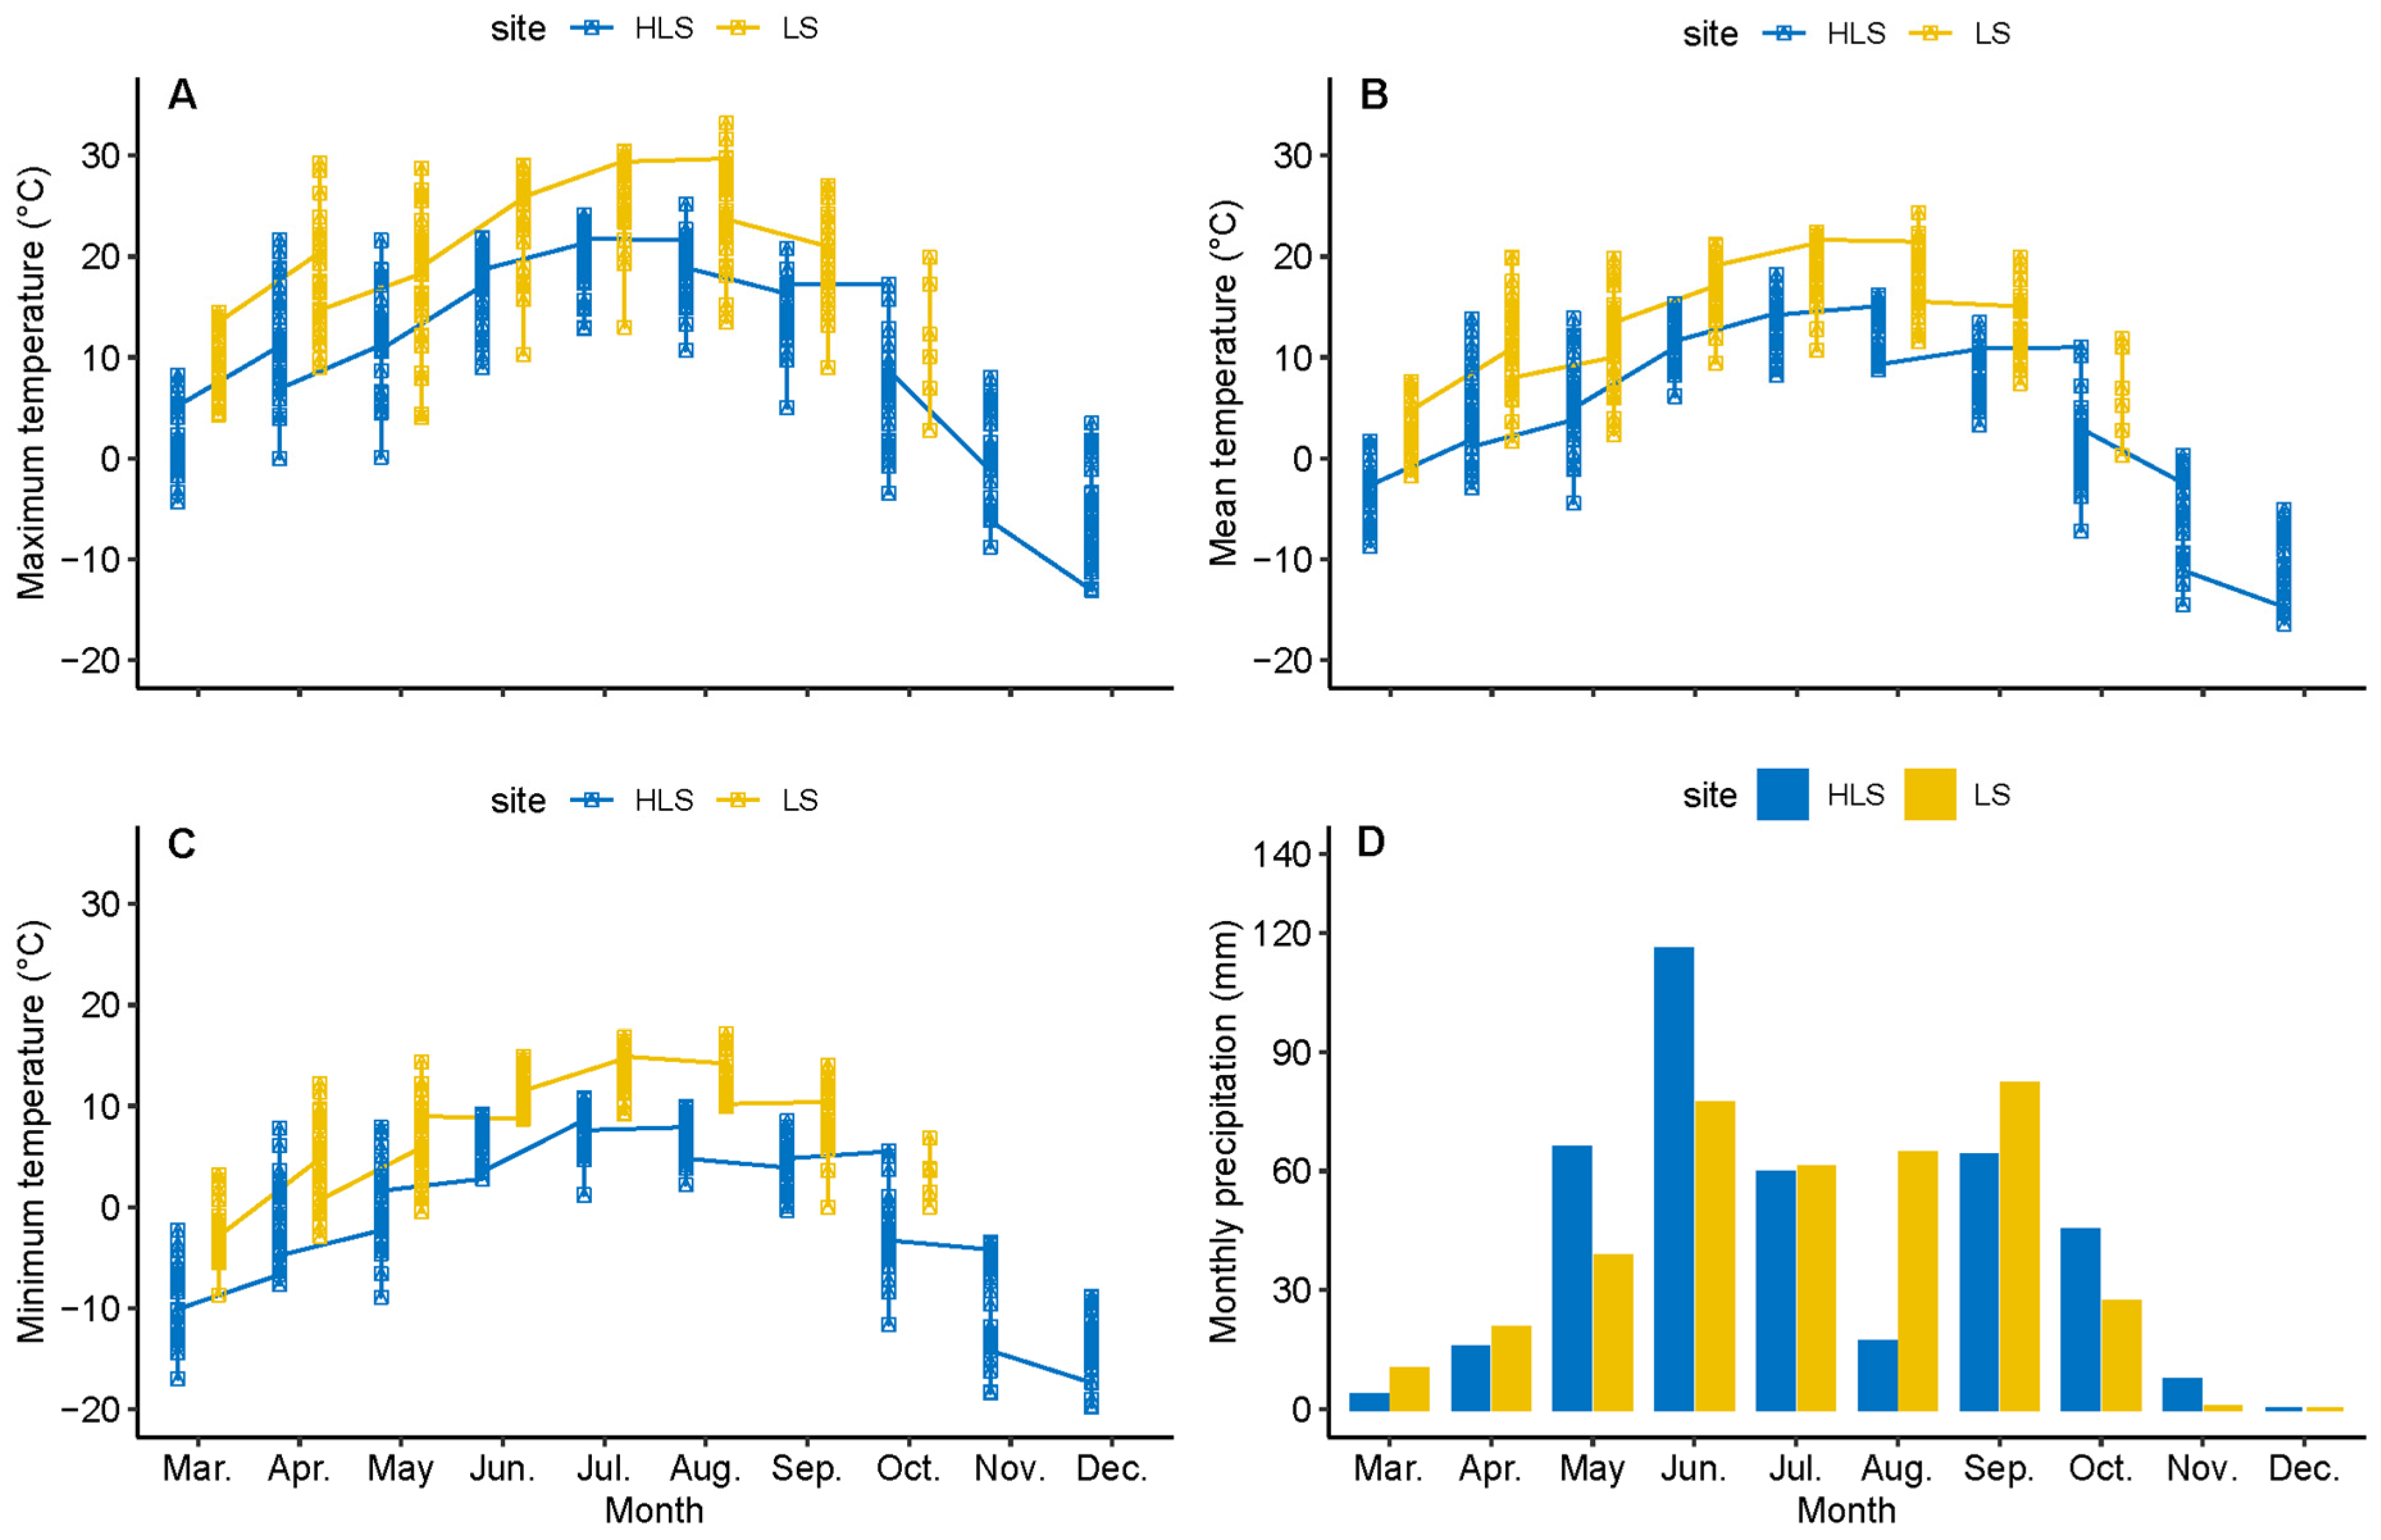
3.1. Climatic Differences between Sites

In 2019, although the air temperature from November to December in Luoshan was not monitored, the average monthly air temperatures (monthly maximum and minimum temperature and mean monthly temperature) in Luoshan were higher than those in Helanshan overall (Figure 2); Helanshan has a colder spring and autumn compared to Luoshan. The air temperatures in July and August at the two sampling sites were higher than in other months. The amount of precipitation in Helanshan during April–June was 1.45 times that of Luoshan. However, Luoshan received more precipitation during July–November than Helanshan; the total amount of precipitation in Luoshan during this period amounted to 235 mm, 1.22 times that of Helanshan.

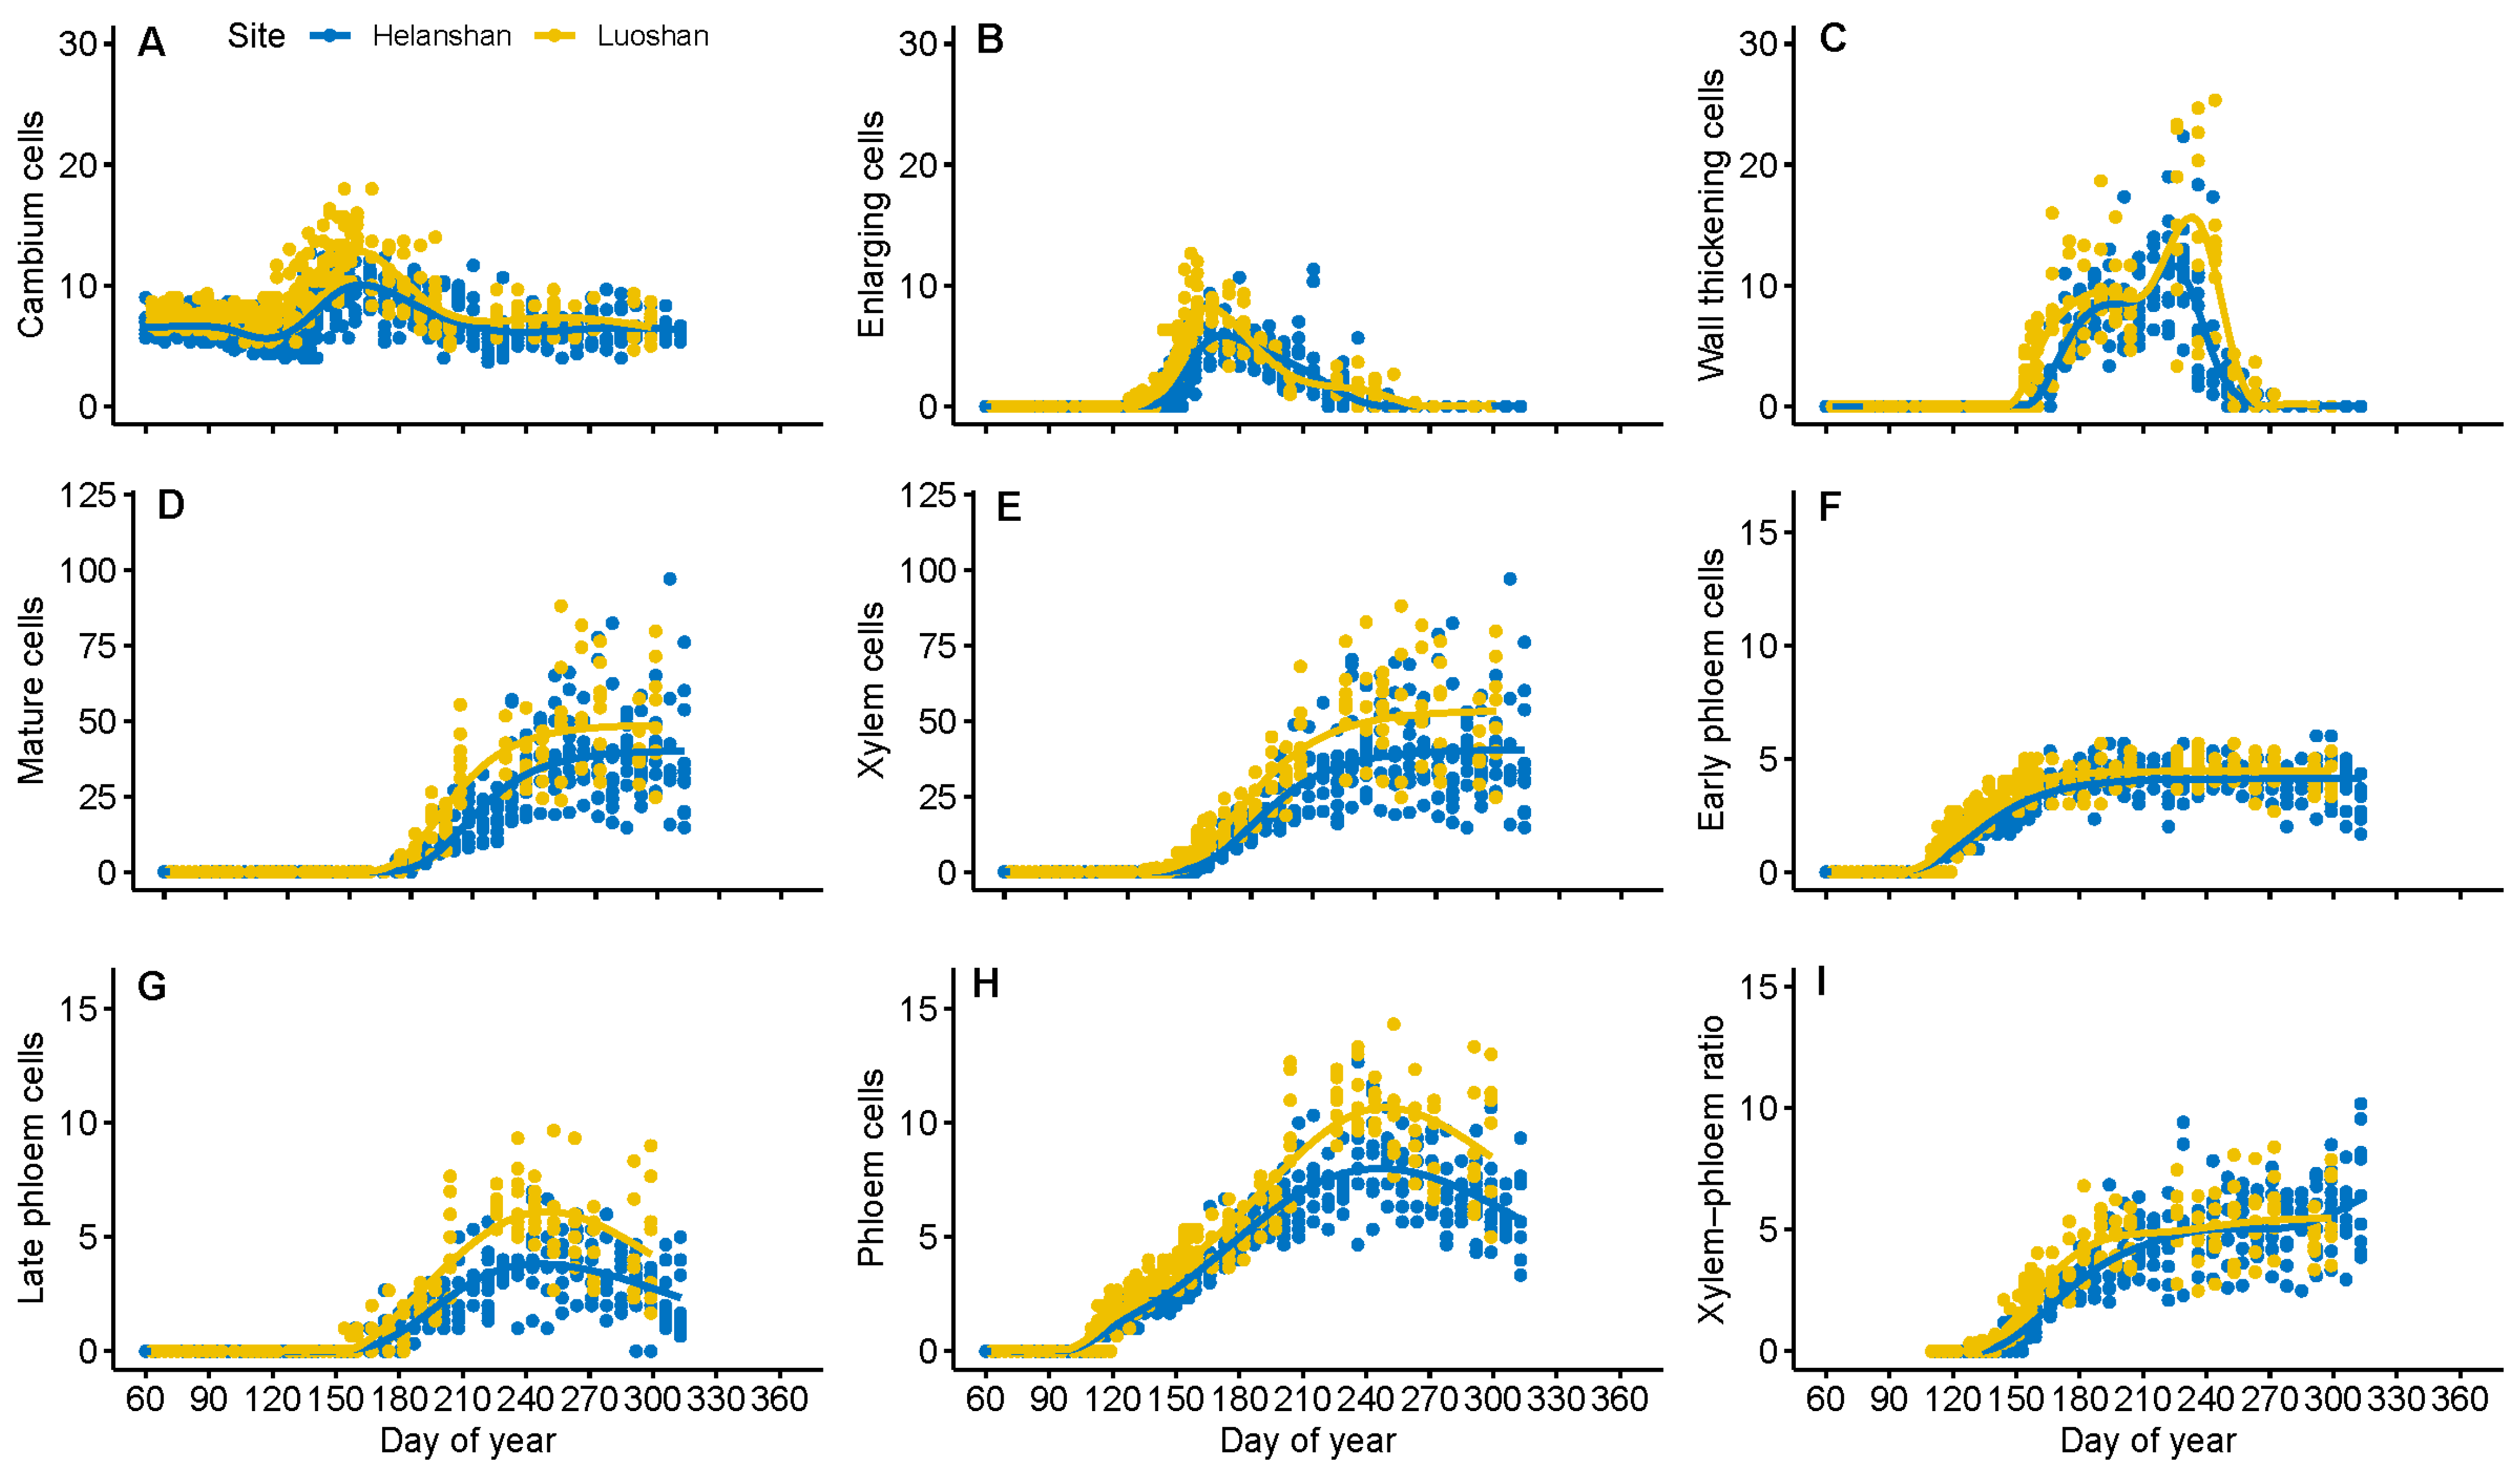
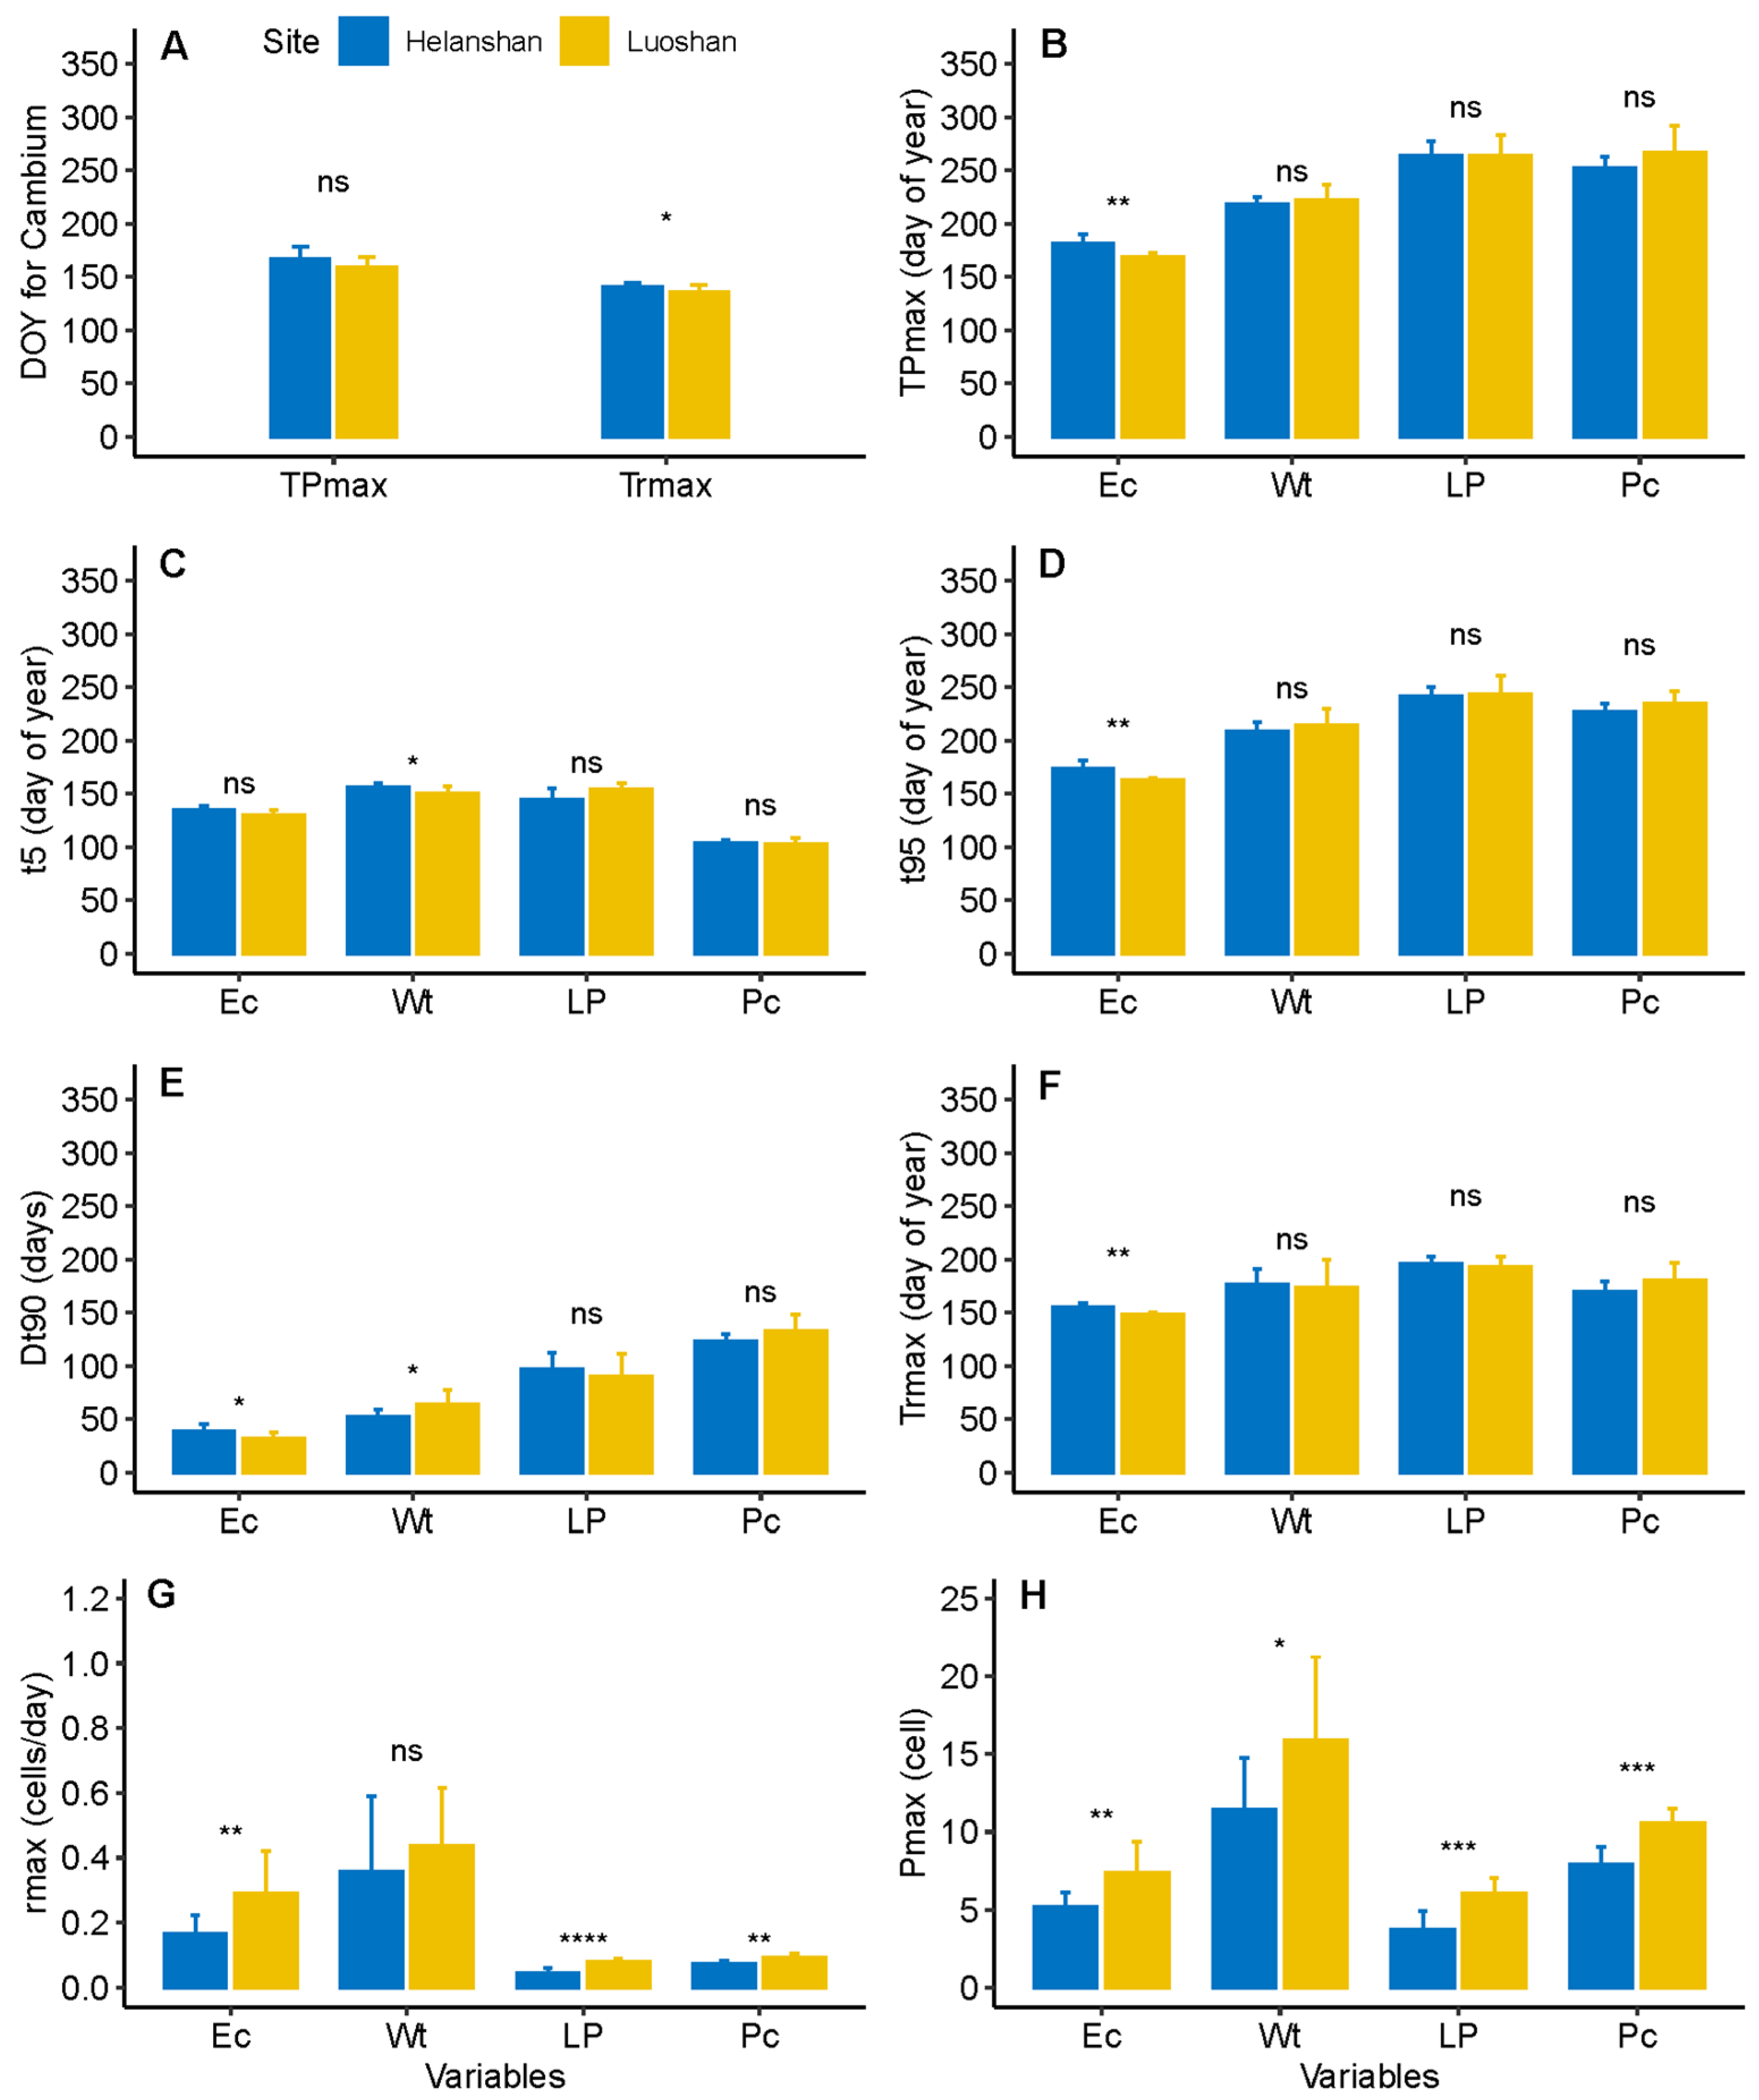
3.2. Dynamics of Xylem Formation between Sites

Before the growing season (March, before DOY 90), the dormant cambium of sampled trees in Helanshan consisted of 6–7 cells, but 7–8 cells in Luoshan (Figure 3A). During the growing season, the number of cambial cells at both sites reached the highest values in June, amounting to 16 cells in Helanshan and 19 cells in Luoshan. However, the number of cambial cells in Luoshan reached its maximum value 7 days earlier than in Helanshan. At both sites, enlarging cells produced bell-shaped curves skewed to the left (Figure 3B), while wall thickening cells produced bimodal curves (Figure 3C). Mature cells (Figure 3D) and total xylem cells (Figure 3E) showed an increasing S-shaped curve. The first enlarging cells (start of the enlarging phase) were detected in mid-May (133.3 ± 7.6 DOY) in Luoshan (Table 2). The beginning of the enlarging phase in Helanshan was delayed by two weeks compared to Luoshan. The onset of wall thickening occurred first in Luoshan in early June (154.8 ± 3.6 DOY) and significantly preceded that in Helanshan (by one week). The enlarging phase in Helanshan was completed about two weeks earlier than in Luoshan. The durations of the enlarging phase, wall thickening phase, and xylogenesis in Luoshan were significantly longer than in Helanshan by 28.0, 12.5, and 20.1 days, respectively (Table 2). No significant difference in the start date of mature phase and end date of lignification was detected between sites in the study.
Based on the comparison results for the biological parameters, the number of cambial cells in Luoshan increased rapidly and culminated early, reaching its maximum growth rate 7 days earlier than in Helanshan (Figure 4A). Compared to Helanshan, the enlarging cells in Luoshan took less time to reach their maximum growth, which was characterized by significantly lower TPmax, t95, Dt90, and Trmax values for enlarging cells and a significantly higher growth rate (rmax) (Figure 4). The date of wall thickening cells in Luoshan which arrived at t5 significantly preceded that in Helanshan. The dates when the mature cells and total xylem cells in Luoshan reached their 5% of the produced cells (t5) as well as their inflection point of growth were significantly earlier than in Helanshan, respectively (Figure 5D,E). However, no significant difference in parameters a, b, k, t95, Dt90, rmax, and r90 for mature cells and total xylem cells were detected between sites (Figure 5).
The interactive effect results showed that Site × T (periods) interactions had a significant effect (p < 0.0001) on the formation of enlarging, wall thickening, mature cells, and total xylem cells of P. crassifolia, but had no significant effects on cambium activities (Table 3). The main effect of T played a significant role in the formation of differentiating xylem cells (enlarging, wall thickening, and mature) and total xylem cells, while nonsignificant main effects of Site were found for the accumulation of differentiating xylem and total xylem cells. Seasonal comparisons results showed that Luoshan had significantly more enlarging (t = 4.77, p < 0.0001) and wall thickening cells (t = 2.75, p = 0.006) during June–August compared with Helanshan, but had fewer enlarging (t = −13.48, p < 0.0001) and wall thickening cells (t = −11.78, p < 0.0001) and xylem cells (t = −19.64, p < 0.0001) during April–May and fewer mature cells (t = −6.35, p < 0.0001) during June–August (Table 4).

3.3. Dynamics of Phloem Formation between Sites

The differentiation of the first early phloem sieve cells at both sites started before the onset of cambium division and xylem formation (Figure 3). Phloem formation preceded xylem formation by, on average, 24.6 days in Luoshan, but by 17.3 days in Helanshan. The onset of early phloem formation in Luoshan occurred in late-April, about one week earlier than in Helanshan. At both sites, differentiation of early phloem, consisting of 5–6 layers of sieve cells, was completed by mid-to-late June, followed by late phloem formation. The late phloem cells in both sites reached their maximum production after mid-September, with average late phloem cells numbering up to six layers in Luoshan, but four layers in Helanshan. Collapsed sieve cells of late phloem were also observed at both sites after mid-September.
The biological parameters b and k of early phloem formation in Luoshan were significantly higher than in Helanshan, but no significant difference in the predicted maximum production (parameter a) of early phloem cells was observed between sites (Figure 5). The dates at which early phloem cells in Luoshan reached the inflection point and 95% of produced cells (t95) were significantly earlier than in Helanshan. The early phloem cells of P. crassifolia in Luoshan showed significantly higher values for parameters rmax and r90, but a significantly lower value for parameter Dt90, than in Helanshan. Compared with Helanshan, the late phloem in Luoshan reached its maximum production at a higher rate and produced more cells (Figure 4).
The interactive effect of Site × T had significant effect on the formation of early and late phloem cells and total phloem cells (Table 3). Seasonal comparison results revealed that sample trees in Luoshan produced significantly fewer (t = −25.20, p < 0.0001) early phloem cells during early growing season (April–May), but generated significantly more (t = 4.52, p < 0.0001) late phloem cells during the late growing season (September–November) compared with Helanshan (Table 4).

3.4. Comparison of Phloem and Xylem Relationship between Sites

The ratios of the total number of xylem to phloem cells at both sampling sites were curvilinear (Figure 3I). The mean ratio of xylem to phloem cells in Luoshan before mid-July was higher than in Helanshan. Significant relationships between the xylem and early phloem growth of P. crassifolia were detected at both sites (Table 5). In Helanshan, the end date and duration of the wall thickening phase had a significant negative correlation with the procedure parameter tip and t95 of early phloem formation. In addition, a significant negative relationship between the duration of xylogenesis and t95 of early phloem formation was found in Helanshan, that is, the higher the values for parameter tip and t95 of early phloem cells, the earlier the cessation of lignification and the shorter the duration of lignification for xylem.
In the case of Luoshan, xylem formation was significantly related to both early and late phloem formation (Table 5). The start date of the enlarging phase was significantly negatively correlated to the rmax and r90 parameters of early phloem formation. The start date of the wall thickening phase had a significant negative relationship with the maximum production of late phloem cells, but was significantly positively related to the t5 and tip parameters of early phloem formation. The end date of the wall thickening phase had a positive correlation with the date when late phloem reached its maximum growth rate (Trmax). Furthermore, the start date of the mature phase showed a significant positive relationship with the parameter tip of the early phloem formation.

4. Discussion

Understanding of the intra-annual xylem and phloem formation of trees, and their relationship with changing climatic factors, and potential trade-offs with xylem formation is still limited, especially regarding arid and semi-arid forests. In this study, the intra-annual xylem and phloem formation of P. crassifolia at two sites (Helanshan and Luoshan) submitted to two latitudes in arid and semi-arid regions of China were investigated. The results showed that the phenology and dynamics of xylem and phloem formation of P. crassifolia varied between the sites. With an earlier start and delayed end, xylem formation in Luoshan was longer than in Helanshan. At both study sites, the onset of phloem formation considerably preceded that of cambium activity and xylem formation. The growth rate and duration of early phloem cells significantly differed between sites. Late phloem in Luoshan had a higher growth rate and produced more late phloem cells compared with Helanshan. Moreover, the relationship between xylem and phloem formation was inconsistent between sites.

4.1. Differences in Xylem Formation between Sites

Previous studies on xylem formation of temperate and boreal trees have generally concluded that temperature plays a significant role in the yield of cambial cells at the very beginning of the growing season [30] and in triggering xylogenesis during spring [50,72], therefore, warmer conditions after winter dormancy can advance tree radial growth [54,55]. In this study, an earlier onset of xylem formation was observed in Luoshan (the low-latitude site), where air temperature was relatively high. This result might indicate a positive effect of warmth on initiating the radial growth of trees in the study areas, consistent with previous studies on temperate and boreal trees.
In arid areas, however, precipitation also plays an important role in tree growth [56,73]. Although earlier onset of xylem formation was found in warmer Luoshan, the cell production of xylem in Luoshan was significantly lower than in Helanshan during the early growing season (April–May), which was probably related to the lower amount of precipitation in Luoshan during this period. As reported, wood cell development depends heavily on the availability of photoassimilates [74]. Water availability from precipitation could indirectly affect xylem growth by the way of its effect on photosynthesis and the translocation of assimilates [75,76,77]. Because water supplied by precipitation can cause an increase of water transport in stems, potentially enhancing water transport into the stem sap and supporting leaf growth and photosynthesis [78], it consequently benefits radial growth. On the other hand, differentiating cells need enough water to generate suitable wall-yielding turgor pressure for cell enlargement and growth [79,80]. Water can directly produce turgor pressure to force yielding cell expansion [81]. By contrast, at the cellular level, low water availability (drought) can limit the turgor-driven process of cell enlargement and cambial cell division [60]. Despite a warmer condition tending to produce an extended growing season and increased growth rates [35], which facilitate tree growth, an increased demand for water caused by a temperature rise may offset the positive effects of warming [82,83], potentially explaining why lower xylem cell production in Luoshan occurred during the droughty early growing season. Similarly, the higher yield of xylem cells in Luoshan than in Helanshan during June–August was probably due to the positive effect of greater precipitation on cell production during this period.
Ambient air temperature is effective only in the quiescent phase but not in the antecedent resting stage of the cambium, which follows cessation of cambial activity in autumn [84,85]. In contrast to the onset, cessation of cambial activity can be affected by water availability [26,86]. In this study, the total amount of precipitation in Luoshan during July–November (the mid- to late-growing season) was more than in Helanshan (Figure 2), which may be a reason for Luoshan having a delayed cessation and longer duration of xylem formation.

4.2. Difference in Phloem Formation between Sites

Phloem is an important route for transporting photosynthetic product to non-photosynthetic tissues such as tree trunks, growing leaves, and roots [87]. Previous studies generally showed that phloem is less affected by environmental change during the growing season than xylem formation, and is more endogenously controlled (e.g., reduced due to age) [22], especially for early phloem; late phloem is more responsive to environmental fluctuations than early phloem [22]. Our study found that in warmer Luoshan, early phloem formation began and culminated earlier (Figure 5) and the number of late phloem cells rapidly increased to a maximum and was higher than in Helanshan (Figure 4). These results indicated that both early and late phloem formation were affected by climate changes. Like xylem formation, the earlier onset of early phloem in Luoshan was probably due to the warmer condition.
In addition, warmer condition can extend the duration of phloem formation and cooling can result in earlier cessation of cell production on both sides of the cambium [30,38]. Cell production can be restricted by water deficits [26] or extended by water increases [86]. A previous study found that precipitation in April (during the early growing season) positively affected the number of early phloem cells, and the production of late phloem cells was predominantly determined by precipitation in late autumn and maximum temperature in winter [61]. Moreover, the delayed termination of cambial activity could generate increased numbers of late phloem cells [30]. In this study, Luoshan received lower precipitation during April–May (relatively dry) but higher precipitation during June–September (mid to late growing season) than Helanshan (Figure 1), and the cambium activity in Luoshan ended later and had a longer growing season (Table 2). Those might be the reasons why significantly fewer early phloem cells, during April–May, and significantly more late phloem cells, during the late growing season, were found in Luoshan.

4.3. Differences in Xylem and Phloem Relationships between Sites

Normally, more xylem cells than phloem cells are formed by cambium division; thus, xylem cells accumulate faster than phloem cells, resulting in a higher ratio of xylem to phloem cells [12]. However, for most conifer species, phloem formation for the transport of assimilates generally has priority under poor growth conditions due to the restricted temporal integrity of sieve cells (the conduction of phloem cells is usually only 1–2 years), and is more important for tree survival than xylem formation [34]. Additionally, xylem formation is more responsive to environmental change and decreases sharply under unfavorable conditions [34]; xylem–phloem ratio therefore reduces when tree vitality decreases under stressful conditions. In this study, the xylem–phloem ratio during April–July in Helanshan was lower than in Luoshan (Figure 3I), possibly relating to the restriction of xylem formation by lower temperatures in Helanshan.
Xylem and phloem phenology relate to contrasting temperatures prevailing at the start of the growing season [26]. The onset and culmination of xylem and phloem formation are controlled by early spring temperature, and the initiation of phloem formation requires lower temperatures than xylem formation [26]. In this study, the beginning of phloem formation preceded that of xylem formation at both sites, which supported the conclusion of Swidrak et al. (2014). Moreover, xylem formation in Helanshan was significantly related to early phloem formation. The later the early phloem reached its parameter tip and t95, the earlier the cessation of wall thickening and the shorter the duration of xylem lignification (Table 5). This result indicated a competitive relationship between the early phloem and xylem in Helanshan (which is colder than Luoshan), which might relate to a lower temperature requirement for phloem formation than xylem formation.
Compared to Helanshan, xylem formation in Luoshan correlated with both early and late phloem formation (Table 5). Xylem transports water and nutrients upwards to leaves for photosynthesis, while phloem is responsible for transporting leaf photoassimilates to source tissues, including xylem, for cell wall thickening and lignification [13,15,16]. The onset of the enlarging phase in Luoshan was negatively correlated with the growth rate of late phloem. During the early growing season, the earlier onset of xylem formation provided water for tree growth, thus potentially benefiting for photosynthesis and the production of carbohydrates, because the overall performance of trees depends heavily on the amount of water supplied through the xylem [14]. This might consequently increase the demand on the phloem for transport photoassimilates, accelerating the formation of late phloem. Furthermore, in Luoshan, the slower the growth of early phloem, the later the beginning of wall thickening and mature phase; and the later the late phloem reached its maximum growth rate, the later the wall thickening phase ended (Table 5). The slow growth of early phloem cells would probably result in relatively fewer photoassimilates being transported to xylem cells, while the wall thickening of xylem cells probably depends heavily on the photoassimilates unloaded from phloem, potentially delaying the beginning of wall thickening and the mature phase. Similarly, the slow growth rate of late phloem could also lead to a delayed completion of xylem lignification.

5. Conclusions

Studies on the intra-annual dynamics of xylem and phloem formation and their relationship in trees in fragile forests are required to evaluate and predict the responses by fragile forests to climate change; however, few such studies have been conducted. In this study, we compared the dynamics of xylem and phloem formation and their relationship for P. crassifolia at two latitudes of arid and semi-arid forests in China. We found that both xylem and phloem formation of P. crassifolia were responsive to environmental changes. Xylem phenological phases revealed advanced onset dates and delayed end dates at the low-latitude site (Luoshan) with warmer conditions, resulting in a prolongation of xylem formation. Phloem formation preceded cambium activity and xylogenesis at both latitudes, and similarly had earlier starting dates under warmer conditions compared to under colder conditions. Xylem and phloem cells reached their peak production more quickly at the lower latitude than those at the higher latitude, indicating a temperature-driven acceleration of xylem and phloem formation. Furthermore, the xylem–phloem relationship was varied at different sites in our study. A longer duration of early phloem formation might shorten the duration of xylem cell lignification at the higher latitude; by contrast, late phloem formation might lead to a delayed end of xylem lignification. This suggested a complex relationship between xylem and phloem formation, which was mainly triggered by environmental differences. In summary, our study implied that warmer conditions before the growing season might trigger an earlier onset of xylem and phloem formation, the initiation of phloem formation might require a relatively lower temperature than xylem formation, and the relationship between xylem and phloem formation was complex and related to specific environments. These findings could help us better understand and predict the future growth of arid and semi-arid forests in northwest China under global climate change.

Supplementary Materials

The following are available online at https://www.mdpi.com/article/10.3390/f12111445/s1, Table S1. The coefficient of determination (R2) of the fitting model for xylem and phloem formation dynamics. Figure S1. The biological parameters from the Gompertz equation (A and B) and GAM function (C and D) for a monitored Picea crassifolia tree in Luoshan. For Gompertz function, t5 is the date at which 5% of the cells were produced; tip is the date of the inflection point; t95 is the date at which 95% of the cells were produced; Dt90 (t95–t5) is the duration between 5 and 95% of the produced cells; rmax is the maximal growth rate; r90 is the mean growth rate computed between 5 and 95% of the produced cells and Trmax is the date maximal growth rate appeared. For GAM function, Pmax is the maximum predicted cell production; TPmax is the date that Pmax appeared; t5 and t95 represent the first date for 5% of maximum production and 95% of maximum production, respectively; Dt90 is the duration between 5% and 95% of the maximum produced; rmax is the maximum growth rate computed from the first derivative of fitted GAM; Trmax is the date maximal growth rate appeared and r90 is the average rate between t5 and t95.

Author Contributions

J.H. and X.L. designed the study; B.Y. performed the research, analyzed data, and wrote the paper; J.H., X.L. and P.Z. revised the manuscript. All authors have read and agreed to the published version of the manuscript.

Funding

This work was supported by the Ningxia Hui Autonomous Region Key Research and Development Project (2018BFG02015) and the National Natural Science Foundation of China (32001173, 31901166, and 41630752).

Institutional Review Board Statement

Not applicable.

Informed Consent Statement

Not applicable.

Data Availability Statement

Not applicable.

Acknowledgments

The authors thank Helanshan and Luoshan National Nature Reserves for their support and for the help of their field assistants with sampling. The authors also thank Lin Chen, Jingye Li, Peng Zhou, Hanxue Liang, Shaowei Jiang, and Jiang Kang for setting up the weather stations and selecting sample trees.

Conflicts of Interest

The authors declare no conflict of interest.

References

  1. Chen, L.; Huang, J.G.; Alam, S.A.; Zhai, L.; Dawson, A.; Stadt, K.J.; Comeau, P.G. Drought causes reduced growth of trembling aspen in western Canada. Glob. Chang. Biol. 2017, 23, 2887–2902. [Google Scholar] [CrossRef]
  2. Csillery, K.; Kunstler, G.; Courbaud, B.; Allard, D.; Lassegues, P.; Haslinger, K.; Gardiner, B. Coupled effects of wind-storms and drought on tree mortality across 115 forest stands from the Western Alps and the Jura mountains. Glob. Chang. Biol. 2017, 23, 5092–5107. [Google Scholar] [CrossRef]
  3. IPCC. Climate Change 2014: Synthesis Report. Contribution of Working Groups I, II And III to the Fifth Assessment Report of the Intergovernmental Panel on Climate Change; Core Writing Team, Pachauri, R.K., Meyer, L.A., Eds.; IPCC: Geneva, Switzerland, 2014. [Google Scholar]
  4. Allen, C.D.; Macalady, A.K.; Chenchouni, H.; Bachelet, D.; McDowell, N.; Vennetier, M.; Kitzberger, T.; Rigling, A.; Breshears, D.D.; Hogg, E.H.; et al. A global overview of drought and heat-induced tree mortality reveals emerging climate change risks for forests. For. Ecol. Manag. 2010, 259, 660–684. [Google Scholar] [CrossRef] [Green Version]
  5. Zhang, D.; Stanturf, J. Forest plantations and conservation of natural forests. Ecosyst. For. Plant 2008, 1676–1680. [Google Scholar]
  6. Snyder, P.K.; Delire, C.; Foley, J.A. Evaluating the influence of different vegetation biomes on the global climate. Clim. Dyn. 2004, 23, 279–302. [Google Scholar] [CrossRef]
  7. Lutz, J.A.; Larson, A.J.; Swanson, M.E.; Freund, J.A. Ecological importance of large-diameter trees in a temperate mixed-conifer forest. PLoS ONE 2012, 7, e36131. [Google Scholar] [CrossRef] [PubMed]
  8. Zeng, X.; Evans, M.N.; Liu, X.; Wang, W.; Xu, G.; Wu, G.; Zhang, L. Spatial patterns of precipitation-induced moisture availability and their effects on the divergence of conifer stem growth in the western and eastern parts of China’s semi-arid region. For. Ecol. Manag. 2019, 451, 117524. [Google Scholar] [CrossRef]
  9. Yan, M.-J.; Zhang, J.-G.; He, Q.-Y.; Shi, W.-Y.; Otsuki, K.; Yamanaka, N.; Du, S. Sapflow-based stand transpiration in a semiarid natural oak forest on China’s loess plateau. Forests 2016, 7, 227. [Google Scholar] [CrossRef] [Green Version]
  10. Locosselli, G.M. The cambium activity in a changing world. Trees 2017, 32, 1–2. [Google Scholar] [CrossRef]
  11. Matte Risopatron, J.P.; Sun, Y.; Jones, B.J. The vascular cambium: Molecular control of cellular structure. Protoplasma 2010, 247, 145–161. [Google Scholar] [CrossRef]
  12. Plomion, C.; Leprovost, G.; Stokes, A. Wood formation in trees. Plant Physiol. 2001, 127, 1513–1523. [Google Scholar] [CrossRef]
  13. Dinneny, J.R.; Yanofsky, M.F. Vascular patterning: Xylem or phloem? Curr. Biol. 2004, 14, R112–R114. [Google Scholar] [CrossRef] [PubMed]
  14. Cabon, A. Predicting Forest Responses to Climate: Integrating Water and Temperature Constraints from the Cell to the Region. Doctoral Dissertation, Autonomous University of Barcelona, Cerdanyola del Vallès, Spain, 2020. [Google Scholar]
  15. Petit, G.; Crivellaro, A. Comparative axial widening of phloem and xylem conduits in small woody plants. Trees 2014, 28, 915–921. [Google Scholar] [CrossRef]
  16. Maunoury-Danger, F.; Fresneau, C.; Eglin, T.; Berveiller, D.; Francois, C.; Lelarge-Trouverie, C.; Damesin, C. Impact of carbohydrate supply on stem growth, wood and respired CO2 delta13C: Assessment by experimental girdling. Tree Physiol. 2010, 30, 818–830. [Google Scholar] [CrossRef] [PubMed] [Green Version]
  17. Woodruff, D.R. The impacts of water stress on phloem transport in Douglas-fir trees. Tree Physiol. 2014, 34, 5–14. [Google Scholar] [CrossRef] [PubMed] [Green Version]
  18. Antonova, G.F.; Stasova, V.V. Seasonal development of phloem in scots pine stems. Russ. J. Dev. Biol. 2006, 37, 306–320. [Google Scholar] [CrossRef]
  19. Hölttä, T.; Mencuccini, M.; Nikinmaa, E. Linking phloem function to structure: Analysis with a coupled xylem-phloem transport model. J. Theor. Biol. 2009, 259, 325–337. [Google Scholar] [CrossRef] [Green Version]
  20. Sevanto, S.; Holtta, T.; Holbrook, N.M. Effects of the hydraulic coupling between xylem and phloem on diurnal phloem diameter variation. Plant Cell Environ. 2011, 34, 690–703. [Google Scholar] [CrossRef] [PubMed]
  21. Sevanto, S.; McDowell, N.G.; Dickman, L.T.; Pangle, R.; Pockman, W.T. How do trees die? A test of the hydraulic failure and carbon starvation hypotheses. Plant Cell Environ. 2014, 37, 153–161. [Google Scholar] [CrossRef]
  22. Gričar, J.; Čufar, K. Seasonal dynamics of phloem and xylem formation in silver fir and Norway spruce as affected by drought. Russ. J. Plant Physiol. 2008, 55, 538–543. [Google Scholar] [CrossRef]
  23. Prislan, P.; Gričar, J.; de Luis, M.; Smith, K.T.; Čufar, K. Phenological variation in xylem and phloem formation in Fagus sylvatica from two contrasting sites. Agric. For. Meteorol. 2013, 180, 142–151. [Google Scholar] [CrossRef]
  24. Deslauriers, A.; Fonti, P.; Rossi, S.; Rathgeber, C.B.K.; Gričar, J. Ecophysiology and plasticity of wood and phloem formation. In Dendroecology; Ecological Studies; Springer: Cham, Switzerland, 2017; pp. 13–33. [Google Scholar]
  25. Huang, J.G.; Ma, Q.; Rossi, S.; Biondi, F.; Deslauriers, A.; Fonti, P.; Liang, E.; Makinen, H.; Oberhuber, W.; Rathgeber, C.B.K.; et al. Photoperiod and temperature as dominant environmental drivers triggering secondary growth resumption in Northern Hemisphere conifers. Proc. Natl. Acad. Sci. USA 2020, 117, 20645–20652. [Google Scholar] [CrossRef] [PubMed]
  26. Swidrak, I.; Gruber, A.; Oberhuber, W. Xylem and phloem phenology in co-occurring conifers exposed to drought. Trees 2014, 28, 1161–1171. [Google Scholar] [CrossRef] [PubMed] [Green Version]
  27. Gricar, J.; Prislan, P.; Gryc, V.; Vavrcik, H.; de Luis, M.; Cufar, K. Plastic and locally adapted phenology in cambial seasonality and production of xylem and phloem cells in Picea abies from temperate environments. Tree Physiol. 2014, 34, 869–881. [Google Scholar] [CrossRef] [PubMed] [Green Version]
  28. Cuny, H.E.; Rathgeber, C.B.; Kiesse, T.S.; Hartmann, F.P.; Barbeito, I.; Fournier, M. Generalized additive models reveal the intrinsic complexity of wood formation dynamics. J. Exp. Bot. 2013, 64, 1983–1994. [Google Scholar] [CrossRef] [PubMed] [Green Version]
  29. Alfieri, F.J.; Evert, R.F. Seasonal development of the secondary phloem in Pinus. Am. J. Bot. 1968, 55, 518–528. [Google Scholar] [CrossRef]
  30. Gričar, J.; Zupančič, M.; Čufar, K.; Oven, P. Regular cambial activity and xylem and phloem formation in locally heated and cooled stem portions of Norway spruce. Wood Sci. Technol. 2007, 41, 463–475. [Google Scholar] [CrossRef]
  31. Miller, T.W.; Stangler, D.F.; Larysch, E.; Seifert, T.; Spiecker, H.; Kahle, H.-P. Plasticity of seasonal xylem and phloem production of Norway spruce along an elevational gradient. Trees 2020, 34, 1281–1297. [Google Scholar] [CrossRef]
  32. Gričar, J. Cambial cell production and structure of xylem and phloem as an indicator of tree vitality: A review. Sustain. For. Manag. Curr. Res. 2012, 111–134. [Google Scholar]
  33. Fink, S. Microscopical investigations on wood formation and function in diseased trees. IAWA J. 1986, 7, 351–355. [Google Scholar] [CrossRef]
  34. Gričar, J.; Krže, L.; Čufar, K. Number of cells in xylem, phloem and dormant cambium in silver fir (Abies alba), in trees of different vitality. IAWA J. 2009, 30, 121–133. [Google Scholar] [CrossRef] [Green Version]
  35. Cuny, H.E.; Rathgeber, C.B.K.; Frank, D.; Fonti, P.; Makinen, H.; Prislan, P.; Rossi, S.; del Castillo, E.M.; Campelo, F.; Vavrcik, H.; et al. Woody biomass production lags stem-girth increase by over one month in coniferous forests. Nat. Plants 2015, 1, 15160. [Google Scholar] [CrossRef]
  36. Cuny, H.E.; Rathgeber, C.B. Xylogenesis: Coniferous trees of temperate forests are listening to the climate tale during the growing season but only remember the last words! Plant Physiol. 2016, 171, 306–317. [Google Scholar] [CrossRef] [Green Version]
  37. Balducci, L.; Cuny, H.E.; Rathgeber, C.B.; Deslauriers, A.; Giovannelli, A.; Rossi, S. Compensatory mechanisms mitigate the effect of warming and drought on wood formation. Plant Cell Environ. 2016, 39, 1338–1352. [Google Scholar] [CrossRef]
  38. Begum, S.; Kudo, K.; Matsuoka, Y.; Nakaba, S.; Yamagishi, Y.; Nabeshima, E.; Rahman, M.H.; Nugroho, W.D.; Oribe, Y.; Jin, H.O.; et al. Localized cooling of stems induces latewood formation and cambial dormancy during seasons of active cambium in conifers. Ann. Bot. 2016, 117, 465–477. [Google Scholar] [CrossRef] [Green Version]
  39. Treml, V.; Kašpar, J.; Kuželová, H.; Gryc, V. Differences in intra-annual wood formation in Picea abies across the treeline ecotone, Giant Mountains, Czech Republic. Trees 2015, 29, 515–526. [Google Scholar] [CrossRef]
  40. Ponti, F.; Minotta, G.; Cantoni, L.; Bagnaresi, U. Fine root dynamics of pedunculate oak and narrow-leaved ash in a mixed-hardwood plantation in clay soils. Plant Soil 2004, 259, 39–49. [Google Scholar] [CrossRef]
  41. Tierney, G.L.; Fahey, T.J.; Groffman, P.M.; Hardy, J.P.; Fitzhugh, R.D.; Driscoll, C.T. Soil freezing alters fine root dynamics in a northern hardwood forest. Biogeochemistry 2001, 56, 175–190. [Google Scholar] [CrossRef]
  42. Zimmermann, M.H. Effect of low temperature on ascent of sap in trees. Plant Physiol. 1964, 39, 568–572. [Google Scholar] [CrossRef] [Green Version]
  43. Urban, J.; Ingwers, M.; McGuire, M.A.; Teskey, R.O. Stomatal conductance increases with rising temperature. Plant Signal Behav. 2017, 12, e1356534. [Google Scholar] [CrossRef] [PubMed] [Green Version]
  44. Alvarez-Uria, P.; Körner, C. Low temperature limits of root growth in deciduous and evergreen temperate tree species. Funct. Ecol. 2007, 21, 211–218. [Google Scholar] [CrossRef]
  45. Repo, T.; Mononen, K.; Alvila, L.; Pakkanen, T.T.; Hänninen, H. Cold acclimation of pedunculate oak (Quercus robur L.) at its northernmost distribution range. Environ. Exp. Bot. 2008, 63, 59–70. [Google Scholar] [CrossRef]
  46. Aloni, R.; Aloni, E.; Langhans, M.; Ullrich, C.I. Role of cytokinin and auxin in shaping root architecture: Regulating vascular differentiation, lateral root initiation, root apical dominance and root gravitropism. Ann. Bot. 2006, 97, 883–893. [Google Scholar] [CrossRef]
  47. Immanen, J.; Nieminen, K.; Smolander, O.P.; Kojima, M.; Alonso Serra, J.; Koskinen, P.; Zhang, J.; Elo, A.; Mahonen, A.P.; Street, N.; et al. Cytokinin and auxin display distinct but interconnected distribution and signaling profiles to stimulate cambial activity. Curr. Biol. 2016, 26, 1990–1997. [Google Scholar] [CrossRef] [Green Version]
  48. Zhao, Z.; Andersen, S.U.; Ljung, K.; Dolezal, K.; Miotk, A.; Schultheiss, S.J.; Lohmann, J.U. Hormonal control of the shoot stem-cell niche. Nature 2010, 465, 1089–1092. [Google Scholar] [CrossRef]
  49. Sperling, O.; Kamai, T.; Tixier, A.; Davidson, A.; Jarvis-Shean, K.; Raveh, E.; DeJong, T.M.; Zwieniecki, M.A. Predicting bloom dates by temperature mediated kinetics of carbohydrate metabolism in deciduous trees. Agric. For. Meteorol. 2019, 276–277, 107643. [Google Scholar] [CrossRef]
  50. Deslauriers, A.; Morin, H. Intra-annual tracheid production in balsam fir stems and the effect of meteorological variables. Trees 2005, 19, 402–408. [Google Scholar] [CrossRef] [Green Version]
  51. Rossi, S.; Deslauriers, A.; Anfodillo, T.; Carraro, V. Evidence of threshold temperatures for xylogenesis in conifers at high altitudes. Oecologia 2007, 152, 1–12. [Google Scholar] [CrossRef]
  52. Li, X.; Liang, E.; Gričar, J.; Rossi, S.; Čufar, K.; Ellison, A.M. Critical minimum temperature limits xylogenesis and maintains treelines on the southeastern Tibetan Plateau. Sci. Bull. 2017, 62, 804–812. [Google Scholar] [CrossRef] [Green Version]
  53. Guada, G.; Vázquez-Ruiz, R.A.; García-González, I. Response patterns of xylem and leaf phenology to temperature at the southwestern distribution boundary of Quercus robur: A multi-spatial study. Agric. For. Meteorol. 2019, 269–270, 46–56. [Google Scholar] [CrossRef]
  54. Rossi, S.; Anfodillo, T.; Cufar, K.; Cuny, H.E.; Deslauriers, A.; Fonti, P.; Frank, D.; Gricar, J.; Gruber, A.; King, G.M.; et al. A meta-analysis of cambium phenology and growth: Linear and non-linear patterns in conifers of the northern hemisphere. Ann. Bot. 2013, 112, 1911–1920. [Google Scholar] [CrossRef] [PubMed]
  55. Deslauriers, A.; Rossi, S.; Anfodillo, T.; Saracino, A. Cambial phenology, wood formation and temperature thresholds in two contrasting years at high altitude in southern Italy. Tree Physiol. 2008, 28, 863–871. [Google Scholar] [CrossRef] [PubMed] [Green Version]
  56. Rahman, M.H.; Nugroho, W.D.; Nakaba, S.; Kitin, P.; Kudo, K.; Yamagishi, Y.; Begum, S.; Marsoem, S.N.; Funada, R. Changes in cambial activity are related to precipitation patterns in four tropical hardwood species grown in Indonesia. Am. J. Bot. 2019, 106, 760–771. [Google Scholar] [CrossRef] [PubMed]
  57. Ren, P.; Rossi, S.; Camarero, J.J.; Ellison, A.M.; Liang, E.; Penuelas, J. Critical temperature and precipitation thresholds for the onset of xylogenesis of Juniperus przewalskii in a semi-arid area of the north-eastern Tibetan Plateau. Ann. Bot. 2018, 121, 617–624. [Google Scholar] [CrossRef] [PubMed]
  58. Ren, P.; Rossi, S.; Gricar, J.; Liang, E.; Cufar, K. Is precipitation a trigger for the onset of xylogenesis in Juniperus przewalskii on the north-eastern Tibetan Plateau? Ann. Bot. 2015, 115, 629–639. [Google Scholar] [CrossRef] [Green Version]
  59. Schuster, R.; Oberhuber, W. Drought sensitivity of three co-occurring conifers within a dry inner Alpine environment. Trees 2013, 27, 61–69. [Google Scholar] [CrossRef] [Green Version]
  60. Larcher, W. Physiological Plant Ecology. Ecophysiology and Stress Physiology of Functional Groups, 4th ed.; Springer: Berlin/Heidelberg, Germany, 2003. [Google Scholar]
  61. Gričar, J.; Prislan, P.; de Luis, M.; Gryc, V.; Hacurová, J.; Vavrčík, H.; Čufar, K. Plasticity in variation of xylem and phloem cell characteristics of Norway spruce under different local conditions. Front. Plant Sci. 2015, 6, 730. [Google Scholar] [CrossRef] [Green Version]
  62. Liang, H.; Jiang, S.; Muhammad, A.; Kang, J.; Zhu, H.; Li, X.; Chen, L.; Zhu, L.; Huang, J.-G. Radial growth response of Picea crassifolia to climatic conditions in a dryland forest ecosystem in northwest China. Forests 2021, 12, 1382. [Google Scholar] [CrossRef]
  63. Rossi, S.; Anfodillo, T.; Menardi, R. Trephor: A new tool for sampling microcores from tree stems. IAWA J. 2006, 27, 89–97. [Google Scholar] [CrossRef] [Green Version]
  64. Zhang, S.; Huang, J.G.; Rossi, S.; Ma, Q.; Yu, B.; Zhai, L.; Luo, D.; Guo, X.; Fu, S.; Zhang, W. Intra-annual dynamics of xylem growth in Pinus massoniana submitted to an experimental nitrogen addition in Central China. Tree Physiol. 2017, 37, 1546–1553. [Google Scholar] [CrossRef] [Green Version]
  65. Abe, H.; Funada, R.; Ohtani, J.; Fukazawa, K. Changes in the arrangement of cellulose microfibrils associated with the cessation of cell expansion in tracheids. Trees 1997, 11, 328–332. [Google Scholar] [CrossRef]
  66. Deslauriers, A.; Giovannelli, A.; Rossi, S.; Castro, G.; Fragnelli, G.; Traversi, L. Intra-annual cambial activity and carbon availability in stem of poplar. Tree Physiol. 2009, 29, 1223–1235. [Google Scholar] [CrossRef] [PubMed] [Green Version]
  67. Rathgeber, C.B.K.; Longuetaud, F.; Mothe, F.; Cuny, H.; Le Moguédec, G. Phenology of wood formation: Data processing, analysis and visualisation using R (package CAVIAR). Dendrochronologia 2011, 29, 139–149. [Google Scholar] [CrossRef]
  68. Deslauriers, A.; Morin, H.; Begin, Y. Cellular phenology of annual ring formation of Abies balsamea in the Quebec boreal forest (Canada). Can. J. For. Res. 2003, 33, 190–200. [Google Scholar] [CrossRef] [Green Version]
  69. Rossi, S.; Deslauriers, A.; Morin, H. Application of the Gompertz equation for the study of xylem cell development. Dendrochronologia 2003, 21, 33–39. [Google Scholar] [CrossRef]
  70. Wood, S. Generalized Additive Models: An Introduction with R; CRC Press: Boca Raton, FL, USA, 2017. [Google Scholar]
  71. Winter, B. Linear Models and Linear Mixed Effects Models in R with Linguistic Applications. arXiv 2013, arXiv:1308.5499. [Google Scholar]
  72. Antonova, G.F.; Stasova, V.V. Effects of environmental factors on wood formation in larch (Larix sibirica Ldb.) stems. Trees 1997, 11, 462–468. [Google Scholar] [CrossRef]
  73. Zhang, Y.; Xu, J.; Su, W.; Zhao, X.; Xu, X. Spring precipitation effects on formation of first row of earlywood vessels in Quercus variabilis at Qinling Mountain (China). Trees 2019, 33, 457–468. [Google Scholar] [CrossRef]
  74. Krabel, D.; Roloff, A.; Bodson, M. Influence of sucrose on seasonal cambial growth. J. Exp. Bot. 1999, 50, 25–26. [Google Scholar]
  75. Patrick, L.; Cable, J.; Potts, D.; Ignace, D.; Barron-Gafford, G.; Griffith, A.; Alpert, H.; Van Gestel, N.; Robertson, T.; Huxman, T.E.; et al. Effects of an increase in summer precipitation on leaf, soil, and ecosystem fluxes of CO2 and H2O in a sotol grassland in Big Bend National Park, Texas. Oecologia 2007, 151, 704–718. [Google Scholar] [CrossRef] [PubMed]
  76. Gricar, J.; Zavadlav, S.; Jyske, T.; Lavric, M.; Laakso, T.; Hafner, P.; Eler, K.; Vodnik, D. Effect of soil water availability on intra-annual xylem and phloem formation and non-structural carbohydrate pools in stem of Quercus pubescens. Tree Physiol. 2019, 39, 222–233. [Google Scholar] [CrossRef] [PubMed]
  77. Deslauriers, A.; Huang, J.G.; Balducci, L.; Beaulieu, M.; Rossi, S. The contribution of carbon and water in modulating wood formation in black spruce saplings. Plant Physiol. 2016, 170, 2072–2084. [Google Scholar] [CrossRef] [PubMed] [Green Version]
  78. Myburg, A.A.; Sederoff, R.R. Xylem structure and function. Encycl. Life Sci. 2001, 1–8. [Google Scholar] [CrossRef]
  79. Turcotte, A.; Morin, H.; Krause, C.; Deslauriers, A.; Thibeault-Martel, M. The timing of spring rehydration and its relation with the onset of wood formation in black spruce. Agric. For. Meteorol. 2009, 149, 1403–1409. [Google Scholar] [CrossRef]
  80. Steppe, K.; Sterck, F.; Deslauriers, A. Diel growth dynamics in tree stems: Linking anatomy and ecophysiology. Trends Plant Sci. 2015, 20, 335–343. [Google Scholar] [CrossRef] [Green Version]
  81. Lockhart, J. An analysis of irreversible plant cell elongation. J. Theor. Biol. 1965, 8, 264–275. [Google Scholar] [CrossRef]
  82. Allen, C.D.; Breshears, D.D.; McDowell, N.G. On underestimation of global vulnerability to tree mortality and forest die-off from hotter drought in the Anthropocene. Ecosphere 2015, 6, 129. [Google Scholar] [CrossRef]
  83. Vicente-Serrano, S.M.; Lopez-Moreno, J.-I.; Beguería, S.; Lorenzo-Lacruz, J.; Sanchez-Lorenzo, A.; García-Ruiz, J.M.; Azorin-Molina, C.; Morán-Tejeda, E.; Revuelto, J.; Trigo, R.; et al. Evidence of increasing drought severity caused by temperature rise in southern Europe. Environ. Res. Lett. 2014, 9, 044001. [Google Scholar] [CrossRef]
  84. Begum, S.; Nakaba, S.; Yamagishi, Y.; Oribe, Y.; Funada, R. Regulation of cambial activity in relation to environmental conditions: Understanding the role of temperature in wood formation of trees. Physiol. Plant 2013, 147, 46–54. [Google Scholar] [CrossRef]
  85. Begum, S.; Nakaba, S.; Oribe, Y.; Kubo, T.; Funada, R. Cambial sensitivity to rising temperatures by natural condition and artificial heating from late winter to early spring in the evergreen conifer Cryptomeria japonica. Trees 2010, 24, 43–52. [Google Scholar] [CrossRef]
  86. Eilmann, B.; Zweifel, R.; Buchmann, N.; Graf Pannatier, E.; Rigling, A. Drought alters timing, quantity, and quality of wood formation in Scots pine. J. Exp. Bot. 2011, 62, 2763–2771. [Google Scholar] [CrossRef] [PubMed] [Green Version]
  87. Baker, D.A.; Milburn, J.A. Transport of Photoassimriates; Longman Scientific &Technical: Harlow, UK, 1989. [Google Scholar]
Figure 1. The radial anatomical structure of a growing tree ring of Picea crassifolia. Cc represents cambial cells; Ec, Wc, and Mc are xylem cells on various stages of differentiation, representing enlarging, wall thickening, and mature cells, respectively. EP, LP, and PP represent early phloem, late phloem, and previous-year phloem sieve cells, respectively.
Forests 12 01445 g001
Figure 2. Monthly 2019 climate data monitored by the weather stations nearest to the sampling sites in Helanshan and Luoshan in northwest China. Values in (AC) are presented as the daily maximum temperature (A), mean daily temperature (B), and daily minimum temperature (C) in the corresponding month; values in (D) are pre-sented as the monthly accumulated precipitation.
Forests 12 01445 g002
Figure 3. Dynamics and fitting curves of cambium activity (A) and xylem and phloem formation (BI) of Picea crassifolia in Helanshan and Luoshan in 2019. Values are presented as the mean values (computed by averaging the measured data along three radial files per sample) of sampled trees at each sampling date. Smoothed lines in (AC,GI) were drawn using Generalized additive models (GAMs) and Gompertz functions, respectively.
Forests 12 01445 g003
Figure 4. Biological parameters of xylem and phloem formation computed from generalized additive models (GAMs). Ec, Wt, LP, and Pc are the enlarging, wall thickening, late phloem, and total phloem cells, respectively. TPmax (A,B) is the date that Pmax appeared; t5 (C) and t95 (D) represent the first date for 5% of maximum production and 95% of maximum production, respectively; Dt90 (E) is the duration between 5% and 95% of the maximum produced; Trmax (A,F) is the date maximal growth rate appeared; rmax (G) is the maximum growth rate computed from the first derivative of fitted GAM and Pmax (H) is the maximum predicted cell production. Values are presented as mean ± SD. *, **, ***, ****, and ns represent significant levels at p < 0.05, p < 0.01, p < 0.001, p < 0.0001, and p > 0.05, respectively.
Forests 12 01445 g004
Figure 5. Biological parameters of xylem and phloem formation computed from Gompertz equations. Mc, Xc, and EP are the mature, total xylem, and early phloem cells, respectively. Parameter a (A) is the upper asymptote of the final number of cells; b (B) is the x-axis placement parameter reflecting the location of the origin; k (C) is the growth rate parameter determining the spread of the curve along the time axis; t5 (D) is the date at which 5% of the cells were produced; tip (E) is the date of the inflection point; t95 (F) is the date at which 95% of the cells were produced; Dt90 (G) is the duration between 5 and 95% of the produced cells; rmax (H) is the maximal growth rate and r90 (I) is the mean growth rate computed between 5 and 95% of the produced cells. Values are presented as mean ± SD. *, **, ***, and ns represent significant levels at p < 0.05, p < 0.01, p < 0.001, and p > 0.05, respectively.
Forests 12 01445 g005
Table 1. Sampling sites and diameter at breast height (DBH) of sampled trees.
SiteLongitude (°)Latitude (°)Altitude (m)DBH (cm)
Helanshan105°54′03″38°46′25″218735.29 ± 3.62 a
Luoshan106°16′56″37°18′18″247931.55 ± 4.87 a
Note: DBH values are presented as mean ± SD. Different letters denote significant differences (p < 0.05) between sites based on one-way ANOVA.
Table 2. Comparison of the critical timings of xylem formation for Picea crassifolia in Helanshan and Luoshan in 2019. bE, bL, and bM represent the beginning of cell enlarging, cell wall thickening, and mature phase, respectively; cE and cL represent the cessation of cell enlarging and cell wall thickening phase, respectively; dE, dL, and dX represent the duration of cell enlarging and maturing phase, and the total duration of xylogenesis, respectively.
Critical TimingsEstimateStd. Errort-Valuep-Value
bE−11.362.11−5.370.001
bL−6.581.77−3.710.008
bM−3.262.13−1.530.169
cE13.763.803.620.009
cL4.634.850.960.371
dE25.115.104.920.002
dL11.264.432.540.039
dX15.925.652.820.026
Note: Linear hypothesis: Luoshan–Helanshan = 0.
Table 3. Mixed-effects model and ANOVA results showing the effects of different sites (Site), periods (T), and their interactive effects on the xylem and phloem formation of Picea crassifolia.
VariablesSource of VariationF-Valuep-Value
Cambial cellsSite30.76<0.0001
T5.230.006
Site × T2.490.084
Enlarging cellsSite3.030.082
T6.340.002
Site × T118.56<0.0001
Wall thickening cellsSite1.930.165
T23.53<0.0001
Site × T16.61<0.0001
Mature cellsSite0.620.433
T18.91<0.0001
Site × T36.74<0.0001
Xylem cellsSite2.230.136
T204.53<0.0001
Site × T6.350.002
Early phloem cellsSite25.77<0.0001
T10.28<0.0001
Site × T108.75<0.0001
Late phloem cellsSite9.400.002
T198.67<0.0001
Site × T14.30<0.0001
Phloem cellsSite3.050.080
T18.21<0.0001
Site × T85.60<0.0001
Table 4. Comparison of the intra-annual xylem and phloem formation of Picea crassifolia between sampling sites using linear mixed-effects models.
VariablesTime PeriodEstimateStd. Errort-Valuep-Value
Cambial cellsApril–May0.450.500.910.366
June–August1.190.333.60<0.001
September–November0.410.271.500.134
Enlarging cellsApril–May−5.510.41−13.48<0.0001
June–August2.810.594.77<0.0001
Wall thickening cellsApril–May−5.790.49−11.78<0.0001
June–August3.531.282.750.006
Mature cellsApril–May0.030.080.400.690
June–August−25.984.09−6.35<0.0001
September–November10.893.633.000.003
Xylem cellsApril–May−12.720.65−19.64<0.0001
June–August−3.783.75−1.010.313
September–November10.893.633.000.003
Early phloem cellsApril–May−4.130.16−25.20<0.0001
June–August0.180.091.980.048
Late phloem cellsJune–August0.310.430.730.464
September–November2.120.474.52<0.0001
Phloem cellsApril–May−4.880.18−27.07<0.0001
June–August0.510.451.120.264
September–November2.800.485.81<0.0001
Note: Linear hypothesis: Luoshan–Helanshan = 0.
Table 5. Significant relationships between xylem and phloem formation of Picea crassifolia at Helanshan and Luoshan in Ningxia, China.
SiteDependent VariableFixed EffectEstimateStd. Errort-Valuep-Value
HelanshancLtipEP−2.170.85−2.540.035
cLt95EP−0.920.35−2.590.032
dLTipEP−2.370.81−2.910.020
dLt95EP−0.900.37−2.420.042
dX95EP−1.290.45−2.840.022
LuoshanbErmaxLP−477.18168.14−2.840.030
bEr90LP−511.05152.69−3.350.015
bLt5EP0.490.192.560.043
bLTipEP0.630.242.670.037
bLPmaxLP−2.961.03−2.870.029
bMTipEP0.660.183.610.011
cLTrmaxLP0.980.342.850.029
Note: Estimate is the difference between the xylem and the phloem growth parameters from the linear mixed-effects model. Subscript EP and LP represent early and late phloem, respectively.
Publisher’s Note: MDPI stays neutral with regard to jurisdictional claims in published maps and institutional affiliations.

