
Shifts in Forest Species Composition and Abundance under Climate Change Scenarios in Southern Carpathian Romanian Temperate Forests

 ,
,  , and
, and 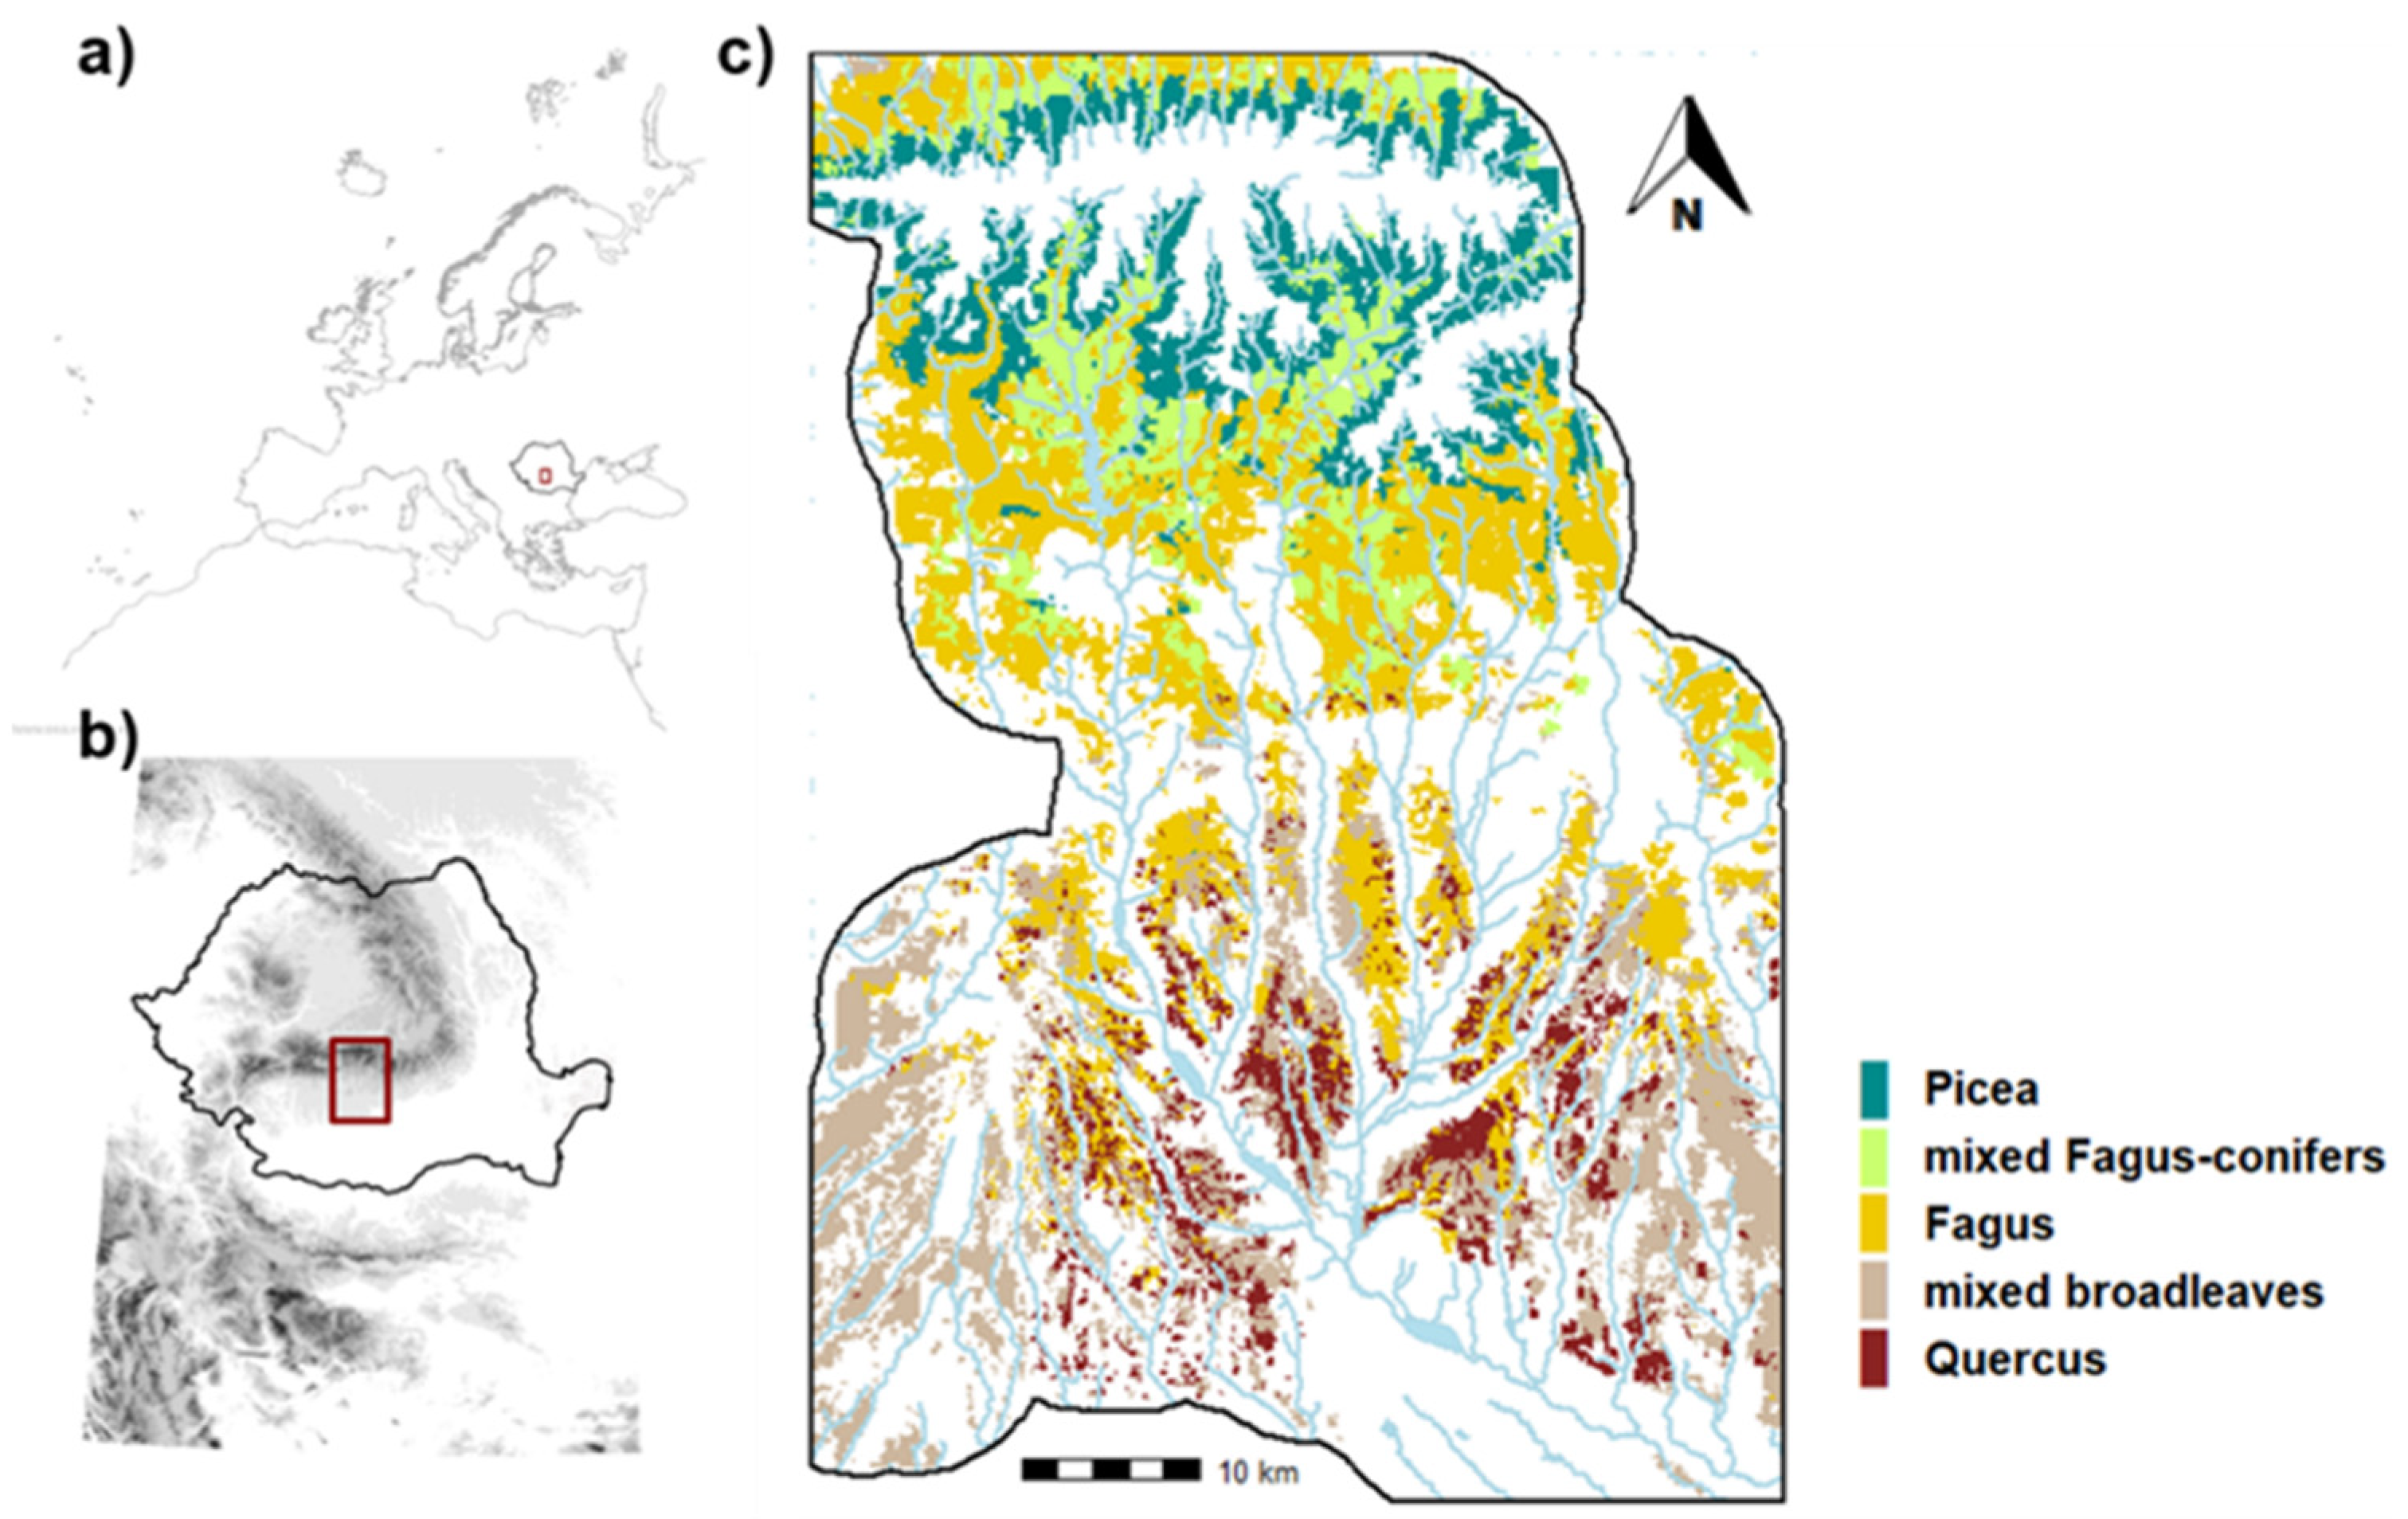
Abstract
1. Introduction
2. Materials and Methods
2.1. Study Area
2.2. Landis-II Model
2.3. Landscape Design: Ecoregions and Forest Communities
2.4. LANDIS-II Parameterization
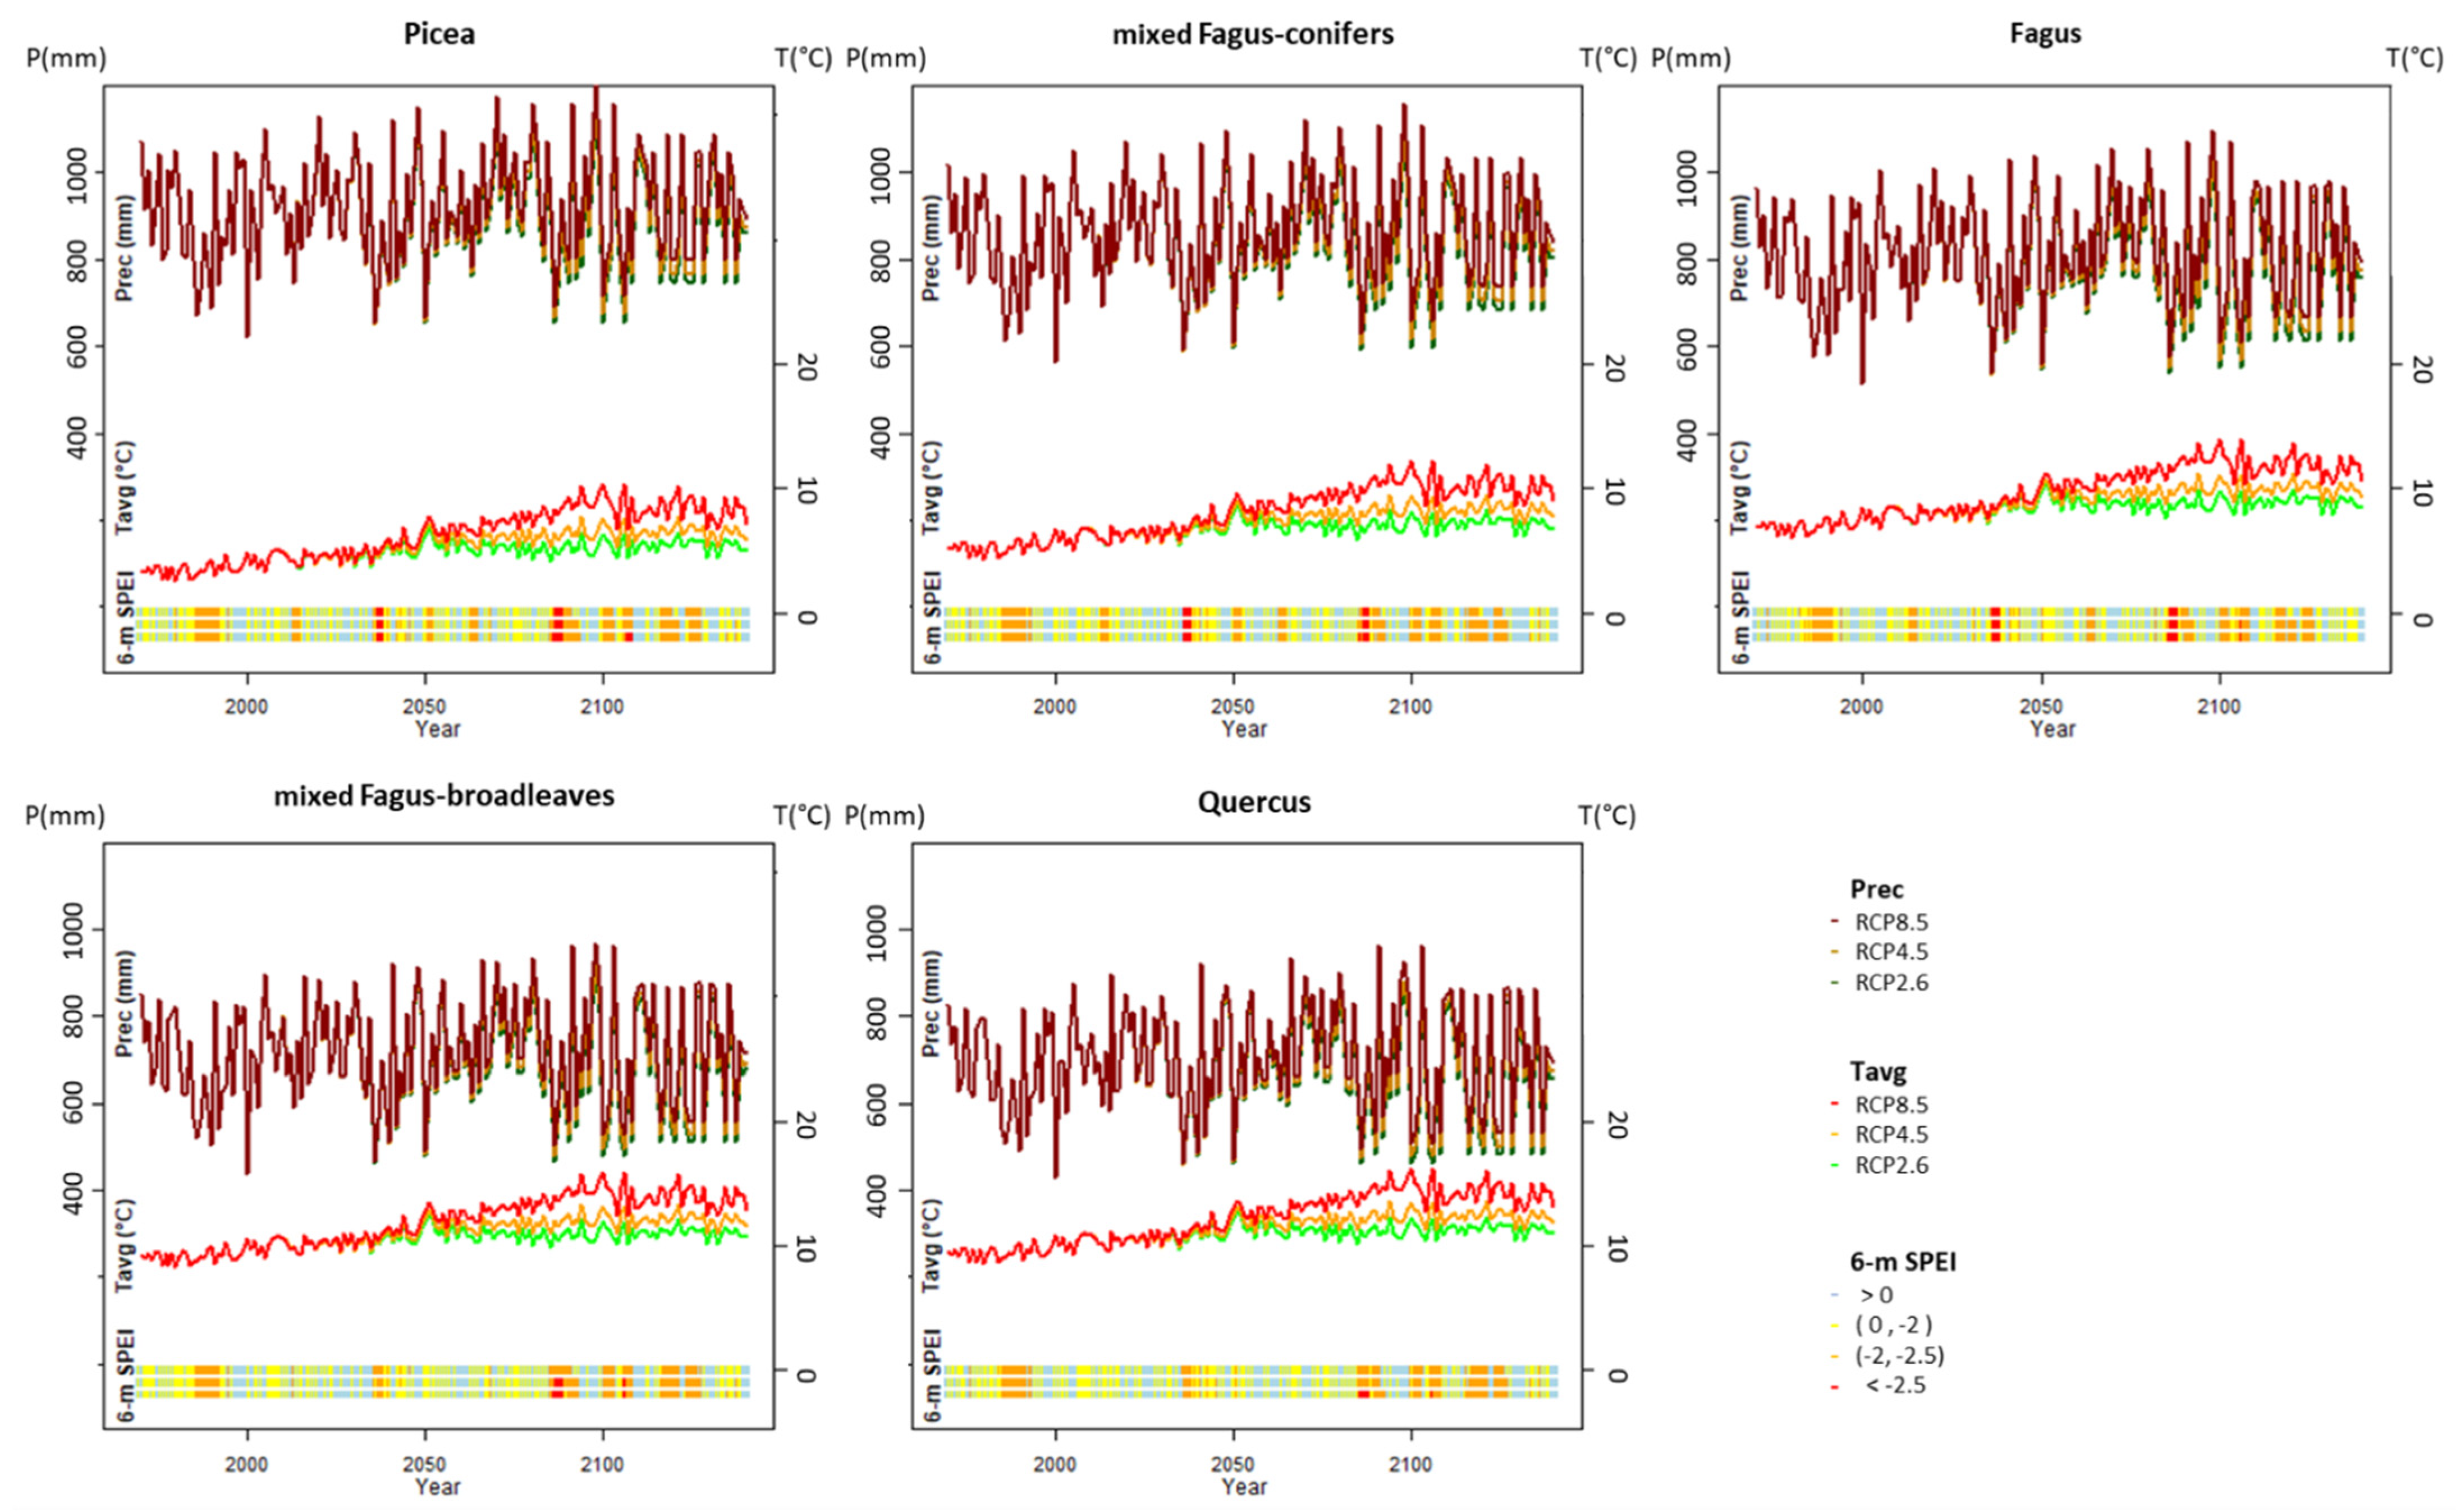
2.5. Climate Change Scenarios
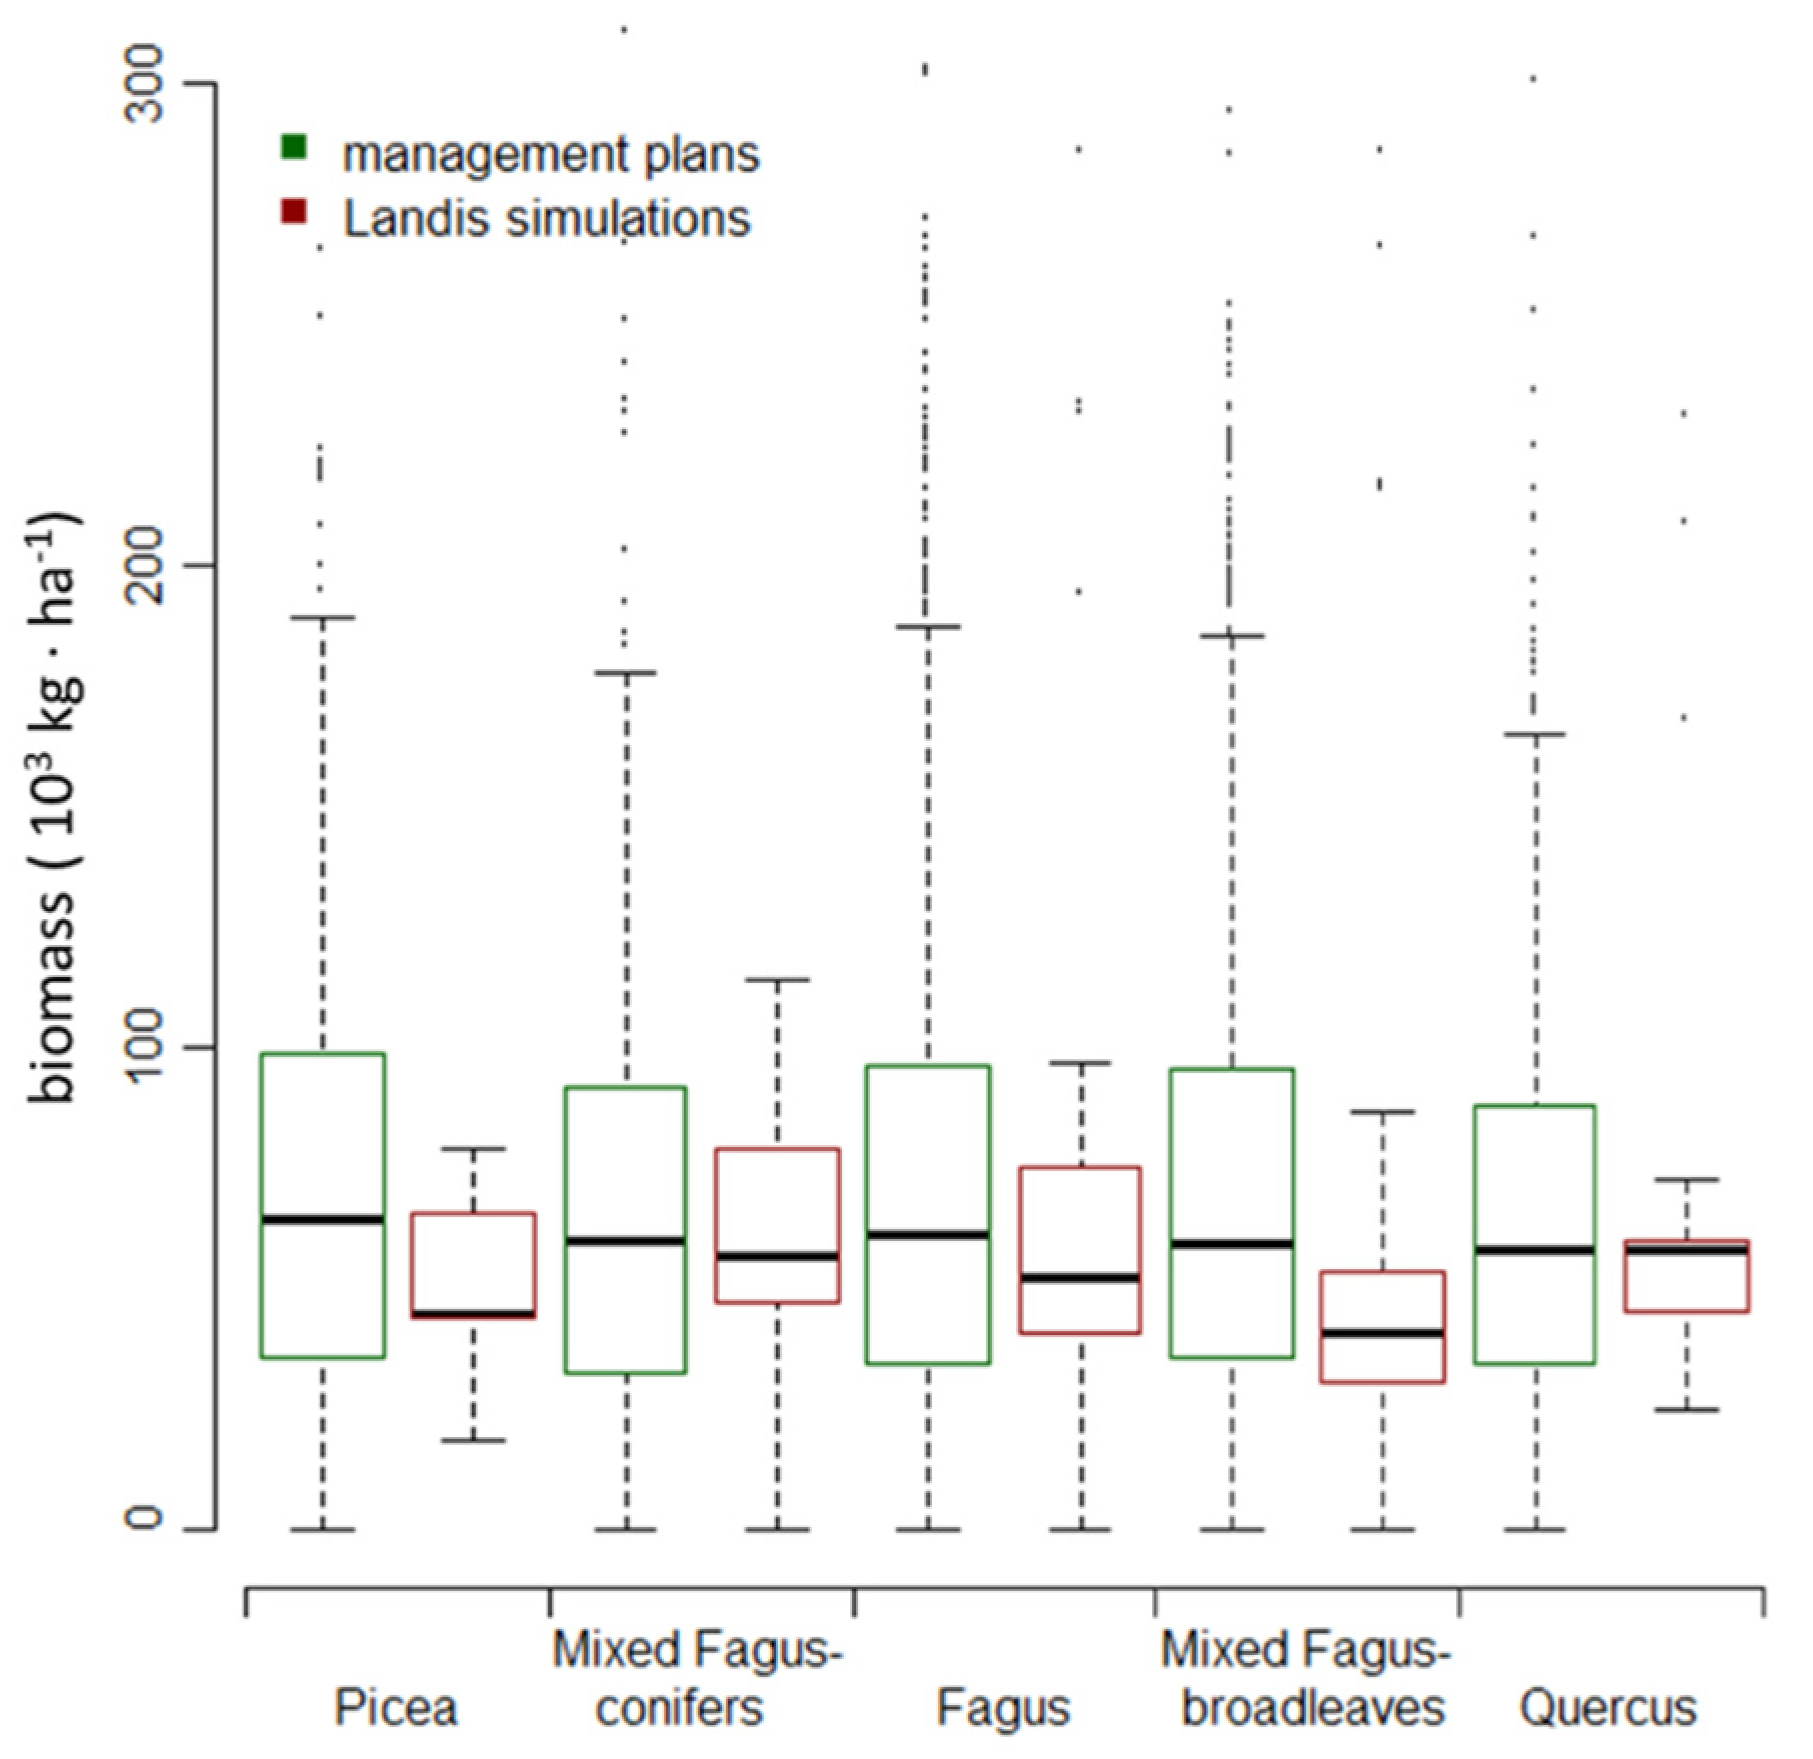
2.6. Model Output and Validation
2.7. Statistical Analysis
3. Results
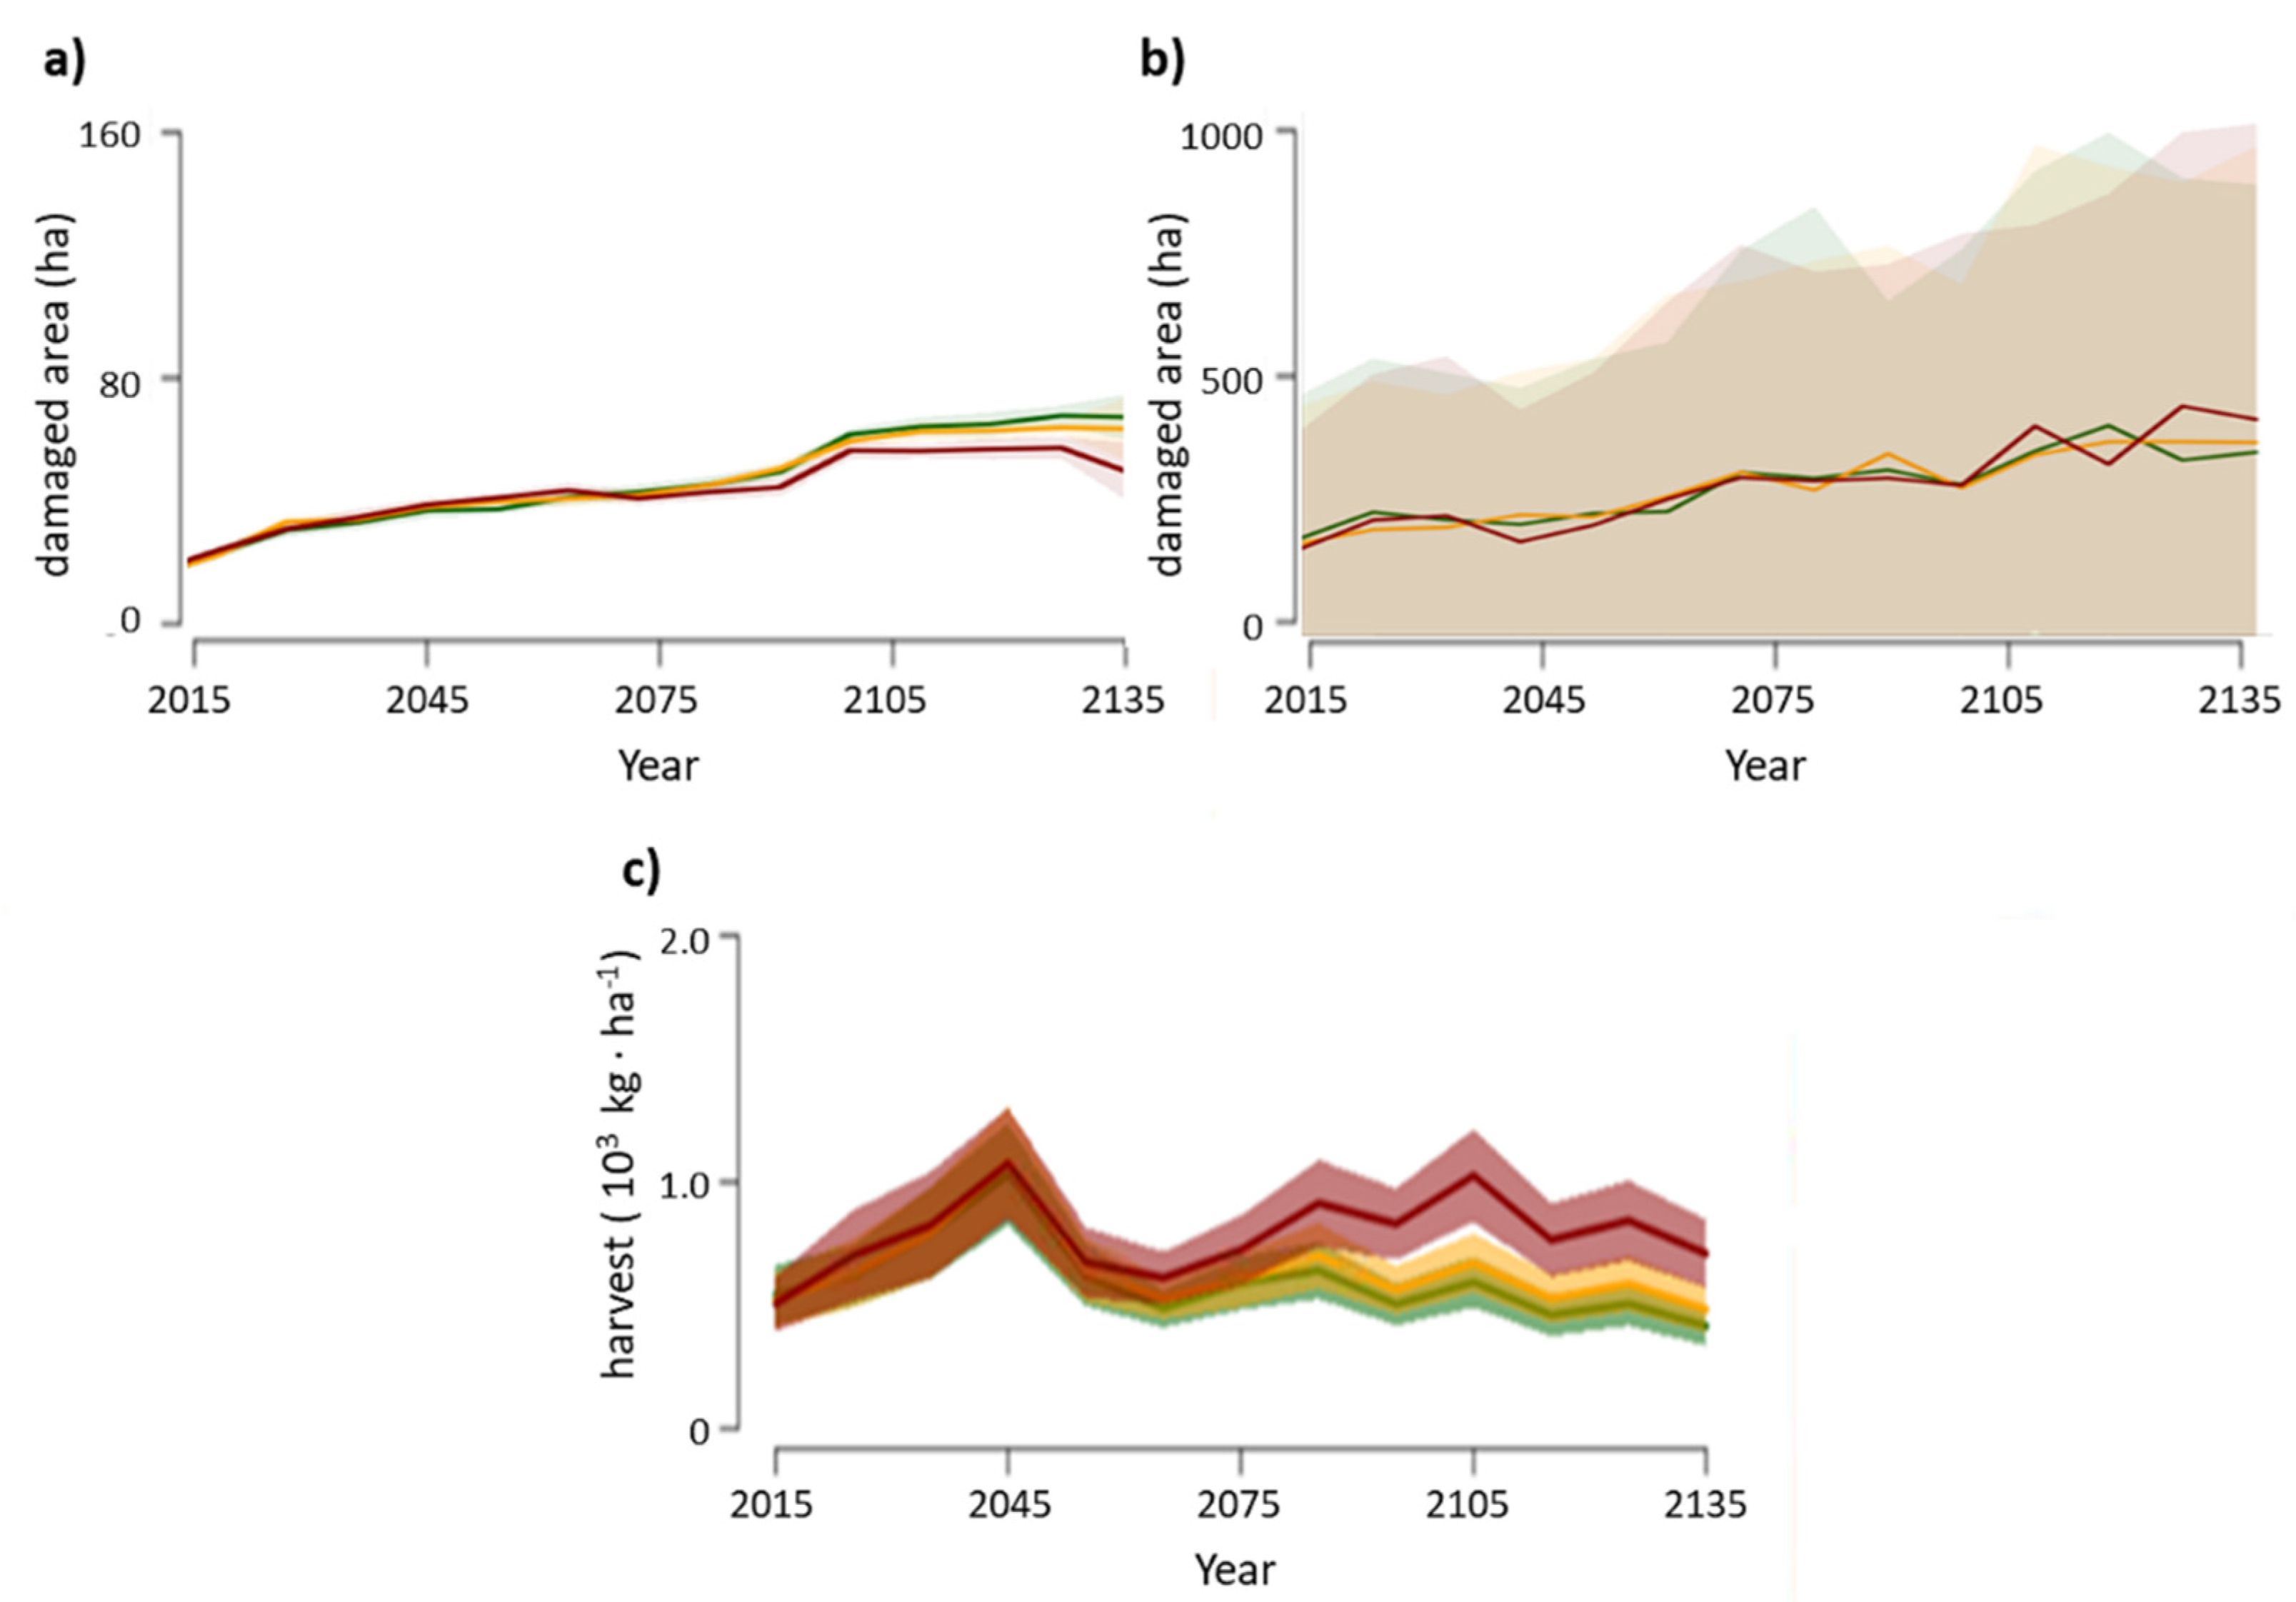
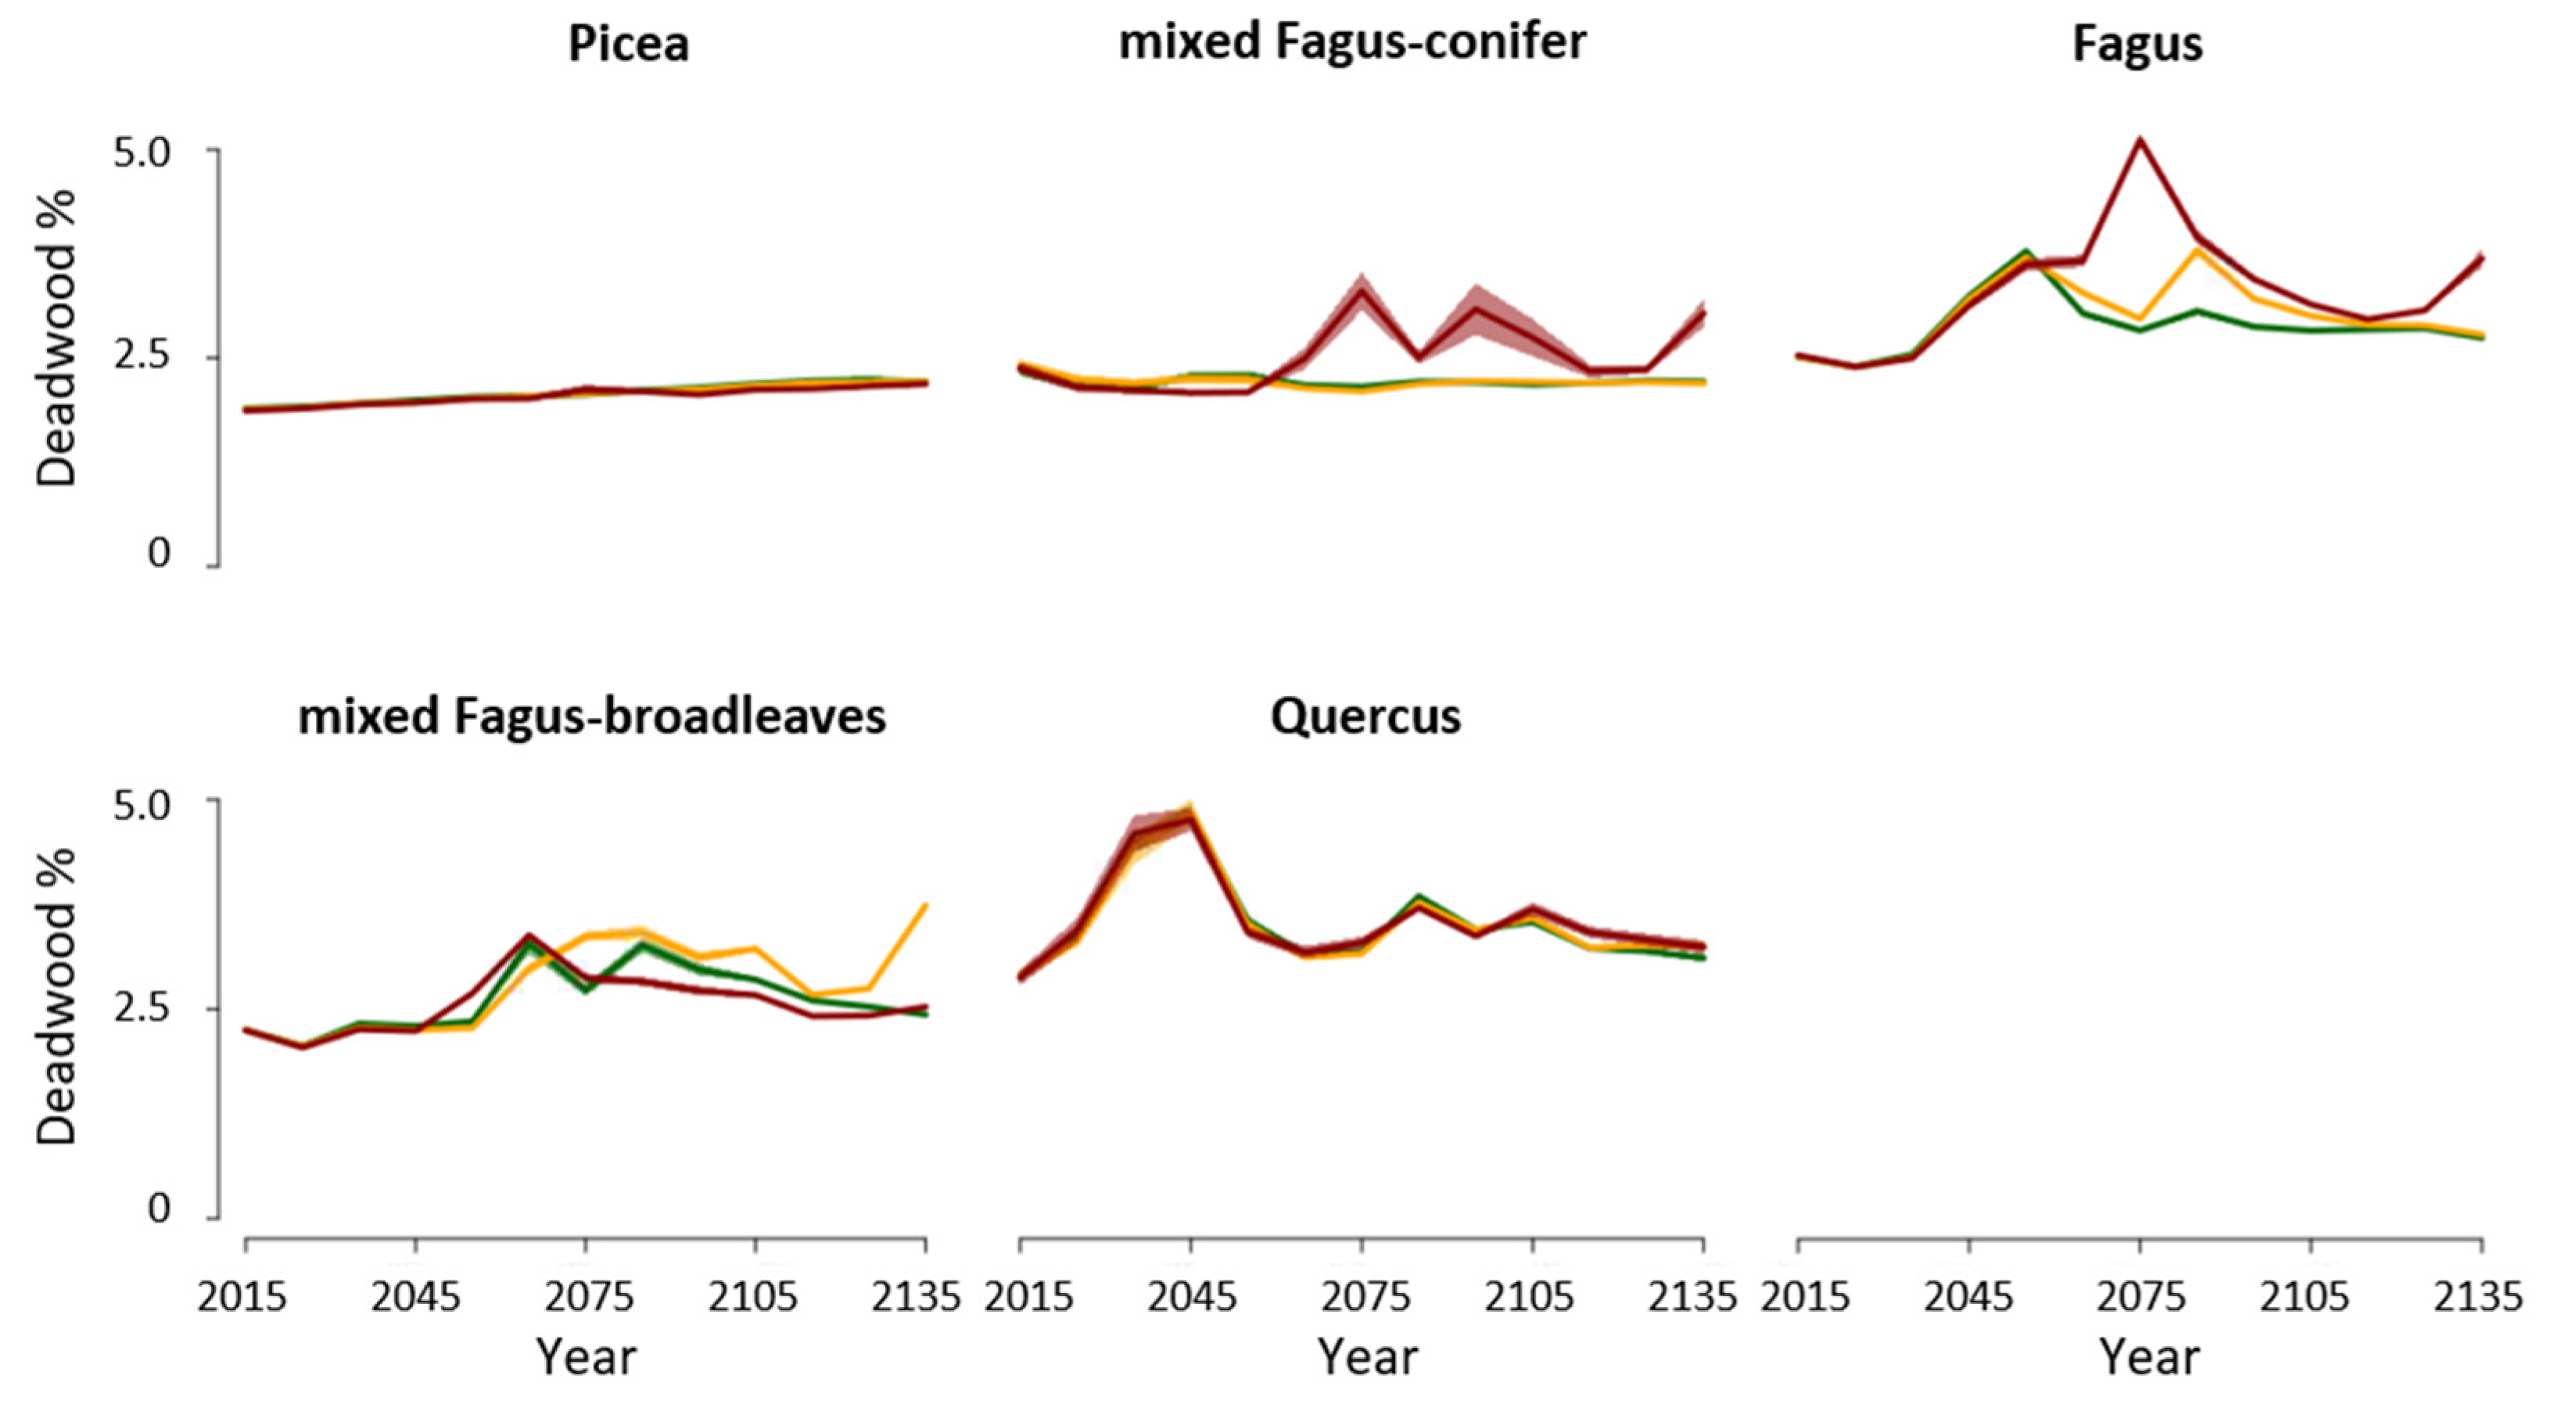
3.1. Disturbances
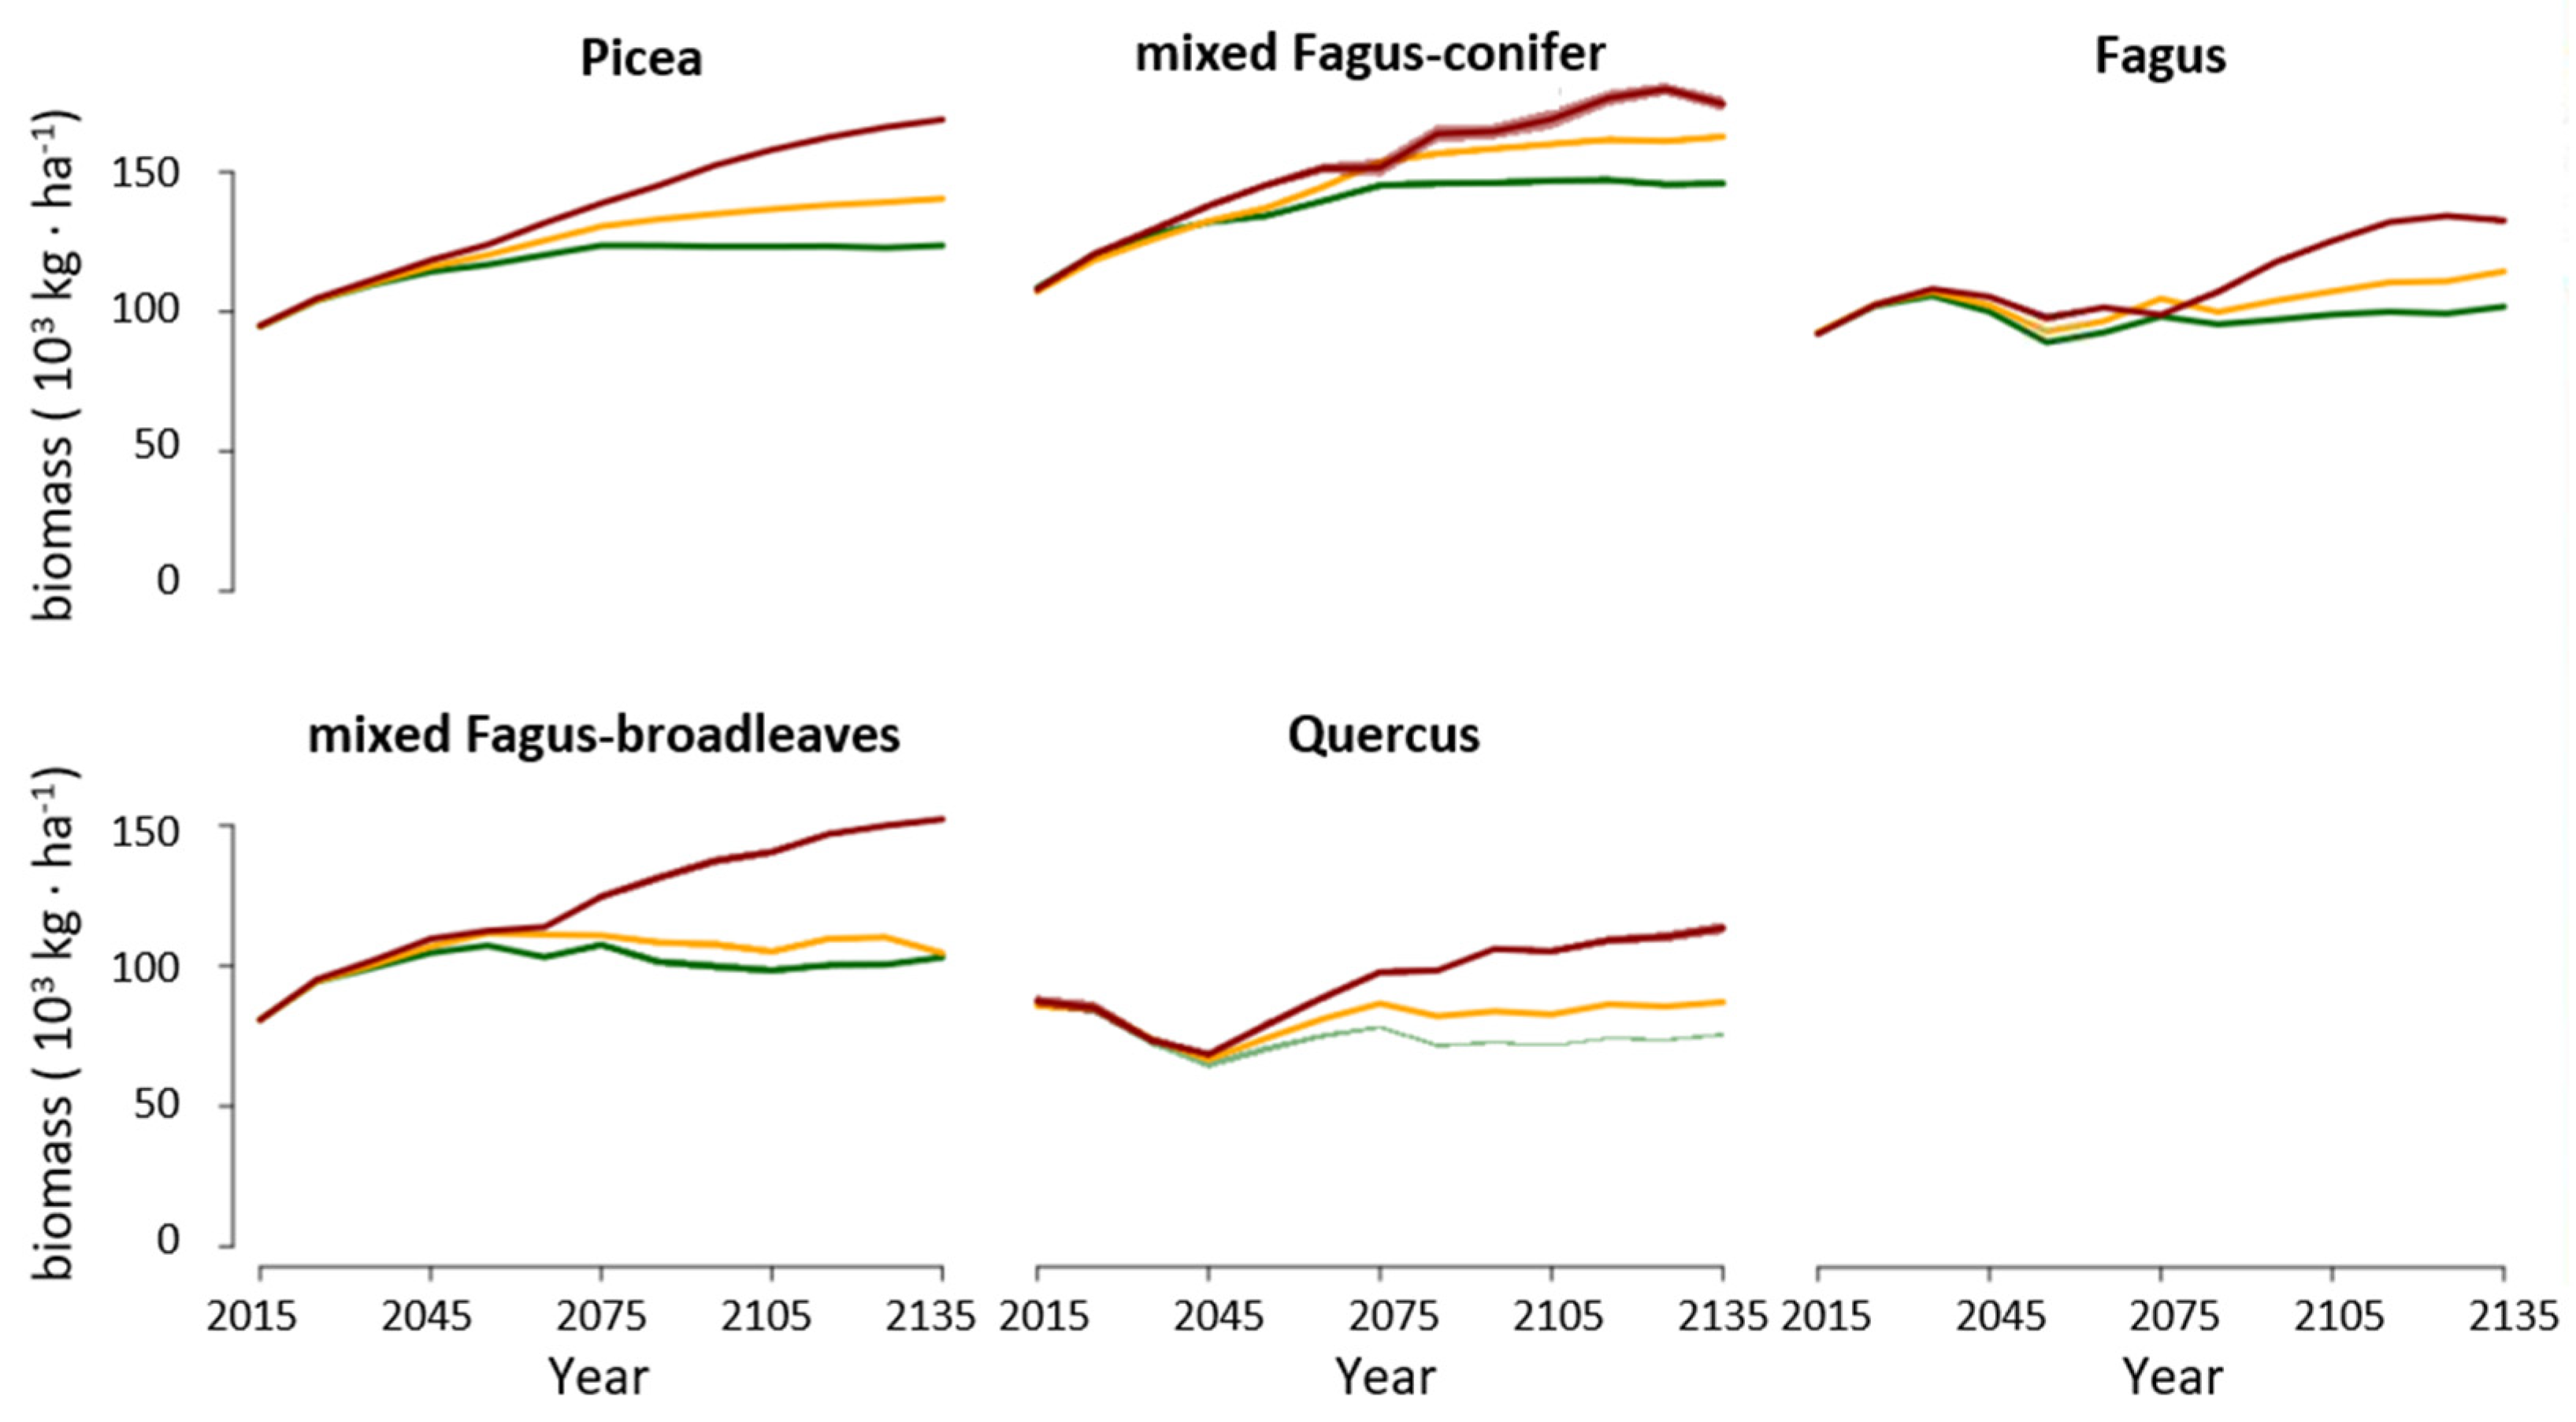
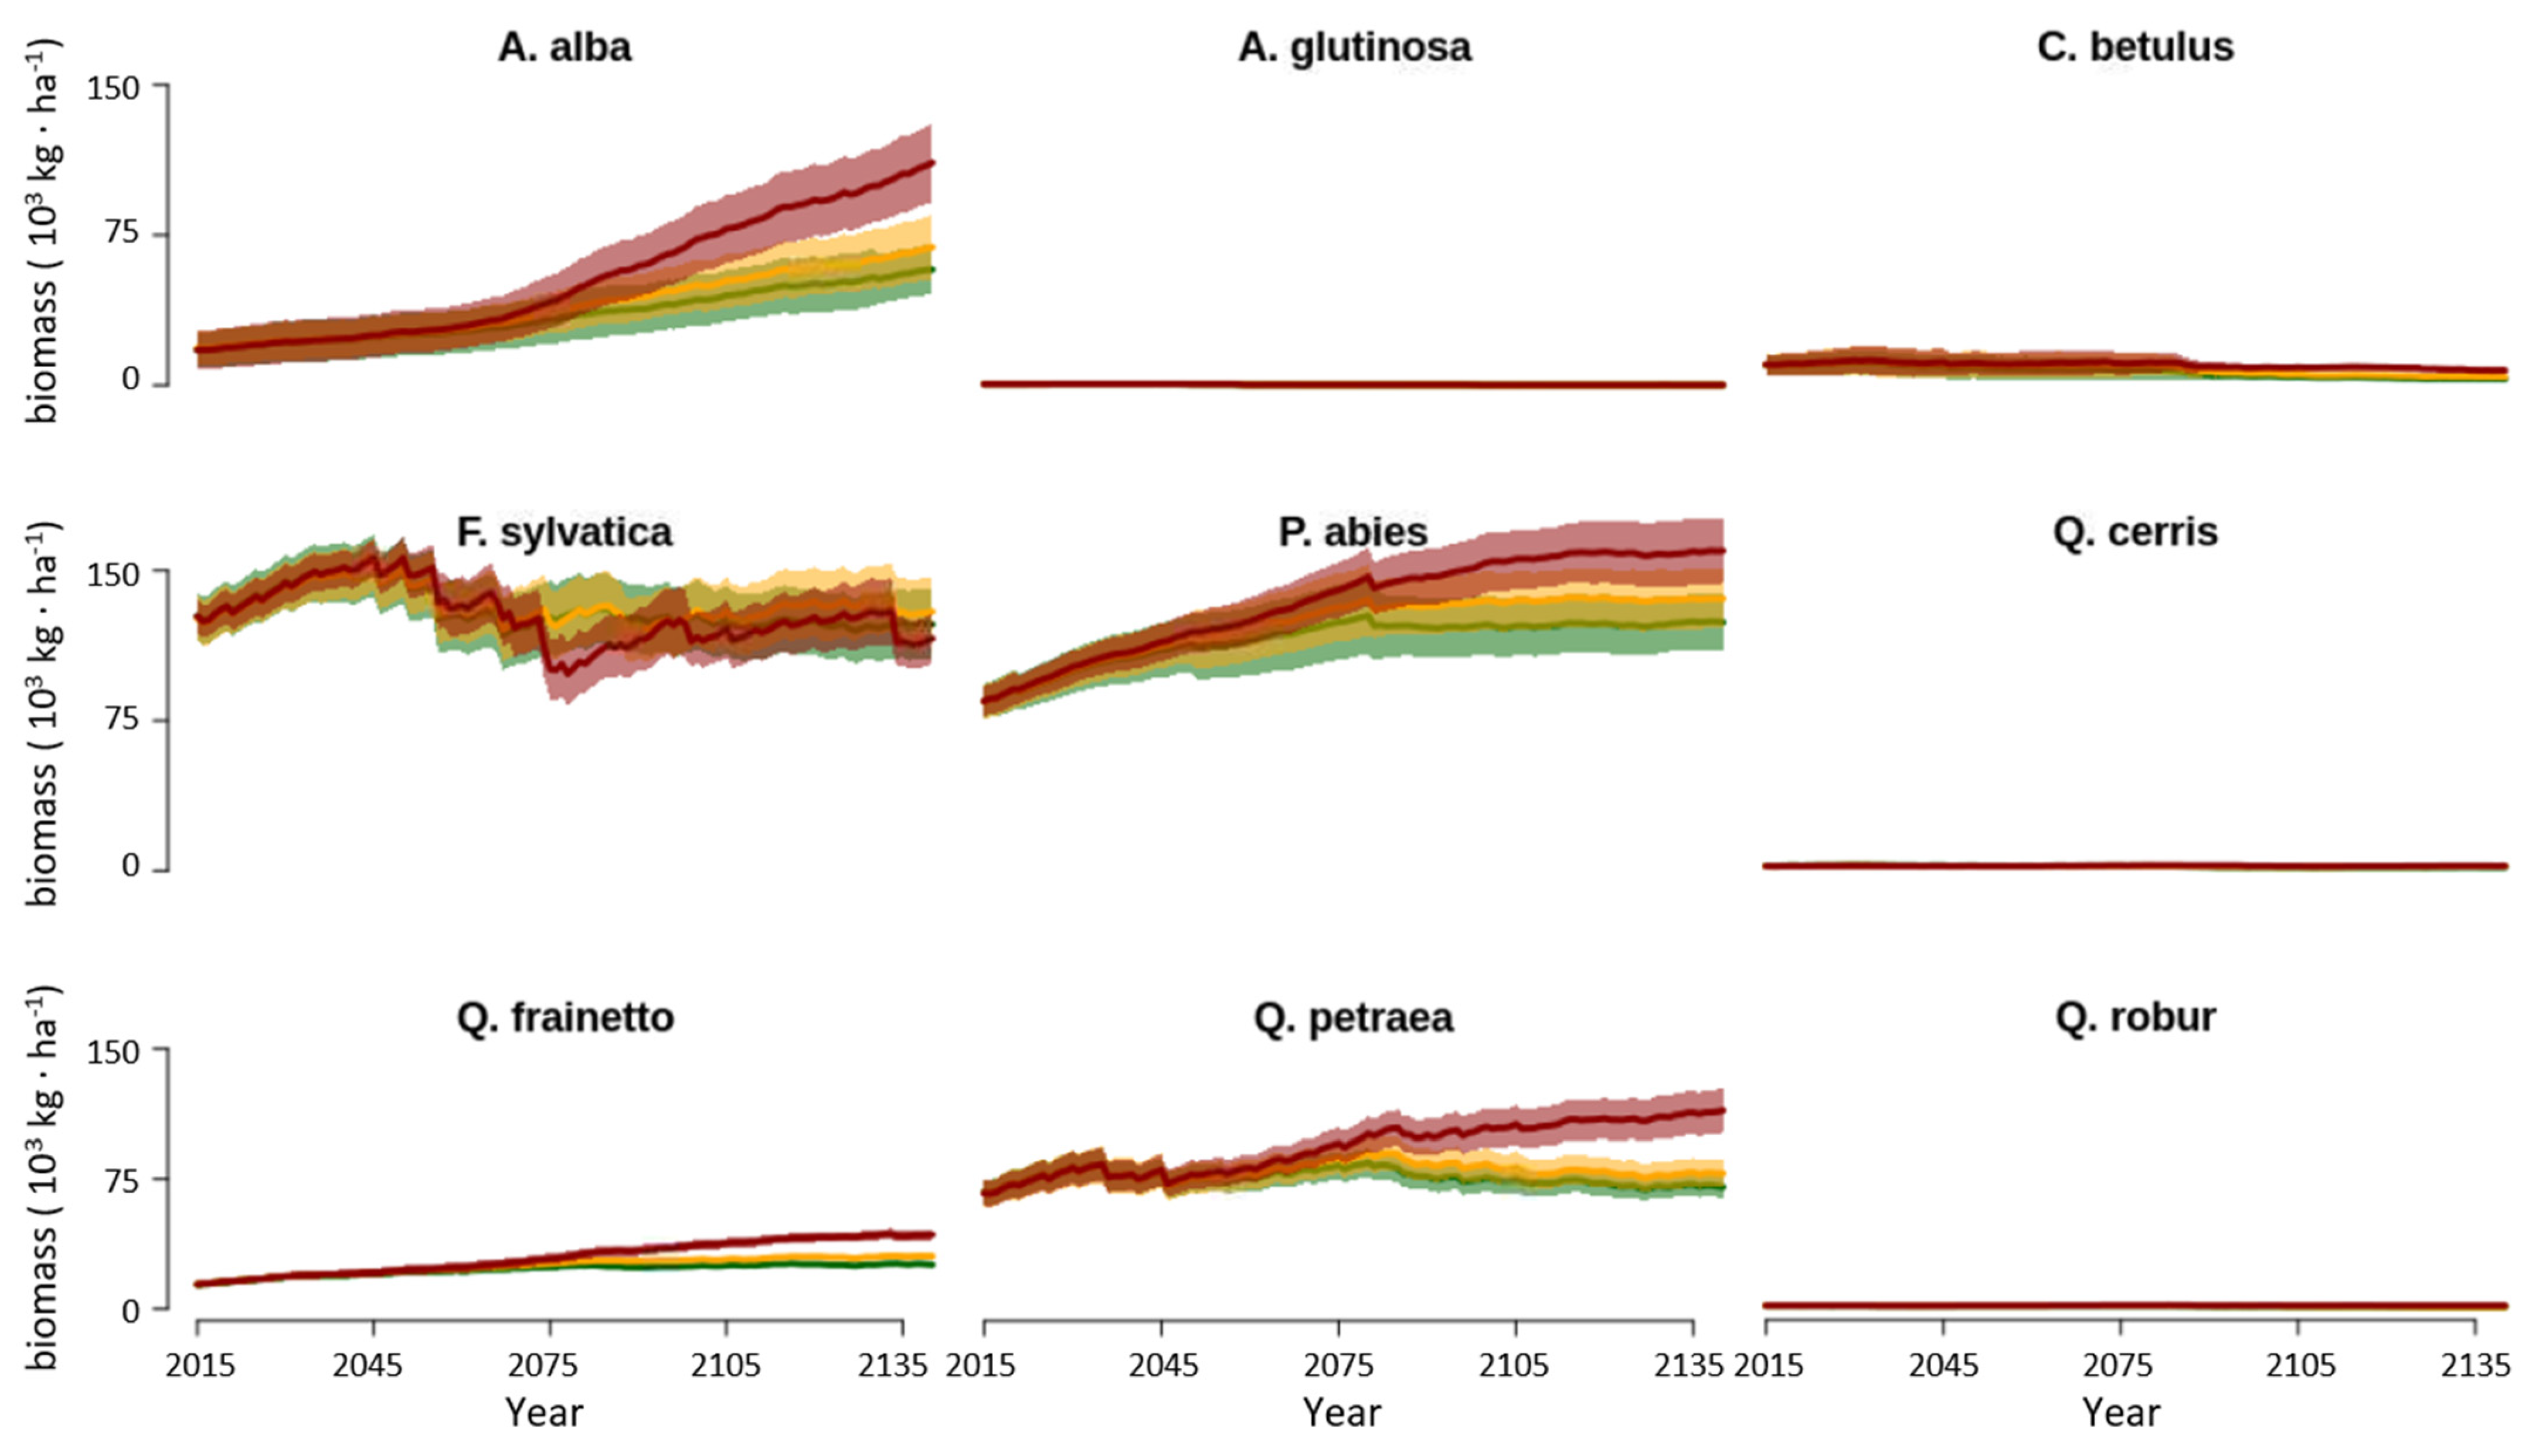
3.2. Changes in Biomass across Climate Change Scenarios
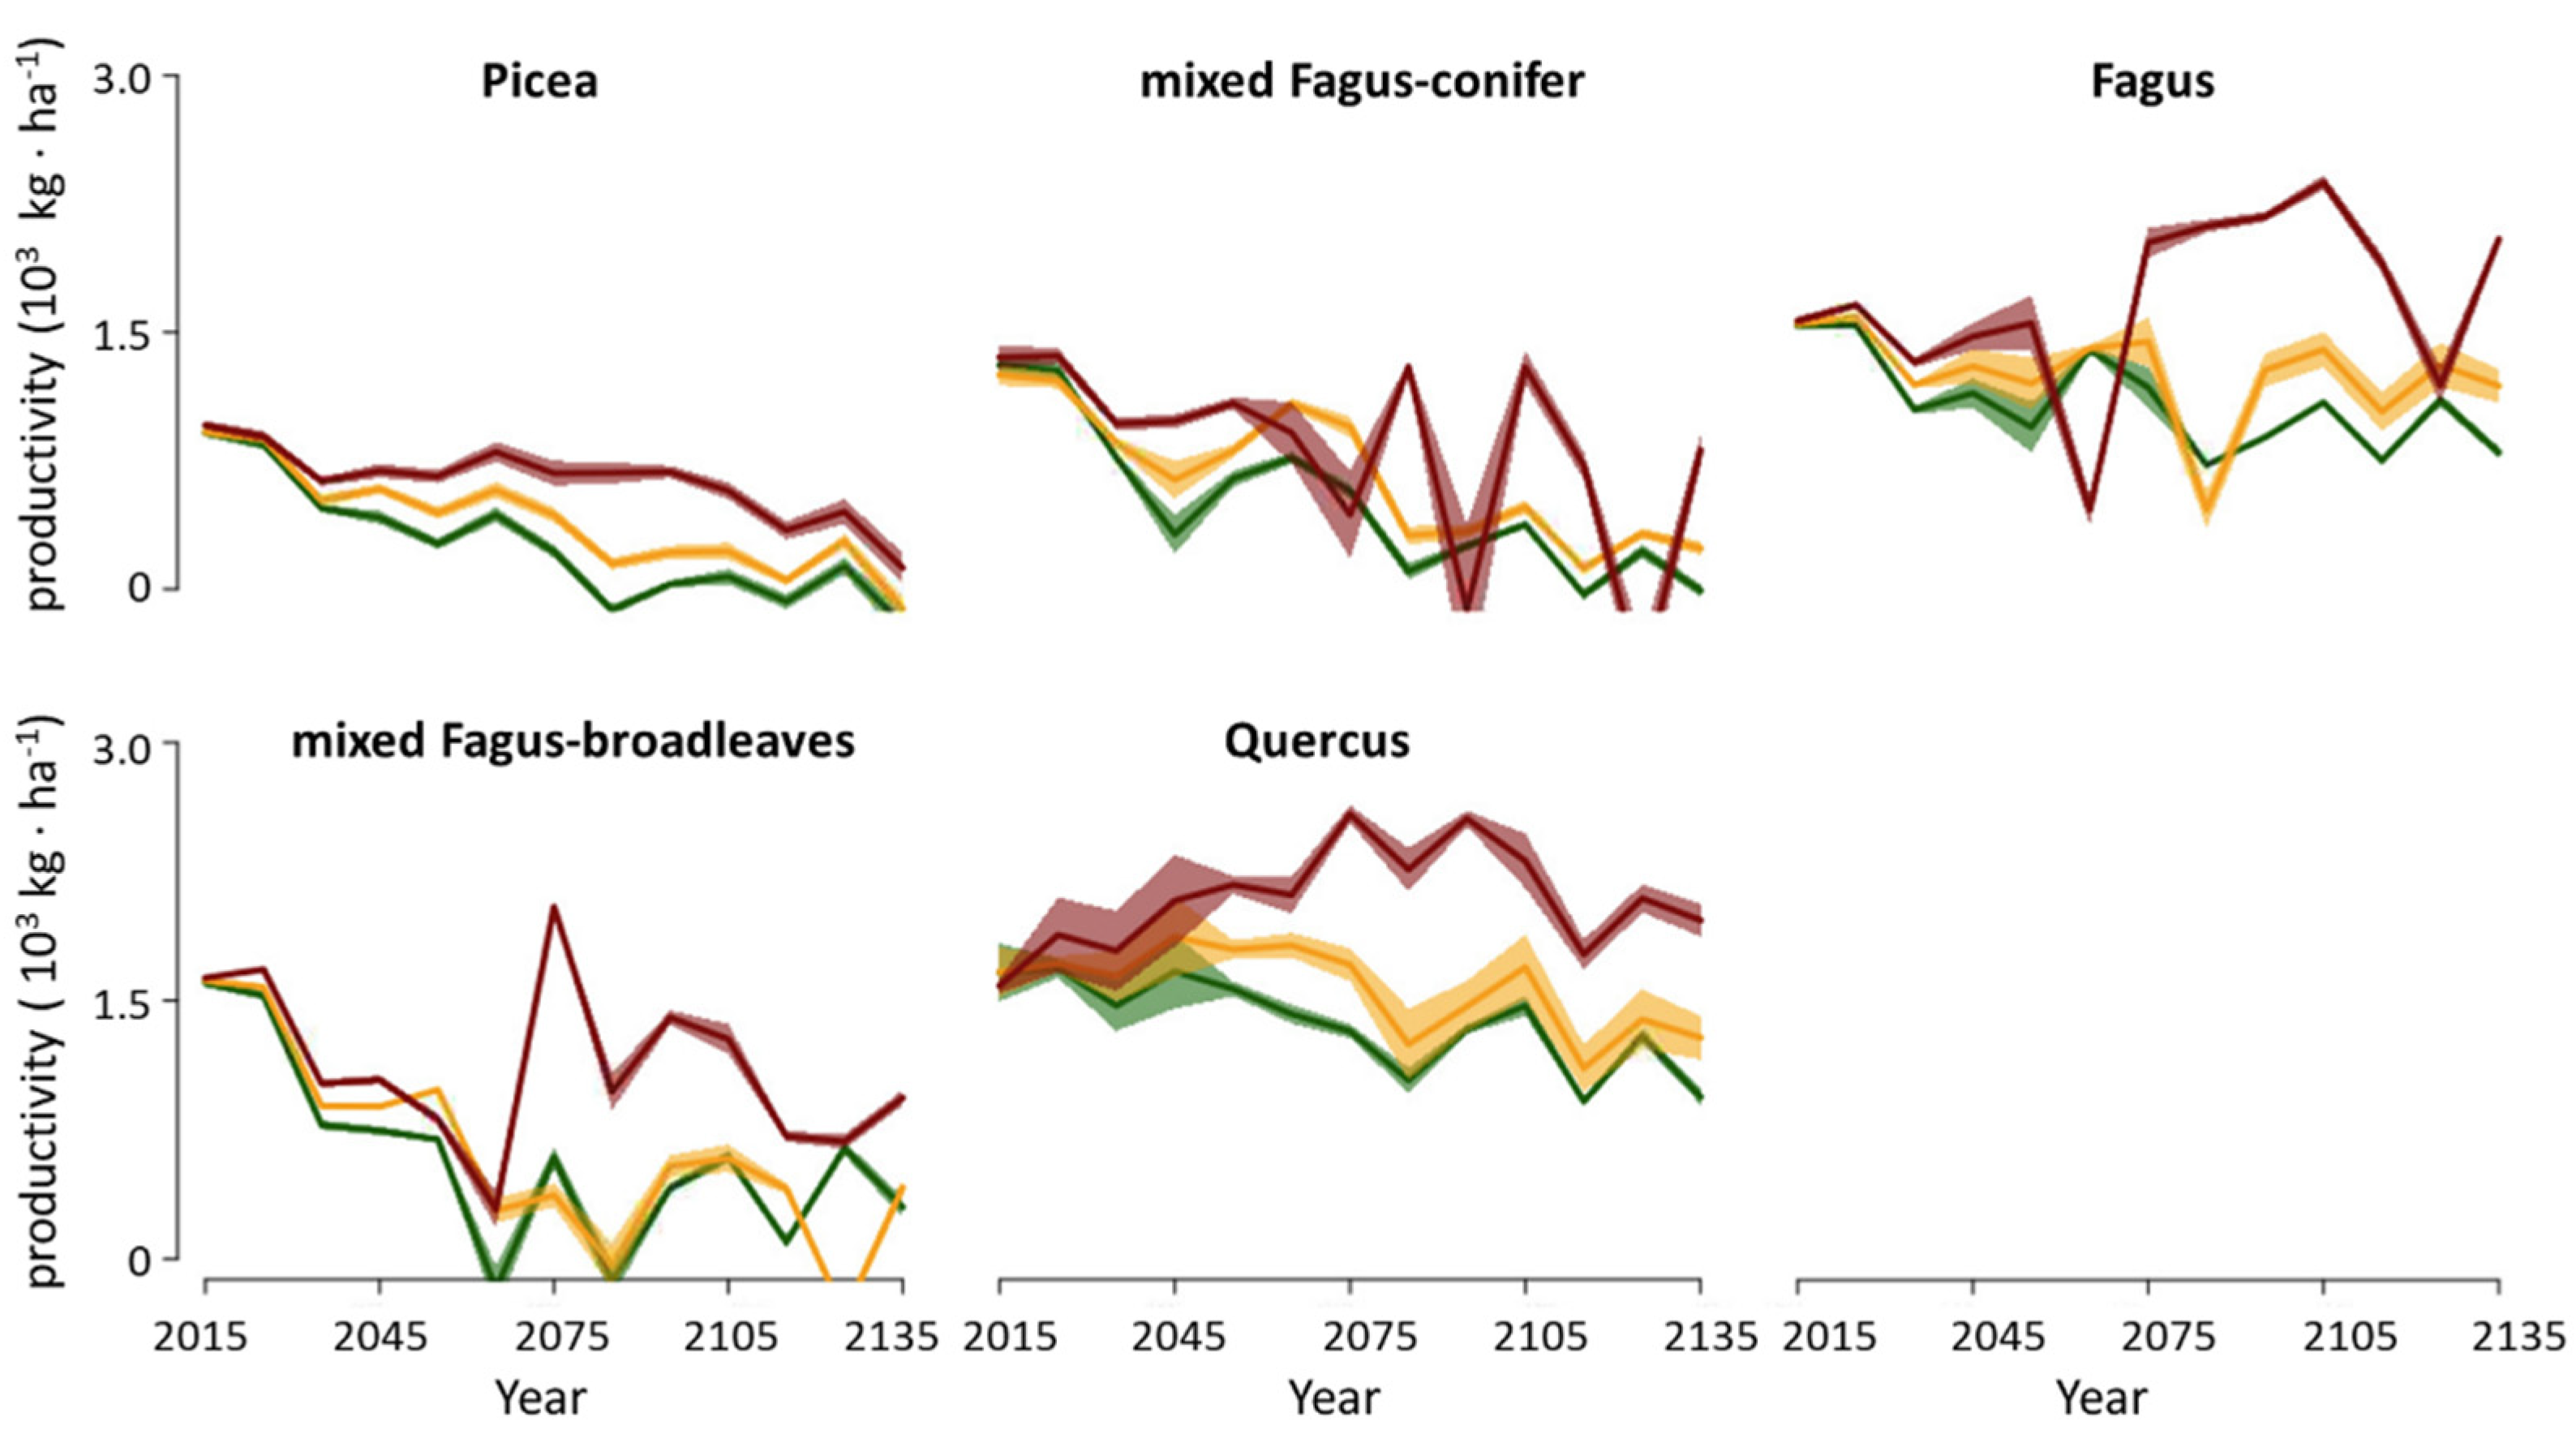
3.3. Productivity
3.4. Changes in Landscape Species Composition
4. Discussion
4.1. Forest Biomass and Productivity
4.2. Forest Composition
5. Conclusions
Supplementary Materials
Author Contributions
Funding
Institutional Review Board Statement
Informed Consent Statement
Data Availability Statement
Acknowledgments
Conflicts of Interest
References
- Huntley, B.; Baxter, R. Vegetation ecology and global change. In van der Maarel, E & Franklin. Vegetation Ecology; J Wiley-Blackwell: Hoboken, NJ, USA, 2012; pp. 509–525. ISBN 978-1-4443-3888-1. [Google Scholar]
- Cannell, M. UK Conifer Forests May Be Growing Faster in Response to Increased N Deposition, Atmospheric CO2 and Temperature. Forestry 1998, 71, 277–296. [Google Scholar] [CrossRef][Green Version]
- Richardson, A.D.; Hufkens, K.; Milliman, T.; Aubrecht, D.M.; Furze, M.E.; Seyednasrollah, B.; Krassovski, M.B.; Latimer, J.M.; Nettles, W.R.; Heiderman, R.R.; et al. Ecosystem Warming Extends Vegetation Activity but Heightens Vulnerability to Cold Temperatures. Nature 2018, 560, 368–371. [Google Scholar] [CrossRef]
- Broadmeadow, M.S.J.; Ray, D.; Samuel, C.J.A. Climate Change and the Future for Broadleaved Tree Species in Britain. For. Int. J. For. Res. 2005, 78, 145–161. [Google Scholar] [CrossRef]
- Kirschbaum, M.U.F.; McMillan, A.M.S. Warming and Elevated CO2 Have Opposing Influences on Transpiration. Which Is More Important? Curr. For. Rep. 2018, 4, 51–71. [Google Scholar] [CrossRef]
- Seidl, R.; Thom, D.; Kautz, M.; Martin-Benito, D.; Peltoniemi, M.; Vacchiano, G.; Wild, J.; Ascoli, D.; Petr, M.; Honkaniemi, J.; et al. Forest Disturbances under Climate Change. Nat. Clim. Chang. 2017, 7, 395. [Google Scholar] [CrossRef] [PubMed]
- Pan, Y.; Birdsey, R.A.; Fang, J.; Houghton, R.; Kauppi, P.E.; Kurz, W.A.; Phillips, O.L.; Shvidenko, A.; Lewis, S.L.; Canadell, J.G.; et al. A Large and Persistent Carbon Sink in the World’s Forests. Science 2011, 333, 988–993. [Google Scholar] [CrossRef]
- Sitch, S.; Friedlingstein, P.; Gruber, N.; Jones, S.D.; Murray-Tortarolo, G.; Ahlström, A.; Doney, S.C.; Graven, H.; Heinze, C.; Huntingford, C.; et al. Recent Trends and Drivers of Regional Sources and Sinks of Carbon Dioxide. Biogeosciences 2015, 12, 653–679. [Google Scholar] [CrossRef]
- Brienen, R.J.W.; Phillips, O.L.; Feldpausch, T.R.; Gloor, E.; Baker, T.R.; Lloyd, J.; Lopez-Gonzalez, G.; Monteagudo-Mendoza, A.; Malhi, Y.; Lewis, S.L.; et al. Long-Term Decline of the Amazon Carbon Sink. Nature 2015, 519, 344–348. [Google Scholar] [CrossRef]
- Hubau, W.; Lewis, S.L.; Phillips, O.L.; Affum-Baffoe, K.; Beeckman, H.; Cuní-Sanchez, A.; Daniels, A.K.; Ewango, C.E.N.; Fauset, S.; Mukinzi, J.M.; et al. Asynchronous Carbon Sink Saturation in African and Amazonian Tropical Forests. Nature 2020, 579, 80–87. [Google Scholar] [CrossRef]
- Scheller, R.M.; Mladenoff, D.J. A Spatially Interactive Simulation of Climate Change, Harvesting, Wind, and Tree Species Migration and Projected Changes to Forest Composition and Biomass in Northern Wisconsin, USA. Glob. Chang. Biol. 2005, 11, 307–321. [Google Scholar] [CrossRef]
- Klein, T.; Ramon, U. Stomatal Sensitivity to CO2 Diverges between Angiosperm and Gymnosperm Tree Species. Funct. Ecol. 2019, 33, 1411–1424. [Google Scholar] [CrossRef]
- Pan, Y.; Birdsey, R.A.; Phillips, O.L.; Jackson, R.B. The Structure, Distribution, and Biomass of the World’s Forests. Annu. Rev. Ecol. Evol. Syst. 2013, 44, 593–622. [Google Scholar] [CrossRef]
- Musselman, R.C.; Fox, D.G. A Review of the Role of Temperate Forests in the Global CO2 Balance. J. Air Waste Manag. Assoc. 1991, 41, 798–807. [Google Scholar] [CrossRef]
- IPCC. Climate Change 2014: Impacts, Adaptation and Vulnerability Part. A: Global and Sectoral Aspects. In Contribution of Working Group II to the Fifth Assessment Report of the Intergovernmental Panel on Climate Change; Cambridge University Press: Cambridge, UK, 2014. [Google Scholar]
- Bouriaud, L.; Bouriaud, O.; Elkin, C.; Temperli, C.; Reyer, C.; Duduman, G.; Barnoaiea, I.; Nichiforel, L.; Zimmermann, N.; Bugmann, H. Age-Class Disequilibrium as an Opportunity for Adaptive Forest Management in the Carpathian Mountains, Romania. Reg. Environ. Chang. 2015, 15, 1557–1568. [Google Scholar] [CrossRef]
- Law, B.E.; Hudiburg, T.W.; Berner, L.T.; Kent, J.J.; Buotte, P.C.; Harmon, M.E. Land Use Strategies to Mitigate Climate Change in Carbon Dense Temperate Forests. Proc. Natl. Acad. Sci. USA 2018, 115, 3663–3668. [Google Scholar] [CrossRef]
- McDowell, N.G.; Allen, C.D.; Anderson-Teixeira, K.; Aukema, B.H.; Bond-Lamberty, B.; Chini, L.; Clark, J.S.; Dietze, M.; Grossiord, C.; Hanbury-Brown, A.; et al. Pervasive Shifts in Forest Dynamics in a Changing World. Science 2020, 368, eaaz9463. [Google Scholar] [CrossRef]
- Nabuurs, G.-J.; Lindner, M.; Verkerk, P.J.; Gunia, K.; Deda, P.; Michalak, R.; Grassi, G. First Signs of Carbon Sink Saturation in European Forest Biomass. Nat. Clim. Chang. 2013, 3, 792–796. [Google Scholar] [CrossRef]
- Piovesan, G.; Biondi, F.; Filippo, A.D.; Alessandrini, A.; Maugeri, M. Drought-Driven Growth Reduction in Old Beech (Fagus Sylvatica, L.) Forests of the Central Apennines, Italy. Glob. Chang. Biol 2008, 14, 1265–1281. [Google Scholar] [CrossRef]
- Rubel, F.; Brugger, K.; Haslinger, K.; Auer, I. The Climate of the European Alps: Shift of Very High Resolution Köppen-Geiger Climate Zones 1800–2100. Meteorol. Z. 2017, 26, 115–125. [Google Scholar] [CrossRef]
- Berland, A.; Shuman, B.; Manson, S.M. Simulated Importance of Dispersal, Disturbance, and Landscape History in Long-Term Ecosystem Change in the Big Woods of Minnesota. Ecosystems 2011, 14, 398–414. [Google Scholar] [CrossRef]
- Micu, D.M.; Dumitrescu, A.; Cheval, S.; Birsan, M.-V. Climate of the Romanian Carpathians; Springer Atmospheric Sciences; Springer International Publishing: Cham, Switzerland, 2015; ISBN 978-3-319-02885-9. [Google Scholar]
- Beldie, A. Flora Şi Vegetația Munților Bucegi; Academia Republicii Socialiste Romania: Bucharest, Romania, 1967. [Google Scholar]
- Bosela, M.; Lukac, M.; Castagneri, D.; Sedmák, R.; Biber, P.; Carrer, M.; Konôpka, B.; Nola, P.; Nagel, T.A.; Popa, I.; et al. Contrasting Effects of Environmental Change on the Radial Growth of Co-Occurring Beech and Fir Trees across Europe. Sci. Total Environ. 2018, 615, 1460–1469. [Google Scholar] [CrossRef]
- Schwarz, J.A.; Bauhus, J. Benefits of Mixtures on Growth Performance of Silver Fir (Abies Alba) and European Beech (Fagus Sylvatica) Increase With Tree Size Without Reducing Drought Tolerance. Front. Glob. Chang. 2019, 2, 79. [Google Scholar] [CrossRef]
- Scheller, R.M.; Domingo, J.B.; Sturtevant, B.R.; Williams, J.S.; Rudy, A.; Gustafson, E.J.; Mladenoff, D.J. Design, Development, and Application of LANDIS-II, a Spatial Landscape Simulation Model with Flexible Temporal and Spatial Resolution. Ecol. Model. 2007, 201, 409–419. [Google Scholar] [CrossRef]
- Aber, J.D.; Federer, C.A. A Generalized, Lumped-Parameter Model of Photosynthesis, Evapotranspiration and Net Primary Production in Temperate and Boreal Forest Ecosystems. Oecologia 1992, 92, 463–474. [Google Scholar] [CrossRef]
- Gustafson, E.J. PnET-Succession v3.1 Extension User Guide; USDA Forest Service: Avenue Portland, OR, USA, 2018.
- Gustafson, E.J.; De Bruijn, A.M.G.; Pangle, R.E.; Limousin, J.-M.; McDowell, N.G.; Pockman, W.T.; Sturtevant, B.R.; Muss, J.D.; Kubiske, M.E. Integrating Ecophysiology and Forest Landscape Models to Improve Projections of Drought Effects under Climate Change. Glob. Chang. Biol. 2015, 21, 843–856. [Google Scholar] [CrossRef]
- Gustafson, E.J.; Shvidenko, A.Z.; Scheller, R.M. Effectiveness of Forest Management Strategies to Mitigate Effects of Global Change in South-Central Siberia. Can. J. Res. 2011, 41, 1405–1421. [Google Scholar] [CrossRef]
- Seidl, R.; Fernandes, P.M.; Fonseca, T.F.; Gillet, F.; Jönsson, A.M.; Merganičová, K.; Netherer, S.; Arpaci, A.; Bontemps, J.-D.; Bugmann, H.; et al. Modelling Natural Disturbances in Forest Ecosystems: A Review. Ecol. Model. 2011, 222, 903–924. [Google Scholar] [CrossRef]
- Chivulescu, S.; García-Duro, J.; Pitar, D.; Leca, Ș.; Badea, O. Past and Future of Temperate Forests State under Climate Change Effects in the Romanian Southern Carpathians. Forests 2021, 12, 885. [Google Scholar] [CrossRef]
- Florea, N.; Balaceanu, V.; Munteanu, I.; Asvadurov, H.; Conea, A.; Oancea, C.; Cernescu, N.; Popovat, M. Harta Solurilor Romaniei, Scara 1: 200.000 (The Soil Map of Romania at the Scale 1: 200,000). Inst. Geol. -Igfcot Buchar. 1963, 1993, 50. [Google Scholar]
- Hengl, T.; Mendes de Jesus, J.; Heuvelink, G.B.M.; Ruiperez Gonzalez, M.; Kilibarda, M.; Blagotić, A.; Shangguan, W.; Wright, M.N.; Geng, X.; Bauer-Marschallinger, B.; et al. SoilGrids250m: Global Gridded Soil Information Based on Machine Learning. PLoS ONE 2017, 12, e0169748. [Google Scholar] [CrossRef] [PubMed]
- Şofletea, N.; Curtu, L. Dendrologie; Pentru Viaţă: Braşov, Romania, 2001; Volume 2, ISBN 978-973-99456-1-5. [Google Scholar]
- ICAS. Amenajamentul. O.S. Arpaş.; Regia Naţională a pădurilor Romsilva. Institutul de Cercetări şi amenajări Silvice: Bucharest, Romania, 2017. [Google Scholar]
- ICAS. Amenajamentul. O.S. Sibiu.; Regia Naţională a pădurilor Romsilva. Institutul de Cercetări şi amenajări Silvice: Bucharest, Romania, 2016. [Google Scholar]
- ICAS. Amenajamentul. O.S. Topoloveni; Regia Naţională a pădurilor Romsilva. Institutul de Cercetări şi amenajări Silvice: Bucharest, Romania, 2015. [Google Scholar]
- ICAS. Amenajamentul. O.S. Vidraru; Regia Naţională a pădurilor Romsilva. Institutul de Cercetări şi amenajări Silvice: Bucharest, Romania, 2015. [Google Scholar]
- ICAS. Amenajamentul. O.S. Domnesti; Regia Naţională a pădurilor Romsilva. Institutul de Cercetări şi amenajări Silvice: Bucharest, Romania, 2014. [Google Scholar]
- ICAS. Amenajamentul. O.S. Mihăeşti; Regia Naţională a pădurilor Romsilva. Institutul de Cercetări şi amenajări Silvice: Bucharest, Romania, 2014. [Google Scholar]
- ICAS. Amenajamentul. O.S. Muşăteşti; Regia Naţională a pădurilor Romsilva. Institutul de Cercetări şi amenajări Silvice: Bucharest, Romania, 2014. [Google Scholar]
- ICAS. Amenajamentul. O.S. Aninoasa; Regia Naţională a pădurilor Romsilva. Institutul de Cercetări şi amenajări Silvice: Bucharest, Romania, 2014. [Google Scholar]
- ICAS. Amenajamentul. O.S. Cotmeana; Regia Naţională a pădurilor Romsilva. Institutul de Cercetări şi amenajări Silvice: Bucharest, Romania, 2013. [Google Scholar]
- ICAS. Amenajamentul. O.S. Piteşti; Regia Naţională a pădurilor Romsilva. Institutul de Cercetări şi amenajări Silvice: Bucharest, Romania, 2013. [Google Scholar]
- Norme Tehnice Pentru Amenajarea Padurilor; Ministry Apelor Padur Si Protection Mediului: Bucharest, Romania, 2000; p. 160.
- Norme Tehnice Privind Alegerea Si Aplicarea Tratamentelor; Ministry Apelor Padur Si Protection Mediului: Bucharest, Romania, 2000; p. 87.
- Paraschiv, M.-V. Cercetări Privind Insectele Dăunătoare Molidului Picea Abies (L.) Karst. In Arboretele Din Munţii Braşovului/Researches Concerning the Damaging Insects of Norway Spruce Picea Abies (L.) Karst. Stands in Braşov Mountains; Universitatea Transilvania din Braşov: Brașov, Romania, 2012. [Google Scholar]
- Bogdan, O.; Niculescu, E. Riscurile Climatice Din. Romania; Institutul de Geografie: Bucharest, Romania, 1999; ISBN 973-0-008000-0. [Google Scholar]
- Olenici, N.; Duduman, M.-L.; Tulbure, C.; Rotariu, C. Ips Duplicatus (Coleoptera, Curculionidae, Scolytinae)-Un Daunator Important al Molidului Din Afara Arealului Natural de Vegetatie. Rev. Padur. 2009, 124, 17–24. [Google Scholar]
- Duduman, M.L.; Isaia, G.; Olenici, N. Ips Duplicatus (Sahlberg) (Coleoptera: Curculionidae, Scolytinae) distribution in Romania –preliminary results–. Bull. Univ. Braşov Ser. II For. WoodInd. Agric. Food Eng. 2011, 4, 19–26. [Google Scholar]
- Scheller, R.M.; Mladenoff, D.J. A Forest Growth and Biomass Module for a Landscape Simulation Model, LANDIS: Design, Validation, and Application. Ecol. Model. 2004, 180, 211–229. [Google Scholar] [CrossRef]
- Duveneck, M.J.; Scheller, R.M.; White, M.A. Effects of Alternative Forest Management on Biomass and Species Diversity in the Face of Climate Change in the Northern Great Lakes Region (USA). Can. J. Res. 2014, 44, 700–710. [Google Scholar] [CrossRef]
- Aber, J.D.; Ollinger, S.V.; Federer, C.A.; Reich, P.B.; Goulden, M.L.; Sicklighter, D.W.; Melillo, J.M.; Lathrop, R.G. Predicting the Effects of Climate Change on Water Yield and Forest Production in the Northeastern United States. Clim. Res. 1995, 5, 207–222. [Google Scholar] [CrossRef]
- Gustafson, E.J.; Kubiske, M.E.; Sturtevant, B.R.; Miranda, B.R. Scaling Aspen-FACE Experimental Results to Century and Landscape Scales. Landsc. Ecol. 2013, 28, 1785–1800. [Google Scholar] [CrossRef]
- Xu, C.; Gertner, G.Z.; Scheller, R.M. Potential Effects of Interaction between CO2 and Temperature on Forest Landscape Response to Global Warming. Glob. Chang. Biol. 2007, 13, 1469–1483. [Google Scholar] [CrossRef]
- Newton, A.C.; Echeverría, C.; Cantarello, E.; Bolados, G. Projecting Impacts of Human Disturbances to Inform Conservation Planning and Management in a Dryland Forest Landscape. Biol. Conserv. 2011, 144, 1949–1960. [Google Scholar] [CrossRef]
- Scheller, R.M.; Hua, D.; Bolstad, P.V.; Birdsey, R.A.; Mladenoff, D.J. The Effects of Forest Harvest Intensity in Combination with Wind Disturbance on Carbon Dynamics in Lake States Mesic Forests. Ecol. Model. 2011, 222, 144–153. [Google Scholar] [CrossRef]
- Kretchun, A.M.; Loudermilk, E.L.; Scheller, R.M.; Hurteau, M.D.; Belmecheri, S. Climate and Bark Beetle Effects on Forest Productivity—Linking Dendroecology with Forest Landscape Modeling. Can. J. For. Res. 2016, 46, 1026–1034. [Google Scholar] [CrossRef]
- Xi, W.; Waldron, J.D.; Lafon, C.W.; Cairns, D.M.; Birt, A.G.; Tchakerian, M.D.; Coulson, R.N.; Klepzig, K.D. Modeling Long-Term Effects of Altered Fire Regimes Following Southern Pine Beetle Outbreaks (North Carolina). Ecol. Restor. 2009, 27, 24–26. [Google Scholar] [CrossRef][Green Version]
- Gustafson, E.J.; Shifley, S.R.; Mladenoff, D.J.; Nimerfro, K.K.; He, H.S. Spatial Simulation of Forest Succession and Timber Harvesting Using LANDIS. Can. J. Res. 2000, 30, 32–43. [Google Scholar] [CrossRef]
- Sturtevant, B.R.; Gustafson, E.J.; Li, W.; He, H.S. Modeling Biological Disturbances in LANDIS: A Module Description and Demonstration Using Spruce Budworm. Ecol. Model. 2004, 180, 153–174. [Google Scholar] [CrossRef]
- Mladenoff, D.J.; Hong, S.H. Design, behavior and application of LANDIS, an object-oriented model of forest landscape disturbance and succession. In Spatial Modeling of Forest Landscape Change: Approaches and Applications; Cambridge University Press: Cambridge, UK, 1999; pp. 125–162. [Google Scholar]
- European Environment Agency Corine Land Cover 2012 (Version 18.5.1). 2016. Available online: https://www.eea.europa.eu/data-and-maps/data/external/corine-land-cover-2012 (accessed on 1 January 2019).
- Liaw, A.; Wiener, M. Classification and Regression by RandomForest. R News 2002, 2, 18–22. [Google Scholar]
- Earth Resources Observation and Science (EROS) Center. Shuttle Radar Topography Mission (SRTM) 1 Arc-Second Global; USGS: Reston, VA, USA, 2017.
- Fick, S.E.; Hijmans, R.J. WorldClim 2: New 1-Km Spatial Resolution Climate Surfaces for Global Land Areas. Int. J. Climatol. 2017, 37, 4302–4315. [Google Scholar] [CrossRef]
- Esch, T.; Heldens, W.; Hirner, A.; Keil, M.; Marconcini, M.; Roth, A.; Zeidler, J.; Dech, S.; Strano, E. Breaking New Ground in Mapping Human Settlements from Space-The Global Urban Footprint. Isprs J. Photogramm. Remote Sens. 2017, 134, 30–42. [Google Scholar] [CrossRef]
- OpenStreetMap contributors Planet. Dump Retrieved. Available online: https://planet.osm.org (accessed on 1 January 2019).
- Tanase, M.A.; Villard, L.; Pitar, D.; Apostol, B.; Petrila, M.; Chivulescu, S.; Leca, S.; Borlaf-Mena, I.; Pascu, I.-S.; Dobre, A.-C.; et al. Synthetic Aperture Radar Sensitivity to Forest Changes: A Simulations-Based Study for the Romanian Forests. Sci. Total Environ. 2019, 689, 1104–1114. [Google Scholar] [CrossRef]
- Giurgiu, V.; Decei, I.; Drăghiciu, D. Metode Şi Tabele Dendrometrice [Methods and Dendrometric Tables]; Ceres Publishing House, Bucharest: Bucharest, Romania, 2004; ISBN 973-40-0639-8. [Google Scholar]
- Giurgiu, V.; Draghiciu, D. Modele Matematico-Auxologice Si Tabele de Productie Pentru Arborete [Mathematic-Auxologic Models and Yield Tables for Forest Stands]; Ceres Publishing House: Bucharest, Romania, 2004; ISBN 973-40-0637-1. [Google Scholar]
- Kattge, J.; Díaz, S.; Lavorel, S.; Prentice, I.C.; Leadley, P.; Bönisch, G.; Garnier, E.; Westoby, M.; Reich, P.B.; Wright, I.J.; et al. TRY–a Global Database of Plant Traits. Glob. Chang. Biol. 2011, 17, 2905–2935. [Google Scholar] [CrossRef]
- Vittoz, P.; Engler, R. Seed Dispersal Distances: A Typology Based on Dispersal Modes and Plant Traits. Bot. Helv. 2007, 117, 109–124. [Google Scholar] [CrossRef]
- Popa, I. Managementul Riscului La Doborâturi Produse De Vânt; Editura Tehnică Silvică: Bucharest, Romania, 2007; ISBN 978-973-96001-8-7. [Google Scholar]
- Grodzki, W.; Jakuš, R.; Lajzová, E.; Sitková, Z.; Maczka, T.; Škvarenina, J. Effects of Intensive versus No Management Strategies during an Outbreak of the Bark Beetle Ips Typographus (L.) (Col.: Curculionidae, Scolytinae) in the Tatra Mts. in Poland and Slovakia. Ann. Sci. 2006, 63, 55–61. [Google Scholar] [CrossRef]
- Fedderwitz, F.; Björklund, N.; Ninkovic, V.; Nordlander, G. Does the Pine Weevil Hylobius Abietis Prefer Conifer Seedlings over Other Main Food Sources? Silva. Fenn. 2018, 52. [Google Scholar] [CrossRef]
- Simionescu, A.; Ciornei, C.; Chira, D. Starea De Sănătate a Pădurilor Din România În Perioada 2001–2010 [Romanian Forest Health Status in the Period 2001–2010]; Muşatinii: Suceava, Romania, 2013; ISBN 978-606-656-017-7. [Google Scholar]
- Simionescu, A.; Mihalciuc, V.; Lupu, D.; Vlăduleasa, A.; Badea, O.; Fulicea, T. Starea De Sănătate a Pădurilor Din România În Intervalul 1986–2000 [Romanian Forest Health Status in the Period 1986–2000]; Muşatinii: Suceava, Romania, 2001; ISBN 973-8122-05-8. [Google Scholar]
- INCDS, Marin D. Raport Privind Activitatile Desfasurate in Cadrul Lucrarii Asistenta Tehnica Privind Realizarei Bazei de Date Si Elaborarea Lucrarii Anuale ‘Starea de Sanatate a Padurilor Administrate de RNP Romsilva’ Cod: 16.12/2018” [ ‘Report about Technical Assistance Regarding the Creation of the Database and the Elaboration of the Annual Paper “The State of Health of the Forests Managed by RNP Romsilva” Code: 16.12/2018′ ]; Romsilva: Bucharest, Romania, 2018. [Google Scholar]
- Olenici, N.; Olenici, V. Hylobius Abietis L.-Unele Particularitati Biologice Ecologice Si Comportamentale Si Protectia Culturilor Impotriva Vatamarilor Cauzate de Acesta (I). Bucov. For. 1994, 34–59. [Google Scholar]
- Norme Tehnice Pentru Îngrijirea Si Conducerea Arboretelor; Ministry Apelor Padur Si Protection Mediului: Bucharest, Romania, 2000; p. 176.
- Norme Tehnice Privind Compozitii, Scheme Si Tehnologii de Regenerare a Padurilor Si Impadurire a Terenurilor Degradate; Ministry Apelor Padur Si Protection Mediului: Bucharest, Romaniadiului, 2000; p. 253.
- Van Vuuren, D.P.; Edmonds, J.; Kainuma, M.; Riahi, K.; Thomson, A.; Hibbard, K.; Hurtt, G.C.; Kram, T.; Krey, V.; Lamarque, J.-F.; et al. The Representative Concentration Pathways: An Overview. Clim. Chang. 2011, 109, 5–31. [Google Scholar] [CrossRef]
- Harris, I.; Jones, P.D.; Osborn, T.J.; Lister, D.H. Updated High-Resolution Grids of Monthly Climatic Observations–the CRU TS3.10 Dataset. Int. J. Climatol. 2014, 34, 623–642. [Google Scholar] [CrossRef]
- Osborn, T.J.; Wallace, C.J.; Harris, I.C.; Melvin, T.M. Pattern Scaling Using ClimGen: Monthly-Resolution Future Climate Scenarios Including Changes in the Variability of Precipitation. Clim. Chang. 2016, 134, 353–369. [Google Scholar] [CrossRef]
- Voldoire, A.; Sanchez-Gomez, E.; Mélia, D.S.; Decharme, B.; Cassou, C.; Sénési, S.; Valcke, S.; Beau, I.; Alias, A.; Chevallier, M.; et al. The CNRM-CM5. 1 Global Climate Model: Description and Basic Evaluation. Clim. Dyn. 2013, 40, 2091–2121. [Google Scholar] [CrossRef]
- Moreno, A.; Hasenauer, H. Spatial Downscaling of European Climate Data. Int. J. Climatol. 2016, 36, 1444–1458. [Google Scholar] [CrossRef]
- Pinheiro, J.; Bates, D.; DebRoy, S.; Sarkar, D.; R Core Team. Nlme: Linear and Nonlinear Mixed Effects Models, R package version; 2017. Available online: https://CRAN.R-project.org/package=nlme (accessed on 1 September 2020).
- Oksanen, J.; Blanchet, F.G.; Friendly, M.; Kindt, R.; Legendre, P.; McGlinn, D.; Minchin, P.R.; O’Hara, R.B.; Simpson, G.L.; Solymos, P.; et al. Vegan: Community Ecology Package. 2020. Available online: https://CRAN.R-project.org/package=vegan (accessed on 1 September 2020).
- Seidl, R.; Rammer, W.; Jäger, D.; Lexer, M.J. Impact of Bark Beetle (Ips Typographus L.) Disturbance on Timber Production and Carbon Sequestration in Different Management Strategies under Climate Change. For. Ecol. Manag. 2008, 256, 209–220. [Google Scholar] [CrossRef]
- Cuculeanu, V.; Tuinea, P.; Bălteanu, D. Climate Change Impacts in Romania: Vulnerability and Adaptation Options. GeoJournal 2002, 57, 203–209. [Google Scholar] [CrossRef]
- Gunton, R.M.; Polce, C.; Kunin, W.E. Predicting Ground Temperatures across European Landscapes. Methods Ecol. Evol. 2015, 6, 532–542. [Google Scholar] [CrossRef]
- Kearney, M.R.; Gillingham, P.K.; Bramer, I.; Duffy, J.P.; Maclean, I.M.D. A Method for Computing Hourly, Historical, Terrain-corrected Microclimate Anywhere on Earth. Methods Ecol. Evol. 2020, 11, 38–43. [Google Scholar] [CrossRef]
- von Arx, G.; Graf Pannatier, E.; Thimonier, A.; Rebetez, M. Microclimate in Forests with Varying Leaf Area Index and Soil Moisture: Potential Implications for Seedling Establishment in a Changing Climate. J. Ecol. 2013, 101, 1201–1213. [Google Scholar] [CrossRef]
- Terando, A.; Youngsteadt, E.; Meineke, E.; Prado, S. Accurate near Surface Air Temperature Measurements Are Necessary to Gauge Large-Scale Ecological Responses to Global Climate Change. Ecol. Evol. 2018, 8, 5233–5234. [Google Scholar] [CrossRef] [PubMed]
- Moreno Rodríguez, J.M.; Cruz Treviño, A.; Martínez Lope, C. Evaluación Preliminar De Los Impactos En España Por Efecto Del Cambio Climático: Proyecto ECCE-Informe Final; Centro de Publicaciones, Ministerio de Medio Ambiente: Madrid, Spain, 2005; ISBN 978-84-8320-303-3. [Google Scholar]
- Allen, K.A.; Harris, M.P.K.; Marrs, R.H. Matrix Modelling of Prescribed Burning in Calluna Vulgaris-Dominated Moorland: Short Burning Rotations Minimize Carbon Loss at Increased Wildfire Frequencies. J. Appl. Ecol. 2013, 50, 614–624. [Google Scholar] [CrossRef]
- Aponte, C.; de Groot, W.J.; Wotton, B.M. Forest Fires and Climate Change: Causes, Consequences and Management Options. Int. J. Wildland Fire 2016, 25, i–ii. [Google Scholar] [CrossRef]
- Bellingham, P.J.; Sparrow, A.D. Resprouting as a Life History Strategy in Woody Plant Communities. Oikos 2000, 89, 409–416. [Google Scholar] [CrossRef]
- Bond, W.J.; Keeley, J.E. Fire as a Global ‘Herbivore’: The Ecology and Evolution of Flammable Ecosystems. Trends Ecol. Evol. 2005, 20, 387–394. [Google Scholar] [CrossRef]
- Gustafson, E.J.; Shvidenko, A.Z.; Sturtevant, B.R.; Scheller, R.M. Predicting Global Change Effects on Forest Biomass and Composition in South-central Siberia. Ecol. Appl. 2010, 20, 700–715. [Google Scholar] [CrossRef]
- Costea, C. Codrul Grădinărit; Editura Agro-silvica: Bucharest, Romania, 1962. [Google Scholar]
- Ciceu, A.; Duro, J.G.; Aponte, C.; Pascu, I.S.; Claudiu-Dobre, A.; Zamfira, V.; Leca, Ş.; Pitar, D.; Apostol, B.; Apostol, E.N.; et al. Landis-II simulation model integration in Romania’s forest management. Rev. De Silvic. Si Cineg. 2020, 25, 47–55. [Google Scholar]
- Čater, M.; Levanič, T. Beech and Silver Fir’s Response along the Balkan’s Latitudinal Gradient. Sci Rep. 2019, 9, 16269. [Google Scholar] [CrossRef]
- Magh, R.K.; Bonn, B.; Grote, R.; Burzlaff, T.; Pfautsch, S.; Rennenberg, H. Drought Superimposes the Positive Effect of Silver Fir on Water Relations of European Beech in Mature Forest Stands. Forests 2019, 10, 897. [Google Scholar] [CrossRef]
- Töchterle, P.; Yang, F.; Rehschuh, S.; Rehschuh, R.; Ruehr, N.K.; Rennenberg, H.; Dannenmann, M. Hydraulic Water Redistribution by Silver Fir (Abies Alba Mill.) Occurring under Severe Soil Drought. Forests 2020, 11, 162. [Google Scholar] [CrossRef]
- Čater, M.; Kobler, A. Light Response of Fagus Sylvatica L. and Abies Alba Mill. in Different Categories of Forest Edge–Vertical Abundance in Two Silvicultural Systems. For. Ecol. Manag. 2017, 391, 417–426. [Google Scholar] [CrossRef]
- Ciceu, A.; Popa, I.; Leca, S.; Pitar, D.; Chivulescu, S.; Badea, O. Climate Change Effects on Tree Growth from Romanian Forest Monitoring Level II Plots. Sci. Total Environ. 2020, 698, 134129. [Google Scholar] [CrossRef] [PubMed]
- Hengl, T.; de Jesus, J.M.; MacMillan, R.A.; Batjes, N.H.; Heuvelink, G.B.M.; Ribeiro, E.; Samuel-Rosa, A.; Kempen, B.; Leenaars, J.G.B.; Walsh, M.G.; et al. SoilGrids1km–Global Soil Information Based on Automated Mapping. PLoS ONE 2014, 9, e105992. [Google Scholar] [CrossRef] [PubMed]
- Shangguan, W.; Hengl, T.; Mendes de Jesus, J.; Yuan, H.; Dai, Y. Mapping the Global Depth to Bedrock for Land Surface Modeling. J. Adv. Modeling Earth Syst. 2017, 9, 65–88. [Google Scholar] [CrossRef]


Publisher’s Note: MDPI stays neutral with regard to jurisdictional claims in published maps and institutional affiliations. |
© 2021 by the authors. Licensee MDPI, Basel, Switzerland. This article is an open access article distributed under the terms and conditions of the Creative Commons Attribution (CC BY) license (https://creativecommons.org/licenses/by/4.0/).
Share and Cite
García-Duro, J.; Ciceu, A.; Chivulescu, S.; Badea, O.; Tanase, M.A.; Aponte, C. Shifts in Forest Species Composition and Abundance under Climate Change Scenarios in Southern Carpathian Romanian Temperate Forests. Forests 2021, 12, 1434. https://doi.org/10.3390/f12111434
García-Duro J, Ciceu A, Chivulescu S, Badea O, Tanase MA, Aponte C. Shifts in Forest Species Composition and Abundance under Climate Change Scenarios in Southern Carpathian Romanian Temperate Forests. Forests. 2021; 12(11):1434. https://doi.org/10.3390/f12111434
Chicago/Turabian StyleGarcía-Duro, Juan, Albert Ciceu, Serban Chivulescu, Ovidiu Badea, Mihai A. Tanase, and Cristina Aponte. 2021. "Shifts in Forest Species Composition and Abundance under Climate Change Scenarios in Southern Carpathian Romanian Temperate Forests" Forests 12, no. 11: 1434. https://doi.org/10.3390/f12111434
APA StyleGarcía-Duro, J., Ciceu, A., Chivulescu, S., Badea, O., Tanase, M. A., & Aponte, C. (2021). Shifts in Forest Species Composition and Abundance under Climate Change Scenarios in Southern Carpathian Romanian Temperate Forests. Forests, 12(11), 1434. https://doi.org/10.3390/f12111434