Article

Climate Signals for Growth Variations of F. sylvatica, P. abies, and P. sylvestris in Southeast Germany over the Past 50 Years

by
Annette Debel
*,
Wolfgang Jens-Henrik Meier
and
Achim Bräuning
Institute of Geography, Friedrich-Alexander-University Erlangen-Nürnberg, Wetterkreuz 15, 91058 Erlangen, Germany
*
Author to whom correspondence should be addressed.
Forests 2021, 12(11), 1433; https://doi.org/10.3390/f12111433
Submission received: 22 July 2021 / Revised: 15 October 2021 / Accepted: 19 October 2021 / Published: 21 October 2021
(This article belongs to the Special Issue Vulnerability of Forests to Climate Variability and Change)

Abstract

:
Since recent drought events have already caused severe damage to trees and droughts in the near future are expected to occur even more frequently, this study investigated the response of forest ecosystems to changing climate conditions in the topographically complex region of Bavaria, southeast Germany. For this purpose, climate–growth relationships of important European deciduous and coniferous tree species were investigated over the past 50 years at three middle mountain ranges and corresponding basins. A response analysis between tree-ring width and climate variables was applied to detect modifications in tree responses comparing two 25-year periods at individual forest sites. Furthermore, tree responses to climatic extreme years and seasons were analyzed using a superposed epoch analysis. The results showed that Scots pine (Pinus sylvestris) proved to be the most vulnerable and least drought-resistant of all investigated tree species. Likewise, Norway spruce (Picea abies) and European beech (Fagus sylvatica) revealed a higher drought sensitivity over the past 25 years, even though an extended growing season partially improved tree growth at high-elevation sites. In conclusion, all studied tree species were affected by drought events, even at humid high-elevation sites. Correlations with daily climate variables confirmed that even short-term weather conditions could strongly influence trees’ radial growth. Tree responses to climate conditions have shifted significantly between past and present periods but vary considerably among sites and are generally stronger in humid regions than in already dry areas.

1. Introduction

According to climate models, temperatures and summer drought stress will increase in southern Germany within the 21st century [1], but climate change is already perceptible: summer months have already become hotter and drier [2]. The previous summer heat record of 2003 [3,4] was recently exceeded by the heat record of 2018. In addition, 2019 was also listed as an exceptionally hot summer [5].
As water availability is the primary growth-limiting factor for most European tree species [6], current reports on the state of forests in Central Europe are alarming [5]. Scientists and foresters detected a decreasing vitality of European tree species and a rising incidence of tree mortality [4,5]. Since forest ecosystems are complex and influenced by numerous factors besides climate, the combination of environmental factors leading to tree mortality is not yet fully understood [7,8]. In addition, climate sensitivity differs between tree species, and the level of resilience is species-specific [6,7,9,10]. For example, Picea abies, which has been preferred in forestry and frequently planted outside of its natural distribution range, appears to be most vulnerable to future warming and drier climate conditions [11,12,13,14,15,16].
However, despite such negative effects, under certain conditions, climate warming can also enhance forest productivity in Europe, especially in mountainous regions and at sites not limited by water availability [17]. At higher elevations, warmer temperatures can lead to improved growth conditions [18] and a prolonged growing season [14,17,19]. Besides elevation effects, mountain regions also cause windward lee effects, which strongly modify precipitation patterns depending on the position of topographic barriers towards the dominant wind direction during precipitation events. Hence, climate change accompanied by increasing drought events may not affect all forest ecosystems equally, especially in complex topography. Consequently, the response of forest growth to altering climate conditions must be studied at a local scale, taking the modifying influence of topography into account.
Therefore, this study explores the climate–growth response of economically important broadleaved and conifer tree species in the Free State of Bavaria in southeast Germany with regard to increasingly drier and warmer weather conditions over the past 50 years. The investigated forests are located in Bavarian middle mountain ranges and nearby topographic basins, involving three different bioclimatic zones (intermediate, subcontinental, boreal), which comprise the ecological range for forest ecosystems [20]. Although several studies have already examined the climate–growth relationships of European tree species in southern Germany [6,21,22,23], this approach is new, because several tree species are compared at study sites exhibiting both an elevation and a precipitation gradient.
We hypothesize that climate–growth relationships have changed within the past 50 years and that significant differences in tree response between forest sites may occur even over very short distances due to the influence of topography on the local climatic conditions. Hence, climate–growth relationships of both coniferous and deciduous tree species were analyzed using the climate parameters air temperature, precipitation, and the associated standardized precipitation evapotranspiration index (SPEI) [24] in monthly resolution [25]. In addition, we correlated daily precipitation sums and daily maximum air temperatures with tree-ring widths to detect even short-term impacts of climate on growth responses [25,26].

2. Materials and Methods

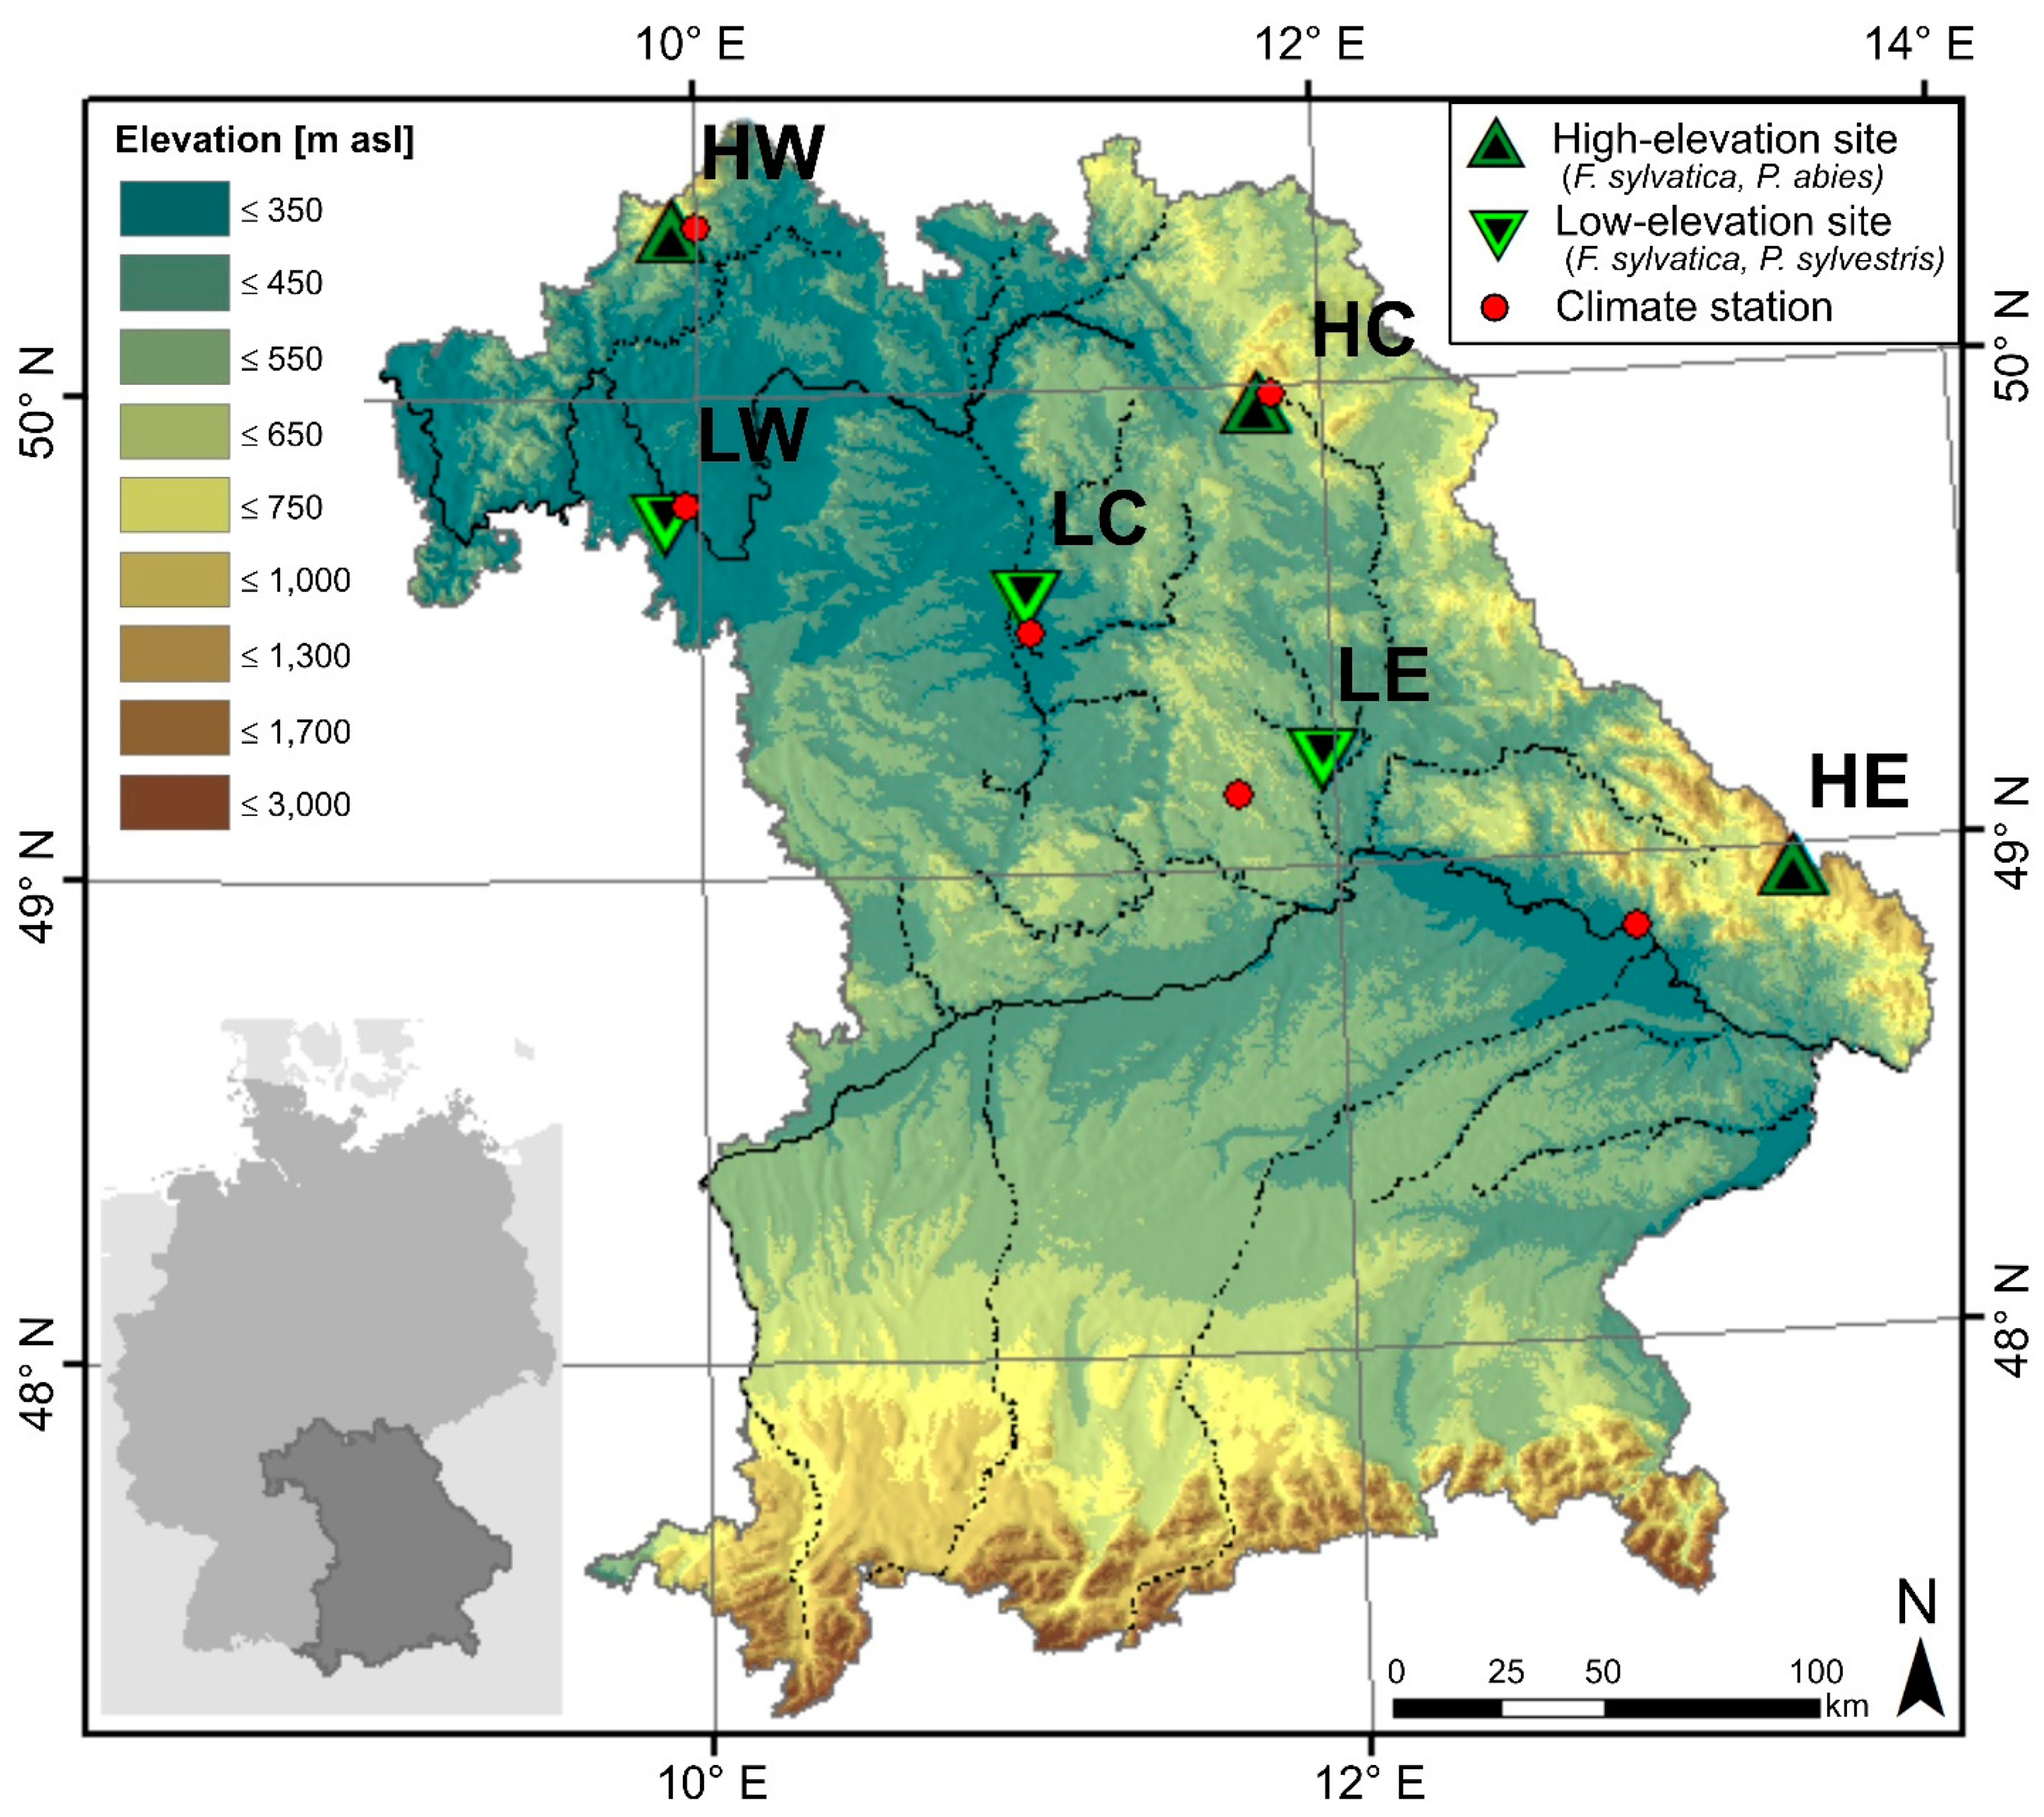
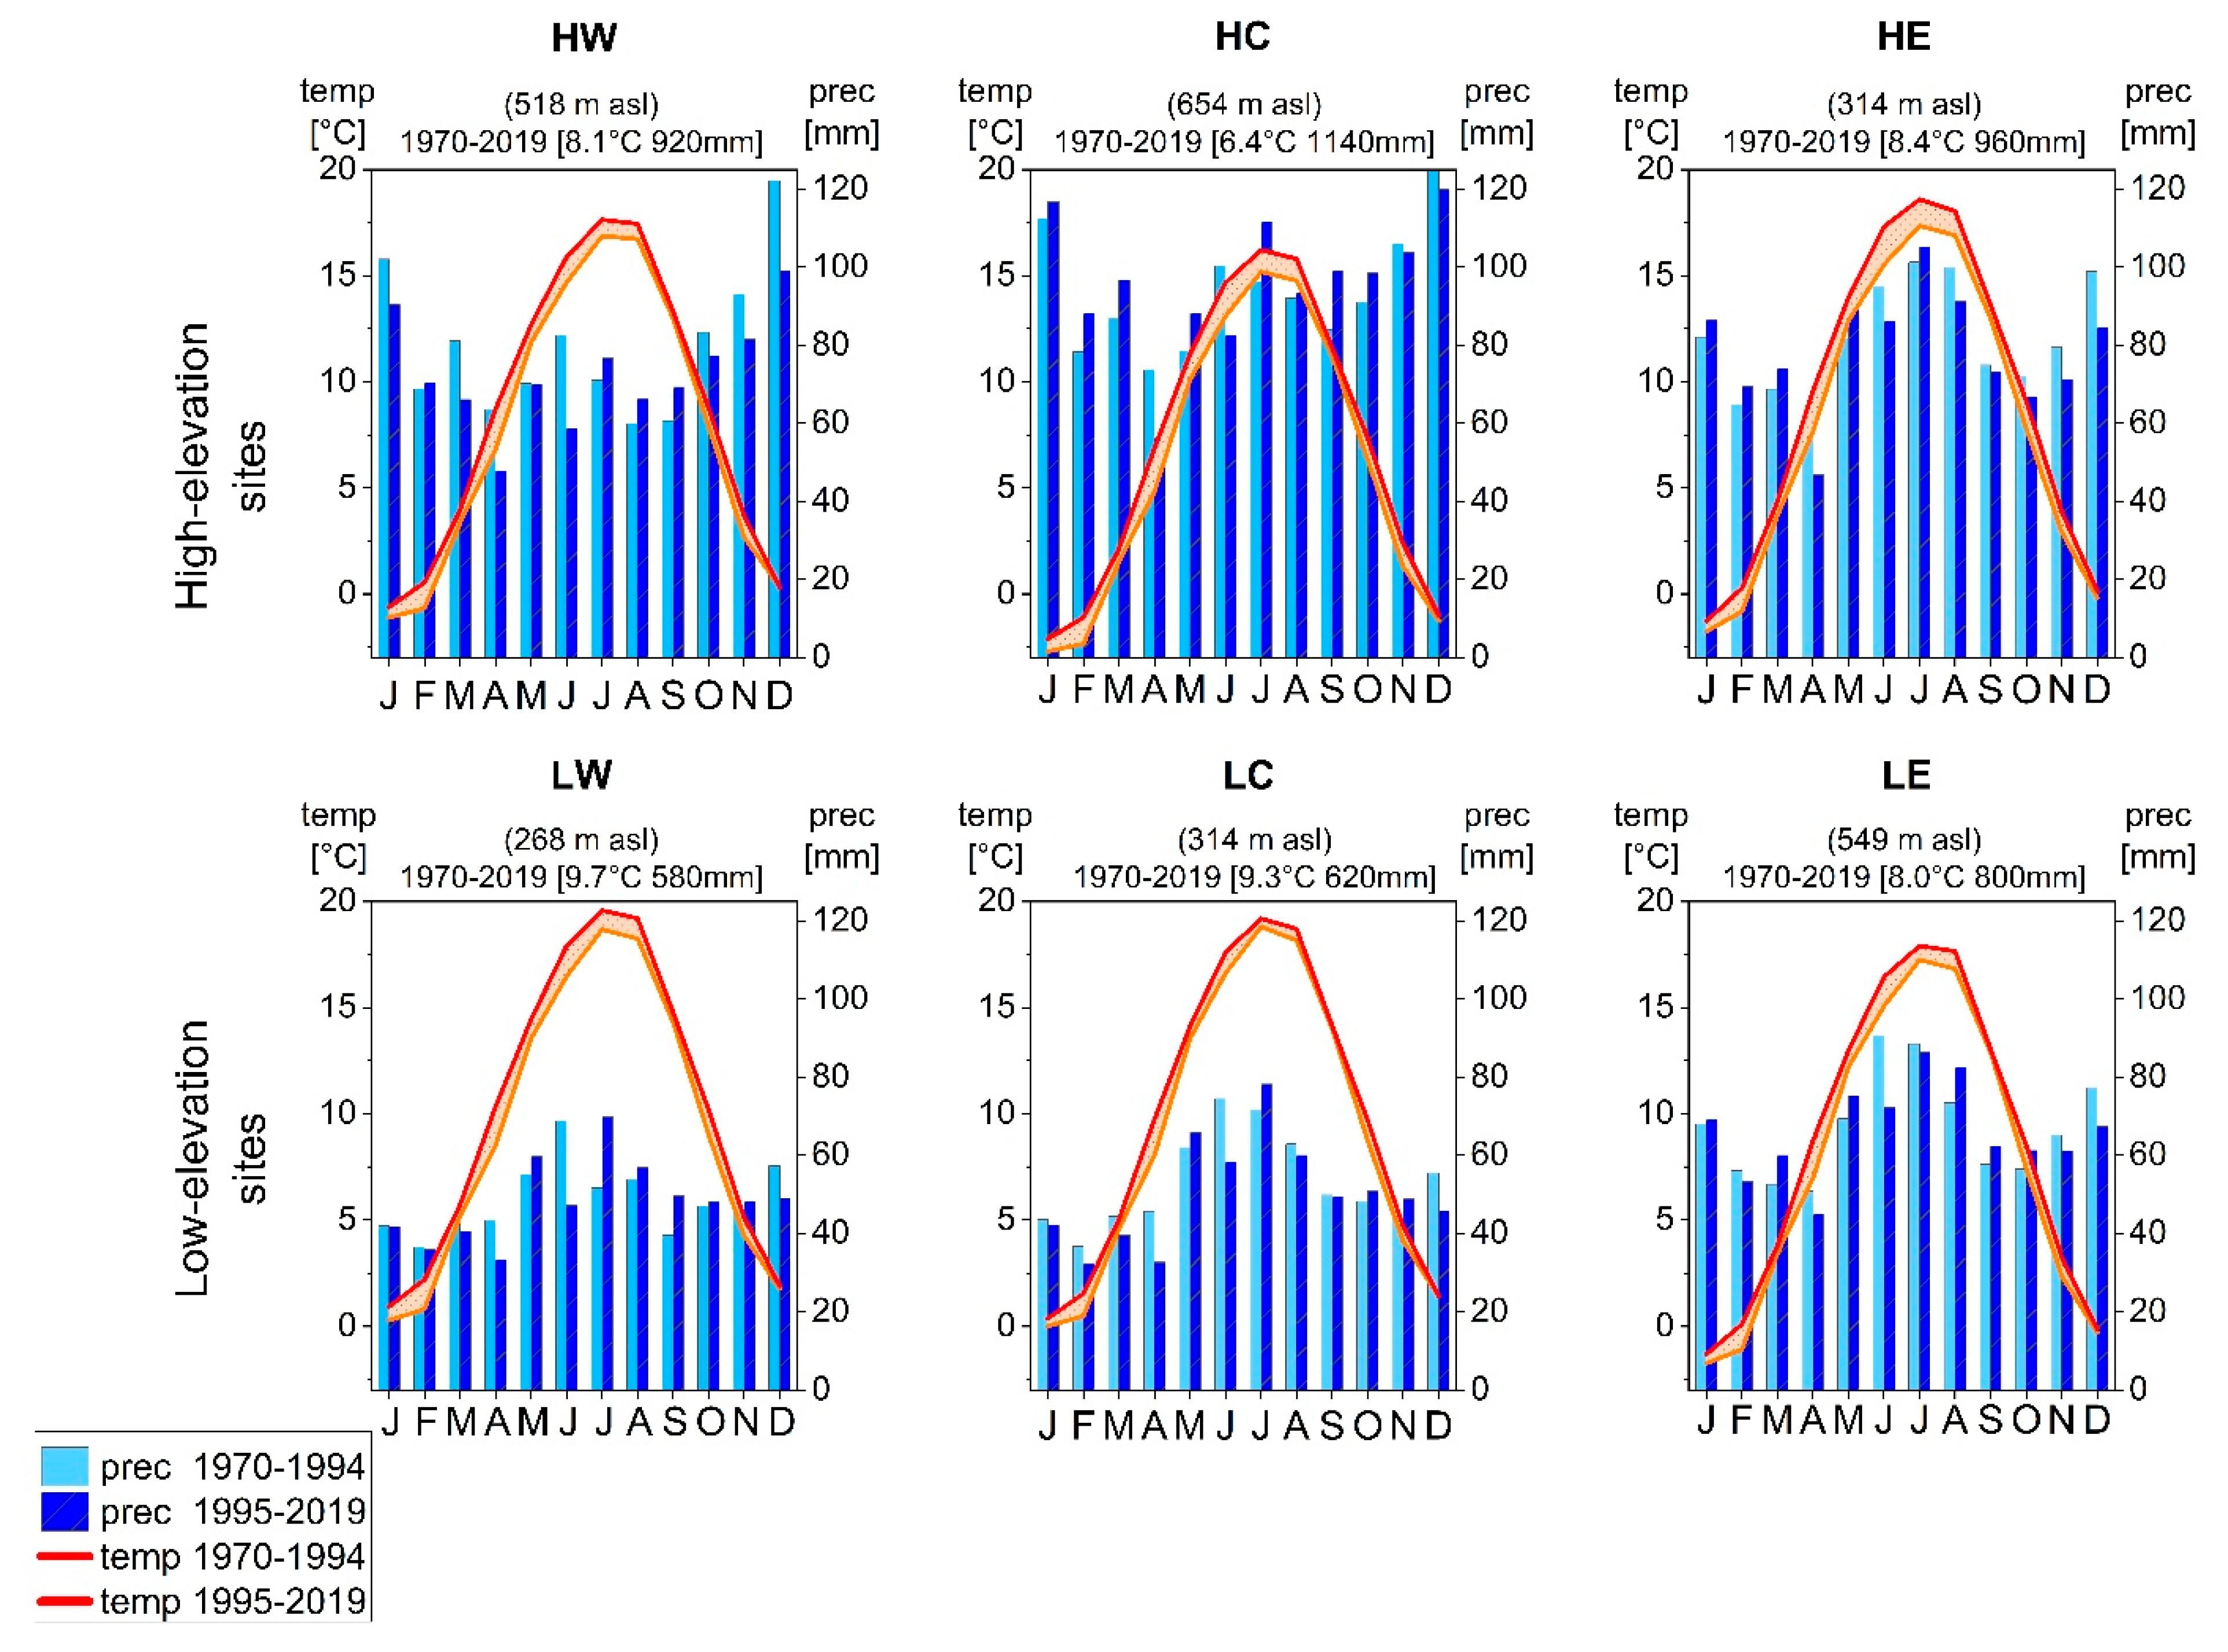
2.1. Study Area and Sample Collection

The studied forest sites are located in southeast Germany, in the Free State of Bavaria. Three low- and three high-elevation sites from the middle mountain ranges were chosen for the analysis (Figure 1). As deciduous tree species, European beech (Fagus sylvatica) was selected because it is present at both altitudinal levels, whereas the coniferous tree species Norway spruce (Picea abies) is dominant at high-elevation and Scots pine (Pinus sylvestris) at low-elevation sites. The forests at Bad Brückenau (Rhoen), Wunsiedel (Fichtel Mountains), and Grafenau (Bavarian Forest) represent the high-elevation sites and are all located in Bavarian middle mountain ranges. In the following, we use a combination of symbolic letters for high-elevation (H) and low-elevation (L) sites with their location in the west (W), center (C), or east (E) of the study region, respectively. From west to east, the high-elevation sites are abbreviated with HW for Bad Brückenau, HC for Wunsiedel, and HE for Grafenau, while the low-elevation sites located in basins in the rain shadow of the mountain ranges are called LW for Würzburg, LC for Tennenlohe, and LE for Burglengenfeld (Table 1).
Due to these diverse topographic and elevation features, different climate conditions prevail at each site. The mean annual precipitation sum at high-elevation sites is higher than those of low-elevation sites and ranges between 580 mm a−1 at LW (Würzburg) and 1,140 mm a−1 in the Fichtel Mountains (HC) [27]. Mean annual temperature is higher at low-elevation sites and ranges between 9.7 °C at LW (Würzburg) and 6.4 °C at HC (Wunsiedel) [27].
At each sampling location, at least 15 dominant and healthy trees were sampled with a 5.0 mm diameter increment borer (Mora, Sweden) at breast height. To avoid anomalies caused by eccentric growth, at least two cores were taken from each tree [28]. Tree-ring-widths were measured with a LINTAB 6 measuring system (Rinntech, Heidelberg, Germany) with a precision of 0.01 mm.

2.2. Statistical Analysis

All tree-ring series were measured, visually cross-dated, and statistically evaluated by t-test and sign-test “Gleichläufigkeit” values using the software TSAP-Win (Rinntech, Heidelberg, Germany) [29,30]. The established ring-width site chronologies were cross-checked with tree-ring series obtained from the International Tree-Ring Data Bank (https://www.ncdc.noaa.gov/data-access/paleoclimatology-data/datasets/tree-ring, accessed on 5 September 2019) [31].
After merging the individual cores of the same tree, the tree-ring series were detrended by applying a 25-year cubic smoothing spline within the package dplR [32] implemented in the open-source statistical language R [33]. In doing so, multidecadal and short-term variability related to climate variations were retained in the resulting tree-ring indices, whereas long-term biological growth trends were removed. Subsequently, a master chronology for each site was established by averaging the individual ring-width indices calculating a biweight robust mean [32]. Due to the availability of complete climate data and tree-ring chronologies, climate–growth analyses were performed with the final chronologies for the past 50 years (1970–2019). For that purpose, monthly as well as daily climate station data (precipitation sum, mean air temperature/maximum air temperature) for the common observation period were derived from the Climate Data Center (https://cdc.dwd.de/portal/, accessed on 3 November 2020) provided by the German Meteorological Service [27]. The Standardized Precipitation-Evapotranspiration Index (SPEI) was calculated for one, two, and three months based on monthly temperature and precipitation data of the individual climate stations within the R-package SPEI [24].
Using the R-package dendroTools [25], correlations between tree growth and climate variables were compared for one subperiod in the past (subperiod I: 1970–1994) and one recent subperiod (subperiod II: 1995–2019) based on daily and monthly climate data. The correlation between RWI and the drought index was calculated with a 2-month SPEI. All calculations were performed using Pearson’s correlation coefficients, significant at the confidence level of p < 0.05. In addition, the correlation coefficients were tested for robustness by applying a bootstrap procedure with 1000 replicates [34]. The resulting values illustrate the correlation coefficients of the first day of a time window (21 to 91 days). Therefore, each value represents an interval between three weeks and three months.

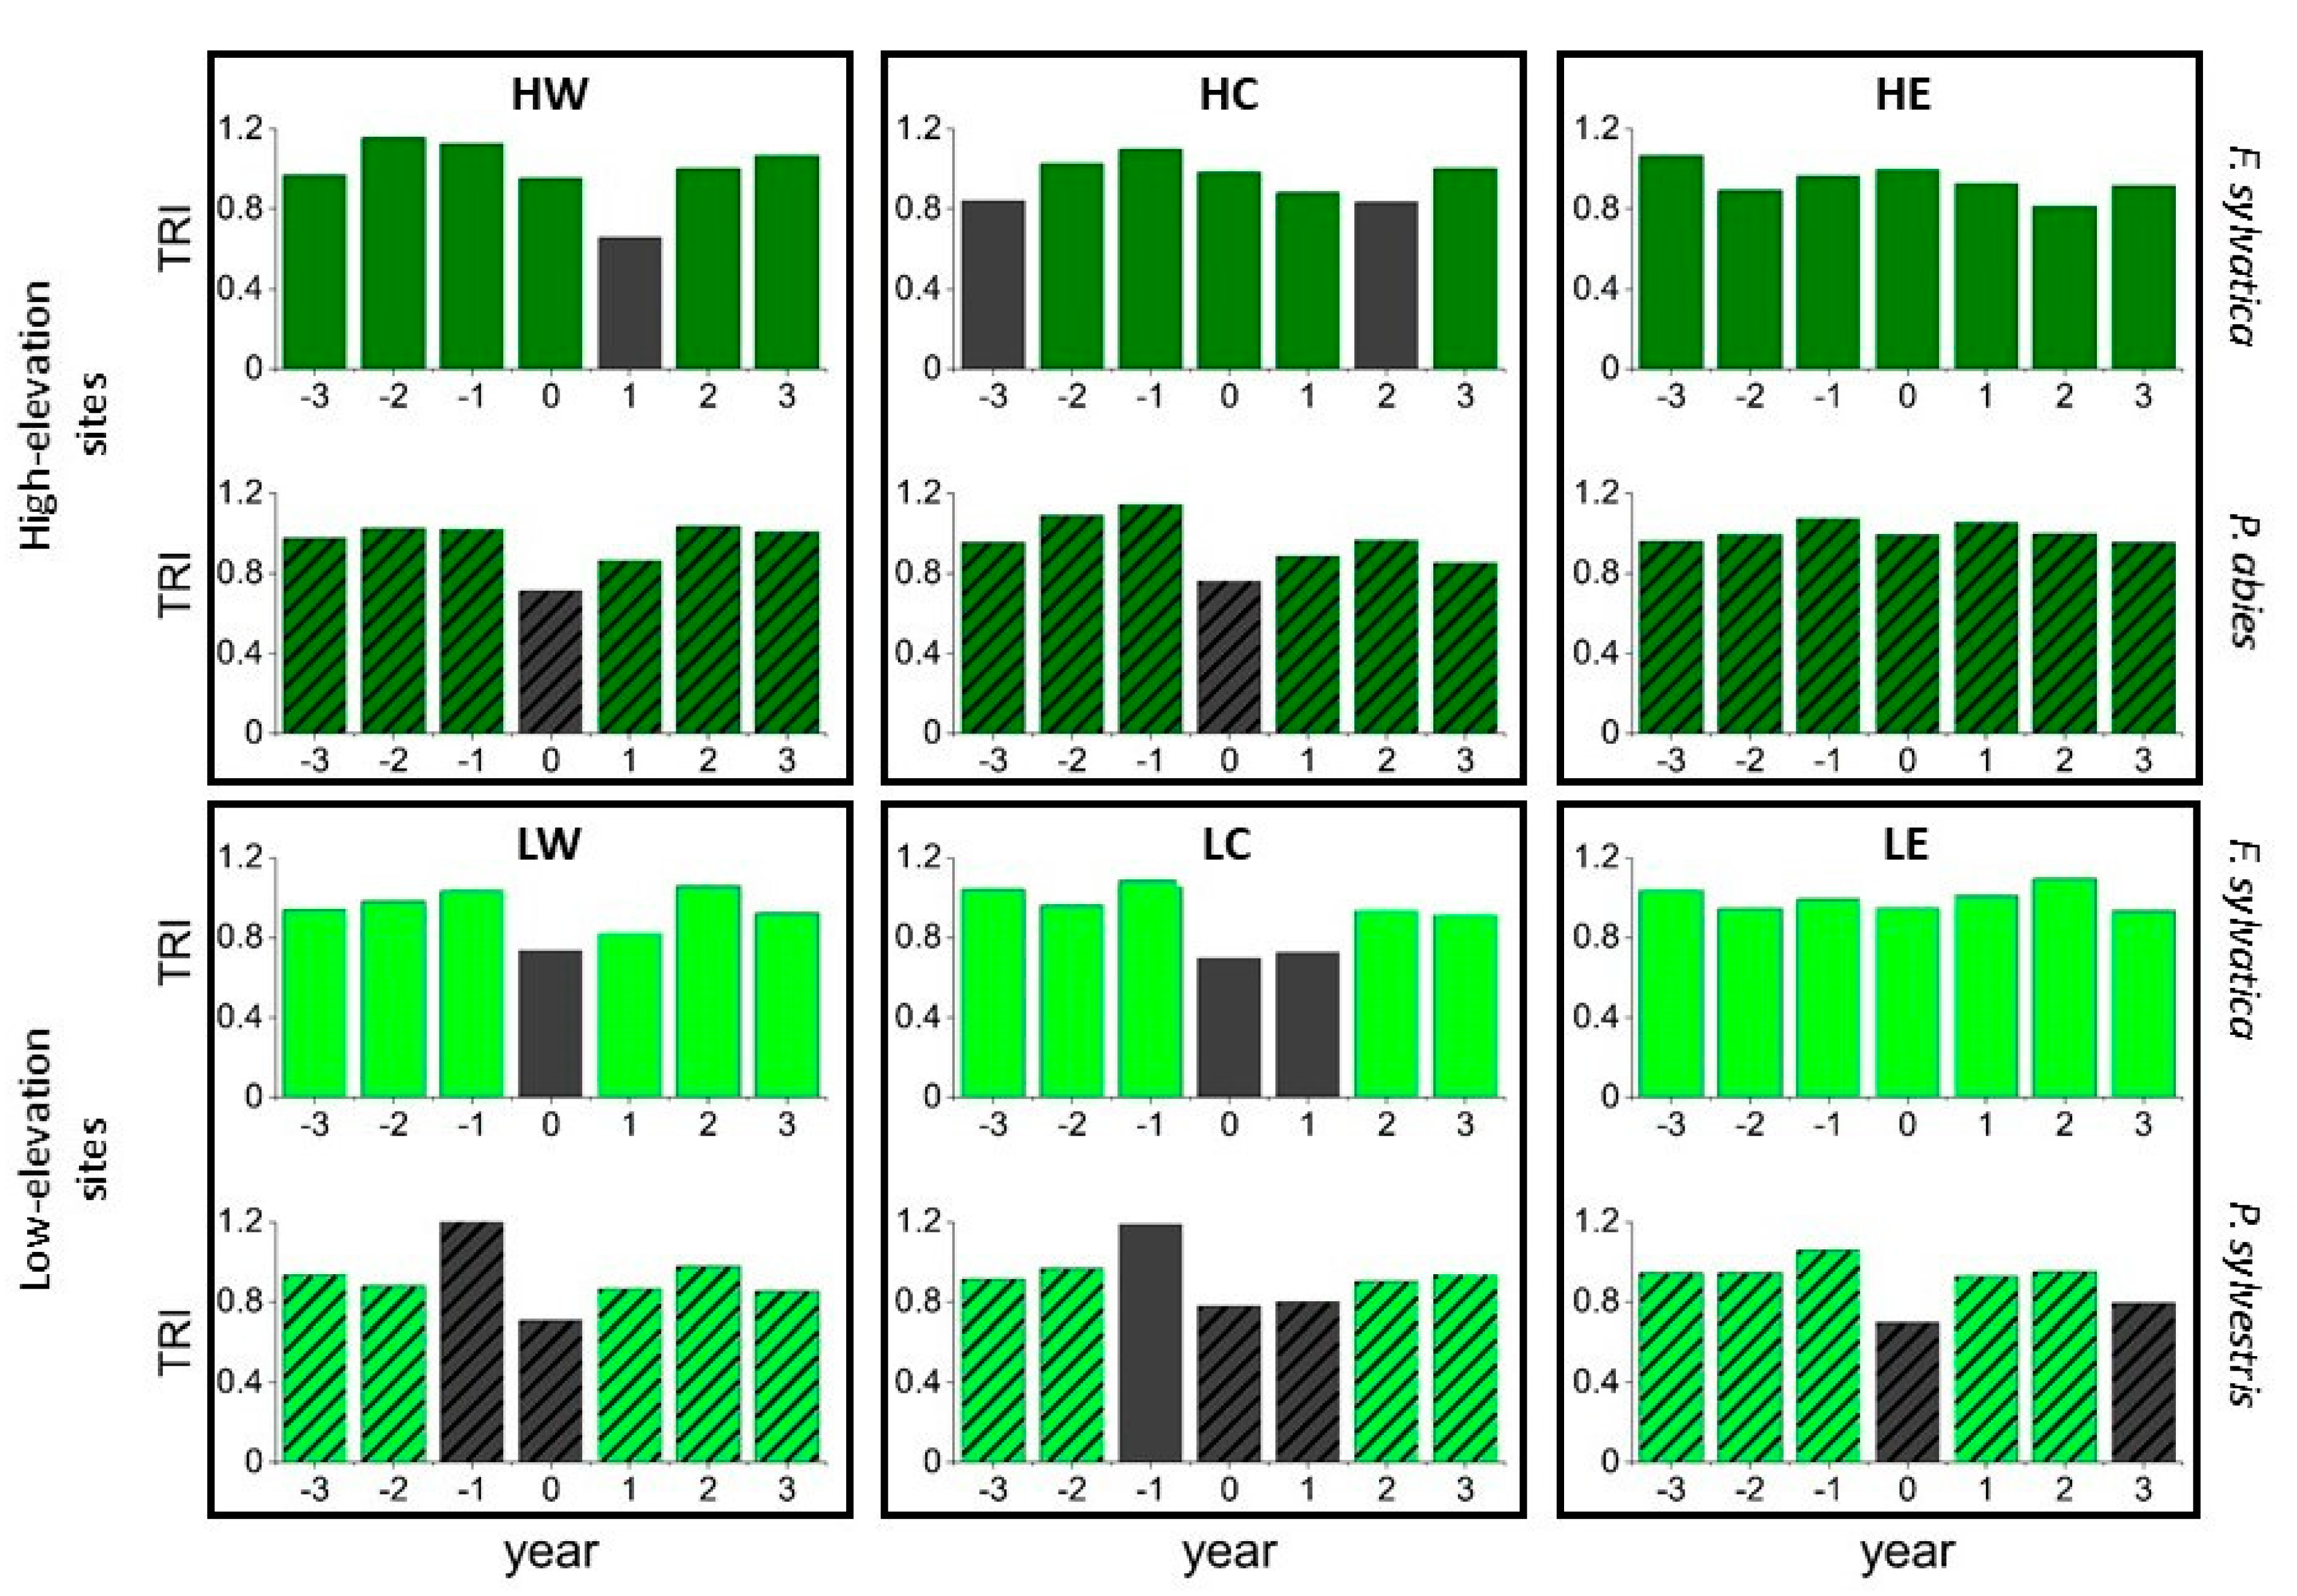
2.3. Pointer Year Analysis and Superposed Epoch Analysis

Abrupt growth variations were investigated by a pointer year analysis of each site’s tree-ring series using the R package pointRes [35]. In accordance with Schweingruber et al. [36], pointer years were defined as the five narrowest years relative to the average growth of the four preceding years. To identify the climatic forcing underlying the growth declines, each pointer year was compared to local climate data. A Superposed Epoch Analysis (SEA) was carried out to assess tree response and resilience to pointer years [37]. The SEA was run with the package dplR [37] and shows the mean growth pattern prior to, during, and after a pointer year. To reveal the differences between local and larger-scale effects, SEA were calculated for exceptional known drought years in Europe (1976, 2003, and 2018), but also for local extreme years and seasons. Local extreme years were defined as the lowest decile in terms of precipitation sums at the respective climate stations.

3. Results

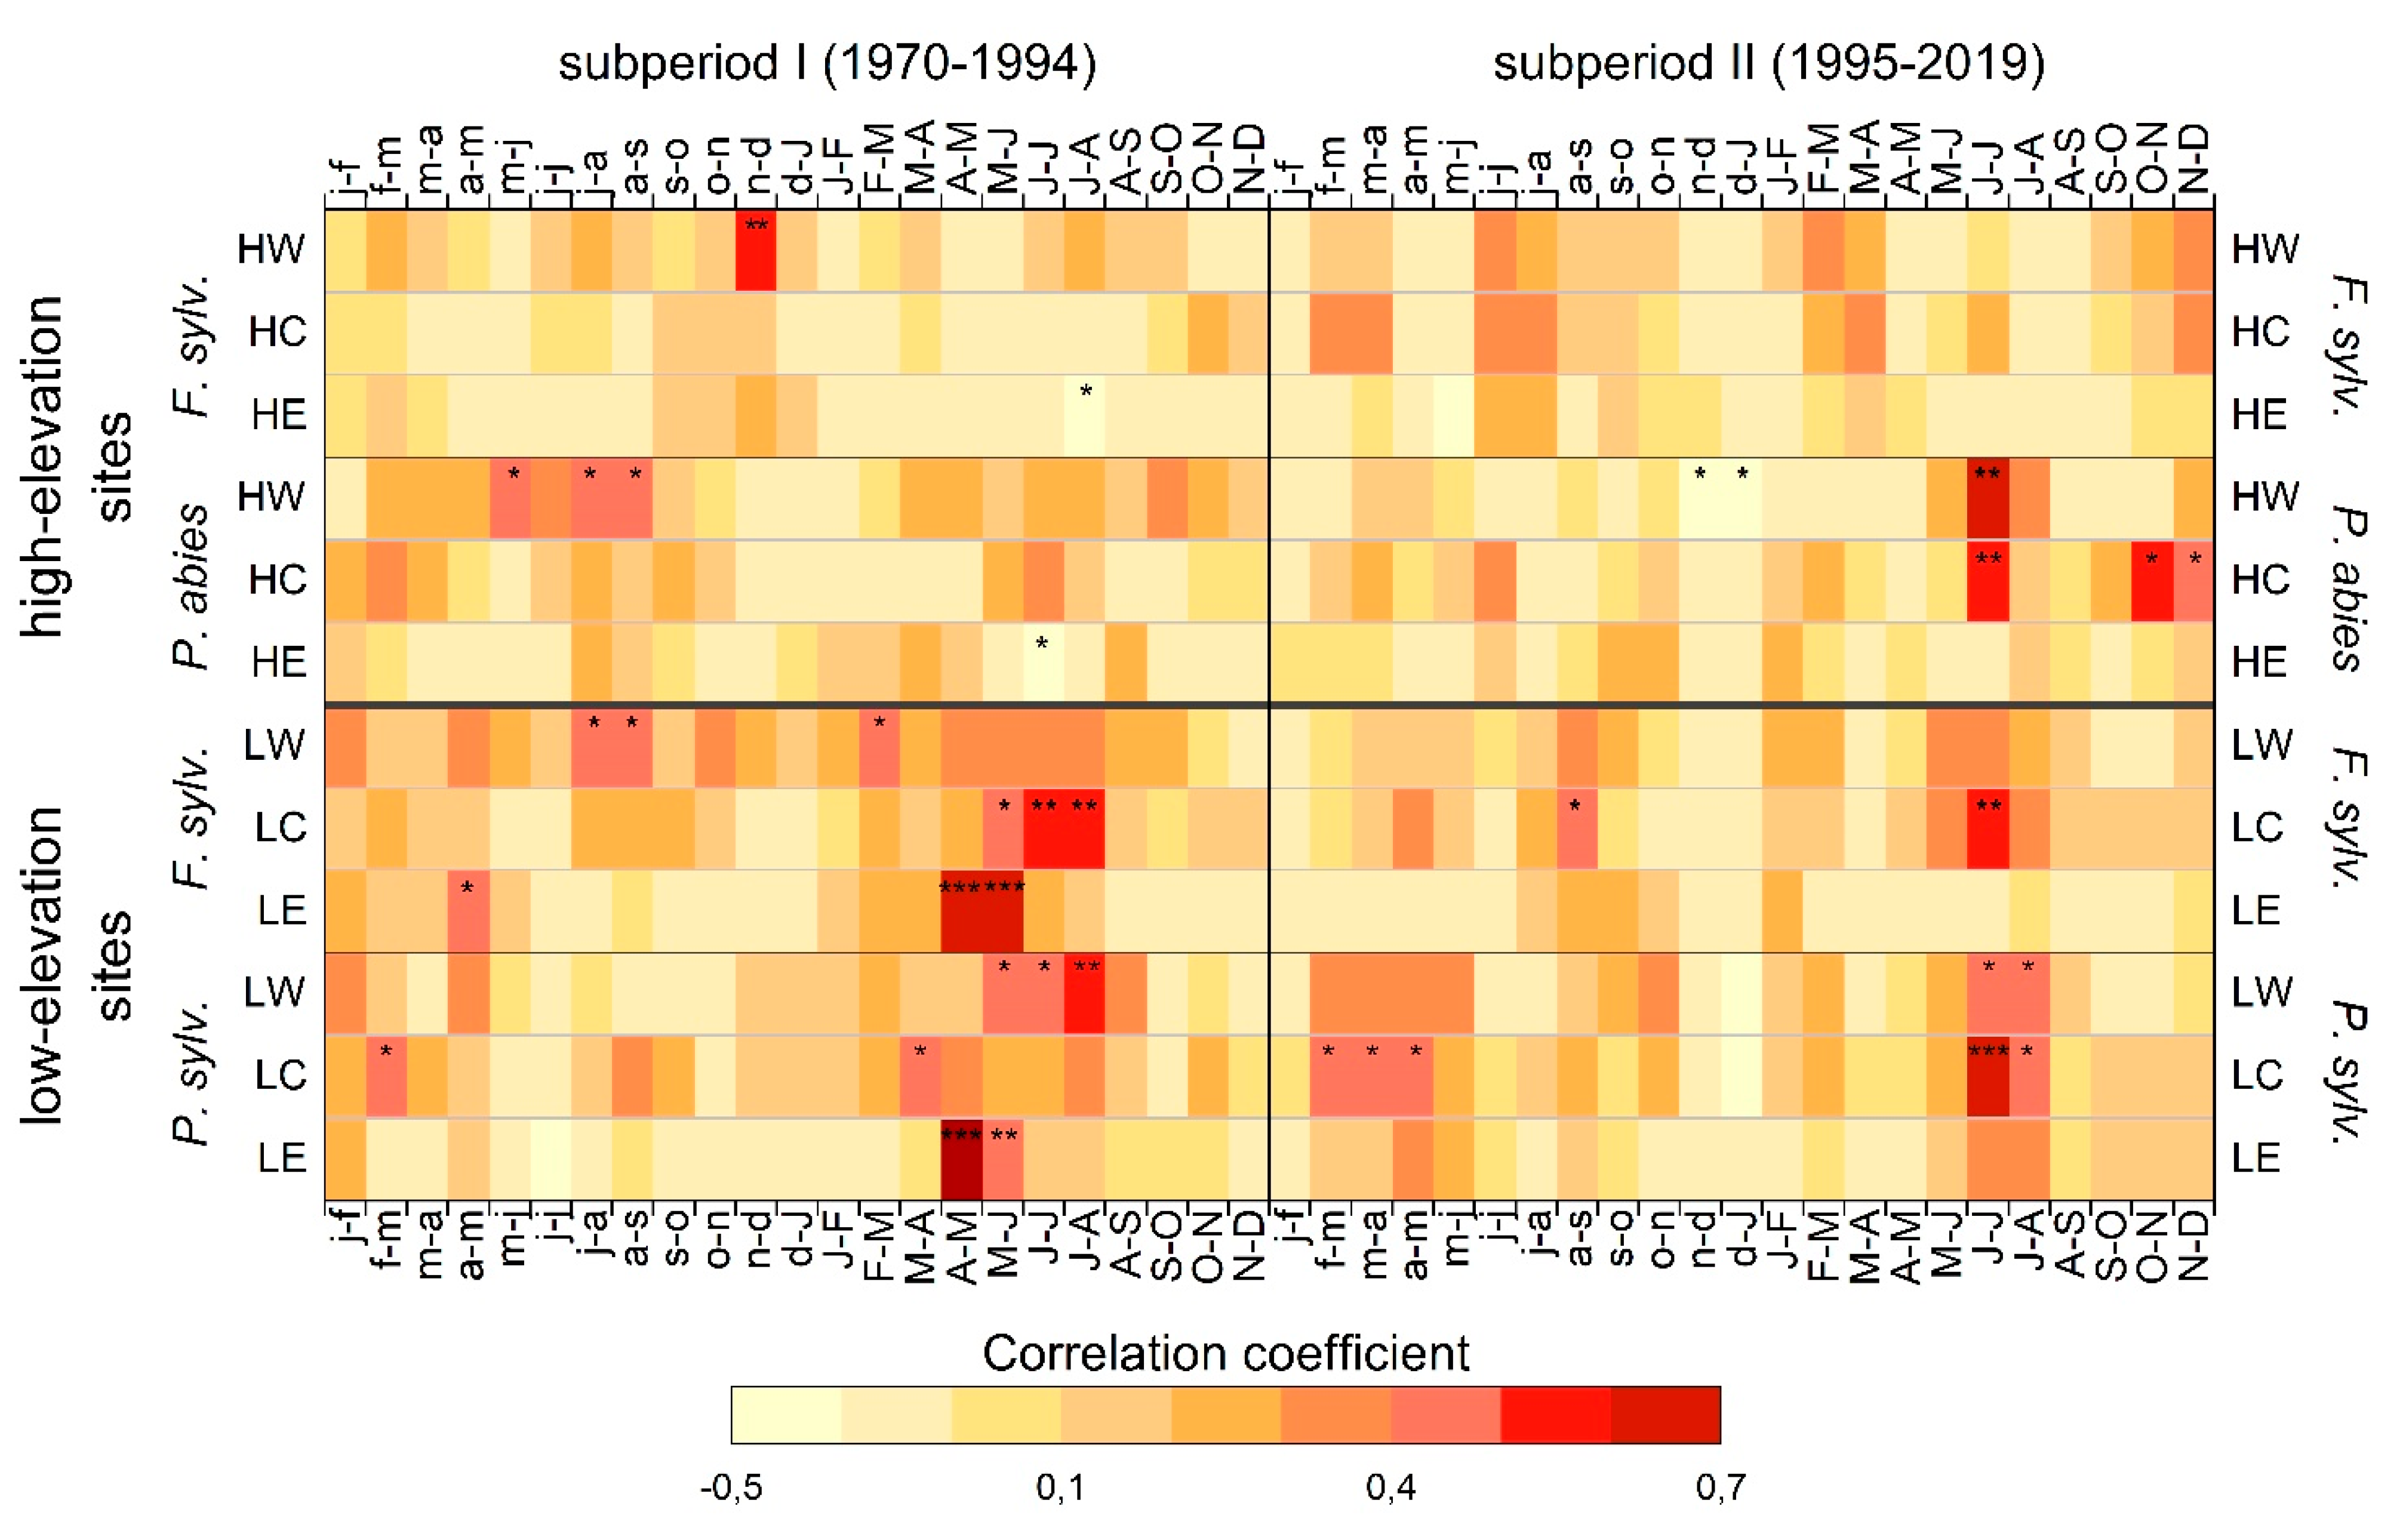
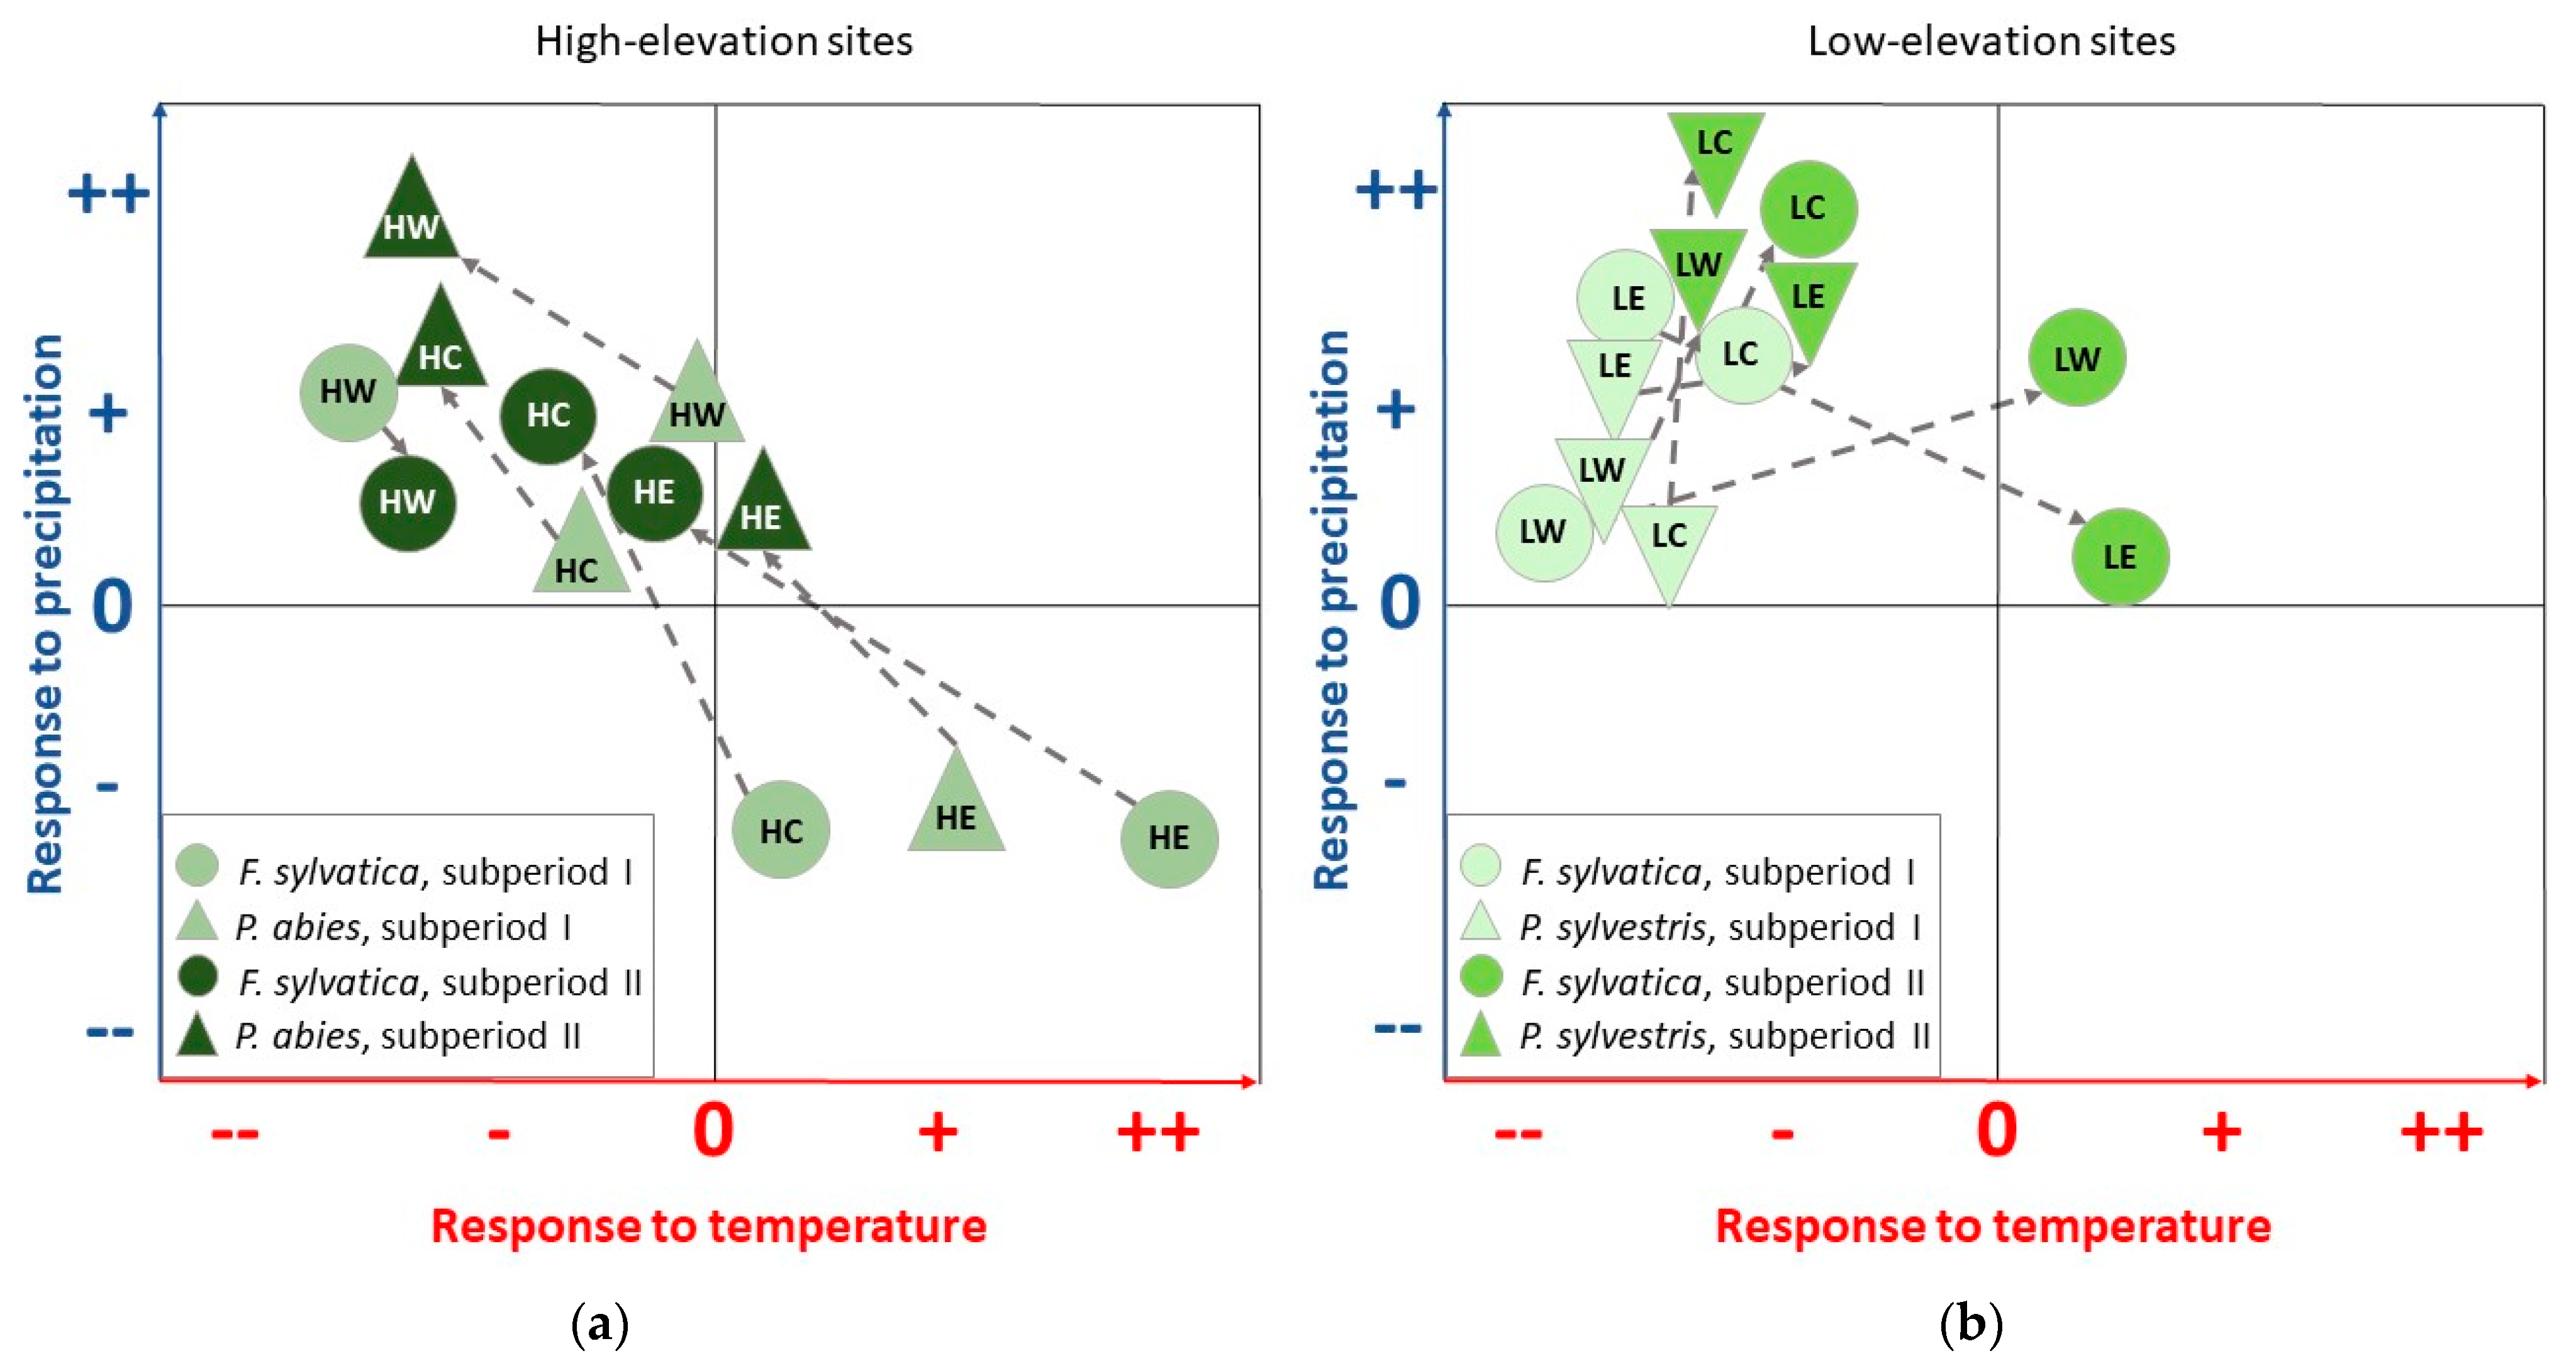
3.1. Climate–Growth Relationships

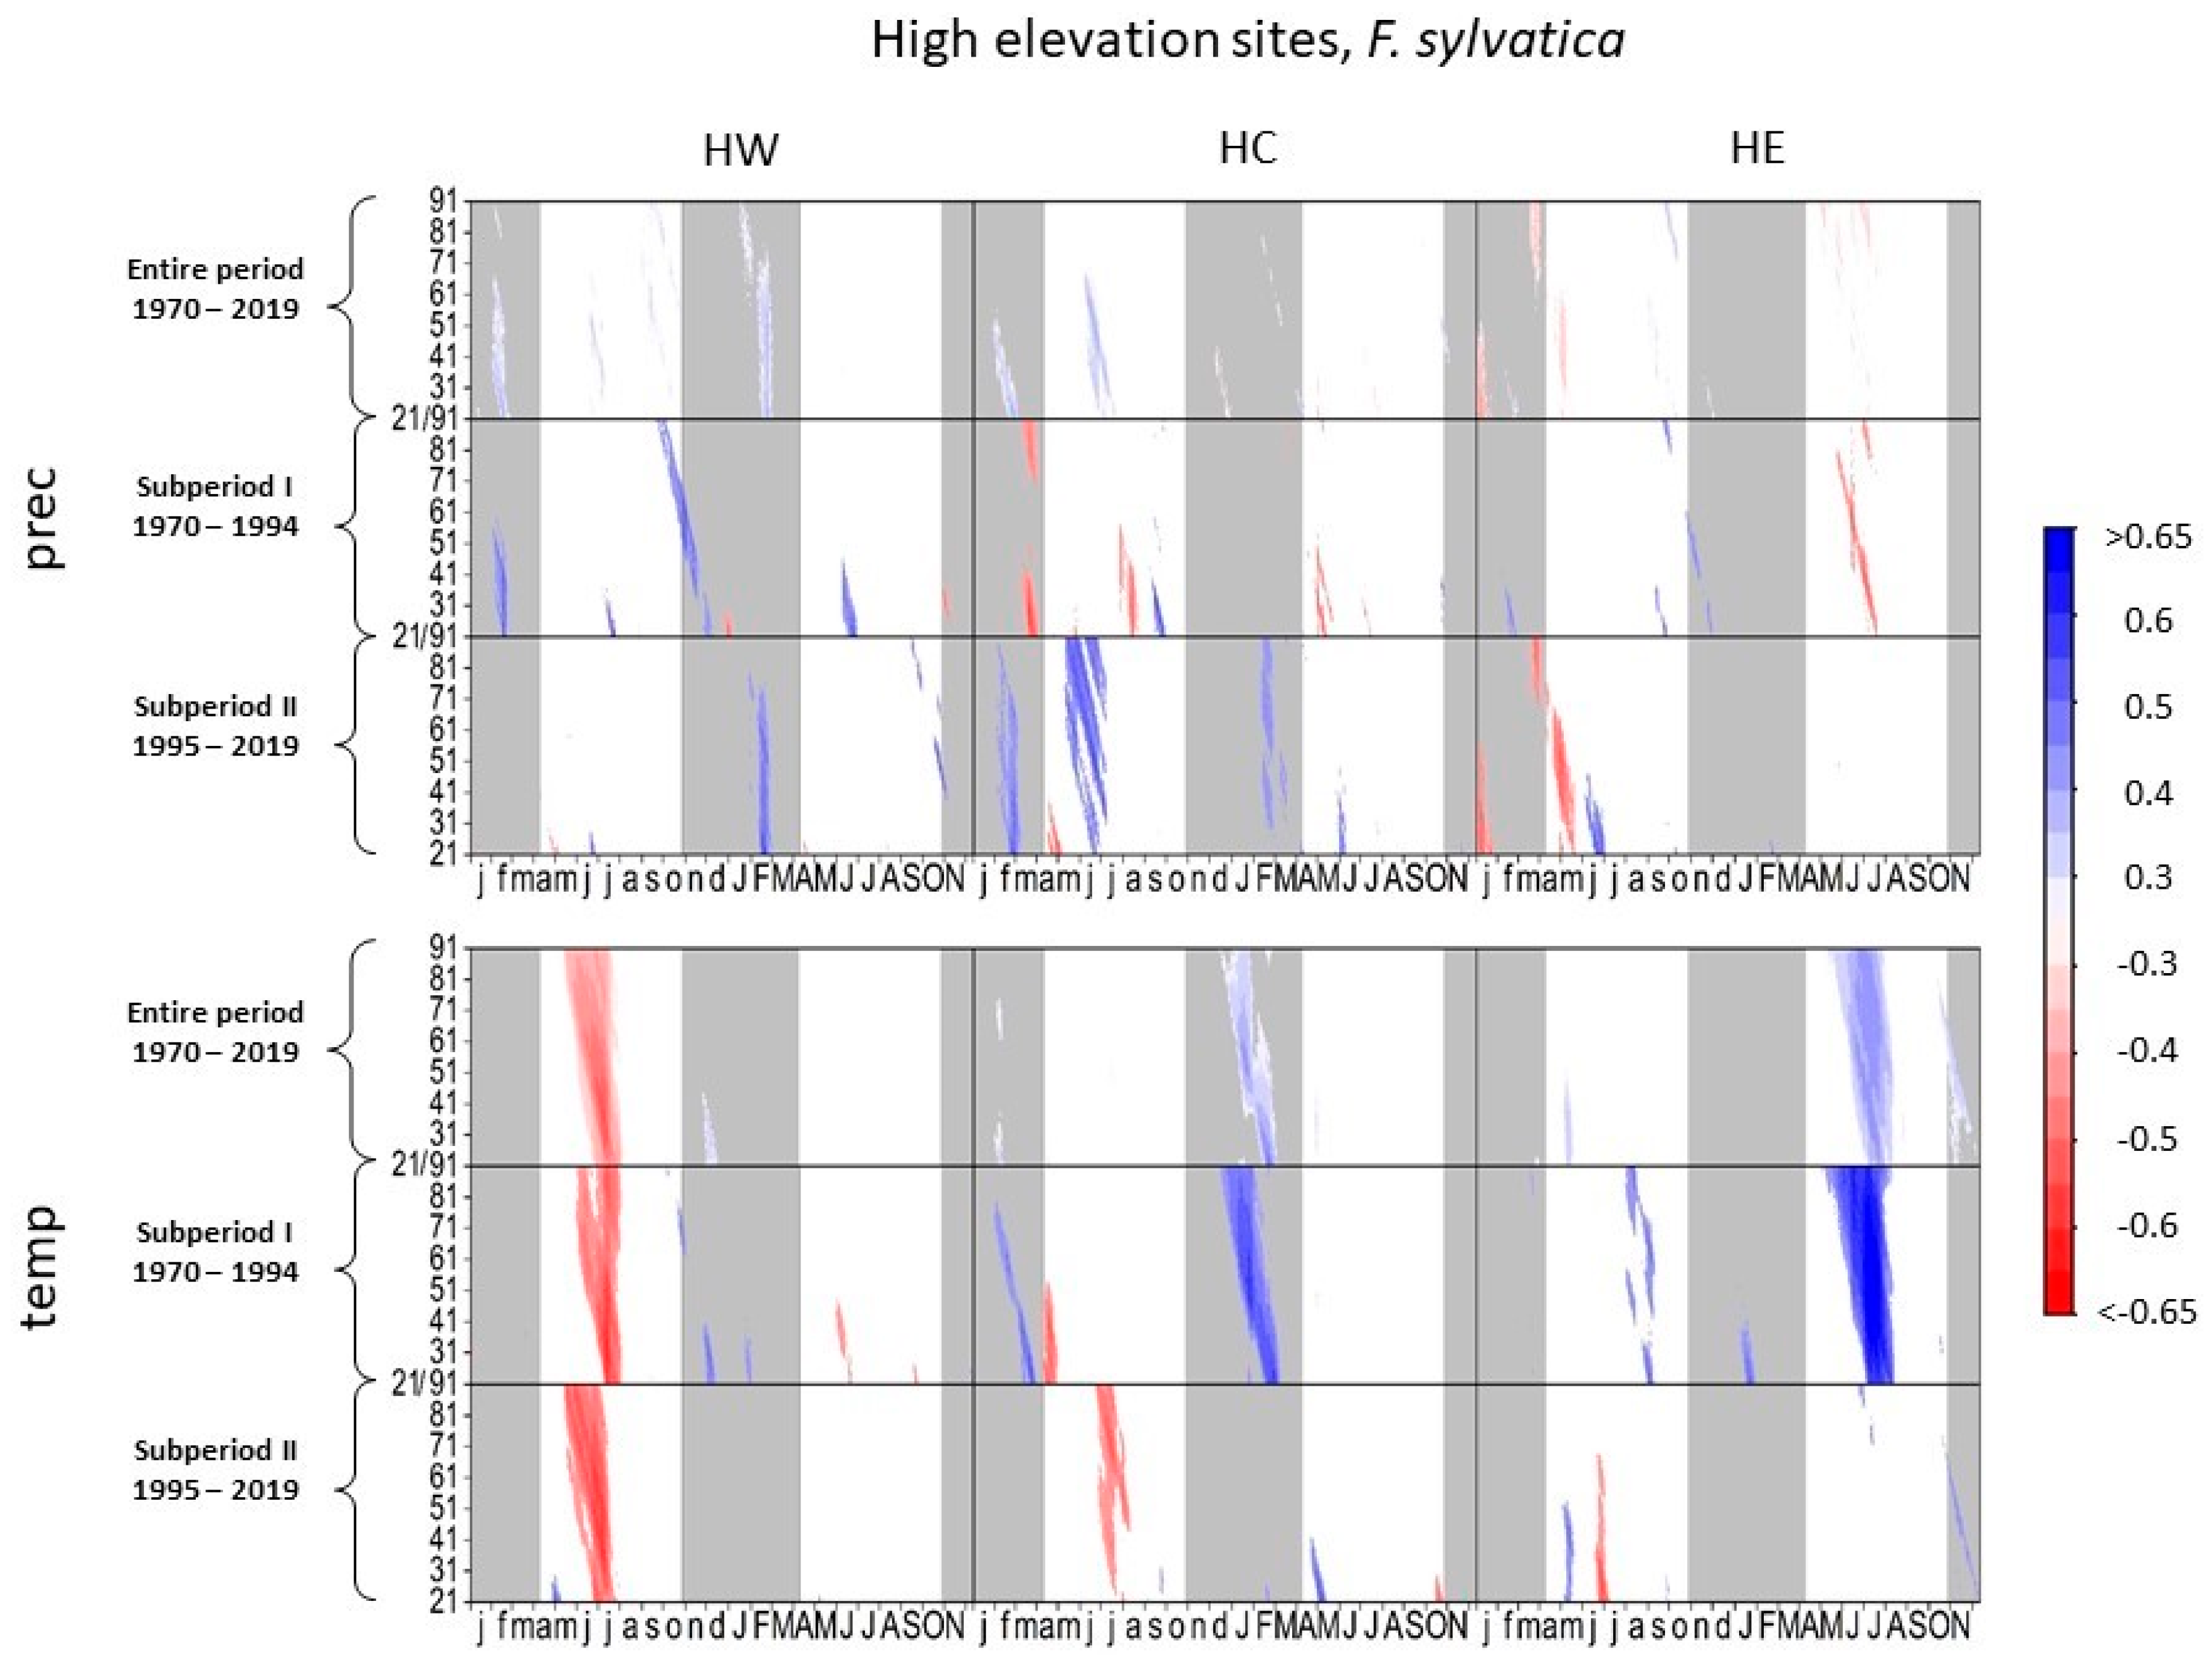
3.1.1. European Beech at High-Elevation Sites

Figure 2 and Figure 3 illustrate the climate–growth relationships considering the months of the previous and current growth year based on daily maximum temperature and precipitation data. Comparing subperiods I and II, the response of beech growth to precipitation changed significantly at high elevations (Figure 2).
High precipitation in current and previous spring and summer was detrimental to tree growth at HE and HC in subperiod I, whereas the correlation patterns in spring and summer reversed in subperiod II. Higher precipitation in the current (HC) and previous year (HC and HE) enhanced tree growth. Growth variation of beech at HW responded positively to summer precipitation in subperiod I, while this correlation pattern is rarely observed during subperiod II.Late summer temperatures of the previous year correlated negatively with beech growth at all high-elevation sites in subperiod II. Higher temperatures in the current summer at HE and in the current and previous spring at HC positively affected beech growth in subperiod I. In subperiod II, HC was the only site where a significant positive response to higher temperatures in the current year still occurred.

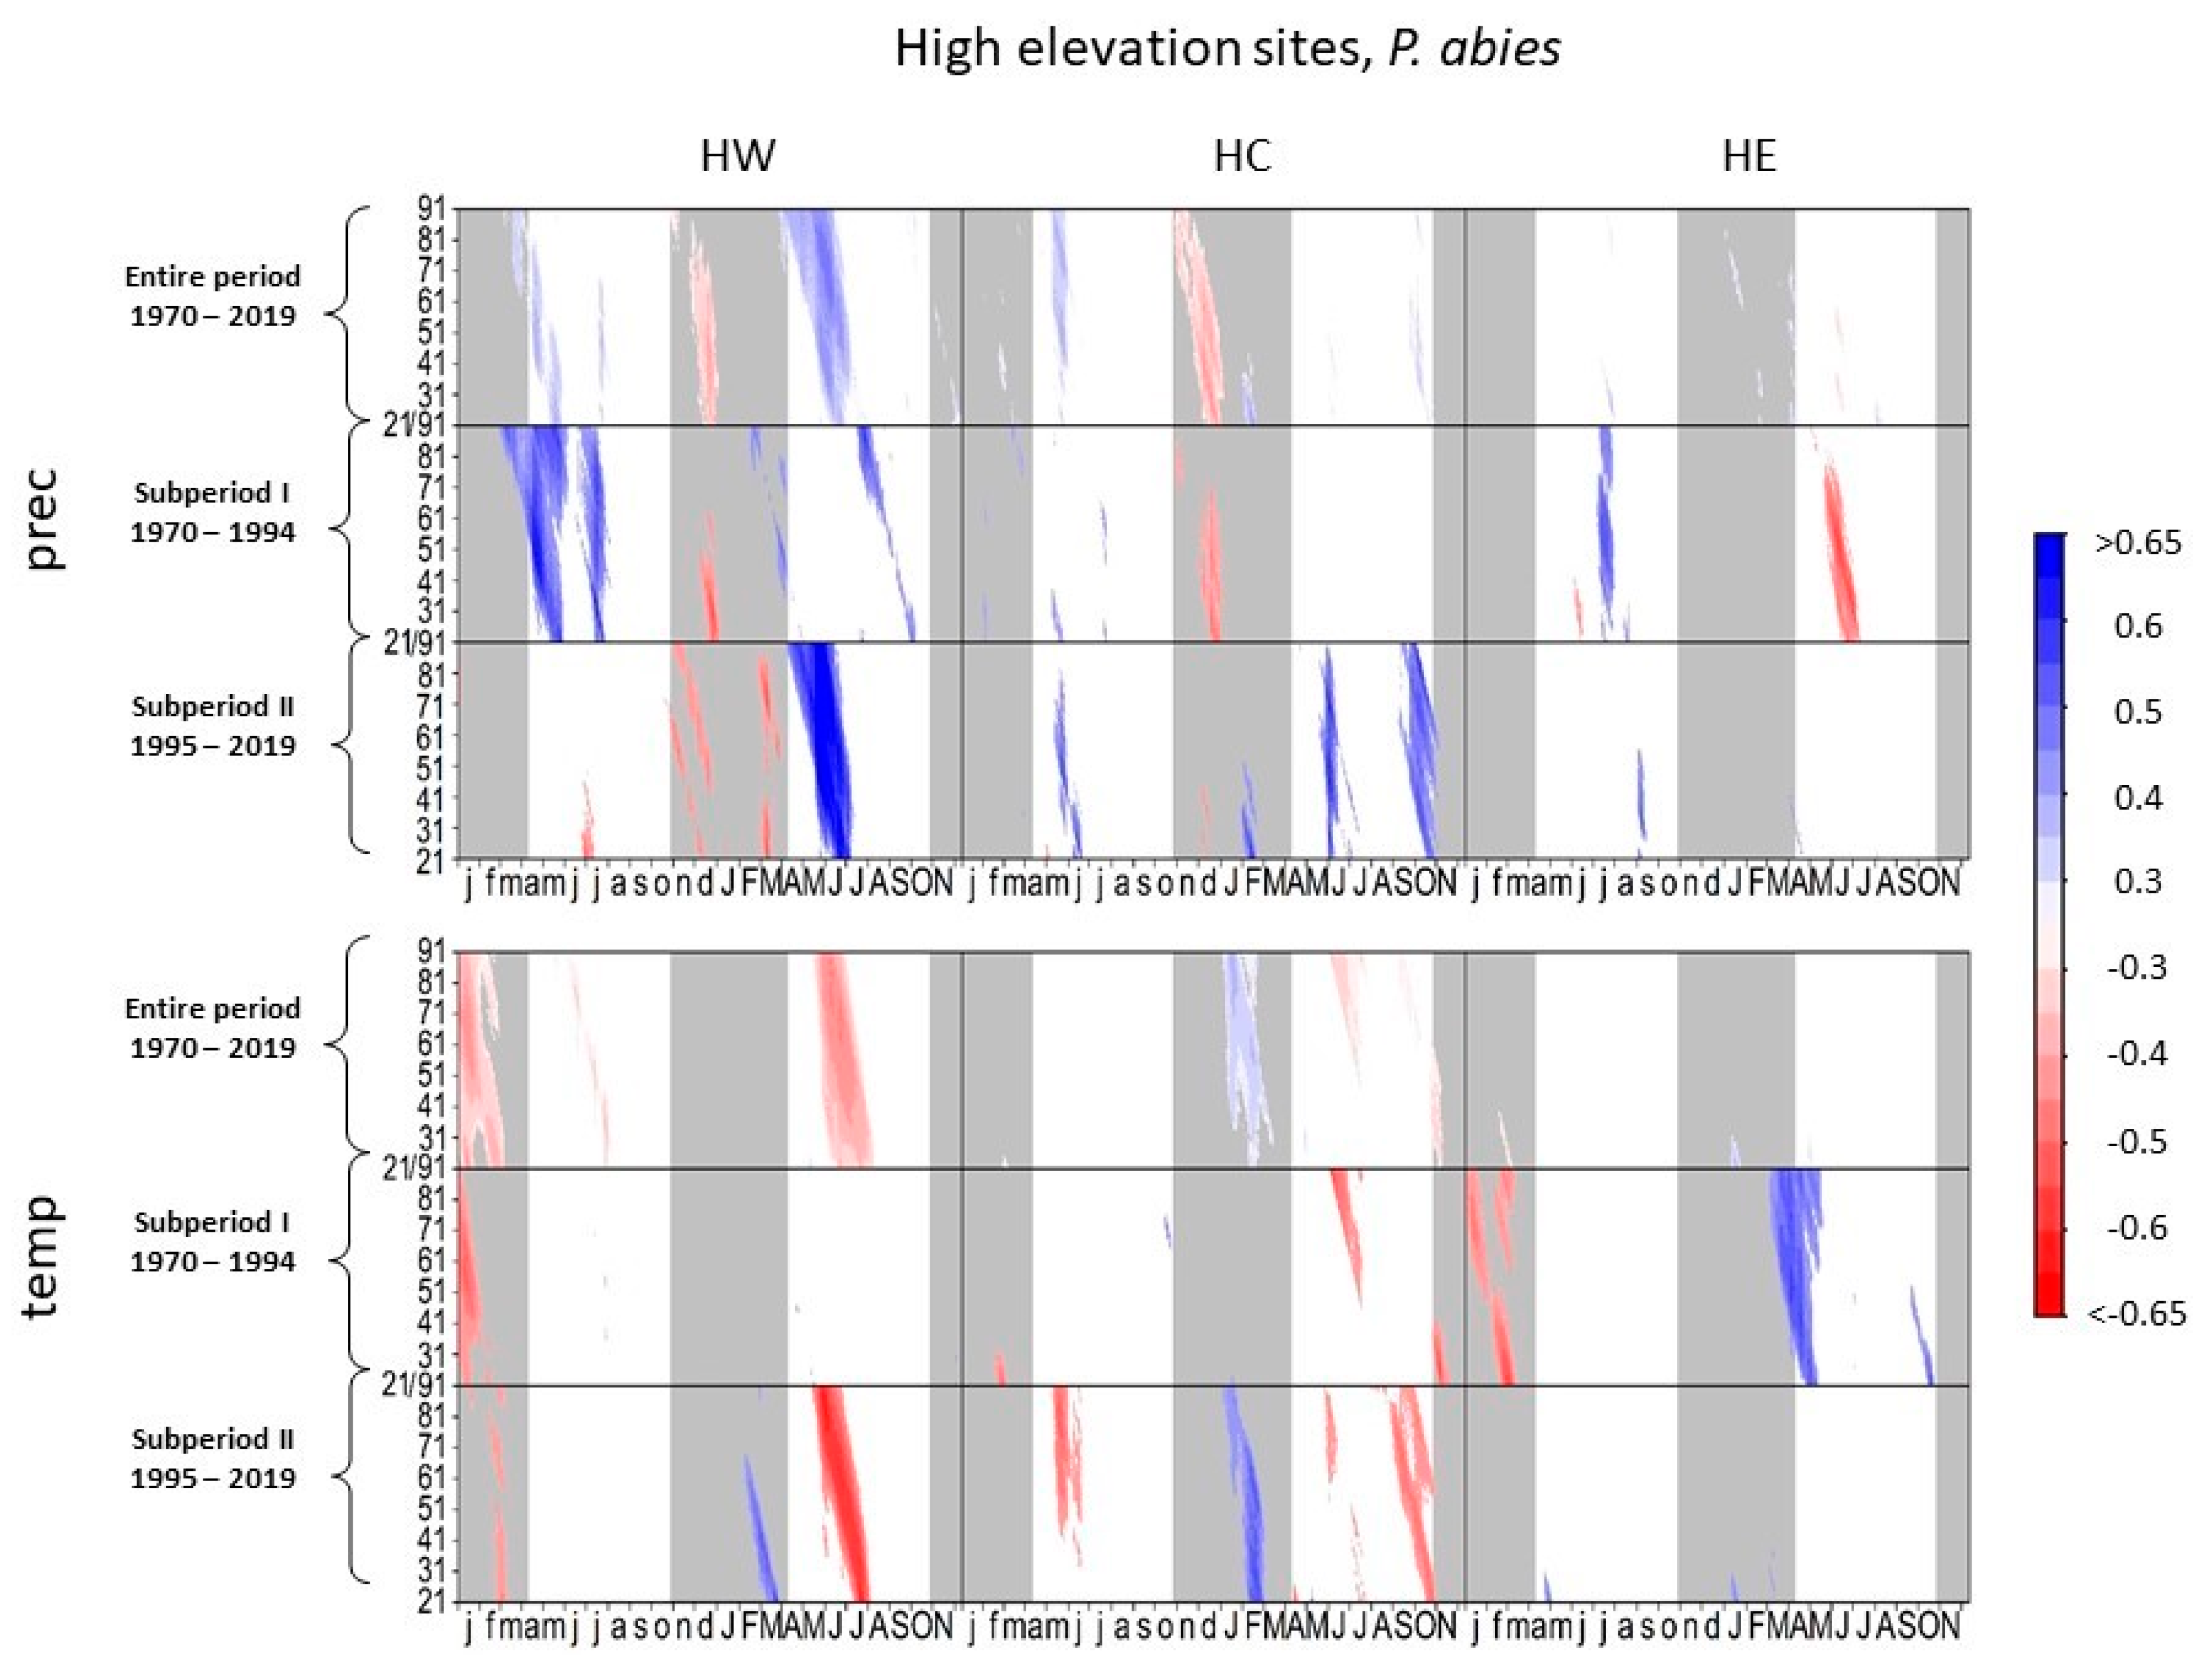
3.1.2. Norway Spruce at High-Elevation Sites

Summer precipitation had a negative effect on radial growth of spruce at HE in subperiod I, though the negative effect decreased in subperiod II (Figure 3). In contrast, tree growth was positively influenced by precipitation in previous September to October in subperiod II. At HW and HC, spruce showed low correlations between tree growth and precipitation in the current year in subperiod I. In subperiod II, however, tree growth at HW and HC correlated positively to summer and autumn precipitation.
High summer temperatures at HW and autumn temperatures at HC negatively influenced radial growth of spruce at these sites in subperiod II, whereas in subperiod I, spruce growth at HE correlated positively to higher temperatures between March and June, a complete signal loss towards temperature occurred in subperiod II.

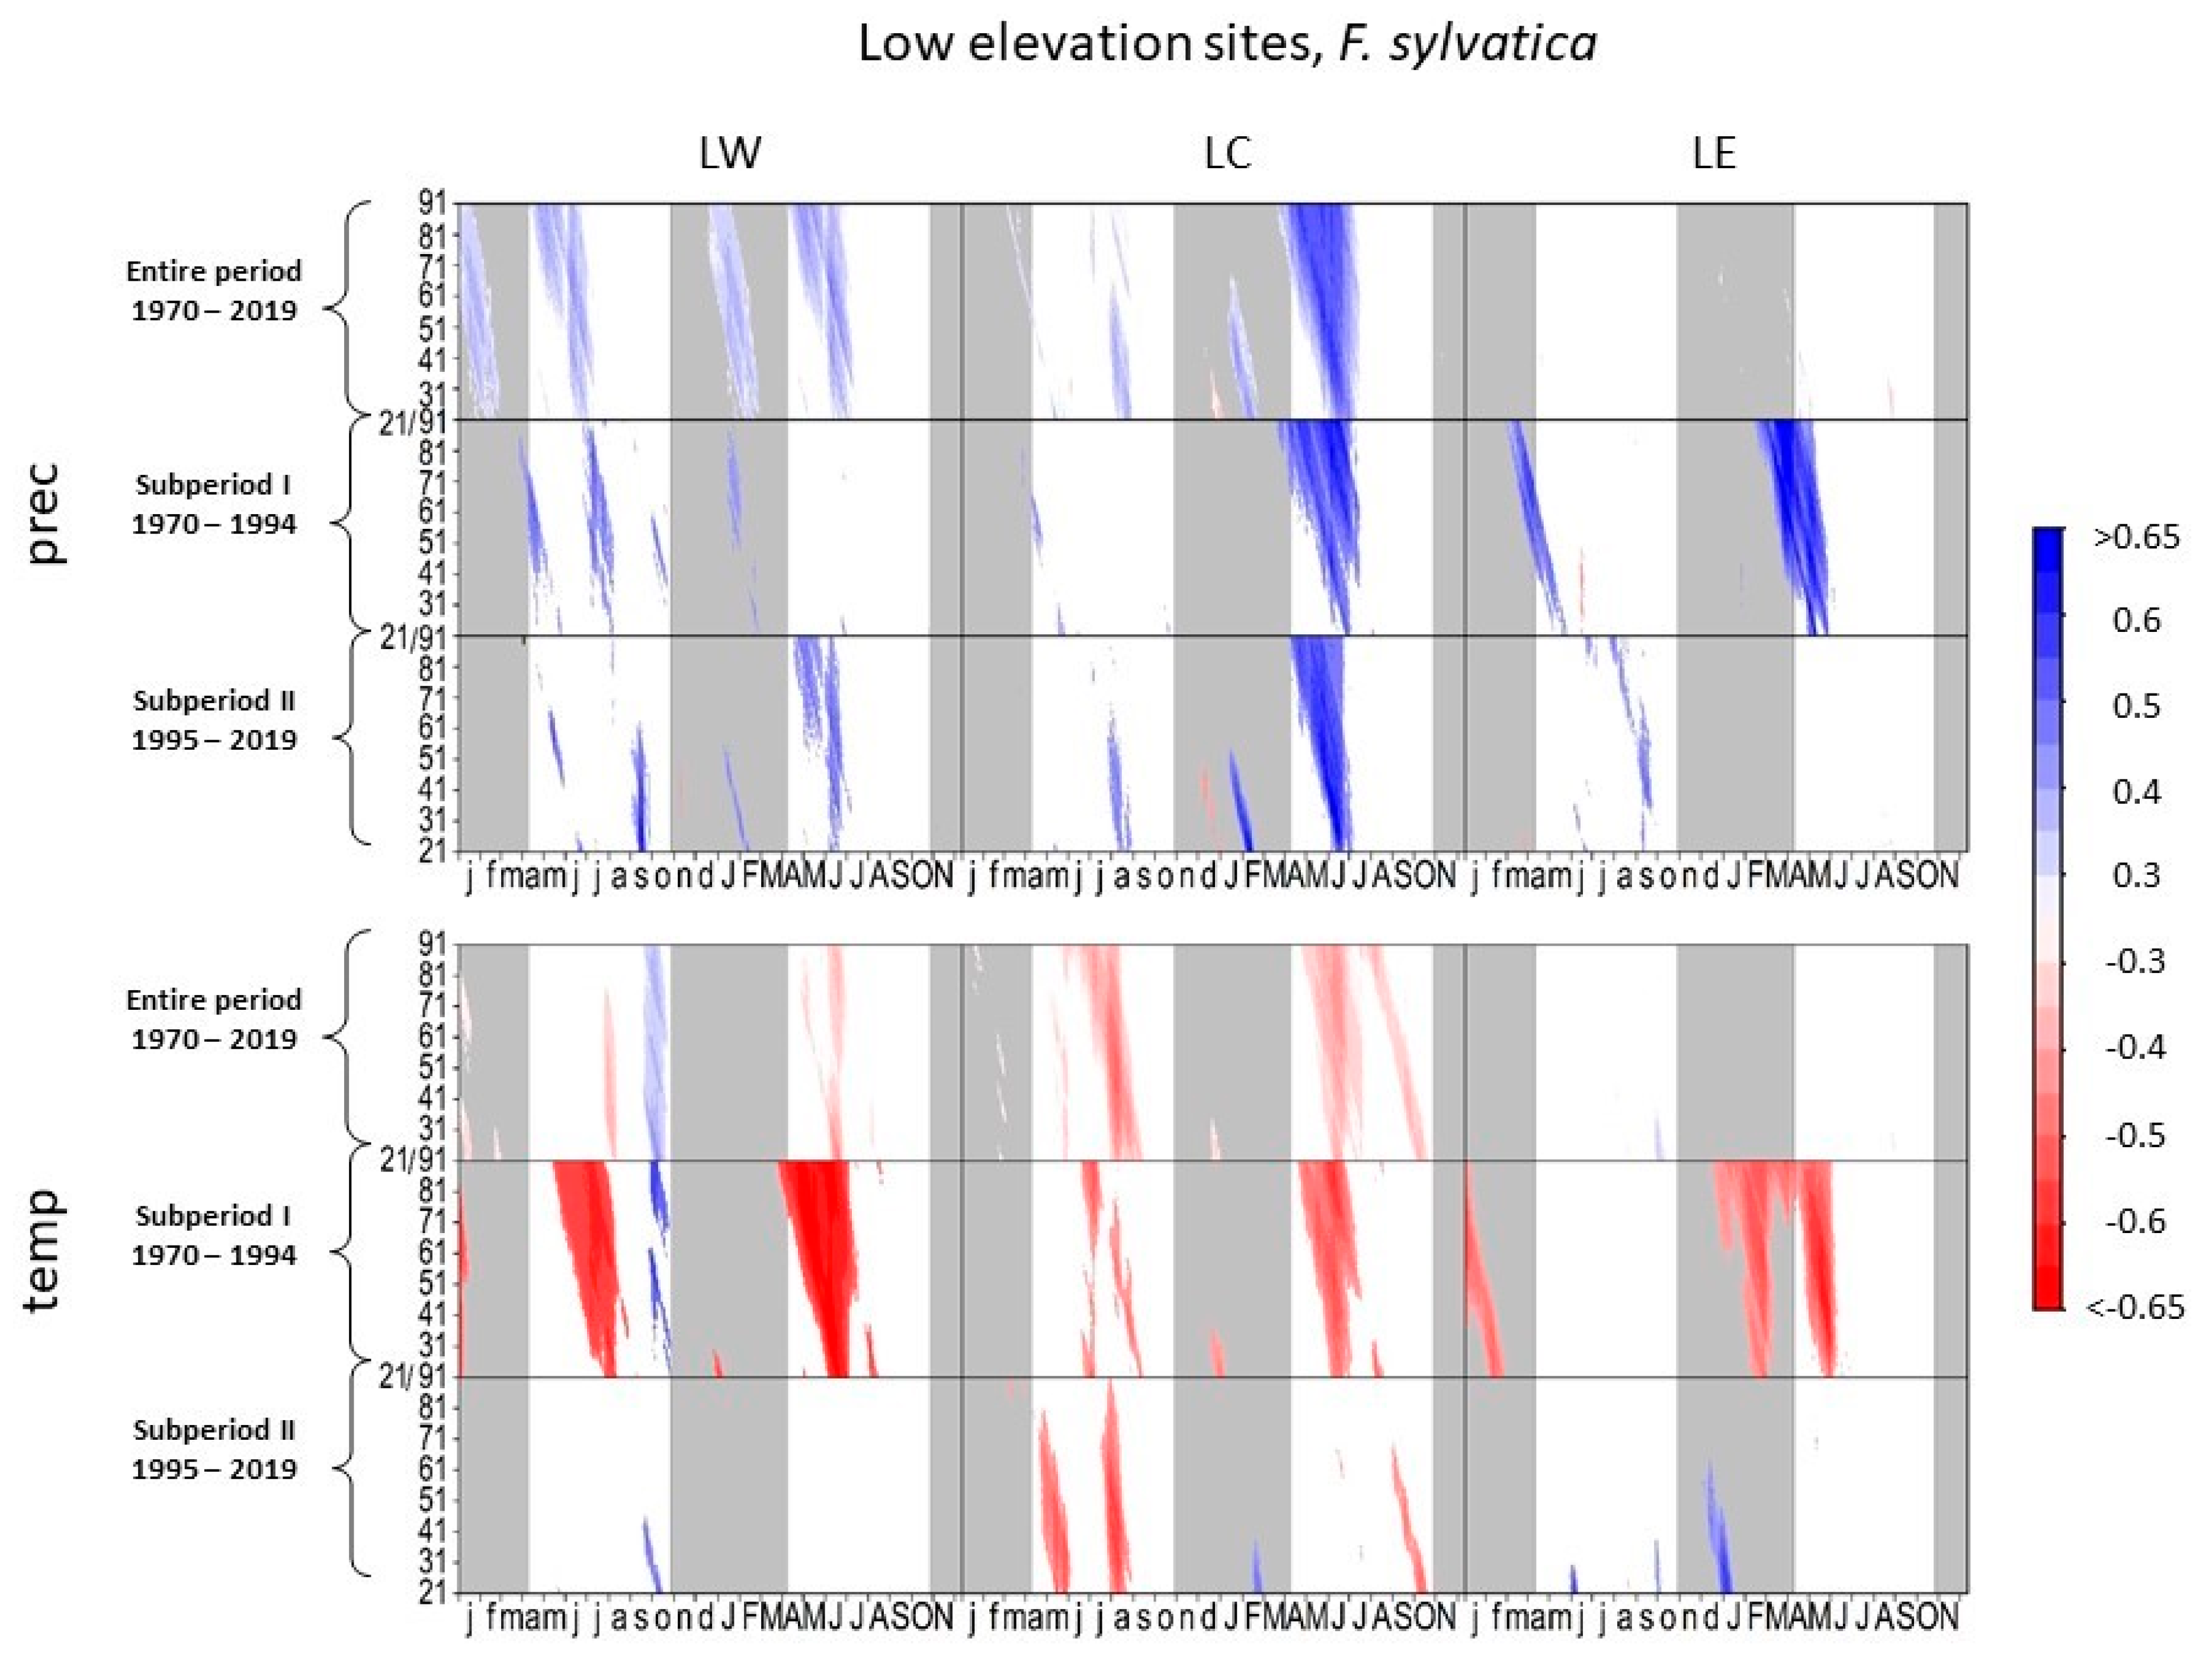
3.1.3. European Beech at Low-Elevation Sites

In the entire period, radial growth of European beech responded positively to precipitation in late spring and summer at LW and LC (Figure 4). At LC, the positive correlation between precipitation and tree growth increased during the complete growing season between subperiod I and subperiod II, with the highest correlation coefficients between mid-June and mid-July (r = 0.75, DOY 530, 32-day interval). At LW, the level of significance of climate-proxy relationships with precipitation in the current growing season increased during subperiod II. However, in subperiod II, the highest correlations occurred for previous autumn precipitation. Beech at LE showed positive correlations to spring and summer precipitation in subperiod I, while in subperiod II, no correlations to precipitation occurred in the current year.
Beech negatively correlated to spring and summer temperature at all low elevation sites in subperiod I (Figure 4). However, the negative impact of temperature on tree growth decreased in subperiod II, especially at LW and LE. At these two sites, beech correlated positively to higher temperatures in previous September and October.

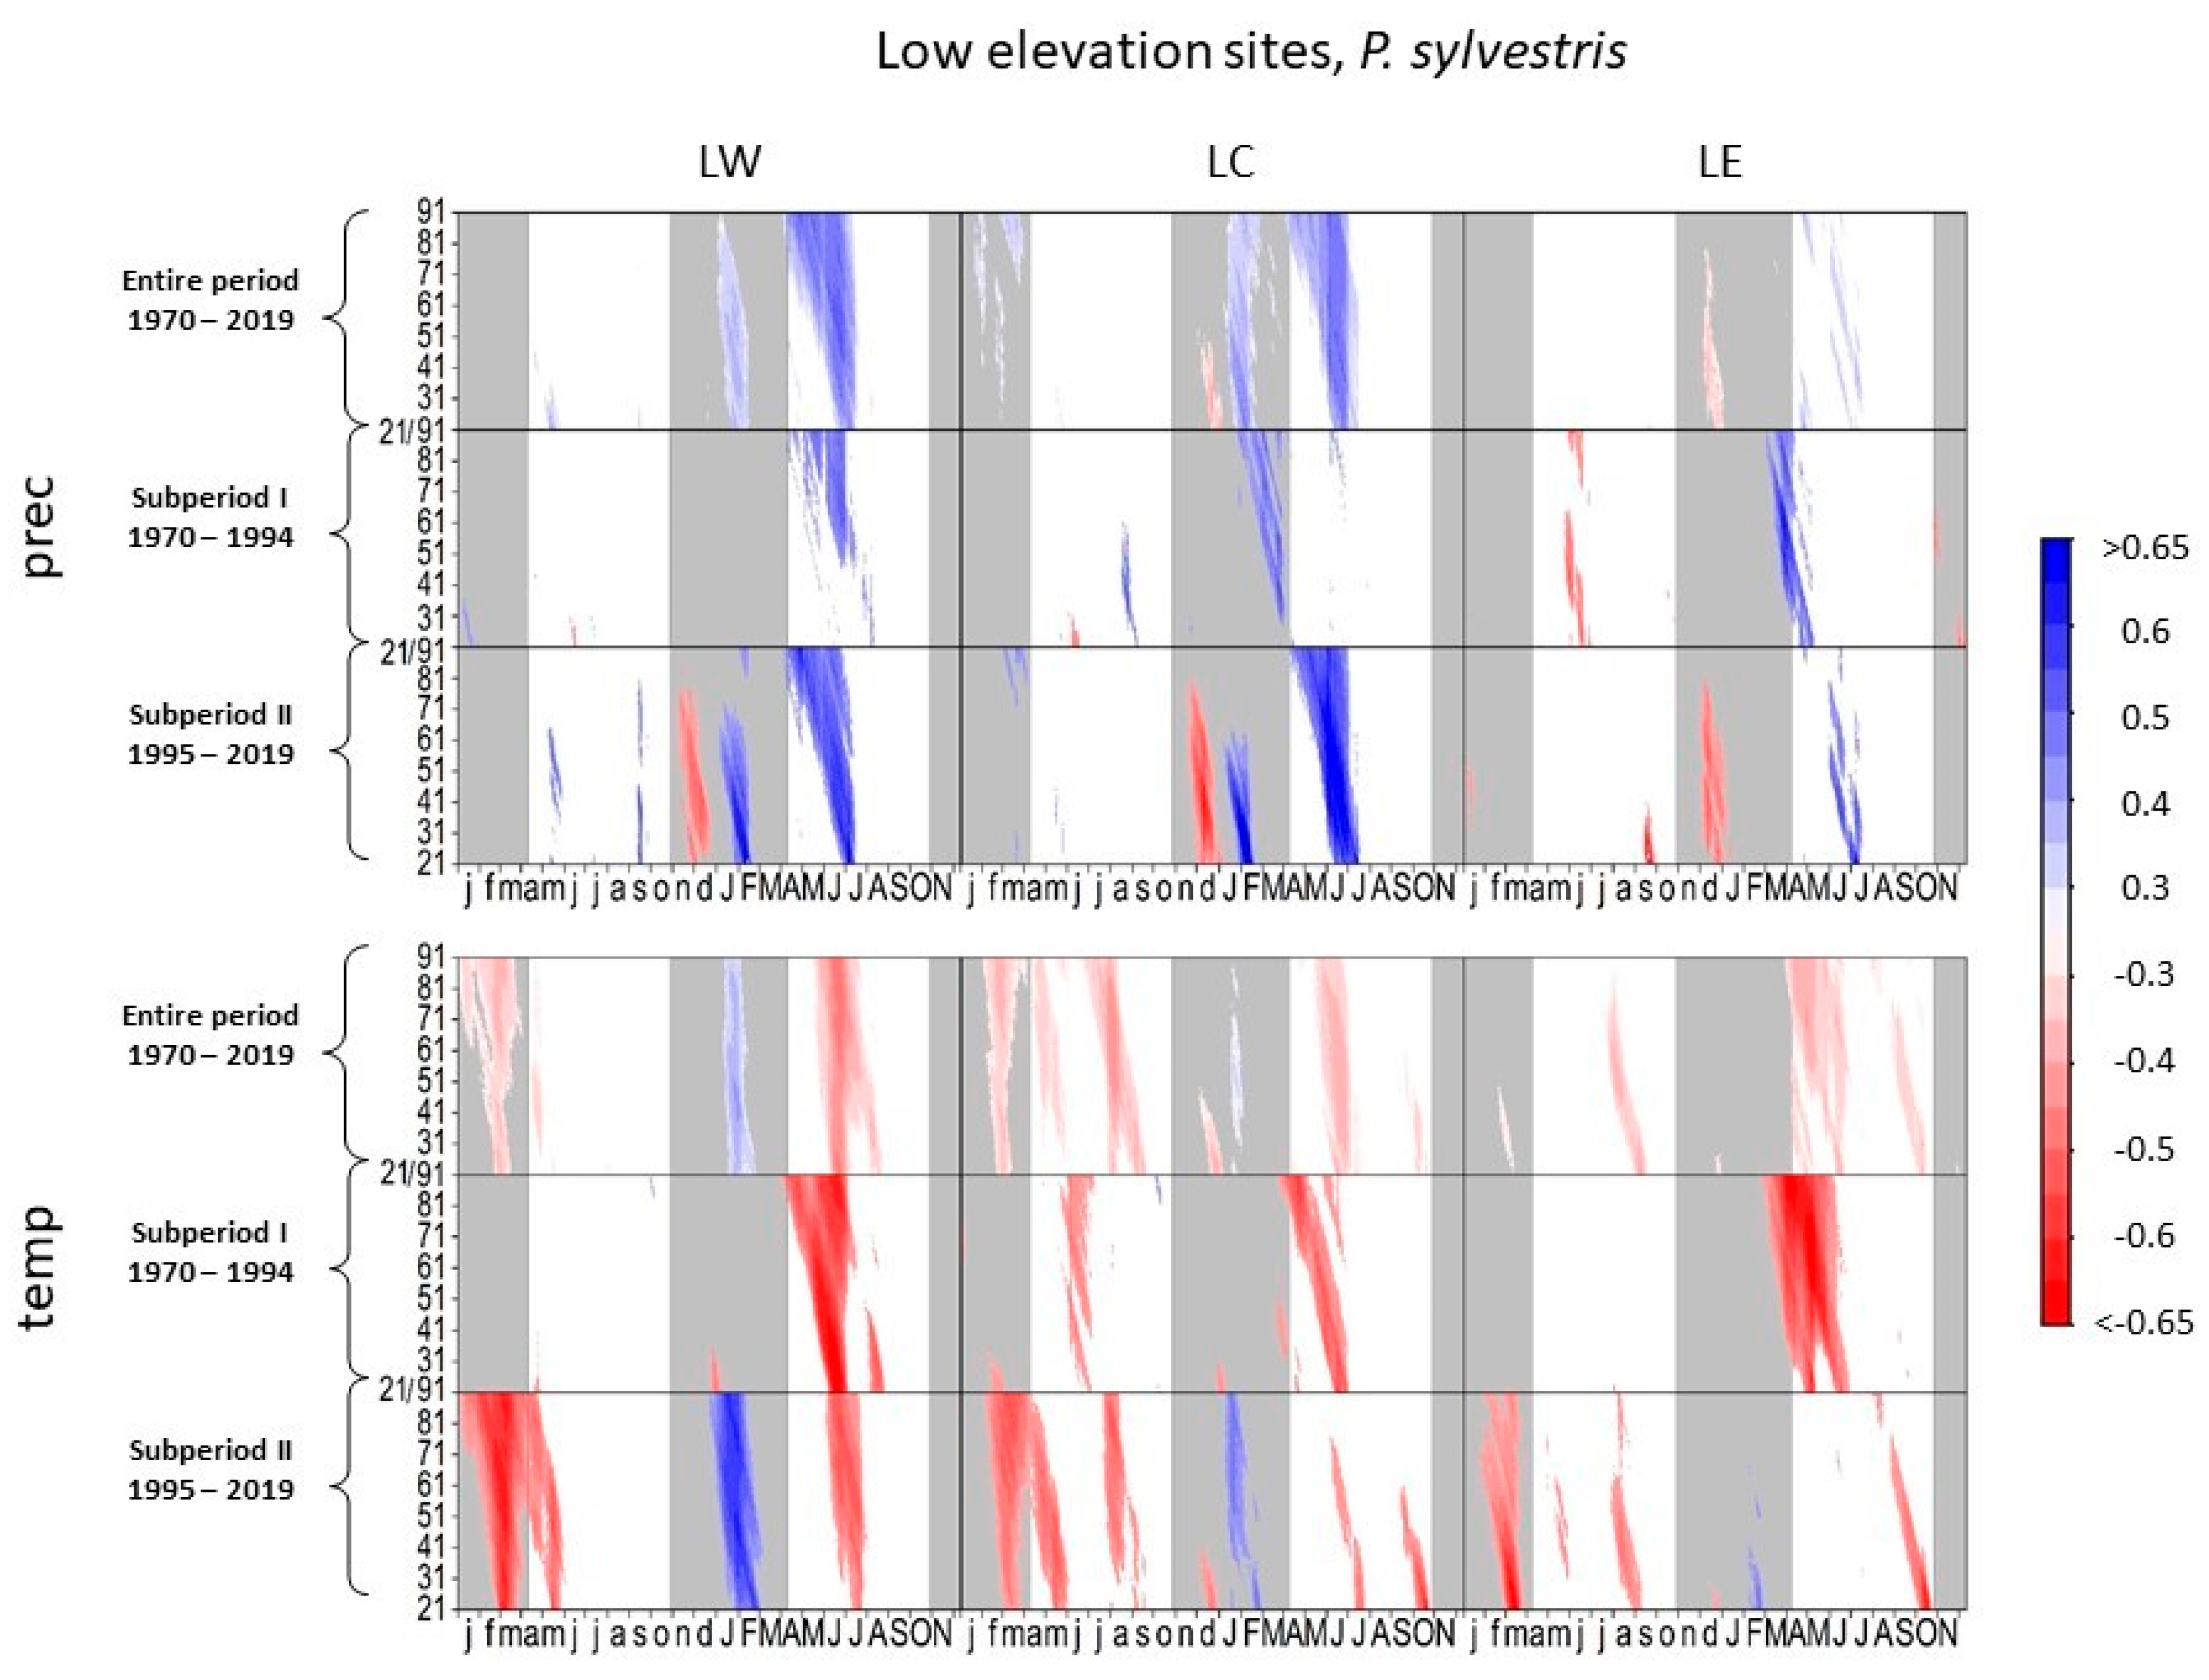
3.1.4. Scots Pine at Low-Elevation Sites

Increased precipitation in the current growing season is favorable for tree growth of Scots pine at all low-elevation sites over the entire investigated period, whereby the summer precipitation positively affected tree growth more strongly in subperiod II (Figure 5). In subperiod I, early spring precipitation and longer periods of precipitation correlated best. In subperiod II, high correlation coefficients around 0.7 between tree growth of pine and daily precipitation occurred in June/July at all low-elevation sites (LW: r = 0.69, p < 0.001, DOY 553, 23-day interval; LC: r = 0.79, p < 0.001, DOY 521, 60-day interval; LE: r = 0.69, p < 0.001, DOY 557, 21-day interval). Correlation coefficients for monthly precipitation in subperiod II were around 0.5 or higher (LW: r = 0.6, p < 0.01, July; LC: r = 0.66, p < 0.001, July; LE: r = 0.47, p < 0.05, July).
At all low-elevation sites, radial growth of Scots pine was negatively affected by increased temperatures in the entire period. Particularly higher summer and autumn temperatures during the current growth period revealed the most negative impact on tree growth. Despite the predominant negative effects of high temperatures on tree growth at all sites, higher temperatures in February/March positively influenced tree growth in subperiod II at LW and LC.

3.2. Tree Responses to 2-Month SPEI

Correlations between a 2-month SPEI and tree growth changed at some study sites between the two investigated subperiods (Figure 6). Except for beech at HE, which correlated negatively to July/August SPEI in subperiod I, no significant correlations occurred in the growing season for beech at high-elevation sites in both subperiods.
In contrast, spruce at HW showed positive correlations to previous May/June-, and previous July/August, and August/September-SPEI in subperiod I. This correlation shifted to a highly significant correlation to current June/July-SPEI in subperiod II. Tree growth of spruce at HC was not correlated to SPEI in subperiod I but showed significant correlations with June/July-SPEI in subperiod II. Spruce at HE correlated negatively to June/July-SPEI in subperiod I, but showed no significant correlations in subperiod II.
Beech at LW showed significant correlations to previous July/August-, August/September-, and current February/March-SPEI but no significant correlation in subperiod II. Conversely, beech at LC correlated to May/June-, June/July-, and July/August-SPEI in subperiod I. In the most recent 25 years, however, only previous August/September- and current June/July-SPEI induced tree responses. (Figure 6). Beech at LE responded especially to April/May- and May/June-SPEI in subperiod I, but no significant correlations occurred in subperiod II.
Pine at LW correlated significantly to May/June-, June/July-, and July/August-SPEI in subperiod I, whereas only June/July- and July/August-SPEI showed significant correlations in subperiod II. At LC, pine responded to previous February/March- and currentMarch/April -SPEI in subperiod I. In subperiod II, the correlation shifted to previous February/March, March/April, and April/May and current June/July- and July/August-SPEI. Tree growth of pine at LE was positively correlated to April/May- and May/June-SPEI in subperiod I, whereas no significant correlation remained for pine at LE in subperiod II.

3.3. Pointer Year Analysis and Superposed Epoch Analysis (SEA)

For most of the study sites, negative pointer years occurred during the known extreme years, such as 1976 (nine chronologies affected), 2011 (6), 2018 (5), 2019 (5), and 2003 (3). In addition, pointer years were observed either at only one site for both species (e.g., in 1996 at HE), for individual species at multiple sites (e.g., for beech in 2000 at HC/LE) (Table 2), or at only one site and for only one species (e.g., for beech in 1995 at HE, for spruce in 2006 at HE).
The SEA linking to pointer years (presented in Supplementary Figure S1) indicated significant growth declines for these years at all sites, whereas beech at LC also showed a significant growth decline after the year with the marked growth decline. The SEA for assessing tree response to the climatic extreme years 1976, 2003, and 2018 (Figure 7) at low-elevation sites showed similar results. However, no significant response occurred at LE for beech, whereas growth of beech and pine declined in the following year at LC as well. At high-elevation sites, the drought years did not significantly affect spruce growth at HE or beech growth at HC and HE. Spruce at HW and HC responded to the drought years with a growth decline in the same year, whereas beech at HW responded in the following year (Figure 7).
Superposed Epoch Analyses using local weather extremes revealed that a dry growing season and even a dry spring or summer negatively affected most species at low-elevation sites, except for beech at LE (results not shown). Dry growing seasons also negatively affected beech growth in the following year at LW and LC and pine growth at LC. Dry summer seasons did not significantly affect beech at LW. However, dry autumn months resulted in a growth decline the following year for beech at LW and pine at LW and LC. At high-elevation sites, spruce at HW responded negatively to a dry growing season, as did beech at HW in the following year. Spruce at HC showed decreased growth in a year with a dry season and also in the following year. Beech at HE benefited from a dry growing season and showed positive tree growth for these years. Otherwise, only dry summer months negatively influenced the tree growth of spruce at HW and HC.

4. Discussion

4.1. Climate–Growth Relationships

4.1.1. European Beech and Norway Spruce at High-Elevation Sites

Since high summer precipitation sums imply high cloudiness and reduced insolation and accordingly low photosynthesis rates [38,39,40,41,42], precipitation during the growing season was negatively correlated with tree growth at the two high elevation sites within the boreal bioclimatic zone (HC and HE) (Figure 2 and Figure 3) [20]. Yet, increased mean temperatures in subperiod II (Figure 8) [27] caused a shift in environmental conditions at humid mountainous sites as well (Figure 9a). Trees first benefited from higher temperatures and additional insolation due to a prolonged growing season [14,17,18]. In subperiod II, however, this pattern reversed: beech and spruce showed positive correlations to summer precipitation and negative correlations to summer temperature (Figure 2 and Figure 3), which indicates an increased sensitivity towards drier conditions [43]. Correlations between SPEI and tree growth (Figure 6) revealed a higher susceptibility to summer drought in subperiod II for spruce at HW and HC, confirming its drought intolerance [15,44]. Scharnweber et al. [45] observed similar effects and identified stronger growth responses to drought at sites with higher water availability compared to drier sites.
Since the soil type for spruce at HE is classified as Gleysols (Table 1), the risk of reduced soil water availability is minimal, as reflected by a lack of significant correlations with precipitation and temperature (Figure 3). However, since the climate station for the HE site is located at a lower altitude (elevation difference of 600 m), small deviations in climate–growth relationships may also be due to differences in precipitation totals and temperatures at HE. Nevertheless, shifts in tree responses between subperiod I and subperiod II can be a first indication that even at forest sites with moist conditions, increasing temperatures and reduced summer precipitation may lead to a growth decline in the near future. In summary, this study reveals that even at moist high-elevation sites seen as limited by temperature and radiation [46], water availability in the summer months gains an increasing influence on tree growth, especially for spruce (Figure 9a).

4.1.2. European Beech and Scots Pine at Low-Elevation Sites

Water availability is considered the primary growth-limiting factor for trees [6]; consequently, for beech, the highest correlation coefficients with precipitation for the entire investigated period were observed during late spring and summer (Figure 4). These distinct relationships confirm previous findings that beech radial growth depends on soil water content in early summer [38,41,47,48] and that June is the most important month for tree-ring formation [21]. However, in recent years, the mean total precipitation in June has decreased at all sites from subperiod I to subperiod II (Figure 8). In consequence, growth is more sensitive to summer precipitation, especially at low-elevation sites (Figure 4 and Figure 9b).
In the subcontinental zone, beech growth at LC revealed the strongest sensitivity to June/July precipitation. Since the region around LC in particular has become drier since 1995 [27], mean growing season and summer precipitation dropped below the threshold for vital beech growth in subperiod II (mean growing season precipitation (MGSP): <350 mm, summer precipitation (JJA): < 250 mm). [21]. Strong and significantly negative correlations to the SPEI reveal a severe drought stress for beech (Figure 6). Nevertheless, vital growth below the precipitation threshold is possible, as revealed by beech at LW, where growth conditions with summer precipitation and MGSP below the threshold prevailed since at least 1970 [27]. Other studies also suggest that forest ecosystems thriving in dry conditions are less drought-sensitive than those in more humid conditions [45,49,50]. Although beech is more vulnerable and drought-sensitive compared to other broadleaf species [51,52], beech vitality is not solely controlled by summer precipitation, as visible in subperiod II at LE. Here, a significant correlation between beech growth and spring and summer precipitation completely disappeared in subperiod II (Figure 4). Increasing summer precipitation in subperiod II at LE decreased water stress during the summer months at this site. The negative effect of high summer temperatures decreased in subperiod II, and beech radial growth even increased due to increasing temperatures in previous September and October and/or February (Figure 4 and Figure 9b). Sykes and Prentice [53] assumed a threshold of >5 °C for tree growth. Accordingly, temperatures above 5 °C in autumn and early spring result in an extended growing season and hence may increase radial growth. Higher temperatures in February trigger cambial reactivation and consequently result in an earlier start of wood production in spring [6,23].
For Scots pine, higher correlation coefficients with summer precipitation in subperiod II and strong negative correlations to summer temperature signify an increasing influence of drought periods on growth (Figure 5 and Figure 9b). Although radial growth is assumed to occur mainly in spring [54], the strong correlations between the 2-month SPEI (Figure 6) and pine growth in the summer months in subperiod II (LC: r = 0.67, p < 0.001, June/July) confirm that the negative effects of high temperatures and low precipitation sums in summer amplified at LC [55,56,57,58].
In general, these results support observations of low drought resistance of Scots pine [59]. Furthermore, as soil textures at LC are sandy and feature a low water-storing capacity. These edaphic conditions result in pine being most susceptible to dry periods at this study site (Figure 6 and Figure 9b) [60].

4.2. Pointer Year Analysis and Superposed Epoch Analysis

Most negative pointer years defined by tree-ring width were equivalent to years with long-time drought periods in spring, summer, and/or previous autumn in combination with high temperatures, such as in 1976, 2003, 2018, and 2019. The late frost event in spring 2011 [61,62] also resulted in a depletion in tree growth at several sites (Table 2). Other years with significant reduced growth can be explained by local weather phenomena, such as dry periods in the current and in the previous year. Drought years were defined as years with an annual precipitation sum within the first quartile of the mean annual precipitation sum between 1970 and 2019. Dry years and dry seasons (spring (MAM)/summer (JJA)/autumn (SON)) signify a respective precipitation sum within the 33rd percentile, whereas warm seasons indicate temperatures above the third quartile (Table 2). In some cases, pointer years at high elevation sites occurred in association with long periods of precipitation (annual precipitation sum above the third quartile) and/or low temperatures (mean annual temperature in the first quartile) (e.g., for beech in 1987 at HC/HE, for beech and spruce in 1996 at HE) [58]. For some pointer years, no obvious climate-related reasons were found (e.g., for beech in 1995 at HE and in 1970 at HW). Here, the growth decline might be caused by non-weather-related factors (beetle attacks, storms, masting, or human activity) [21,63,64].
The SEA showed that for both tree-ring-based pointer years and climatic event years, tree growth of beech and pine at LC was most vulnerable, followed by beech and pine at LW and beech and spruce at HW. The State of the Forests report of the Bavarian State Ministry of Food, Agriculture and Forestry [5] also observed high vital disturbances for Scots pine, such as mistletoe-induced crown-degradation, as well as needle loss of up to almost 32% in 2019 close to LC [5]. Beech at LW and LC showed a significant growth decline after hot and dry growing seasons in the current as well as in the subsequent year, confirming previous findings of drought reaction of beech in this part of Bavaria [65]. The declining influence of spring and summer precipitation on beech growth at LE may be explained by a generally more humid climate, in comparison to LW and LC. On the contrary, higher temperatures could have caused more favorable growing conditions during the beginning and the end of the vegetation season.
Considering the dryer and hotter summers occurring in recent years [27], most trees showed narrower rings. Such long-time growth depressions may bias the pointer year analysis, so that specific pointer years do not stand out any longer as individual extreme events [66].

5. Conclusions

Comparing the results of the climate–growth relationships and the SEA, all studied species responded specifically to changing climate conditions at all observed study sites. However, all results revealed increasing susceptibility and sensitivity of trees to droughts, even in the more humid regions.
Outcomes suggest that P. sylvestris is the most vulnerable, least drought-resistant, and least resilient of the three studied species. Even though P. abies first benefited from higher temperatures at low mountain ranges, it also became more dependent on summer precipitation in subperiod II (1994–2019). Therefore, the initially positive effect of higher temperatures at high elevation sites possibly shifted to a negative impact due to an increasing risk of drought stress. Although F. sylvatica responded differently at each study site, two general tendencies can be identified. First, beech became in general more drought-sensitive over time, but the exact timing of drought periods within the course of the year is site-specific. For instance, beech at LC was most vulnerable to summer droughts, even to short dry phases. Conversely, beech at LW rather responded to long-lasting dry periods, as well as to dry spells in spring and the previous autumn. Second, an extended growing season due to warmer temperatures in spring and autumn resulted in increasing wood production at both low- and high-elevation sites.
Overall, increasing frequencies of dry periods will pose a serious threat to all analyzed tree species. A loss of vitality due to higher temperatures and an increased frequency of dry periods already proceeds. However, the differences in growth-climate responses between the past and the recent subperiod indicate that changing climate dynamics also crucially alter the response of tree radial growth. Therefore, climate variables at a daily resolution are very useful to identify amplification or damping of growth correlations, since even short intervals of specific weather conditions can heavily affect radial tree growth. In addition, climate scenarios at local scales are essential to provide better estimates of how drought frequency and intensity and daily maximum temperatures will evolve in the future. Topographically diverse regions such as Bavaria show that weather phenomena over Europe can result in locally differing weather conditions, which accordingly imply different tree responses.
Our regional example from Bavaria in southeast Germany demonstrates that it is thus imperative to improve our knowledge of local climate patterns and to compare climate–growth relationships with future expected climatic conditions at each site to reliably simulate the future development of forest ecosystems in European forest areas in complex topographic regions.

Supplementary Materials

The following are available online at https://www.mdpi.com/article/10.3390/f12111433/s1, Figure S1: Superposed Epoch Analyses showing the impact of pointer years.

Author Contributions

Conceptualization, A.D. and A.B.; methodology, A.D.; software, A.D.; formal analysis, A.D., W.J.-H.M., A.B.; investigation, A.D., A.B.; writing—original draft preparation, A.D.; writing—review and editing, W.J.-H.M., A.B.; visualization, A.D.; supervision, A.B.; project administration, A.B.; funding acquisition, A.B. All authors have read and agreed to the published version of the manuscript.

Funding

This research was funded by the Bavarian State Ministry of Science and Arts, as part of the Bavarian Climate Research Network (bayklif), project “Talking Trees: Schnittstelle von Klimadynamik, Dendroökologie und Bildung für nachhaltige Entwicklung”.

Data Availability Statement

The data used in this paper will be provided on request by A. Debel ([email protected]).

Acknowledgments

We would like to thank the Bavarian State Forestry, the Bavarian State Institute for Forestry and Silviculture, the Department for Food, Agriculture and Forestry Bavaria, the Bavarian National Park, and the Johann-Michael-Fischer-Gymnasium at Burglengenfeld for their kind support and permission for sampling. Furthermore, we want to thank our colleagues for supporting us in the field and Iris Burchardt for helpful comments on the manuscript.

Conflicts of Interest

The authors declare no conflict of interest. The funders had no role in the design of the study; in the collection, analyses, or interpretation of data; in the writing of the manuscript; or in the decision to publish the results.

References

  1. Kosanic, A.; Kavcic, I.; van Kleunen, M.; Harrison, S. Climate change and climate change velocity analysis across Germany. Sci. Rep. 2019, 9, 2196. [Google Scholar] [CrossRef]
  2. Christensen, J.H.; Hewitson, B.; Busuioc, A.; Chen, A.; Gao, X.; Held, I.; Jones, R.; Kolli, R.K.; Kwon, W.-T.; Laprise, R.; et al. Regional Climate Projections. In Climate Change 2007: The Physical Science Basis. Contribution of Working Group I to the Fourth Assessment Report of the Intergovernmental Panel on Climate Change; Solomon, S., Qin, D., Manning, M., Chen, Z., Marquis, M., Averyt, K.B., Tignor, M., Miller, H.L., Eds.; Cambridge University Press: Cambridge, UK; New York, NY, USA, 2007. [Google Scholar]
  3. Buras, A.; Rammig, A.; Zang, C.S. Quantifying impacts of the 2018 drought on European ecosystems in comparison to 2003. Biogeosciences 2020, 17, 1655–1672. [Google Scholar] [CrossRef] [Green Version]
  4. Schuldt, B.; Buras, A.; Arend, M.; Vitasse, Y.; Beierkuhnlein, C.; Damm, A.; Gharun, M.; Grams, T.E.E.; Hauck, M.; Hajek, P.; et al. A first assessment of the impact of the extreme 2018 summer drought on Central European forests. Basic Appl. Ecol. 2020, 45, 86–103. [Google Scholar] [CrossRef]
  5. Bayerisches Staatsministerium für Ernährung; Landwirtschaft und Forsten. Ergebnisse der Waldzustandserhebung 2019; STMELF: München, Germany, 2019; Volume 2019. [Google Scholar]
  6. Friedrichs, D.A.; Trouet, V.; Büntgen, U.; Frank, D.C.; Esper, J.; Neuwirth, B.; Löffler, J. Species-specific climate sensitivity of tree growth in Central-West Germany. Trees 2009, 23, 729–739. [Google Scholar] [CrossRef]
  7. Camarero, J.J.; Gazol, A.; Sangüesa-Barreda, G.; Oliva, J.; Vicente-Serrano, S.M. To die or not to die: Early warnings of tree dieback in response to a severe drought. J. Ecol. 2015, 103, 44–57. [Google Scholar] [CrossRef] [Green Version]
  8. Buras, A.; Schunk, C.; Zeiträg, C.; Herrmann, C.; Kaiser, L.; Lemme, H.; Straub, C.; Taeger, S.; Gößwein, S.; Klemmt, H.-J.; et al. Are Scots pine forest edges particularly prone to drought-induced mortality? Environ. Res. Lett. 2018, 13, 25001. [Google Scholar] [CrossRef]
  9. Bhuyan, U.; Zang, C.; Menzel, A. Different responses of multispecies tree ring growth to various drought indices across Europe. Dendrochronologia 2017, 44, 1–8. [Google Scholar] [CrossRef]
  10. Baumbach, L.; Niamir, A.; Hickler, T.; Yousefpour, R. Regional adaptation of European beech (Fagus sylvatica) to drought in Central European conditions considering environmental suitability and economic implications. Reg. Environ. Chang. 2019, 19, 1159–1174. [Google Scholar] [CrossRef]
  11. Zang, C.; Rothe, A.; Weis, W.; Pretzsch, H. Tree Suitability under climate change conditions: Susceptibility of major forest tree species from tree-ring widths. Allg. Forst Jagdztg. 2011, 182, 98–112. [Google Scholar]
  12. Lindner, M.; Fitzgerald, J.B.; Zimmermann, N.E.; Reyer, C.; Delzon, S.; van der Maaten, E.; Schelhaas, M.-J.; Lasch, P.; Eggers, J.; van der Maaten-Theunissen, M.; et al. Climate change and European forests: What do we know, what are the uncertainties, and what are the implications for forest management? J. Environ. Manag. 2014, 146, 69–83. [Google Scholar] [CrossRef] [PubMed] [Green Version]
  13. Hartl-Meier, C.; Zang, C.; Büntgen, U.; Esper, J.; Rothe, A.; Göttlein, A.; Dirnböck, T.; Treydte, K. Uniform climate sensitivity in tree-ring stable isotopes across species and sites in a mid-latitude temperate forest. Tree Physiol. 2015, 35, 4–15. [Google Scholar] [CrossRef] [Green Version]
  14. Kraus, C.; Zang, C.; Menzel, A. Elevational response in leaf and xylem phenology reveals different prolongation of growing period of common beech and Norway spruce under warming conditions in the Bavarian Alps. Eur. J. Forest Res. 2016, 135, 1011–1023. [Google Scholar] [CrossRef]
  15. Vitali, V.; Büntgen, U.; Bauhus, J. Silver fir and Douglas fir are more tolerant to extreme droughts than Norway spruce in south-western Germany. Glob. Chang. Biol. 2017, 23, 5108–5119. [Google Scholar] [CrossRef]
  16. Sáenz-Romero, C.; Kremer, A.; Nagy, L.; Újvári-Jármay, É.; Ducousso, A.; Kóczán-Horváth, A.; Hansen, J.K.; Mátyás, C. Common garden comparisons confirm inherited differences in sensitivity to climate change between forest tree species. PeerJ 2019, 7, e6213. [Google Scholar] [CrossRef] [PubMed]
  17. Spathelf, P.; van der Maaten, E.; van der Maaten-Theunissen, M.; Campioli, M.; Dobrowolska, D. Climate change impacts in European forests: The expert views of local observers. Ann. For. Sci. 2014, 71, 131–137. [Google Scholar] [CrossRef]
  18. Neuwirth, B.; Schweingruber, F.H.; Winiger, M. Spatial patterns of central European pointer years from 1901 to 1971. Dendrochronologia 2007, 24, 79–89. [Google Scholar] [CrossRef]
  19. McCarty, J. Ecological Consequences of Recent Climate Change. Conserv. Biol. 2001, 15, 320–331. [Google Scholar] [CrossRef]
  20. Walentowski, H.; Gulder, H.-J.; Kölling, C.; Ewald, J.; Türk, W. Die regionale natürliche Waldzusammensetzung Bayerns: Berichte aus der bayerischen Landesanstalt für Wald und Forstwirtschaft. LWF-Bericht 2001, 32, 10–14. [Google Scholar]
  21. Knutzen, F.; Dulamsuren, C.; Meier, I.C.; Leuschner, C. Recent Climate Warming-Related Growth Decline Impairs European Beech in the Center of Its Distribution Range. Ecosystems 2017, 20, 1494–1511. [Google Scholar] [CrossRef]
  22. Dulamsuren, C.; Hauck, M.; Kopp, G.; Ruff, M.; Leuschner, C. European beech responds to climate change with growth decline at lower, and growth increase at higher elevations in the center of its distribution range (SW Germany). Trees 2017, 31, 673–686. [Google Scholar] [CrossRef]
  23. Bauwe, A.; Koch, M.; Kallweit, R.; Konopatzky, A.; Strohbach, B.; Lennartz, B. Tree-ring growth response of Scots pine (Pinus sylvestris L.) to climate and soil water availability in the lowlands of North-Eastern Germany. Balt. For. 2013, 212–225. [Google Scholar]
  24. Vicente-Serrano, S.M.; Beguería, S.; López-Moreno, J.I. A Multiscalar Drought Index Sensitive to Global Warming: The Standardized Precipitation Evapotranspiration Index. J. Clim. 2010, 23, 1696–1718. [Google Scholar] [CrossRef] [Green Version]
  25. Jevšenak, J.; Levanič, T. dendroTools: R package for studying linear and nonlinear responses between tree-rings and daily environmental data. Dendrochronologia 2018, 48, 32–39. [Google Scholar] [CrossRef] [Green Version]
  26. Beck, W.; Heinzig, P. A new tool to discovering realistic climate-growth relationships. FREIJ 2018, 2, 49–52. [Google Scholar] [CrossRef]
  27. DWD Climate Data Center. Station Observations for Germany; Version v19.3; Deutscher Wetterdienst: Offenbach, Germany, 2020. [Google Scholar]
  28. Fritts, H.C. Tree Rings and Climate; Academic Press Inc. (London) LTD.: London, UK, 1976. [Google Scholar]
  29. Eckstein, D.; Bauch, J. Beitrag zur Rationalisierung eines dendrochronologischen Verfahrens und zur Analyse seiner Aussagesicherheit. Forstwiss. Cent. 1969, 88, 230–250. [Google Scholar] [CrossRef]
  30. Rinn, F. TSAP-Win -User Reference: Time Series Analysis and Presentation for Dendrochronology and Related Applications; Version 4.64 for Microsoft Windows; Rinntech-Metriwerk GmbH & Co. KG: Heidelberg, Germany, 2011. [Google Scholar]
  31. Grissino-Mayer, H.D.; Fritts, H.C. The International Tree-Ring Data Bank: An enhanced global database serving the global scientific community. Holocene 1997, 235–238. [Google Scholar] [CrossRef]
  32. Bunn, A.G. A dendrochronology program library in R (dplR). Dendrochronologia 2008, 26, 115–124. [Google Scholar] [CrossRef]
  33. R Core Team. R: A Language and Environment for Statistical Computing; R Foundation for Statistical Computing: Vienna, Austria, 2019; Available online: https://www.R-project.org/ (accessed on 1 July 2021).
  34. Efron, B.; Tibshirani, R. Bootstrap Methods for Standard Errors, Confidence Intervals, and Other Measures of Statistical Accuracy. Stat. Sci. 1986, 1, 54–77. [Google Scholar] [CrossRef]
  35. van der Maaten-Theunissen, M.; van der Maaten, E.; Bouriaud, O. pointRes: An R package to analyze pointer years and components of resilience. Dendrochronologia 2015, 35, 34–38. [Google Scholar] [CrossRef]
  36. Schweingruber, F.H.; Eckstein, D.; Serre-Bachet, F.; Bräker, O.U. Identification, presentation and interpretation of event years and pointer years in dendrochronology. Dendrochronologia 1990, 1990, 9–38. [Google Scholar]
  37. Bunn, A.G. Statistical and visual crossdating in R using the dplR library. Dendrochronologia 2010, 28, 251–258. [Google Scholar] [CrossRef]
  38. Dittmar, C.; Zech, W.; Elling, W. Growth variations of Common beech (Fagus sylvatica L.) under different climatic and environmental conditions in Europe—A dendroecological study. For. Ecol. Manag. 2003, 173, 63–78. [Google Scholar] [CrossRef]
  39. Graham, E.A.; Mulkey, S.S.; Kitajima, K.; Phillips, N.G.; Wright, S.J. Cloud cover limits net CO2 uptake and growth of a rainforest tree during tropical rainy seasons. Proc. Natl. Acad. Sci. USA 2003, 100, 572–576. [Google Scholar] [CrossRef] [Green Version]
  40. Di Filippo, A.; Biondi, F.; Čufar, K.; Luis, M.d.; Grabner, M.; Maugeri, M.; Presutti Saba, E.; Schirone, B.; Piovesan, G. Bioclimatology of beech (Fagus sylvatica L.) in the Eastern Alps: Spatial and altitudinal climatic signals identified through a tree-ring network. J. Biogeogr. 2007, 34, 1873–1892. [Google Scholar] [CrossRef]
  41. Rozas, V.; Camarero, J.J.; Sangüesa-Barreda, G.; Souto, M.; García-González, I. Summer drought and ENSO-related cloudiness distinctly drive Fagus sylvatica growth near the species rear-edge in northern Spain. Agric. For. Meteorol. 2015, 201, 153–164. [Google Scholar] [CrossRef] [Green Version]
  42. Dulamsuren, C.; Klinge, M.; Degener, J.; Khishigjargal, M.; Chenlemuge, T.; Bat-Enerel, B.; Yeruult, Y.; Saindovdon, D.; Ganbaatar, K.; Tsogtbaatar, J.; et al. Carbon pool densities and a first estimate of the total carbon pool in the Mongolian forest-steppe. Glob. Chang. Biol. 2016, 22, 830–844. [Google Scholar] [CrossRef]
  43. Allen, C.D.; Macalady, A.K.; Chenchouni, H.; Bachelet, D.; McDowell, N.; Vennetier, M.; Kitzberger, T.; Rigling, A.; Breshears, D.D.; Hogg, E.H.; et al. A global overview of drought and heat-induced tree mortality reveals emerging climate change risks for forests. For. Ecol. Manag. 2010, 259, 660–684. [Google Scholar] [CrossRef] [Green Version]
  44. Jevšenak, J.; Tychkov, I.; Gričar, J.; Levanič, T.; Tumajer, J.; Prislan, P.; Arnič, D.; Popkova, M.; Shishov, V.V. Growth-limiting factors and climate response variability in Norway spruce (Picea abies L.) along an elevation and precipitation gradients in Slovenia. Int. J. Biometeorol. 2021, 65, 311–324. [Google Scholar] [CrossRef] [PubMed]
  45. Scharnweber, T.; Manthey, M.; Criegee, C.; Bauwe, A.; Schröder, C.; Wilmking, M. Drought matters—Declining precipitation influences growth of Fagus sylvatica L. and Quercus robur L. in north-eastern Germany. For. Ecol. Manag. 2011, 262, 947–961. [Google Scholar] [CrossRef]
  46. Dittmar, C.; Elling, W. Jahrringbreite von Fichte und Buche in Abhängigkeit von Witterung und Höhenlage: Radial growth of Norway spruce and Euripean beech in relation to weather and altitude. Forstw. Cbl. 1999, 118, 251–270. [Google Scholar] [CrossRef]
  47. Lebourgeois, F.; Bréda, N.; Ulrich, E.; Granier, A. Climate-tree-growth relationships of European beech (Fagus sylvatica L.) in the French Permanent Plot Network (RENECOFOR). Trees 2005, 19, 385–401. [Google Scholar] [CrossRef]
  48. Weber, P.; Bugmann, H.; Rigling, A. Radial growth responses to drought of Pinus sylvestris and Quercus pubescens in an inner-Alpine dry valley. J. Veg. Sci. 2007, 18, 777–792. [Google Scholar] [CrossRef]
  49. Muffler, L.; Weigel, R.; Hacket-Pain, A.J.; Klisz, M.; Maaten, E.; Wilmking, M.; Kreyling, J.; Maaten-Theunissen, M. Lowest drought sensitivity and decreasing growth synchrony towards the dry distribution margin of European beech. J. Biogeogr. 2020, 47, 1910–1921. [Google Scholar] [CrossRef]
  50. Cavin, L.; Jump, A.S. Highest drought sensitivity and lowest resistance to growth suppression are found in the range core of the tree Fagus sylvatica L. not the equatorial range edge. Glob. Chang. Biol. 2017, 23, 362–379. [Google Scholar] [CrossRef] [Green Version]
  51. Walentowski, H.; Falk, W.; Mette, T.; Kunz, J.; Bräuning, A.; Meinardus, C.; Zang, C.; Sutcliffe, L.M.E.; Leuschner, C. Assessing future suitability of tree species under climate change by multiple methods: A case study in southern Germany. Ann. For. Res. 2014, 60, 101–126. [Google Scholar] [CrossRef] [Green Version]
  52. Zimmermann, J.; Hauck, M.; Dulamsuren, C.; Leuschner, C. Climate Warming-Related Growth Decline Affects Fagus sylvatica, But Not Other Broad-Leaved Tree Species in Central European Mixed Forests. Ecosystems 2015, 18, 560–572. [Google Scholar] [CrossRef]
  53. Sykes, M.T.; Prentice, I.C. Climate change, tree species distributions and forest dynamics: A case study in the mixed conifer/northern hardwoods zone of northern Europe. Clim. Chang. 1996, 34, 161–177. [Google Scholar] [CrossRef]
  54. Oberhuber, W. Soil water availability and evaporative demand affect seasonal growth dynamics and use of stored water in co-occurring saplings and mature conifers under drought. Trees 2017, 31, 467–478. [Google Scholar] [CrossRef] [Green Version]
  55. Boisvenue, C.; Running, S.W. Impacts of climate change on natural forest productivity—Evidence since the middle of the 20th century. Glob. Chang. Biol. 2006, 12, 862–882. [Google Scholar] [CrossRef]
  56. Bréda, N.; Huc, R.; Granier, A.; Dreyer, E. Temperate forest trees and stands under severe drought: A review of ecophysiological responses, adaptation processes and long-term consequences. Ann. For. Sci. 2006, 63, 625–644. [Google Scholar] [CrossRef] [Green Version]
  57. Weemstra, M.; Eilmann, B.; Sass-Klaassen, U.G.W.; Sterck, F.J. Summer droughts limit tree growth across 10 temperate species on a productive forest site. For. Ecol. Manag. 2013, 306, 142–149. [Google Scholar] [CrossRef]
  58. Butt, N.; Bebber, D.P.; Riutta, T.; Crockatt, M.; Morecroft, M.D.; Malhi, Y. Relationships between tree growth and weather extremes: Spatial and interspecific comparisons in a temperate broadleaf forest. For. Ecol. Manag. 2014, 334, 209–216. [Google Scholar] [CrossRef] [Green Version]
  59. Gazol, A.; Camarero, J.J.; Anderegg, W.R.L.; Vicente-Serrano, S.M. Impacts of droughts on the growth resilience of Northern Hemisphere forests. Glob. Ecol. Biogeogr. 2017, 26, 166–176. [Google Scholar] [CrossRef]
  60. Oberhuber, W.; Kofler, W. Topographic influences on radial growth of Scots pine (Pinus sylvestris L.) at small spatial scales. Plant Ecol. 2000, 146, 231–240. [Google Scholar] [CrossRef]
  61. Menzel, A.; Helm, R.; Zang, C. Patterns of late spring frost leaf damage and recovery in a European beech (Fagus sylvatica L.) stand in south-eastern Germany based on repeated digital photographs. Front. Plant Sci. 2015, 6, 110. [Google Scholar] [CrossRef] [Green Version]
  62. Príncipe, A.; van der Maaten, E.; van der Maaten-Theunissen, M.; Struwe, T.; Wilmking, M.; Kreyling, J. Low resistance but high resilience in growth of a major deciduous forest tree (Fagus sylvatica L.) in response to late spring frost in southern Germany. Trees 2017, 31, 743–751. [Google Scholar] [CrossRef]
  63. Hilton, G.M.; Packham, J.R. Variation in the masting of common beech (Fagus sylvatica L.) in northern Europe over two centuries (1800–2001). Forestry 2003, 76, 319–328. [Google Scholar] [CrossRef] [Green Version]
  64. Overgaard, R.; Gemmel, P.; Karlsson, M. Effects of weather conditions on mast year frequency in beech (Fagus sylvatica L.) in Sweden. Forestry 2007, 80, 555–565. [Google Scholar] [CrossRef]
  65. Meinardus, C.; Bräuning, A. Zur Trockenstresstoleranz von Eichen und Buchen. LWF Aktuell 2011, 85, 9–11. [Google Scholar]
  66. Buras, A.; Rammig, A.; Zang, C.S. A novel approach for the identification of pointer years. Dendrochronologia 2020, 63, 125746. [Google Scholar] [CrossRef]
Figure 1. Location of the studied forests and climate stations at Bavaria, in southeast Germany. High-elevation sites from west to east: HW (Bad Brückenau), HC (Wunsiedel), and HE (Grafenau). Low-elevation sites from west to east: LW (Würzburg), LC (Tennenlohe), and LE (Burglengenfeld).
Forests 12 01433 g001
Figure 2. Correlations between daily precipitation/maximum daily temperature and tree-ring width of Fagus sylvatica at high-elevation sites. Each value illustrates the beginning of the considered window. Only significant correlation coefficients are shown (p < 0.05). Lower case letters in the abscissa axis represent month of previous growing season, and capital letters indicate the month of the current growing season until November. Grey shading indicates the biologically inactive phase. The ordinate axis displays the window lengths.
Forests 12 01433 g002
Figure 3. Correlations between daily precipitation/maximum daily temperature and tree-ring width of Picea abies at high-elevation sites. Each value illustrates the beginning of the considered window. Only significant correlation coefficients are shown (p < 0.05). Lower case letters in the abscissa axis represent month of previous growing season, and capital letters indicate the month of the current growing season until November. Grey shading indicates the biologically inactive phase. The ordinate axis displays the window lengths.
Forests 12 01433 g003
Figure 4. Correlations between daily precipitation/maximum daily temperature and tree-ring width of Fagus sylvatica at low-elevation sites. Each value illustrates the beginning of the considered window. Only significant correlation coefficients are shown (p < 0.05). Lower case letters in the abscissa axis represent month of previous growing season, and capital letters indicate the month of the current growing season until November. Grey shading indicates the biologically inactive phase. The ordinate axis displays the window lengths.
Forests 12 01433 g004
Figure 5. Correlations between daily precipitation/maximum daily temperature and tree-ring width of Pinus sylvestris at low-elevation sites. Each value illustrates the beginning of the considered window. Only significant correlation coefficients are shown (p < 0.05). Lower case letters in the abscissa axis represent month of previous growing season, capital letters indicate the month of the current growing season until November. Grey shading indicates the biologically inactive phase. The ordinate axis displays the window lengths.
Forests 12 01433 g005
Figure 6. Pearson’s correlation coefficients between a 2-month SPEI (Standardized Potential Evapotranspiration Index) and RWI calculated for both 25-year subperiods. High-elevation sites are HW, HC, and HE. Low-elevation sites are LW, LC, and LE. Months of the year preceding tree growth are shown in lower case letters. Level of significance for the correlations are indicated at p < 0.05, < 0.01 and < 0.001 as *, **, and ***, respectively.
Forests 12 01433 g006
Figure 7. Superposed epoch analysis showing the impact of the extreme drought years 1976, 2003, and 2018 on the tree-ring index (TRI). Dark green bars illustrate high-elevation sites (HW, HC, HE); light green bars show low-elevation sites (LW, LC, LE). Hatching indicates conifers, grey bars indicate significant values with p < 0.05.
Forests 12 01433 g007
Figure 8. Climate diagrams of the climate stations close to each research site showing mean monthly temperature and mean total monthly precipitation for subperiod I and subperiod II.
Forests 12 01433 g008
Figure 9. Schematic illustration of the shift in climate–growth relationships between subperiod I (1970–1994) and subperiod II (1995–2019), with respect to precipitation and temperature. (a) Changes for F. sylvatica and P. abies at the high-elevation sites HW, HC, and HE. (b) Changes for F. sylvatica and P. sylvestris at the low-elevation sites LW, LC, and LE.
Forests 12 01433 g009
Table 1. Site characteristics: Geographic position (longitude degree °E, latitude degree °N, elevation m asl, location of climate station with mean annual precipitation sum (MAP) and mean annual temperature (MAT), geology, and predominant soils.
Site Name and AcronymSpecieslon[°E]lat[°N]Elev.
[m asl]
Climate Station
MAP/MAT
GeologySoils
Bad Brückenau (HW)F. sylvatica9.9350.3581010.0° E 50.35° N, 518 mBasaltCambisols
P. abies920 mm/8.1 °C
Wunsiedel (HC)F. sylvatica11.8049.9779511.84° E 49.98° N, 654 mSandstoneCambisols (podsolic)
P. abies1140 mm/6.4 °C
Grafenau
(HE)
F. sylvatica13.4348.9697512.92° E 48.85° N, 314 mGraniteCambisols
P. abies13.5348.91990960 mm/8.4 °CGleysols
Würzburg (LW)F. sylvatica9.8849.733359.96° E 49.77° N, 268 mLimestoneCambisols/Luvisols
P. sylvestris580 mm/9.7 °C
Tennenlohe (LC)F. sylvatica11.0349.5530011.05° E 49.5° N, 314 mSandCambisols/Podsols
P. sylvestris620 mm/9.3 °C
Burglengenfeld (LE)F. sylvatica11.9549.2141511.69° E 49.15° N, 549 mLimestoneCambisols
P. sylvestris12.0749.20395800 mm/8.0 °C
Table 2. Pointer years and the affected study sites, as well as probable climate-induced reasons. Ordered by frequency of occurrence in the chronologies.
YearStudy SiteSpeciesReason
1976HWF. sylvatica/P. abiesDrought year+
Year after a dry year
HCP. abies
LWF. sylvatica/P. sylvestris
LCF. sylvatica/P. sylvestris
LEF. sylvatica/P. sylvestris
2011HWF. sylvaticaLate frost event in spring
HCF. sylvatica/P. abies
HEF. sylvatica/P. abies
LWF. sylvatica
2018HWP. abiesDrought year
HCP. abies
LCF. sylvatica/P. sylvestris
LEP. sylvestris
2019HWP. abiesYear after a drought year+ drought year/dry summer
HCP. abies
HEP. abies
LWP. sylvestris
LCP. sylvestris
2003LWF. sylvatica/P. sylvestrisDrought year
LCF. sylvatica
1998LCF. sylvatica/P. sylvestrisYear after a dry year + dry spring/summer
LWF. sylvatica
1991HWP. abiesDrought year
HEP. abies
2012LWP. sylvestrisDry spring/summer
LEP. sylvestris
2009LWF. sylvaticaDry summer/autumn
LEF. sylvatica
2000HCF. sylvaticaDry and warm spring
LEF. sylvatica
2013LCP. sylvestrisDry spring+
LEP. sylvestrisYear after a dry year
2004HWF. sylvaticaYear after a drought year
HCF. sylvatica
2010HWF. sylvaticaYear after a warm summer/autumn
LEF. sylvatica
1987HCF. sylvaticaWet and cold summer
HEF. sylvatica
1996HEF. sylvatica/P. abiesCold summer
Publisher’s Note: MDPI stays neutral with regard to jurisdictional claims in published maps and institutional affiliations.

