Article

Genetic Structure and Geographical Differentiation of Larix sibirica Ledeb. in the Urals

1
Faculty of Biology, Perm State University, 614990 Perm, Russia
2
National Laboratory Astana, Nazarbayev University, Nur-Sultan 010000, Kazakhstan
3
HiLIFE Institute of Biotechnology, University of Helsinki, Biocenter 3, Viikinkaari 1, FI-00014 Helsinki, Finland
*
Authors to whom correspondence should be addressed.
Forests 2021, 12(10), 1401; https://doi.org/10.3390/f12101401
Submission received: 17 September 2021 / Revised: 12 October 2021 / Accepted: 13 October 2021 / Published: 14 October 2021
(This article belongs to the Special Issue Biodiversity and Conservation of Forests)

Abstract

:
The Ural Mountains and the West Eurasian Taiga forests are one of the most important centers of genetic diversity for Larix sibirica Ledeb. Forest fragmentation negatively impacts forest ecosystems, especially due to the impact of their intensive use on the effects of climate change. For the preservation and rational use of forest genetic resources, it is necessary to carefully investigate the genetic diversity of the main forest-forming plant species. The Larix genus species are among the most widespread woody plants in the world. The Siberian larch (Larix sibirica, Pinaceae) is found in the forest, forest-tundra, tundra (Southern part), and forest-steppe zones of the North, Northeast, and partly East of the European part of Russia and in Western and Eastern Siberia; in the Urals, the Siberian larch is distributed fragmentarily. In this study, eight pairs of simple sequence repeat (SSR) primers were used to analyse the genetic diversity and population structure of 15 Siberian larch populations in the Urals. Natural populations in the Urals exhibit indicators of genetic diversity comparable to those of Siberia populations (expected heterozygosity, He = 0.623; expected number of alleles, Ne = 4017; observed heterozygosity, Ho = 0.461). Genetic structure analysis revealed that the examined populations are relatively highly differentiated (Fst = 0.089). Using various algorithms for determining the spatial genetic structure, the examined populations formed three groups according to geographical location. The data obtained are required for the development of species conservation and restoration programs, which are especially important in the Middle Urals, which is the region with strong forest fragmentation.

1. Introduction

Forest fragmentation negatively impacts forest ecosystems, especially due to the impact of their intensive use on the effects of climate change [1]. The increased anthropogenic load and the intensity of forest exploitation increase forest sensitivity to global climate changes and consequently to a shift in the boundaries of the woody plant area of species. In addition, reduction in forest areas is currently observed worldwide due to adverse natural phenomena (floods, fires), damage to tree species by diseases and pests, and intensive human use of forest resources [2]. In this regard, one of the main tasks is to develop fundamental principles and experimental approaches to identify tree forms that have the potential for climatic adaptation, at which the genetic potential, diversity, and ecological variability of the forest woody plants in different climatic conditions play a key role. In the Urals, the zone of introgression of the genus Pinaceae species is located in which unique combinations of genotypes of species and their hybrids are concentrated, and their ecological plasticity is distinguished. The genetic structure and diversity of populations of woody species are formed under the influence of factors such as genetic drift, mutation, migration and selection, and environmental factors [2,3]. In addition, anthropogenic factors also affect the genetic structure of woody plant populations [1]. Consequently, the study of the current state of forest genetic resources and genetic structure of the main forest-forming types of conifer populations is important both in government projects to preserve plant resources and in applied aspects of their rational use in economic interests [4,5]. The primary focus has been on the study of gene pools of forest resource plant species that occupy extensive ranges and have economic importance. One of these types of coniferous plants is the species of Larix Mill, which are the primary species of the boreal forests of the Northern hemisphere [6,7]. In the Urals, the Larix genus is represented by the West Race of the Siberian Larch or Russian Larch (Larix sibirica) [8]. The coniferous wood is characterized by many favorable qualities and is universal in its application. Besides the physicomechanical properties that are valued in the construction industry, larch contains several useful substances that are prospective raw materials for the forestry industry. Larch contains biologically active substances (BAS) such as phenols, polyphenolic compounds, and pectin, among others [9]. The investigation of genetic diversity, structure, differentiation, and identification of L. sibirica populations is also important for studying the content of resin acids as promising BAS [10,11,12]. Molecular genetic research in larch has been actively conducted since the end of 1980, both in Russia and elsewhere, via the application of isozyme and DNA markers. Currently, a large amount of structural data has been accumulated on the genetic diversity and differentiation of populations of various types of Siberian larch [13,14,15,16,17,18,19,20,21,22]. Previous studies addressing the genetic diversity of this species revealed lower indices of genetic variability in L. sibirica, consistent with its narrow endemic status. Application of only isozyme markers made it possible to study some of the genetic diversity in expressed protein-coding genes, which in the conifer genome amounts to only 1–2%, whereas the main part of the genome has been characterized with a variety of DNA markers and next-generation sequencing (NGS) technologies [23,24,25,26]. For example, DNA markers based on microsatellite repeats (simple sequence repeats; SSR) are used to explore genetic polymorphisms of conifer species, including Larix species [27,28,29,30,31]. Microsatellites, or STRs, are repetitive sequences of 2–6 bp tandemly repeated units of DNA that are present throughout the entire genome. Microsatellite markers are codominant and multiallelic and efficient for allelic diversity study [32], which makes them an effective tool in population genetics, to study genetic diversity and structure. A combination of microsatellite markers with capillary electrophoresis significantly increases the accuracy of the analysis. Data from many years of research in the Urals (including in Perm Krai) clearly revealed the fragmentation of larch stands. In addition, in this region, the “larchless tongue” of the western macroslope of the Ural Mountains is located and is marked on all species distribution maps [33,34,35]. At the same time, it is in this “Permian-Kama Pre-Ural” population that the highest level of species diversity in the Urals is established, as revealed by data from morphological and isozyme analyses [36]. The interpopulation genetic differentiation of Siberian larch in various forest conditions of the Urals is influenced by a combination of factors, such as isolation and natural selection. The spatial genetic structure of populations is also largely determined by the history of the formation of the species’ range [37,38,39]. Thus, currently the genetic diversity and structure of the Ural populations of L. sibirica has been relatively well studied only on the basis of polymorphisms of isozyme markers [36] and with inter-simple sequence repeat (ISSR) markers [40,41]. Genetic polymorphisms of other types of molecular markers of species of the genus Larix in the Urals, also including microsatellite markers, has been studied fragmentarily and the data obtained are insufficient for comprehensive assessment of the genetic structure and differentiation of the species in this region. Although the genetic diversity and population structure of L. sibirica populations have been addressed previously [40,41], here we provide a new approach and obtained more precise genetic diversity characterization by using microsatellites markers. In this regard, study of the genetic structure, population differentiation, and nature of the alleles of L. sibirica distribution from the Ural Mountains and West Eurasian Taiga forests based on polymorphism analysis of microsatellite markers. This is an urgent task for the preservation of populations that are productive and resistant to various environmental factors in conditions of fragmentation of the area of the species.
In this study, we used a new collection of samples from 15 populations of the western race of Siberian larch (Larix sibirica) from the Northern, Middle, and Southern Urals to systematically analyse the genetic variations and population structure of this collection based on analysis of polymorphisms of microsatellite markers. Explanations are also provided on the role of geographical isolation and environmental heterogeneity in genetic differentiation among regions in the Ural Mountains and West Eurasian Taiga forests.

2. Materials and Methods

2.1. Sample Collection and DNA Extraction

During the 2015 to 2020 growing seasons, we collected young leaves (needles) of individuals from 28 to 32 trees in each of the 15 populations of the western race of the Siberian larch (Larix sibirica Ledeb. (L. sukaczewii Dyl.)) (Figure S1). The samples selected for the study were from a wide altitudinal-latitudinal gradient; the study region length was more than 1000 km from North to South, and the altitude varied from 190 to 916 meters above sea level (Supplementary Table S1). The studied samples were conditionally divided into mountain (from 500 meters above sea level) and flat (up to 500 meters above sea level). Five populations were from the South Urals in Chelyabinsk district and the Republic of Bashkortostan, five were from the Middle Urals in Sverdlovsk district and in Perm Krai, and the last five populations were from the Northern Urals in the Perm Krai (Supplementary Table S1).
DNA was isolated according to a procedure for complex biological samples [42]. The weighed amount of needles was up to 20 mg. A NanoDrop 2000 spectrophotometer (Thermo Fischer Scientific, Waltham, MA, USA) was used to determine the concentration and quality of DNA. The DNA pellets were dissolved in 1× TE buffer (1 mM EDTA, 10 mM Tris-HCl, pH 8.0). The resultant DNA for each isolate was diluted with 1× TE solution to 10 ng/μL and used as a template for PCR experiments.

2.2. Microsatellite Amplification

In this study, eight polymorphic SSR primer pairs (Table 1) were used for further analysis, which were developed by Isoda and Watanabe (2006) and Wagner (2012) and showed effective differentiation for L. kaempferi and L. decidua samples [28,43]. These eight SSR primer pairs were organized in multiplexes pairwise according to the expected allele range size for efficient multiplex analysis of the amplification products. An M13 universal adapter sequence (5′-TGTAAAACGACGGCCAGT-3′) labeled with fluorochromes (FAM and JOE dyes) was used for the amplification of fluorescently labeled PCR products. PCR amplification was conducted in a total volume of 20 μl and contained 1× PCR buffer with 2.5 mM MgCl2, 0.25 μM of reverse primer, 0.2 μM of forward primer with M13 tail, 0.05 μM of fluorescently labeled M13 primer, 0.2 mM each dNTP, 1 unit of SynTaq DNA polymerase (Syntol, Moscow, Russia), and 50 ng DNA template. PCR amplification was performed in a CFX96 (Bio-Rad, Hercules, CA, USA) under the following conditions: initial denaturation step at 94 °C for 10 min followed by 30 cycles at 94 °C for 30 s, 52–58 °C for 45 s, 72 °C for 45 s, 8 cycles at 94 °C for 30 s, 53 °C for 45 s, 72 °C for 45 s, and final extension at 72 °C for 5 min. The amplification products were separated by electrophoresis in 2% agarose gel in 1× TBE buffer, stained with ethidium bromide, and photographed under UV light in a GelDoc XR gel documentation system (Bio-Rad, Hercules, CA, USA) (Figure S2). Molecular weight marker GeneRuler 100 bp Plus DNA Ladder (Thermo Fischer Scientific, Waltham, MA, USA) and Quantity One software (Bio-Rad, USA) were used to determine DNA fragment lengths. The PCR amplicons were separated by capillary electrophoresis on a Genetic Analyzer 3500xl (Applied Biosystems, Waltham, MA, USA) using the POP7 matrix and 600 LIZ (Thermo Fisher Scientific, Waltham, MA, USA) as a dye size standard. GeneMarker v2.6.3 (ABI) software was used to determine the genotypes.
Analysis of chromatograms to determine fragment lengths was performed using GeneMarker v2.6.3 software. Computer analysis of DNA polymorphism was performed using Arlequin v3.5.2.2 [44] and a specialized macro GenAlEx v6.5 [45] for MS Excel. Migration test was performed using STRUCTURE v2.3.4 [46] software with the parameters specified in Supplementary Table S2. Calculation of the Goldstein distance matrix [47] and the construction of the minimum spanning tree was performed in EDENetworks v2.18 [48]. Dendrogram construction was performed in MEGA X [49] using UPGMA and least-squares analysis. Analysis using the method of principal coordinates was performed using the PAST v4.06 program [50]. For each sample, 19 basic climatic parameters were obtained from the bioclimatic variables database of the WorldClim service (https://www.worldclim.org/data/worldclim21.html, accessed date August 2021) using the raster v3.4-13 package [51]; on this basis, a distance matrix is formed by calculating Canberra distance. Correlation analysis of genetic and climatic distances (Mantel test) was performed in GenAlEx macro. MavericK v1.0.5 software [52] was used with the parameters specified in Supplementary Table S3 to analyse and visualize the genetic structure and study the correspondence between clusters of genotypes and the studied populations.

3. Results

3.1. Polymorphic SSR Primers

The optimal pairs of primers and fluorescent dyes were determined, which allowed multiplex PCR and efficient separation of amplified fragments of different loci. For FAM dye, such combinations were the bcLK189 and Ld101 and bcLK253 and Ld50 primer pairs. For JOE dye, these were the bcLK228 and Ld56 and bcLK263 and Ld42 primer pairs.
The results of capillary electrophoresis confirmed the success and specificity of the amplification under the selected conditions (Supplementary Figure S3).

3.2. Polymorphism of Microsatellite Markers in 15 Populations of L. sibirica

Eight SSR loci were used to analyse the polymorphisms of L. sibirica microsatellite loci. All loci were polymorphic (P95 = 1000) for the studied populations. The total number of alleles per locus for 451 individuals from 15 populations varied from 4 (bcLK253) to 37 (bcLK263). The total number of SSR markers installed was 109. The absolute and effective number of alleles per locus was the largest in the Vsn populations growing in the vicinity of the village Verkhnyaya Sanarka in Chelyabinsk district (Na = 8.500, Ne = 5.276); the smallest was in the Sks populations (Na = 4.250, Ne = 2.283) from the protected areas “Larch Grove” in the Suksunsky district of the Perm Krai. The average values of these indicators were Na = 6.942 and Ne = 4.017 (Table 2). Observed (Ho) and expected heterozygosity (He) for the total populations of L. sibirica were 0.461 and 0.623, respectively. These indicators were greatest in the populations Irm (Ho = 0.567) and Gai (He = 0.682) and smallest in the populations Ish (Ho = 0.366) and Sks (He = 0.520). Thus, a high level of genetic diversity of L. sibirica was revealed in Ural (observed number of alleles Na = 6.942, expected number of alleles Ne = 4.017, HO = 0.461, He = 0.623).

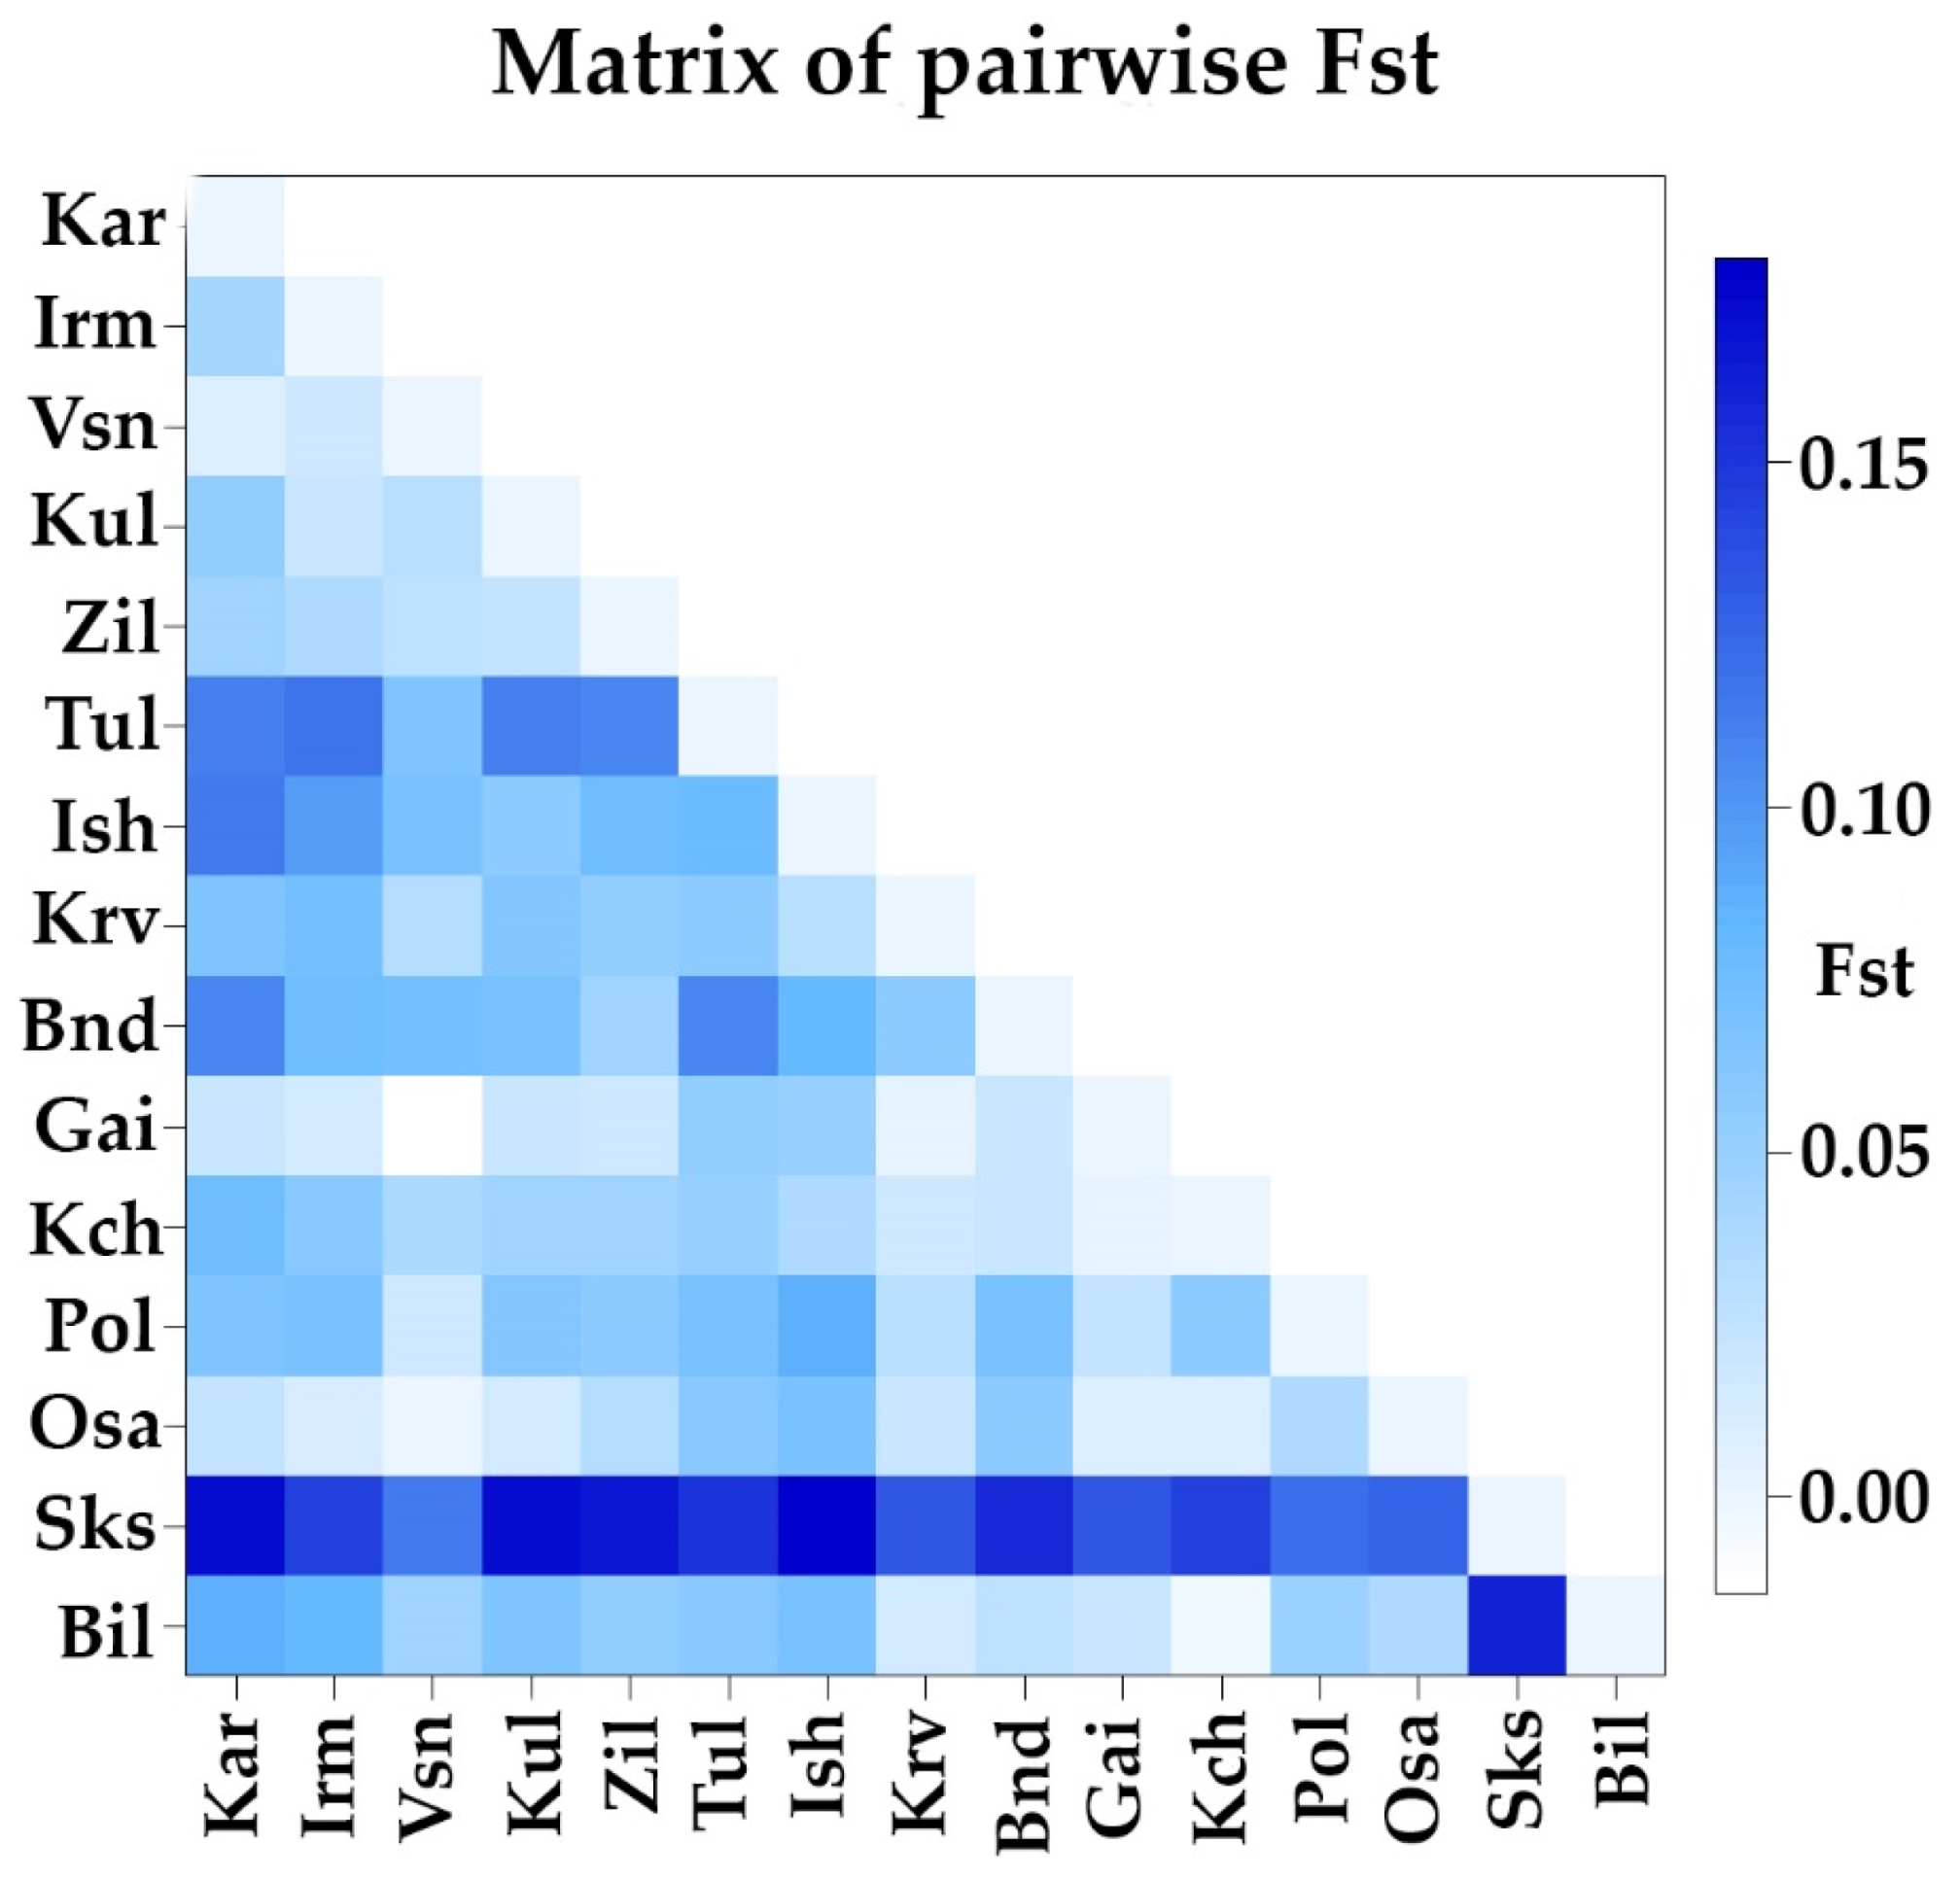
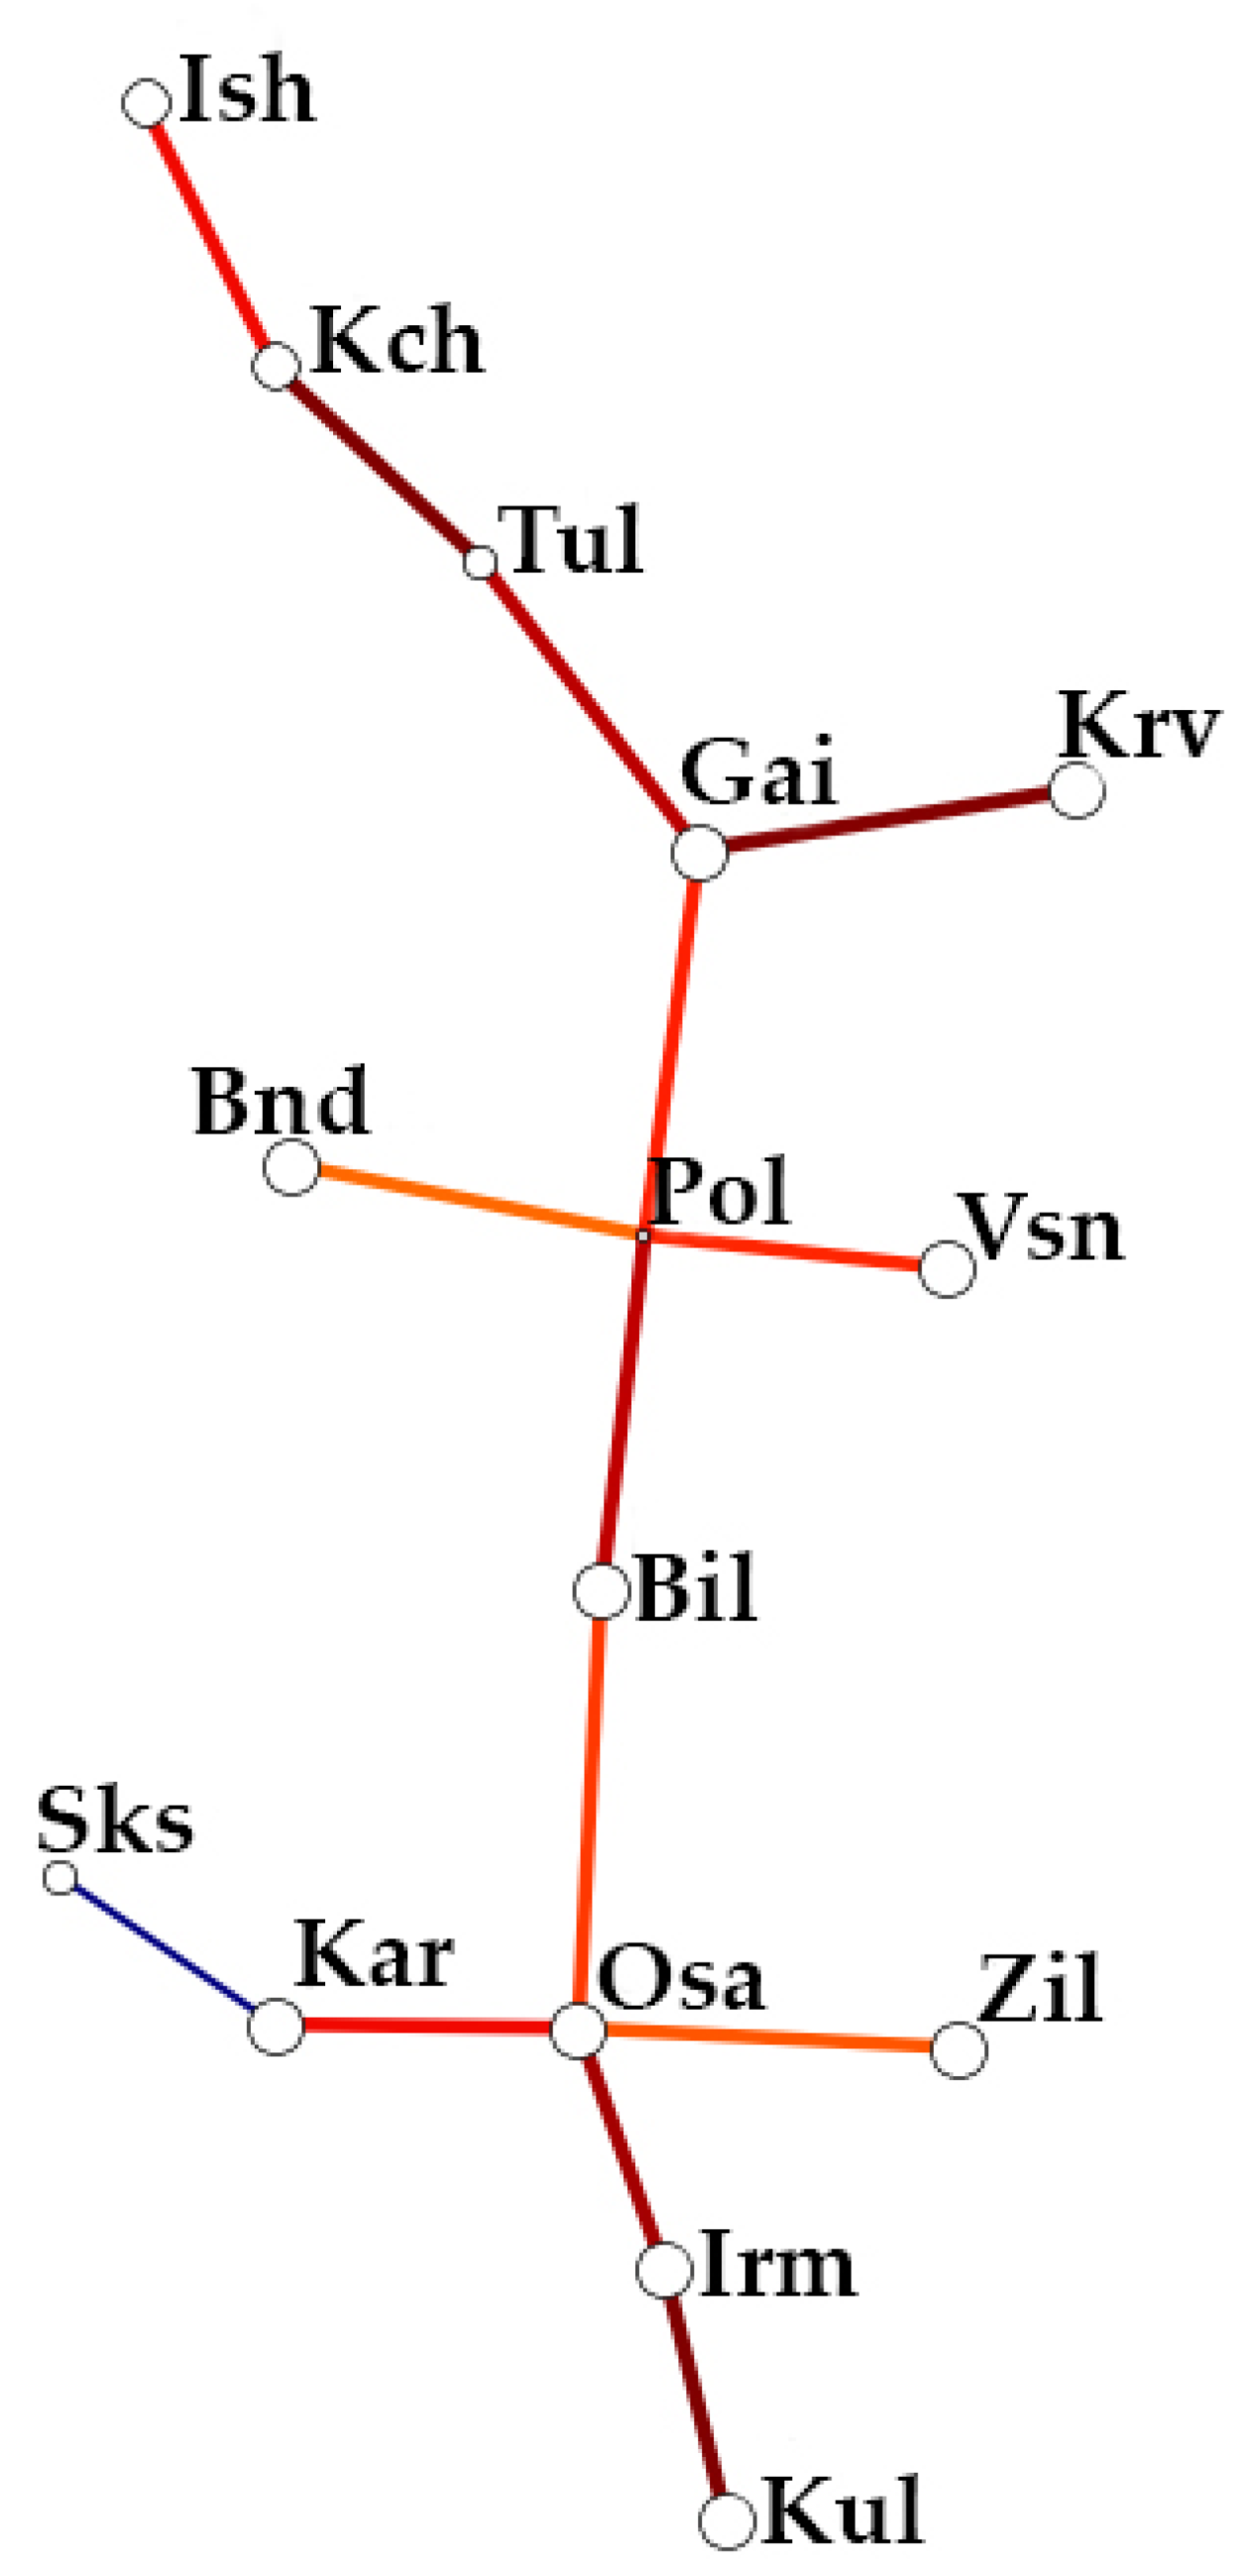
3.3. Analysis of the Genetic Structure and Differentiation of the Studied Populations of Siberian Larch

The genetic structure parameters analysis for the total sample of L. sibirica showed that the Ld56 locus made the greatest contribution to the differentiation of the studied populations (Table 3). All studied populations of L. sibirica are characterized by a deficiency of heterozygous genotypes. A population structure study using Wright’s F-statistics showed that L. sibirica in the Urals had on average 26% deficiency of heterozygous genotypes (Fis = 0.259) within the population and 32% deficiency of heterozygotes (Fit = 0.325) between populations. Only 8.9% of all observed variability falls on the interpopulation component. The Ld56 locus made the greatest contribution to the differentiation of the studied populations (Table 3). Analysis of molecular variance (AMOVA) of the genetic diversity distribution in the region revealed that the populations of the Northern, Middle, and Southern Urals are almost the same in the allelic composition of SSR loci (Supplementary Table S4).
The interregional share of diversity accounts for only 2% and interpopulation 5%, while the main part falls on individual heterozygosity. When comparing the subdivision levels among the populations from different Urals regions, the most differentiated are the populations from the Middle Urals (Fst = 7%). The South Ural and North Ural populations have a similar level of differentiation (PhPT = 5%). The migration test showed only a small proportion of the admixture of genetic material from other populations (Supplementary Figure S4). The matrix of pairwise FST values was constructed and visualized (Supplementary Table S5, Figure 1). The Sks sample is clearly distinguished by high values (Fst from 0.114 to 0.180).
The matrix of the pairwise differences average number between and within populations and Nei’s distance were also visualized (Supplementary Figure S5). The largest number of differences was found between the populations Irm and Tul (5.334) and the smallest between the populations Ish and Osa (3.793). The Osa sample is distinguished as the least different from other populations in general. The number of intrapopulation differences is greatest in the Irm sample (5.054) and smallest in the Sks sample (3.181). The distribution between populations Nei’s distance coincides with the Fst distribution. On the basis of the Goldstein distance matrix using the UPGMA (Unweighted Pair Group Method with Arithmetic mean) method and least-squares analysis, a dendrogram was constructed that reflects the degree of the studied populations' similarity by SSR spectra (Supplementary Figure S6A). Three clusters are clearly distinguished on the dendrogram. The first cluster combines the populations Irm, Kul, Osa, Kar, and Zil (Southern group); the second combines Bnd, Vsn, Bil, and Pol (Middle group); the third combines Ish, Gai, Krv, Kch, and Tul (Northern group). The Sks sample differs markedly from all others and can be considered as a separate group. A minimum spanning tree was also constructed (Figure 2), the structure of which perfectly matches the dendrogram. Principal coordinate analysis (PCoA) also confirmed this subdivision into groups (Supplementary Figure S6B).
While correlation analysis did not reveal a close correlation between the geographic and genetic distances among the populations (r2 = 0.0006; p = 0.060), a significant (Figure S8) mean positive correlation (r2 = 0.570; p = 0.040) in the mountain populations group (Irm, Kul, Kch, Tul, Ish) was revealed. In addition, correlation analysis of climatic and genetic distances was performed, which revealed a weak correlation (r2 = 0.0648, p = 0.05). A significant points scatter (Supplementary Figure S7) suggested that for certain groups of populations, the correlation may be strong.
Additional analysis revealed a strong correlation for the southern group of populations (Supplementary Figure S8) (r2 = 0.5989, p = 0.08). The correlation was low for the other two groups (p > 0.25).
To analyse the population structure, the following three models were compared: no admixture, admixture with fixed alpha = 1, and admixture with variable alpha in the MavericK software [52]. The alpha parameter determines the likelihood of influx of genes from other studied populations; at alpha = 1, the influx of genes from any population is equally probable. The comparison showed that the admixture with the variable alpha model is the most reliable (Supplementary Figure S9-I).
Using the chosen model, the reliability values were calculated for genetic clusters with a possible number of clusters K from 1 to 10. The most reliable selection of four clusters is shown in Supplementary Figure S9-II. For K = 4, the Q-matrix of the distribution of groups of genotypes by sample was calculated and visualized, and a histogram of standard errors of such a distribution was drawn (Figure 3). The error values did not exceed 0.05, which indicates a high reliability of the obtained structure. All genetic clusters are present in all studied populations. There are populations with one dominant cluster (Kar, Tul, Ish, and Sks).

4. Discussion

4.1. Polymorphism of Microsatellite Markers in 15 Populations of L. sibirica

In our study of 15 populations of the Siberian larch western race in the Northern, Middle, and Southern Urals, eight SSR loci were used to analyse the polymorphisms of microsatellite loci, which were polymorphic. High values of the genetic diversity of the studied populations were also obtained (Na = 6.942; Ne = 4.017; Ho = 0.461; He = 0.623). When compared with the data of other studies of larch and related species from other growing regions, the values of the obtained parameters generally did not show large differences and are at the general level of genetic diversity of larch trees and are slightly inferior only to the populations of Gmelin larch in the Far East [27,31,53].

4.2. Analysis of the Genetic Structure and Differentiation of the Populations of Siberian Larch Studied

The populations studied were divided into three groups according to their geographical location (South, Middle, and North Urals). The Sks sample was an exception and grew in the protected areas “Larch Grove” and separated into an individual group. We assume that this sample may be of artificial origin, which makes it different from other region populations. In addition, analysis of the population structure showed that one genotype is significantly dominant in the Sks sample, which may be a consequence of the sample origin from a group of closely related trees. A similar pattern is observed in the Tul, Ish, and Kar populations. The first two (Tul, Ish) are the most northern of the populations studied and grew at a higher altitude (from 680 to 916 meters). In this regard, the dominance of individual genotypes may be due to the action of long-term natural selection and adaptation to high-altitude conditions. The Kar sample grows in the region that represents an ecological disaster zone due to the emission of pollutants from the production of copper ore [54]. Such anthropogenic load could serve as a key factor for selection and affect the structure of the population’s gene pool. Similar results were obtained by us previously using the ISSR method, but a high degree of differentiation was revealed, which is probably associated with the analysis of different structural elements of genomes using SSR and ISSR methods. According to molecular variability (AMOVA) analysis, the main part of genetic diversity falls on the individual heterozygosity of individuals (60%), while interpopulation (5%) and interregional (2%) differences are minimal. This revealed that our study level of subdivision of the western race L. sibirica populations for the entire study region (Northern, Middle, and Southern Urals) was mainly higher than that for Siberian larch (and other species of the genus Larix) from other growing areas. Thus, 8.9% of all observed variability falls on the interpopulation component, while this indicator in other studies ranges from 6% to 7% and reaches 8% only for L. gmelinii in the Far East [27,31,36,53]. Studies of L. decidua revealed an almost complete absence of intraspecific differentiation of the studied populations of Romania [31]. Studies of the genetic structure of larch in the Urals using isozyme markers showed a lower degree of differentiation (6.1%) compared to SSR, which can be explained by the fact that different structural elements of the genome were studied [36]. All the populations of L. sibirica we studied are characterized by a deficit of heterozygous genotypes at approximately the same level (on average, a 26% deficit within a population and a 32% deficit of heterozygotes between populations were found), as in previous studies of other species of the genus Larix. The populations of the Middle Urals have the greatest subdivision (FST = 7.1%), while in the North and South, they have similar values of about 5%. High differentiation may be a consequence of the fragmented range of L. sibirica in the studied region due to the intense anthropogenic load in the last century [36]. This was also confirmed by the migration test, which did not reveal a significant gene flow between the populations. The species range fragmentation reduces the possibilities of gene flow between populations when mixing their gene pools, causes genetic drift, and increases the frequency of closely related crossing [55]. All these processes reduce the adaptive potential of trees [56] due to the influence on the genetic diversity and structure of populations [57]. We revealed the relationship between geographical and genetic distances, but only for mountain populations (Irm, Kul, Kch, Tul, Ish). It is probable that climatic differences, which affect the time of tree dusting in different populations, also contribute to the differentiation. In turn, climatic differences are determined not only by the latitudinal-longitudinal location, but also by the surrounding relief peculiarities, including the proximity of the Ural Mountains. This was partially confirmed by the positive correlation between climatic and genetic distances in the Southern group of populations (r2 = 0.5989, p = 0.08). Different environmental conditions determine the population structure complexity of any species. At the same time, the complex spatial structure of populations only partially affects their differentiation, while most of the interpopulation differences have a complex multicomponent nature. The uniqueness, diversity, and historical factors of the natural systems development of the Urals also determine the population structure complexity of L. sibirica in the region. In addition, the decrease in forest areas and their fragmentation lead to increases in carbon dioxide release into the atmosphere [2], which can accelerate temperature increase on the planet. The data obtained will contribute to the adoption of measures for the conservation of populations of one of the most common species of the genus Larix. The revealed genotypes and alleles that are resistant to various environmental factors under conditions of the species range fragmentation will lay the foundation for further marker-mediated selection to create plantations that are resistant to climate change. Thus, our studies have shown that the studied populations of L. sibirica in the Urals are relatively highly differentiated. This is due to the high degree of area fragmentation, especially in the Middle Urals. The level of genetic diversity comparable to that in other populations of Siberian larch in Siberia and in other representatives of the genus Larix [25,29,51]. Based on knowledge about the variability nature and population structure, it is recommended to select populations of Irm and Pol as having sufficient genetic diversity to preserve the L. sibirica gene pool in the region on a population basis. Attention should also be paid to the Kar sample, which grows in a zone of high anthropogenic load, and the Ish and Tul populations, which grow in high-altitude conditions. The data obtained are required for development of conservation and restoration programs for L. sibirica, which is especially important in the Middle Urals (a region with strong forest fragmentation). In this region, there is a local spatial structuredness of the gene pools of populations and a general trend toward a decrease in genetic diversity in isolated populations. Further fragmentation of the range and an increase in the number of spatially isolated habitats with extremely small sizes and different genetic pools may pose a threat to the long-term survival of populations and the sustainability of forestry. To preserve the genetic structure of Siberian larch populations, during reforestation, it is necessary to use seed material taken from genetically close populations and to maintain the genetic diversity of populations at a high level to preserve the adaptive potential of the species. The revealed patterns are of interest when planning and conducting forestry activities.

Supplementary Materials

The following are available online at https://www.mdpi.com/article/10.3390/f12101401/s1, Table S1: Studied populations of L. sibirica, Table S2: STRUCTURE startup options, Table S3: MavericK startup options, Table S4: Assessment of genetic interregional and interpopulation variability of L. sibirica populations based on the results of molecular variance analysis (AMOVA), Table S5: Pairwise FST matrix for 15 populations of Siberian larch in the Urals, Figure S1: Schematic map of the location of the studied populations of L. sibirica, Figure S2: Results of amplification of L. sibirica DNA with primer bcLK228 under optimal conditions. Figure S3: Chromatograms of electrophoretic separation of amplification products, Figure S4: STRUCTURE genetic migration test for L. sibirica, Figure S5: Average number of pairwise differences, Figure S6: Genetic structure of L. sibirica populations, Figure S7: Graph of dependence of genetic and geographical distances, Figure S8: Mantel test for the WorldClim data and Goldstein distance, Figure S9: Probabilistic models for the MavericK program.

Author Contributions

Data curation, S.B. and Y.V.; formal analysis and investigation, N.C., A.Z. and Y.N.; methodology, R.K.; resources, S.B.; supervision, S.B. and R.K.; validation, S.B. and Y.V.; statistical analysis, N.C., A.Z. and Y.N.; writing—original draft, S.B., R.K. and Y.V.; writing—review and editing, S.B. and R.K. All authors have read and agreed to the published version of the manuscript.

Funding

This study was funded within the framework of state assignment no. FSNF-2020-0008 of the Federal State Autonomous Educational Institution for Higher Education “Perm State National Research University” in science and by the Government of Perm Krai, research project No. C-26/174.3 dated 31.01.2019.

Data Availability Statement

Data is contained within the article or Supplementary Material.

Acknowledgments

The authors wish to thank Derek Ho (The University of Helsinki Language Centre) for outstanding editing. Open access funding provided by the University of Helsinki, including the Helsinki University Library.

Conflicts of Interest

The authors declare no conflict of interest.

References

  1. Hamrick, J.L.; Godt, M.J.W.; Gonzales, E. Conservation of genetic diversity in old-growth forest communities of the southeastern United States. Appl. Veg. Sci. 2006, 9, 51–58. [Google Scholar] [CrossRef]
  2. FAO. Global Forest Resources Assessment: Main Report; FAOSTAT: Rome, Italy, 2020; p. 184. [Google Scholar]
  3. Balloux, F.; Lugon-Moulin, N. The estimation of population differentiation with microsatellite markers. Mol. Ecol. 2002, 11, 155–165. [Google Scholar] [CrossRef] [PubMed] [Green Version]
  4. Porth, I.; El-Kassaby, Y. Assessment of the Genetic Diversity in Forest Tree Populations Using Molecular Markers. Diversity 2014, 6, 283–295. [Google Scholar] [CrossRef] [Green Version]
  5. Yanbaev, Y.; Sultanova, R.; Blonskaya, L.; Bakhtina, S.; Tagirova, A.; Tagirov, V.; Kulagin, A. Gene pool of Scots pine (Pinus sylvestris L.) under reforestation in extreme environment. Wood Res. 2020, 65, 459–470. [Google Scholar] [CrossRef]
  6. Schmidt, W.C. Around the World with Larix: An Introduction. Ecol. Manag. Larix For. Look Ahead 1995, 6–18. [Google Scholar]
  7. Brandt, J.P.; Flannigan, M.D.; Maynard, D.G.; Thompson, I.D.; Volney, W.J.A. An introduction to Canada’s boreal zone: Ecosystem processes, health, sustainability, and environmental issues. Environ. Rev. 2013, 21, 207–226. [Google Scholar] [CrossRef]
  8. Semerikov, V.L. Population structure and molecular systematics of Larix Mill. species. Ext. Abstr. Dr. (Biol.) Diss. 2006. [Google Scholar]
  9. Fedorov, V.S.; Ryazanova, T.V. Bark of Siberian Conifers: Composition, Use, and Processing to Extract Tannin. Forests 2021, 12, 1043. [Google Scholar] [CrossRef]
  10. Liu, X.; Chen, W.; Liu, Q.; Dai, J. Abietic acid suppresses non-small-cell lung cancer cell growth via blocking IKKbeta/NF-kappaB signaling. Onco. Targets Ther. 2019, 12, 4825–4837. [Google Scholar] [CrossRef] [Green Version]
  11. Talevi, A.; Cravero, M.S.; Castro, E.A.; Bruno-Blanch, L.E. Discovery of anticonvulsant activity of abietic acid through application of linear discriminant analysis. Bioorg. Med. Chem. Lett. 2007, 17, 1684–1690. [Google Scholar] [CrossRef]
  12. Ito, Y.; Ito, T.; Yamashiro, K.; Mineshiba, F.; Hirai, K.; Omori, K.; Yamamoto, T.; Takashiba, S. Antimicrobial and antibiofilm effects of abietic acid on cariogenic Streptococcus mutans. Odontology 2020, 108, 57–65. [Google Scholar] [CrossRef]
  13. Cheliak, W.M.; Pitel, J.A. Inheritance and Linkage of Allozymes in Larix laricina. Silvae Genet. 1985, 34, 142–147. [Google Scholar]
  14. Fins, L.; Seeb, L.W. Genetic Variation in Allozymes of Western Larch. Can. J. For. Res. 1986, 16, 1013–1018. [Google Scholar] [CrossRef]
  15. Lewandowski, A.; Berczyk, J.; Mejnartowicz, L. Genetic Structure and the Mating System in an Old Stand of Polish Larch. Silvae Genet. 1991, 40, 75–79. [Google Scholar]
  16. Semerikov, V.L.; Matveev, A.V. Investigation of Genetic Variation of Allozyme Loci in Siberian Larch Larix sibirica Ledb. Russ. J. Genet. 1995, 34, 944–949. [Google Scholar]
  17. Shigapov, Z.K.; Putenikhin, V.P.; Shigapova, A.I.; Urazbakhtina, K.A. Genetic Structure of the Ural Populations of Larix sukaczewii. Russ. J. Genet. 1998, 34, 54–63. [Google Scholar]
  18. Larionova, A.Y.; Yakhneva (Oreshkova), N.V.; Kuz’mina, N.A. Genetic Variation of Siberian Larch in the Lower Angara River Basin. Lesovedenie 2003, 4, 17–22. [Google Scholar]
  19. Oreshkova, N.V.; Barchenkov, A.P. Genetic Peculiarities and Morphological Variability of Siberian Larch in Altai–Sayany Mountain Region. Vestn. Krasn. Gos. Agrar. Univ. 2004, 40, 1127–1134. [Google Scholar]
  20. Larionova, A.; Iakhneva, N.V.; Abaimov, A.P. Genetic diversity and differentiation of Gmelin larch Larix gmelinii populations from Evenkia (Central Siberia). Genetika 2004, 40, 1370–1377. [Google Scholar] [CrossRef] [PubMed]
  21. Babushkina, E.A.; Vaganov, E.A.; Grachev, A.M.; Oreshkova, N.V.; Belokopytova, L.V.; Kostyakova, T.V.; Krutovsky, K.V. The effect of individual genetic heterozygosity on general homeostasis, heterosis and resilience in Siberian larch (Larix sibirica Ledeb.) using dendrochronology and microsatellite loci genotyping. Dendrochronologia 2016, 38, 26–37. [Google Scholar] [CrossRef] [Green Version]
  22. Oreshkova, N.V.; Putintseva, Y.A.; Sharov, V.V.; Kuzmin, D.A.; Krutovsky, K.V. Development of microsatellite genetic markers in Siberian larch (Larix sibirica Ledeb.) based on the de novo whole genome sequencing. Russ. J. Genet. 2017, 53, 1194–1199. [Google Scholar] [CrossRef] [Green Version]
  23. Li, S.; Ramakrishnan, M.; Vinod, K.K.; Kalendar, R.; Yrjälä, K.; Zhou, M. Development and Deployment of High-Throughput Retrotransposon-Based Markers Reveal Genetic Diversity and Population Structure of Asian Bamboo. Forests 2019, 11, 31. [Google Scholar] [CrossRef] [Green Version]
  24. Kalendar, R.; Muterko, A.; Boronnikova, S. Retrotransposable Elements: DNA Fingerprinting and the Assessment of Genetic Diversity. Methods Mol. Biol. 2021, 2222, 263–286. [Google Scholar] [CrossRef]
  25. Voronova, A.; Rendon-Anaya, M.; Ingvarsson, P.; Kalendar, R.; Rungis, D. Comparative Study of Pine Reference Genomes Reveals Transposable Element Interconnected Gene Networks. Genes 2020, 11, 1216. [Google Scholar] [CrossRef]
  26. Kalendar, R.; Schulman, A.H. Transposon-based tagging: IRAP, REMAP, and iPBS. Methods Mol. Biol. 2014, 1115, 233–255. [Google Scholar] [CrossRef] [Green Version]
  27. Oreshkova, N.V.; Belokon, M.M.; Jamiyansuren, S. Genetic diversity, population structure, and differentiation of Siberian larch, Gmelin larch, and Cajander larch on SSR-marker data. Russ. J. Genet. 2013, 49, 178–186. [Google Scholar] [CrossRef]
  28. Wagner, S.; Gerber, S.; Petit, R.J. Two highly informative dinucleotide SSR multiplexes for the conifer Larix decidua (European larch). Mol. Ecol. Resour. 2012, 12, 717–725. [Google Scholar] [CrossRef]
  29. Chen, X.B.; Xie, Y.H.; Sun, X.M. Development and characterization of polymorphic genic-SSR markers in Larix kaempferi. Molecules 2015, 20, 6060–6067. [Google Scholar] [CrossRef] [PubMed] [Green Version]
  30. Dong, M.; Wang, Z.; He, Q.; Zhao, J.; Fan, Z.; Zhang, J. Development of EST-SSR markers in Larix principis-rupprechtii Mayr and evaluation of their polymorphism and cross-species amplification. Trees 2018, 32, 1559–1571. [Google Scholar] [CrossRef]
  31. Gramazio, P.; Plesa, I.M.; Truta, A.M.; Sestras, A.F.; Vilanova, S.; Plazas, M.; Vicente, O.; Boscaiu, M.; Prohens, J.; Sestras, R.E. Highly informative SSR genotyping reveals large genetic diversity and limited differentiation in European larch (Larix decidua) populations from Romania. Turk. J. Agric. For. 2018, 42, 165–175. [Google Scholar] [CrossRef]
  32. Liewlaksaneeyanawin, C.; Ritland, C.E.; El-Kassaby, Y.A.; Ritland, K. Single-copy, species-transferable microsatellite markers developed from loblolly pine ESTs. Theor. Appl. Genet. 2004, 109, 361–369. [Google Scholar] [CrossRef]
  33. Dylis, N.V. Siberian larch. In Materials for Taxonomy, Geography and History; Izdatelstvo MOIP: Moscow, Russia, 1947; p. 137. [Google Scholar]
  34. Igoshina, K.N. Larch in the Urals: Materials on the History of Flora and Vegetation of the USSR; Nauka: Leningrad, Russia, 1963. [Google Scholar]
  35. Putenikhin, V.P.; Martinsson, O. Present distribution of Larix sukaczewii Dyl. In Russia; The Swedish University of Agricultural Sciences, SLU: Umea, Russia, 1995. [Google Scholar]
  36. Putenikhin, V.P.; Farukshina, G.G.; Shigapov, Z.K. Sukachev Larch in the Urals. In Variability and Population Genetic Structure; Nauka: Moscow, Russia, 2004. [Google Scholar]
  37. Polezhayeva, M.A.; Semerikov, V.L. Genetic Diversity of cpSSR Loci in Larix Genus over the Far East Areas; Bulletin of the North-East Scientific Center, Russian Academy of Sciences, Far East Branch: Moscow, Russia, 2009; Volume 2, pp. 75–83. [Google Scholar]
  38. Zhang, L.; Zhang, H.G.; Li, X.F. Analysis of genetic diversity in Larix gmelinii (Pinaceae) with RAPD and ISSR markers. Genet. Mol. Res. 2013, 12, 196–207. [Google Scholar] [CrossRef] [PubMed]
  39. Adrianova, I.Y. Genetic variability and differentiation of Kamchatka, Sakhalin and Kuril larch trees. Sib. For. J. 2014, 4, 110–116. [Google Scholar]
  40. Vasileva, Y.; Prishnivskaya, Y.; Chertov, N.; Zhulanov, A. Analysis of genetic diversity and structure of Urals populations of Western Race of Siberian larch (Larix sibirica Ledeb.) based on intermicrosatellite markers polymorphism. Bull. Sci. Pract. 2018, 4, 113–124. [Google Scholar] [CrossRef]
  41. Vasilyeva, Y.S.; Sboeva, Y.V.; Boronnikova, S.V.; Chertov, N.V.; Beltyukova, N.N. Genetic diversity, genetic structure and differentiation of Siberian larch populations in the Urals. Turczaninowia 2020, 23, 67–82. [Google Scholar] [CrossRef]
  42. Kalendar, R.; Boronnikova, S.; Seppanen, M. Isolation and Purification of DNA from Complicated Biological Samples. Methods Mol. Biol. 2021, 2222, 57–67. [Google Scholar] [CrossRef]
  43. Isoda, K.; Watanabe, A. Isolation and characterization of microsatellite loci from Larix kaempferi. Mol. Ecol. Notes 2006, 6, 664–666. [Google Scholar] [CrossRef]
  44. Excoffier, L.; Lischer, H.E. Arlequin suite ver 3.5: A new series of programs to perform population genetics analyses under Linux and Windows. Mol. Ecol. Resour. 2010, 10, 564–567. [Google Scholar] [CrossRef]
  45. Peakall, R.O.D.; Smouse, P.E. genalex 6: Genetic analysis in Excel. Population genetic software for teaching and research. Mol. Ecol. Notes 2006, 6, 288–295. [Google Scholar] [CrossRef]
  46. Hubisz, M.J.; Falush, D.; Stephens, M.; Pritchard, J.K. Inferring weak population structure with the assistance of sample group information. Mol. Ecol. Resour. 2009, 9, 1322–1332. [Google Scholar] [CrossRef] [Green Version]
  47. Goldstein, D.B.; Ruiz Linares, A.; Cavalli-Sforza, L.L.; Feldman, M.W. An evaluation of genetic distances for use with microsatellite loci. Genetics 1995, 139, 463–471. [Google Scholar] [CrossRef]
  48. Kivela, M.; Arnaud-Haond, S.; Saramaki, J. EDENetworks: A user-friendly software to build and analyse networks in biogeography, ecology and population genetics. Mol. Ecol. Resour. 2015, 15, 117–122. [Google Scholar] [CrossRef]
  49. Kumar, S.; Stecher, G.; Li, M.; Knyaz, C.; Tamura, K. MEGA X: Molecular Evolutionary Genetics Analysis across Computing Platforms. Mol. Biol. Evol. 2018, 35, 1547–1549. [Google Scholar] [CrossRef]
  50. Hammer, Ø.; Harper, D.A.; Ryan, P.D. PAST: Paleontological statistics software package for education and data analysis. Palaeontol. Electron. 2001, 4, 9. [Google Scholar]
  51. Hijmans, R.J. Raster: Geographic Data Analysis and Modeling. In 2021. Available online: https://cran.r-project.org/web/packages/raster/index.html (accessed on 22 August 2021).
  52. Verity, R.; Nichols, R.A. Estimating the Number of Subpopulations (K) in Structured Populations. Genetics 2016, 203, 1827–1839. [Google Scholar] [CrossRef] [PubMed] [Green Version]
  53. Amyaga, E.; Nifontov, S. Selection of nuclear microsatellite loci for specific identification of Larix gmélinii Rupr. and comparison of genetic profiles of Larix to solve agricultural problems. IOP Conf. Ser. Earth Environ. Sci. 2019, 316, 012016. [Google Scholar] [CrossRef]
  54. Decision, On measures for the development of non-ferrous metallurgy region for 1997–2005. In Decision of the Government of the Chelyabinsk Oblast; Government of the Chelyabinsk Oblast: Chelyabinsk, Russia, 1997; p. 16.
  55. Kremer, A.; Hipp, A.L. Oaks: An evolutionary success story. New Phytol. 2020, 226, 987–1011. [Google Scholar] [CrossRef] [PubMed]
  56. Cortes, A.J.; Restrepo-Montoya, M.; Bedoya-Canas, L.E. Modern Strategies to Assess and Breed Forest Tree Adaptation to Changing Climate. Front. Plant. Sci. 2020, 11, 583323. [Google Scholar] [CrossRef] [PubMed]
  57. Vasilyeva, Y.; Chertov, N.; Nechaeva, Y.; Sboeva, Y.; Pystogova, N.; Boronnikova, S.; Kalendar, R. Genetic Structure, Differentiation and Originality of Pinus sylvestris L. Populations in the East of the East European Plain. Forests 2021, 12, 999. [Google Scholar] [CrossRef]
Figure 1. Visualization of the matrix of pairwise FST values. Color indicates the degree of differentiation (the darker, the stronger the differentiation).
Forests 12 01401 g001
Figure 2. Minimum spanning tree based on Goldstein distances. The rib colors indicate the genetic distance (lighter = shorter distance). The node diameter is proportional to the clonal diversity of the populations.
Forests 12 01401 g002
Figure 3. Standard error of calculating genetic structure (A) and genetic structure of populations (B). Each colour represents genotypes by sample.
Forests 12 01401 g003
Table 1. Microsatellite primer pairs used to detect polymorphisms of L. sibirica.
SSR LocusPrimer Sequence (5′-3′)Ta (°C)ARepeat
Motif
Lfr (bp)
bcLK189F: M13-ACCATACGCATACCCAATAGA5817(AG)17AT(AG)6155–170
R: AGTTTTCCTTTCCCACACAAT
Ld101F: M13-ACACCAAGGACTCTCTGACTAC5816(AC)12189–225
R: GGTGATTCCAGAAGCAGGTG
bcLK228F: M13-CCCTAACCCTAGAATCCAATAA6112(AG)18179–215
R: GAGGAAGGCGACAAGTCATT
Ld56F: M13-AGCCATCGTGGTTCTTCTTTG589(AC)16227–243
R: CTTGTAACTGTGCACCCACC
Ld50F: M13-GAAGGCGACTTTACATGCCC586(CA)18161–189
R: TCCATCTTTATGTCTCTTCCATGC
bcLK253F: M13-AACACCATAGTGCAATGTGC584(AG)17199–204
R: TCCTCTTGTTGATGCCACTT
Ld42F: M13-TCGTATGCATTGTCCAAATTTCC588(TG)14167–186
R: TCCAAGTGAGGTCACACGAG
bcLK263F: M13-CGATTGGTATAGTGGTCATTGT5837(TC)20191–254
R: CCATCATACCTTCTTGAAGAG
M13 sequence tail (5′-TGTAAAACGACGGCCAGT); F and R, forward and reverse primers, respectively; Ta, PCR annealing temperature; A, allele number obtained for all analyzed individuals; Lfr, length of the PCR amplicons in base pairs considering the addition of M13.
Table 2. Genetic diversity of 15 populations of L. sibirica based on polymorphisms of microsatellite markers.
PopulationsNumber of Alleles (Na)Number of Effective Alleles (Ne)Observed Heterozygosity (Ho)Expected Heterozygosity (He)
Kar7.0003.2630.5220.587
Irm8.2504.9980.5670.676
Vsn8.5005.2760.4840.643
Kul7.3754.0340.5000.629
Zil6.7503.9290.4600.632
Tul6.3753.8250.3870.634
Ish4.6252.7620.3660.563
Krv7.7504.2660.4330.612
Bnd6.8754.3570.4630.635
Gai8.1254.7400.4280.682
Kch8.3754.5840.4790.666
Pol5.8753.6620.5620.622
Osa7.0004.0080.4180.626
Sks4.2502.2830.3960.520
Bil7.0004.2730.4580.624
For a total sample of 15 populations6.9424.0170.4610.623
Table 3. Genetic structure and differentiation of the studied populations of L. sibirica.
LocusFisFitFst
bcLK1890.1380.1980.070
Ld1010.5770.6090.077
bcLK2280.5950.6280.080
Ld560.3510.4270.117
bcLK2530.0830.1500.073
Ld500.3570.4280.111
bcLK2630.0140.0830.070
Ld42−0.0450.0750.115
Total0.2590.3250.089
Fis, inbreeding coefficient of individuals in subpopulations; Fit, the coefficient of inbreeding of individuals in the population as a whole; Fst, coefficient of inbreeding of subpopulations relative to the entire population.
Publisher’s Note: MDPI stays neutral with regard to jurisdictional claims in published maps and institutional affiliations.

