Article

Seedling Response to Simulated Browsing and Reduced Water Availability: Insights for Assisted Migration Plantations

1
Département de Biologie, Université Laval, Québec, QC G1V 0A6, Canada
2
Direction de la Recherche Forestière, Ministère des Forêts, de la Faune et des Parcs, Québec, QC G1P 3W8, Canada
3
Centre D’étude de la Forêt (CEF), Faculté de Foresterie, de Géographie et de Géomatique, Université Laval, Québec, QC G1V 0A6, Canada
*
Author to whom correspondence should be addressed.
Forests 2021, 12(10), 1396; https://doi.org/10.3390/f12101396
Submission received: 1 April 2021 / Revised: 15 September 2021 / Accepted: 3 October 2021 / Published: 14 October 2021

Abstract

:
To facilitate forest transition to future climate conditions, managers can use adaptive silvicultural tools, for example the assisted translocation of tree species and genotypes to areas with suitable future climate conditions (i.e., assisted migration). Like traditional plantations, however, assisted migration plantations are at risk of failure because of browsing by ungulate herbivores. The ability of seedlings to tolerate browsing could also be hampered by low water availability, as is expected under climate change. Using a greenhouse experiment with five eastern North American tree species, we evaluated the effects of simulated winter browsing and reduced water availability on the growth (total biomass, shoot:root ratio), survival, and chemical composition (nitrogen, total phenolics, flavonoids) of seedlings. We compared seedlings from three geographic provenances representing three climate analogues, i.e., locations with a current climate similar to the climate predicted at the plantation site at a specific time (here: current, mid-century and end of the century). We hypothesized that seedlings would allocate resources to the system (shoots or roots) affected by the most limiting treatment (simulated browsing or reduced water availability). Additionally, we evaluated whether the combination of treatments would have an additive or non-additive effect on the growth, survival and chemical composition of the seedlings. Quercus rubra seedlings reacted only to the water reduction treatment (changes in biomass and N concentration, dependent on geographic provenance) while Pinus strobus reacted only to the simulated browsing treatment (biomass and chemical composition). We also observed non-additive effects of reduced water availability and simulated browsing on Prunus serotina, Acer saccharum and Thuja occidentalis. In general, shoot:root ratio and investment in chemical defense did not vary in response to treatments. The regrowth response observed in Q. rubra and A. saccharum suggests that these species could tolerate periodic browsing events, even when water availability is reduced. More information is required to understand their long-term tolerance to repeated browsing events and to harsher and more frequent water stress. We highlight the importance of species-specific growth and allocation responses that vary with geographic provenance, which should be considered by managers when planning climate-adapted strategies, such as assisted migration.

1. Introduction

Rising temperatures and increasing frequency of natural disturbances due to climate change will affect the future viability of forest ecosystems [1]. Although species migration and adaptation can occur, the potential for tree species to migrate will be hampered by the rapid rate of climate change [2,3]. To facilitate forest transition to future climate conditions, managers can use adaptive silvicultural tools; for example, the assisted translocation of tree species and genotypes to areas with suitable future climate conditions (i.e., assisted migration) [4,5,6]. In the Northern hemisphere, assisted migration usually means moving seedlings from southern to more northern locations, with managers aiming to match genotypes and plantations sites using the climatic information at the source site, such as temperature and mean precipitation e.g., [7]. Genotypes can also be selected for their resistance to specific climate-related threats, such as drought [8]. However, climatic conditions are not the only problems faced by translocated seedlings. Mammalian herbivores, especially ungulates, are increasingly recognized as a major barrier to artificial and natural tree regeneration [9,10], but they are rarely considered in current species or genotype selection e.g., [7,11,12].
Ungulates have a negative effect on seedlings because they can reduce growth and survival. During the growing season, ungulate herbivory reduces seedlings’ photosynthetic capacity by removing aerial tissues [13]. In temperate and boreal forests, most ungulate damage on woody plants occurs during winter, when shoots are one of the only forage resources available. In these environments, winter browsing reduces the number of active meristems, a valuable resource for woody plant growth [14,15]. Seedlings, however, can tolerate a certain level of damage using compensatory growth, i.e., a positive growth response to injury, and thus resume height growth [16,17]. Moreover, height gains will eventually allow seedlings to escape browsing by being in a height stratum inaccessible to ungulates [13]. Nevertheless, compensatory growth can be constrained by limiting factors, such as nutrient and/or water availability [18,19]. For example, Barton and Shiels [20] demonstrated that certain Hawaiian tree species were less tolerant of shoot clipping during simulated drought than under ideal water conditions. The effects of water stress on tolerance to browsing, however, are not always negative: the herb Alternanthera philoxeroides expressed a higher tolerance of invertebrate damage under water stress, while also being fertilized [21]. Few studies have evaluated the effect of climate change and, especially, water availability on tolerance of browsing [20,22], yet water availability is expected to be a critical factor affecting forests under climate change [23,24].
Both browsing and water availability can influence resource allocation in seedlings, and resource allocation theories provide a common ground to understand their combined effect on seedling establishment. Plants can allocate more biomass to the organ through which the most limiting resource is acquired [25,26,27]. In this case, water-stressed seedlings should favor root growth to maximize water acquisition, while browsed seedlings should allocate more resources to height growth or to generation of phytochemical defenses. For example, browsed seedlings of Quercus robur L. compensated for the loss of biomass aboveground at the expense of belowground growth [28]. In the same experiment, however, simulated drought reduced both above and belowground growth, suggesting that water availability has a stronger effect on plant growth. Additionally, combined effects could have an additive (i.e., equal to the sum of both effects) or non-additive (i.e., different than the sum) effect on plant growth [20]. For Hawaiian tree seedlings, herbivory and drought reduced performance in an additive manner, and seedlings performed better under a single stressor [20]. Non-additive effects, however, were detected in two of the ten Hawaiian species studied, and could especially occur via drought effects on seedlings’ allocation to phytochemical defense [20,29,30]. Understanding the effects of combined stress-response strategies of species and genotypes considered for assisted migration could allow managers to make an optimal selection, considering these multiple limiting factors.
In the present study, we aimed to evaluate the individual and combined effects of both simulated winter browsing and reduced water availability on the growth (biomass and shoot:root ratio), survival, and chemical composition of planted seedlings in an assisted migration context. First, we evaluated the individual effects of the two factors on three geographic provenances of five species considered for assisted migration in Eastern North America. These geographic provenances represented climate analogues, i.e., a location where the current climate is similar to the anticipated climate of another location [31], here the site of an assisted migration plantation. We did not know if geographic provenances would differ in their tolerance to herbivores, but we hypothesized that continuous reduction in water availability would have a more negative effect on growth and survival than a single simulated browsing event (periodic disturbance). We thus predicted that seedlings would allocate more resources to the plant part affected by reduced water availability, i.e., belowground biomass. Additionally, we evaluated whether the combination of limiting factors would have an additive or non-additive effect on seedlings’ growth, survival and chemical composition.

2. Materials and Methods

This project is part of a large-scale experiment, led by the Ministère des Forêts, de la Faune et des Parcs (Government of Québec, Canada), with the objective of evaluating the potential use of assisted migration as an adaptative measure to climate change, in the balsam fir (Abies balsamea (L.) Miller)-yellow birch (Betula alleghaniensis Britton) bioclimatic domain of Québec [32]. The plantation site of the project is located in the Réserve faunique de Portneuf (Québec, QC, Canada; approx. 47°7′ N, 72° 24′ W), where seedlings of eight species were planted during the fall of 2018. We selected five of the eight species used in that assisted migration experiment for a greenhouse simulation experiment: Acer saccharum Marsh. (sugar maple), Pinus strobus L. (white pine), Prunus serotina Ehrh. (black cherry), Quercus rubra L. (northern red oak; hereafter red oak) and Thuja occidentalis L. (northern white cedar; hereafter white cedar). Of the eight species present in the assisted migration experiment, these five are potentially the most susceptible to large mammalian herbivory (Alces alces, Odocoileus virginianus), as per historical browsing reports and their chemical profiles [33]. Two species are not currently found in this bioclimatic domain (red oak and black cherry), but the predicted future climate conditions (temperature increases and changes in precipitation regime, including decreased mean total precipitation) should become favorable for their presence [34]. The three other species are already present (white cedar, sugar maple and white pine), although future conditions could become unfavorable for white cedar at the end of the century, while remaining favorable for sugar maple and white pine [34]. Seedlings were grown from seeds associated with three climate analogues (Appendix A, Table A1). The climate analogues are geographical zones selected for their climate, using mean annual temperature, mean annual precipitation and minimum temperature in May. We used three different climate analogues: a region with a climate analogue to the current plantation site climate (2018; hereafter 2018 analogue), a region with a climate analogue to the climate predicted for mid-century (2041–2070; hereafter 2050 analogue) and one analogous to the climate predicted for the end of the century (2071–2100; hereafter 2080 analogue). Predictions for climate analogues were based on the method developed by Grenier et al. [31], using data from the 5th IPCC report (RCP 4.5 and 6.5) at 10 km × 10 km scale. Seeds were sourced from locations (geographic provenance) within each climate analogue zone, but seed collection was independent among species. These geographic provenances are dispersed in a latitudinal gradient from 65° N to 72° N, from Pennsylvania (USA) to the plantation site (map available in [33]). Because of the low availability of sugar maple seedlings, we only used the current climate analogue in the simulation study. All seedlings were planted and grown under the same conditions at the provincial government nursery in Berthierville (QC, Canada).
The conifers (white pine and white cedar) were sown in the spring of 2017, while the deciduous species (sugar maple, black cherry and red oak) were sown in the spring of 2018 at the nursery. During the experiment, all of the geographic provenances were kept under the same conditions. The seedlings selected for the simulation study were not used for the plantation and were kept in containers (320 cm3) until the beginning of the experiment. We stored them in a cellar sheltered from the snow from November 2018 to February 2019. We transferred seedlings to a greenhouse (approx. 12 °C) in February 2019 to break dormancy and placed them in polyethylene pots (3 L) with a commercial substrate mix for tree and shrubs, consisting of humus and peat moss (N = 0.45%, P = 0.1%, K = 0.1%) and adding a fertilizer (N = 17%, P = 7%, K = 10%). Following bud burst, we transferred the seedlings to Université Laval’s greenhouse (Québec, QC, Canada) for simulation treatments. Seedlings were subjected to an unexpected frost during the transfer, which damaged some buds and early leaves. We monitored the frost damage and determined that it almost exclusively affected the black cherry and white pine seedlings. For black cherry, 28% of the seedlings had damage on the leaves that did not affect the buds, 54% had damage on both leaves and buds, while the remaining seedlings had little to no frost damage. However, even the most damaged seedlings presented new growth rapidly. For white pine, we evaluated frost damage as the percentage of needles affected; most of seedlings (64%, n = 54) had less than 50% of their needles damaged by the frost.

2.1. Experimental Design and Simulation Treatments

We conducted the study at Université Laval in Québec (QC, Canada) from March to July of 2019. We used a split-block design, where the main plot consisted of a reduction of water availability treatment (control, moderate reduction, high reduction). We distributed simulated browsing treatment (browsed and unbrowsed), species and geographic provenance randomly within main plots (Figure 1). We replicated this design in five blocks to control variability in the greenhouse. We used between 20 and 30 seedlings for each provenance*species combination (n = 359, n = 4–5 per water stress*browsing treatment combination). Because of the lower number of seedlings available for red oak and black cherry (20–25 per analogue) compared to the other species, we only applied two levels of water reduction (control, high reduction).
We applied the simulated browsing treatment while the plants were still in dormancy in order to mimic natural winter browsing. We adapted the treatment for each species to mimic white-tailed deer browsing (Figure 1a; [35]). For all, we cut the apical stem using a pruner, removing the top 10 cm of the stem, with the objective of generating a diameter at the point of browsing similar to those produced by deer browsing (Figure 1b). Because of mild weather conditions, a few white pines had a second bud burst in the fall and cutting the top 10 cm resulted in variable treatment intensity among individuals (Figure 1c–d). We thus cut the complete previous year’s growth if the apical stem was longer than 10 cm. The resulting diameters at the browsing point (mean ± SD mm: black cherry = 2.2 ± 0.3, red oak = 2.5 ± 0.4, sugar maple = 2.7 ± 0.4, white pine = 4.6 ± 0.6, white cedar = 1.8 ± 0.2) were similar to available references ([36]: sugar maple = 2.1 ± 0.6, red oak = 2.5 ± 0.7; [37] min.–max.: sugar maple = 1.1–3.6, white cedar = 0.7–2.8), with the exception of white pine, whose available reference diameter was smaller ([36]: 2.2 ± 0.9, max = 10.1). For white cedar, the treatment removed a negligible amount of shoot biomass, and the seedlings were very vigorous. To increase the intensity of treatment on white cedar, we cut the non-lignified section of 50% of the lateral twigs. For all species, we measured the post-browsing height and weighed the removed biomass.
When all of the seedlings reached the budding stage (i.e., first leaves spreading for hardwoods and visible stem elongation for white pine), we began the water availability reduction treatment (10 May 2019). We did not record budding on white cedar because of the difficulty in assessing the onset of growth for this species. We determined water reduction levels in accordance with pot capacity, which was established to be 1.27 L by subtracting the mass of water-saturated soil samples from their dry mass (dried at 70 °C, n = 5) [38,39]. The quantity of soil used to determine pot capacity was the same as the quantity of soil used for planted seedlings, and the pots used were identical. We applied an 80% of pot capacity (1 L) for the control treatment, 50% of pot capacity (0.5 L) for the moderate reduction treatment, and 25% (0.3 L) for the high reduction treatment according to [40,41]. We watered the seedlings every three days during the first three weeks, and the pots were placed on a grating surface that allowed for drainage. Each three to four weeks (n = 3), we measured the soil water content for every level of the treatment by sampling the soil at the surface of the pots, using random seedling pots and calculating the water content percentage ((wet mass − dry mass)/wet mass × 100; n = 5/treatment level/species). After three weeks, the soil water content for seedlings under a high-water availability reduction was still high after the three-day watering intervals (an average of 44 ± 8% soil water content). We thus reduced the watering frequency to once every four days for the last seven weeks of the experiment.
The greenhouse was maintained at a temperature and photoperiod that imitated the averages observed during June in Québec (22 °C during the day and 10 °C during nighttime). After ten weeks of growth (22 July 2019), we separated the aerial and root biomass of each plant. Black cherry seedlings were removed five weeks earlier from the greenhouse (15 June 2019) due to their rapid growth. We removed the remaining soil from roots with tap water. We dried each seedling’s above and belowground parts at 70 °C for 72 h and weighed their dry mass.

2.2. Chemical Analyses

We estimated the level of chemical defense in the seedlings by using the concentration of total phenolics and flavonoids in the leaves (broadleaf species) and shoots (wood and needles of conifer species). Total phenolics and flavonoids are proxies of plant resistance to herbivores [42], but total phenolics cannot be used for comparison among species because of the different compounds present in each species [43]. We also evaluated the nitrogen concentration (hereafter N), a proxy of crude protein for herbivores, and thus the nutritional value for mammalian herbivores [44]. All laboratory analyses were carried out at the laboratory of the Direction de la recherche forestière (Ministère des Forêts, de la Faune et des Parcs, Québec, Canada). For N concentration, the samples were put into an oven (1100 °C) under an oxygen atmosphere, where all forms of N are oxidized to NOx. After removing the moisture and ash, N concentration was determined by thermic conductivity with a nitrogen analyzer (LECO nitrogen analyzer TruMac N, St. Joseph, MI, USA). Total phenolics were quantified by a colorimetric method with a gallic acid standard using the Folin-Ciocalteu reagent, as described in Sauvesty, et al. [45], and using a UV/VIS spectrometer (PerkinElmer Lambda 35, Waltham, MA, USA). Finally, flavonoids were quantified with an adaptation of the colorimetric method of Pękal and Pyrzynska [46] with a quercetin standard, using aluminum complexation reaction and the same spectrometer. The limits of quantification for each analysis were respectively 0.1 g/kg for N, 2 mg/g for total phenolics, and 0.2 mg/g for flavonoids.

2.3. Statistical Analyses

We evaluated the effect of water availability reduction on water soil content using one linear mixed model per species, with blocks as a random effect, using the last measurement of soil water content. Seedling survival was analyzed only for white pine and black cherry, since mortality for the other species was very low or null (two red oaks, no mortality for white cedar and sugar maple). Black cherry mortality occurred mainly before the water availability reduction treatment was implemented; therefore, only the simulated browsing treatment’s effect was analyzed in terms of the impact on survival. Due to low mortality, we analyzed survival with a contingency chi-square test.
For each species, we examined the effects of the treatments on five response variables (total biomass, shoot:root ratio, N, phenolic compounds and flavonoid concentration) using a complete factorial ANOVA design with linear mixed models (lmerTest::lmer() function, “lmerTest” package) [47]. We did not compare the species within a model, because the intensity of the treatments varied among species. Each model included two treatments (simulated browsing and water reduction), geographic provenance and the interactions among these variables as explanatory variables. We also included a random effect of blocks in the models, nested within the water availability reduction treatment, to account for the split-block design (random effect: 1 | Block/Water availability treatment). In the rare cases when there were two seedlings per treatment*block combination, we averaged the data. To account for differences among the initial mass of seedlings, we included the height at the beginning of the experiment (hereafter initial height) and its interactions as a covariate in models with total mass and shoot:root ratio. When interactions with the initial height were not statistically significant, we removed them from the model; next, when the effect of the initial height was not statistically significant, we completely removed it from the model. We assessed the statistical significance of explanatory variables with a type-III ANOVA using the Satterthwaite’s method. We conducted a posteriori means comparison using the least square means method (ls_means() function, “lsmeans” package) [48] with a Tukey correction in order to differentiate significant means among treatments with more than two levels. We assessed the normality of residuals and homogeneity of variance assumptions and applied transformations when required (logarithm for the shoot:root ratio and the N concentration of red oak). We estimated compensatory growth using the following equation [16,17]:
[ ( x ¯   m a s s   o f   b r o w s e d   s e e d l i n g s + x ¯   r e m o v e d   m a s s ) x ¯   m a s s   o f   u n b r o w s e d   s e e d l i n g s ] × 100 x ¯   m a s s   o f   u n b r o w s e d   s e e d l i n g s
A positive value indicates overcompensation while a negative value means undercompensation. We used the means of browsed and unbrowsed seedlings, regardless of the water availability treatment, unless this treatment had a significant effect on mass. In this latter case, we calculated compensatory growth separately for each water availability reduction level.
The results are presented as means estimated by models with a 95% confidence interval and we present back-transformed values when response variables were transformed. We performed all statistical analyses using R (3.6.1) [49] with an error level of α = 0.05.

3. Results

With the simulated browsing treatment (clipping of wood for broadleaves, wood and needles for conifers), we removed an average of 0.17 ± 0.07 g (means ± SD) from black cherry, 0.3 ± 0.1 g from red oak, 0.29 ± 0.07 g from sugar maple, 4 ± 1 g from white pine and 2.1 ± 0.7 g from white cedar (dry biomass). Soil water content was gradually reduced by the water availability reduction treatment (Appendix A, Figure A1). After we reduced watering frequency (13 weeks after the beginning of the experiment), the soil of the seedlings at the high reduction level was drier (means ± SD: 28 ± 16% of pot capacity) than the soil of the seedlings at the moderate reduction level (46 ± 19% of pot capacity) and the seedlings without water reduction (56 ± 10% of pot capacity). However, the treatment intensity varied among species (statistically significant for all except white pine; Table 1), and soil water content was more variable in the moderate and high reduction levels (Table 1).
We did not observe significant mortality for red oak, sugar maple and white cedar seedlings (two for red oak, none for the other species). Black cherry mortality observed prior to water availability treatment was not linked to simulated browsing (χ2 = 0.08; P = 0.78; df = 1; n = 83) and could be linked to the accidental frost event (see methods section). White pine mortality, however, increased with the simulated browsing treatment (χ2 = 16.4; P < 0.001; df = 1; n = 88). We observed a 36% mortality rate for browsed white pine compared to 2% for unbrowsed seedlings.

3.1. Black Cherry

The total mass of black cherry seedlings decreased with water reduction intensity for unbrowsed seedlings, but not for browsed seedlings, which already had a slightly lower biomass (significant water availability, browsing and height interaction: F1,36 = 5.0, p = 0.032; Appendix A, Table A2, Figure 2a). Browsed seedlings compensated for the loss of biomass, as the total mass of browsed and unbrowsed seedlings at the end of the experiment was not significantly different (Figure 2a). At high water availability reduction, more biomass was allocated to shoots than roots (F1,48 = 24.9, p < 0.001; shoot:root ratio: control = 2.4 ± 0.3; high reduction = 3.2 ± 0.3; Table A2). In conjunction with their reduced size, seedlings with reduced water availability had higher foliar N concentration than control seedlings (F1,4 = 32.1, p = 0.005; control =18 ± 4 g/kg, high reduction = 25 ± 4 g/kg). The 2080 analogues also invested more in shoots than both the 2018 and 2050 analogues (geographic provenance effect: F2,48 = 19.6, p < 0.001; shoot:root ratio: 2018 = 2.3 ± 0.3; 2050 = 2.6 ± 0.3; 2080 = 3.4 ± 0.3; t40 = 6.1, P < 0.001 for 2018 vs. 2080; t40 = 4.4, P < 0.001 for 2050 vs. 2080). There was no statistically significant effect of water availability or simulated browsing on total phenolics concentration, although the interaction between these treatments approached the significance threshold (F1,40 = 4.0, p = 0.053; control/unbrowsed: 56 ± 10 mg/g of tannic acid equivalents, control/browsed: 44 ± 10 mg/g, high reduction/unbrowsed: 38 ± 10 mg/g, high reduction/browsed: 40 ± 10 mg/g).
Simulated browsing influenced foliar flavonoid concentration, but differently among geographic provenance (F2,40 = 5.0, p = 0.012; Appendix A, Table A2). The a posteriori test, however, did not present statistically significant effects of simulated browsing within or among geographic provenances, potentially because of the high variability in flavonoid concentration (Appendix A, Figure A2).

3.2. Red Oak

The biomass of red oak was influenced by water availability, but the effects differed among geographic provenances (significant water availability and climate analogue interaction: F2,39 = 5.2, p = 0.010; Appendix A, Table A3, Figure 2b). The 2050 analogue biomass decreased with water availability reduction, while the other analogues did not present statistically significant changes (Appendix A, Figure A3). The 2050 analogue invested more in shoots than the 2018 analogue (geographic provenances effect: F2,44 = 3.2, p = 0.049; shoot:root ratio 2018 = 0.9 ± 0.2; 2050 = 1.2 ± 0.2;), but not more than the 2080 analogue (shoot:root ratio 2018 = 1.0 ± 0.2). Water availability modified the foliar nitrogen concentration of all climate analogues, but only when in interaction with simulated browsing (F1,40 = 5.1, p = 0.029); the treatments had no effect on chemical defense (Appendix A, Table A3). Foliar nitrogen concentration increased with water reduction for browsed red oak (control: 13 ± 1 g/kg; high reduction: 16 ± 2 g/kg), but not for unbrowsed red oak (control: 15 ± 2 g/kg; high reduction: 15 ± 2 g/kg). Browsed red oak compensated for biomass loss by achieving a similar mass to the unbrowsed seedlings (43 ± 9 g for unbrowsed seedlings and 42 ± 9 g for browsed ones; Figure 2b).

3.3. Sugar Maple

The interaction between water availability and simulated browsing modified sugar maple biomass at the end of the experiment (F2,20 = 7.5, p = 0.004; Appendix A, Table A4). Browsed seedlings presented the highest biomass in moderate water reduction conditions, suggesting overcompensation in response to the simulated browsing treatment (Figure 2c; compensatory growth of 108.6% under moderate reduction). We did not observe any effects of the simulated browsing treatment on the biomass of well-watered seedlings and those under high reduction. Both treatments had no effect on biomass allocation (shoot:root ratio; Appendix A, Table A4), nor on chemical composition (foliar N concentration, total phenolics and flavonoids; Appendix A, Table A4), although the seedlings under high water availability reduction presented a slightly higher flavonoid concentration, which was not statistically significant (F2,20 = 3.3, p = 0.059; control: 3.8 ± 0.8 mg/g of quercetin equivalents; moderate reduction: 3.6 ± 0.8 mg/g; high reduction: 4.7 ± 0.8 mg/g).

3.4. White Pine

The simulated browsing treatment decreased white pine biomass and modified their chemical composition (Appendix A, Table A5). Browsed white pine, did not compensate for the lost biomass (F1,48 = 87.1, p < 0.001; dry weights: 32 ± 3 g for unbrowsed seedlings and 13 ± 4 g for browsed ones; Figure 2d; undercompensation of − 46.6%), but maintained a similar biomass allocation (shoot:root ratio). The smaller browsed white pine had a higher N concentration in shoots than the unbrowsed white pine (F1,47 = 28.5, p < 0.0001; 18 ± 1 g/kg vs. 14 ± 1 g/kg), and a lower concentration in total phenolics (F1,51 = 33.1, p < 0.0001, 17 ± 2 mg/g vs. 23 ± 2 mg/g of tannic acid equivalents). Browsed pines, however, had a higher concentration in flavonoids (F1,48 = 17.0, p = 0.0001, 2.7 ± 0.2 mg/g vs. 2.0 ± 0.3 mg/g of quercetin equivalents). Shoot N concentration, but not chemical defense, also varied among geographic provenances (F2,45 = 13.9, p < 0.0001), as 2018 analogues were characterized by a higher N concentration (18 ± 1 g/kg) than other analogues (2050: 15 ± 1 g/kg; 2080: 15 ± 1 g/kg).

3.5. White Cedar

We observed statistically significant effects of both water availability and simulated browsing treatments on white cedar growth and chemical composition (Appendix A, Table A6). White cedar biomass decreased with water availability reduction for unbrowsed seedlings, but not for browsed seedlings, which already had a lower biomass (F2,45 = 3.4, p = 0.040; Figure 2e). Browsed white cedar at all water availability levels did not compensate fully for the lost biomass (compensatory growth of − 35.3% without water reduction). The interaction between water availability and simulated browsing also influenced biomass allocation, but this occurred differently among the geographic provenances and mostly with small effect sizes (F4,57 = 2.6, p = 0.049). The most meaningful effect is for the 2018 analogues: simulated browsing tended to increase allocation to roots under high water reduction (4.9 ± 1.0 for unbrowsed seedlings and 3.05 ± 0.9 for browsed ones; Appendix A, Figure A4). Geographic provenances also presented differences in shoot N concentration. N concentration was higher in shoots of the 2080 analogue (14 ± 1 g/kg) than in both the 2018 and 2050 analogues (F2,55 = 4.5, p = 0.015, both 13 ± 1 g/kg).
Experimental treatments and geographic provenance also influenced white cedar chemical defense (Appendix A, Table A6). High water reduction increased total phenolic concentration of shoots (F2,8 = 5.0, p = 0.039; 36 ± 3 mg/g of tannic acid equivalents) compared to the moderate reduction level (31 ± 4 mg/g). The total phenolic concentration of seedling shoots without water reduction (34 ± 4 mg/g), however, was not different than those undergoing moderate and high-water reductions. Total phenolic concentration also varied with geographic provenance (F2,56 = 16.6, p < 0.0001; 2018 analogue: 39 ± 3 mg/g of tannic acid equivalents; 2050 analogue: 33 ± 3 mg/g; 2080 analogue: 30 ± 3 mg/g). Finally, an interaction between simulated browsing and geographic provenance influenced flavonoid concentrations, but differences among the means were negligible (F2,52 = 3.2, p = 0.047; Figure A5)

4. Discussion

We used a greenhouse experiment to evaluate how winter browsing and water availability reduction interacted to influence the growth (biomass, shoot:root ratio), survival and chemical composition of five North American tree species in three geographic provenances. Most differences among the geographic provenances were negligible, suggesting that different seed sources could have similar levels of tolerance to water stress and browsing. This result should be considered with care because local adaptation to water stress and herbivory pressure is possible, although this is more often documented for resistance to herbivore abilities [50,51,52]. Differences could be more apparent during a later developmental stage; phytochemical defenses, for example, change during the juvenile stage but also during the transition from seedlings to saplings, and patterns of change vary among phytochemical groups [53]. We also compared a limited number of seed sources on a relatively small latitudinal gradient from 65° N to 72° N, and from only one geographic provenance for each climate analogue. Still, we did observe some small differences among geographic provenances for all species with more than one provenance, which could influence long-term tolerance and resistance to browsing and water stress. For example, the 2050 climate analogue of red oak appeared to be more sensitive to water availability reduction than the other two analogues (Appendix A, Figure A3). These results highlight the importance of considering the traits of source populations in the context of assisted migration, rather than only considering climate variables at the source site.
In addition, in contradiction to our hypothesis, water reduction (continuous stress) did not have a systematically stronger effect than simulated browsing (periodic disturbance) on seedlings. The treatment with the strongest negative effect was species-specific and two species reacted only to one treatment: water reduction for red oak and simulated browsing for white pine. Moreover, reducing water availability did not affect the capacity to tolerate simulated browsing for red oak, white pine, black cherry and white cedar. This is consistent with the ability of these species to grow in a range of soil water conditions and to tolerate drought [54,55,56,57,58,59]. Repeated or more drastic water stress, however, could overcome the ability of these species to recover, and have a negative effect on their browsing tolerance ability. In the case of white pine, the absence of response to water reduction could also indicate that we failed to simulate an abiotic stress in this species. For sugar maple, a moderate water reduction improved the ability to tolerate browsing (Figure 2c), and suggests that a moderate water availability reduction produced optimal conditions for compensatory growth. This species usually performs best on well-drained loams [60], but we should interpret this result with care, as the water content in pots at moderate water reduction was more variable than in other levels of the treatment (Table 1).
In contrast to other experiments simulating both water availability and herbivory, we observed non-additive effects (i.e., effects different than the addition of the two treatments) on three species (black cherry, sugar maple and white cedar) [20,28]. Barton and Shiels [20] proposed that non-additive negative effects of water stress on tolerance could be linked to an increased allocation to phytochemical defense, but we found little change in leaf or shoot phenolic concentration in response to either or both treatments [20,61]. Moreover, we did not record significant changes in root:shoot ratio that could explain non-additive responses, or that could be understood via a higher investment to the system (shoot or root) acquiring most limiting resource (light or water). Although many studies show that some woody plants allocate more resources to the acquisition of the most limiting resource and increase investment to belowground biomass under water stress, the force and direction of biomass allocation responses vary widely among species [62,63]. Different species use a wide range of strategies to cope with water availability reduction and drought, which could prevent an optimal partitioning pattern to occur or to be detected (e.g., root length changes) [63]. The absence of changes in ratios could also be caused by the pot size that became constraining for seedlings at the end of the experiment (E. Champagne, pers. observation). Moreover, aside from pot size, the absence of changes in root:shoot ratios and chemical defense could also be an artefact of other experimental constraints. Our experiment was shorter than comparable studies [20,28], and our water reduction treatment did not generate extreme conditions (Table 1; Appendix A, Figure A1). For black cherry seedlings, the lack of space for additional root growth, combined with an accidental frost event during seedling transfer, could have increased the growth allocation to aboveground biomass, even under reduced water availability. Notwithstanding these constraints, this experiment contributes to establishing the range of woody plant response to combined stressors.
This greenhouse experiment suggests that among the set of species considered here for assisted migration, red oak and sugar maple could be good candidates in areas with moderate browsing pressure, because they can tolerate periodic browsing events, even when water availability is reduced. More information is required to understand their long-term tolerance to repeated browsing events and to harsher and more frequent water stress. On the other hand, our results suggest that white pine, white cedar and black cherry could be more affected by these factors. The lower tolerance of black cherry to the treatments, compared to the other broadleaves, could be linked to the unplanned frost event, and this suggests that this species is sensitive to the combination of multiple stressors and disturbances in its first growing season. The response of black cherry to stress, however, could be different in the field, as this species performs well on a wide range of soil drainage [57]. Higher compensatory growth in broadleaves vs. coniferous species is well documented and could be caused by the less determined growth patterns in the former [64,65]. Similarly, a moderate simulated browsing stimulated biomass production of Betula pubescens and B. pendula, while it had a negative effect on Pinus sylvestris [65], but see [66]. Pine and cedar, however, varied in their tolerance to browsing; we documented browse-related mortality only for white pine. The reduced survival of pines could be explained by the higher intensity of the simulated browsing treatment (higher quantity of biomass removed, see results section). Although white pine may be able to tolerate a less intense browsing event, this species is often browsed by white-tailed deer [33]. Consequently, this species could take a long time to recover from browsing, thereby remaining within mammal reach for a longer time. As for white cedar, although its survival was not affected by the treatments, it is a slow growing species [67], which probably prevented a quick compensation of biomass losses. It is possible that browsed white cedar seedlings will always lag behind unbrowsed ones. This could lead to reduced survival and, thereby, recruitment of this species, and could explain the strong decline in this species linked to white-tailed deer browsing [68,69]. Although water stress slightly enhanced the phytochemical defense, this response will probably not be sufficient to reduce browsing on this species, which is highly selected by deer. Monitoring of browsing in a natural environment will allow us to evaluate if the responses observed here are possible under field conditions.
Assisted migration is a new silvicultural tool, and current recommendations to favor its success include matching the conditions at the source site to the conditions expected in the future at the plantation site [70]. Because large herbivores could have strong impacts on the initial survival and growth of translocated seedlings, investigation of the potential of geographic provenance and species should incorporate the tolerance to these herbivores under variable abiotic conditions. This experiment highlights the importance of species-specific growth and allocation responses on browsing tolerance and stress response, which should be considered by managers for planning climate-adapted strategies, such as assisted migration.

Author Contributions

Conceptualization and Methodology: R.T., E.C., P.R. and A.D.M.; Formal Analysis, Investigation and Writing—Original Draft Preparation: R.T. and E.C.; Resources: P.R.; Funding Acquisition and Supervision: E.C. and P.R.; Writing—Review & Editing: E.C., P.R., A.D.M. All authors have read and agreed to the published version of the manuscript.

Funding

This project was realized under a Mitacs Accelerate internship, and EC was supported by NSERC postdoctoral fellowship program during completion of the project. The project was also funded by the Ministères des Forêts, de la Faune et des Parcs (no. 142332136) and the Fond Vert (no. 142959263).

Institutional Review Board Statement

Not applicable.

Informed Consent Statement

Not applicable.

Data Availability Statement

The data presented in this study are openly available in FigShare at https://doi.org/10.6084/m9.figshare.14356007.v2 (accessed on 1 April 2021 [36]).

Acknowledgments

We thank M.-C. Lambert for help with statistical analyses, É. Saulnier, G. Tremblay-Brassard, S. Williams, É. Duberger, È. Gagné, D. Langlois, L. de Vriendt, L. Nowack, E. Duchâteau, O. Villemaire-Côté, F. Bouchard, F. Mireault-Pelchat, F. Larochelle and M.-A. Parée for greenhouse and laboratory work, D. Dumais for advice on the project and M. Urli for revising the manuscript. We also thank everyone involved in the assisted migration experiment and especially A. Royo, P. Raymond, C. Kern, S. Matthews, L. Leites and M. Kaye for contributing to the development of the experimental design, C. Périé and T. Logan for the computation of climate analogues, F. Colas (Centre de semences forestières de Berthier), D. McPhee (National Tree Seed Centre), D. Lee (Saratoga Tree Nursery), A. Royo, J.-L. Landreville and H. Tremblay for providing seeds, as well as M.-J. Gilbert and R. Thouin (Pépinière forestière de Berthier) for coordinating seedling production.

Conflicts of Interest

The authors declare no conflict of interest.

Appendix A

Supplementary material to Turgeon, R., E. Champagne, A.D. Munson and P. Raymond. Seedlings response to simulated browsing and water availability: insights for assisted migration plantations.
Table A1. Seed sources for climates analogues, including approximative coordinates and provider.
SpeciesClimate AnalogueApproximative CoordinatesProvince/StateProvider
Black cherry201847, −71QuébecCentre de semences forestières de Berthier
205045, −71QuébecCentre de semences forestières de Berthier
208042, −80PennsylvaniaErnst’s Conservation Seeds Inc
Red oak201847, −71QuébecHarvested for this project (H. Tremblay)
205045, −73QuébecHarvested for this project (J.-L. Landreville)
208042, −79PennsylvaniaHarvested for this project (A. A. Royo, USDA Forest service)
Sugar maple201847, −71QuébecCentre de semences forestières de Berthier
205045, −71QuébecCentre de semences forestières de Berthier
208041, −79PennsylvaniaHarvested for this project (F.W. Schumacher)
White pine201847 −73QuébecCentre National de Semences du Canada
205045 −72QuébecCentre National de Semences du Canada
208044 −75New YorkNew York State Nursery (Saratoga)
White cedar201846, −71QuébecCentre de semences forestières de Berthier
205046, −70QuébecCentre de semences forestières de Berthier
208046, −66Nova ScotiaCentre National de Semences du Canada
Table A2. ANOVA summary table for evaluating the effects of simulated winter browsing, water availability, seedling climate analogue (2018, 2050, 2080 analogues) and their interaction on black cherry (Prunus serotina Ehrh.) total mass, shoot:root ratio and chemical composition (nitrogen, total phenolics and flavonoids concentration). Seedlings were grown under different levels of water availability during a ten week greenhouse experiment.
Sources of VariationTotal MassShoot:Root RatioNitrogenTotal PhenolicsFlavonoids
dfFPdfFPdfFPdfFPdfFP
Water availability1,366.70.0141,4824.9<0.0011,432.10.0051,47.50.0521,40.00.87
Browsing1,360.10.791,480.10.821,400.30.601,402.10.161,402.30.14
Climate analogue2,361.00.372,4819.6<0.0012,400.20.852,401.00.362,402.10.14
Height (covariate)1,365.80.022 -----------
Water availability×Browsing1,363.30.0781,480.40.531,400.10.741,404.00.0531,400.00.89
Water availability×Climate analogue2,360.30.742,480.60.572,401.20.302,400.30.722,400.10.92
Browsing×Climate analogue2,362.50.102,480.30.712,402.10.132,403.20.0542,405.00.012
Water availability×Height1,362.50.13------------
Browsing×Height1,360.60.46------------
Climate analogue×Height2,360.60.53------------
Water availability×Browsing×Climate analogue2,363.10.0572,482.30.112,400.10.922,400.10.902,401.60.22
Water availability×Browsing×Height1,365.00.032------------
Water availability×Climate analogue×Height2,360.60.55------------
Browsing×Climate analogue×Height2,361.90.16------------
Water availability×Browsing×Climate analogue×Height2,362.90.066------------
A linear mixed model was performed with a random effect of blocks (n = 5), nested within the water availability treatment (split-block design). To account for differences between the initial mass of seedlings, we included height at the beginning of the experiment and its interactions as a covariate in models with total mass and shoot:root ratio. When interactions with initial height were not statistically significant, we removed them from the model. When neither initial height nor interactions with it were statistically significant, we removed the covariate from the model. Numbers in bold are statistically significant (α = 0.05). F = F value, P = p value, df = degrees of freedom reported as numerator, denominator.
Table A3. ANOVA summary table for evaluating the effects of simulated winter browsing, water availability, seedling climate analogue (2018, 2050, 2080 analogues) and their interaction on northern red oak (Quercus rubra L.) total mass, shoot:root ratio and chemical composition (nitrogen, total phenolics and flavonoids concentration). Seedlings were grown under different levels of water availability during a ten week greenhouse experiment.
Sources of VariationTotal MassShoot:Root RatioNitrogenTotal PhenolicsFlavonoids
dfFPdfFPdfFPdfFPdfFP
Water availability1,45.60.0771,443.40.0721,83.80.0861,440.00.951,41.30.31
Browsing1,390.00.871,441.30.271,400.01.01,440.10.721,400.00.95
Climate analogue2,391.10.352,443.20.0492,401.20.312,440.70.532,401.20.30
Height (covariate)1,4631.0<0.001------------
Water availability×Browsing1,390.80.371,441.90.171,405.10.0291,443.00.0901,401.70.21
Water availability×Climate analogue2,395.20.0102,440.70.482,401.50.242,440.80.452,400.10.87
Browsing×Climate analogue2,391.00.392,440.80.442,400.10.912,441.10.342,401.40.25
Water availability×Browsing×Climate analogue2,391.50.242,440.70.502,400.80.452,440.20.982,401.80.18
A linear mixed model was performed with a random effect of blocks (n = 5), nested within the water availability treatment (split-block design). To account for differences between the initial mass of seedlings, we included height at the beginning of the experiment and its interactions as a covariate in models with total mass and shoot:root ratio. As interactions with initial height were not statistically significant, they were removed from the models. As neither initial height nor interactions with it were statistically significant for the shoot:root ratio, the covariate was entirely removed from the model. A logarithm transformation was performed on the shoot:root ratio and the nitrogen concentration. Numbers in bold are statistically significant (α = 0.05). F = F value, P = p value, df = degrees of freedom reported as numerator, denominator.
Table A4. ANOVA summary table for evaluating the effects of simulated winter browsing, water availability and their interaction on sugar maple (Acer saccharum Marsh.) total mass, shoot:root ratio and chemical composition (nitrogen, total phenolics and flavonoids concentration). Seedlings were grown under different levels of water availability during a ten week greenhouse experiment.
Sources of VariationTotal MassShoot:Root Ratio NitrogenTotal PhenolicsFlavonoids
dfFPdfFPdfFPdfFPdfFP
Water availability2,200.00.962,240.60.582,202.00.162,82.00.202,203.30.059
Browsing1,201.50.231,240.80.371,202.60.121,120.30.621,200.50.47
Water availability×Browsing2,207.50.0042,241.20.322,200.40.652,120.10.952,200.80.46
A linear mixed model was performed with a random effect of blocks (n = 5), nested within the water availability treatment (split-block design). To account for differences between the initial mass of seedlings, we included height at the beginning of the experiment and its interactions as a covariate in models with total mass and shoot:root ratio. As neither initial height nor interactions with it were statistically significant in the models, the covariate was entirely removed. Numbers in bold are statistically significant (α = 0.05). F = F value, P = p value, df = degrees of freedom reported as numerator, denominator.
Table A5. ANOVA summary table for evaluating the effects of simulated winter browsing, water availability, seedling climate analogue (2018, 2050, 2080 analogues) and their interaction on white pine (Pinus strobus L.) total mass, shoot:root ratio and chemical composition (nitrogen, total phenolics and flavonoids concentration). Seedlings were grown under different levels of water availability during a ten week greenhouse experiment.
Sources of VariationTotal MassShoot:Root Ratio NitrogenTotal phenolicsFlavonoids
dfFPdfFPdfFPdfFPdfFP
Water availability2,110.70.512,70.90.442,121.80.212,511.20.302,130.10.88
Browsing1,4887.1<0.0011,472.80.101,4728.5<0.00011,5133.1<0.00011,4817.00.0001
Climate analogue2,470.20.832,440.30.762,4513.9<0.00012,512.20.122,460.80.46
Height (covariate)1,526.00.018------------
Water availability×Browsing2,470.40.652,471.60.212,472.30.112,511.10.352,480.50.63
Water availability×Climate analogue4,460.20.954,440.50.714,440.50.774,501.10.394,461.20.33
Browsing×Climate analogue2,450.10.932,430.50.632,440.90.432,502.20.122,452.30.11
Water availability×Browsing×Climate analogue4,440.30.874,431.30.284,441.40.254,491.50.214,450.50.74
A linear mixed model was performed with a random effect of blocks (n = 5), nested within the water availability treatment (split-block design). To account for differences between the initial mass of seedlings, we included height at the beginning of the experiment and its interactions as a covariate in models with total mass and shoot:root ratio. As interactions with initial height were not statistically significant, they were removed from the models. As neither initial height nor interactions with it were statistically significant for the shoot:root ratio, the covariate was entirely removed from the model. A logarithm transformation was performed on the shoot:root ratio. Numbers in bold are statistically significant (α = 0.05). F = F value, P = p value, df = degrees of freedom reported as numerator, denominator.
Table A6. ANOVA summary table for evaluating the effects of simulated winter browsing, water availability, seedling climate analogue (2018, 2050, 2080 analogues) and their interaction on northern white cedar (Thuja occidentalis L.) total mass, shoot:root ratio and chemical composition (nitrogen, total phenolics and flavonoids concentration). Seedlings were grown under different levels of water availability during a ten week greenhouse experiment.
Sources of VariationTotal MassShoot:Root Ratio NitrogenTotal PhenolicsFlavonoids
dfFPdfFPdfFPdfFPdfFP
Water availability2,471.40.242,93.80.0642,83.20.0982,85.00.0392,620.20.82
Browsing1,452.60.111,570.20.631,552.50.121,560.60.431,620.50.48
Climate analogue2,450.80.472,570.40.682,554.50.0152,5616.6<0.00012,620.70.50
Height (covariate)1,4721.3<0.001------------
Water availability×Browsing2,453.40.0402,572.10.132,550.20.832,561.30.282,622.30.11
Water availability×Climate analogue4,460.20.944,570.01.004,550.70.624,561.00.424,621.30.28
Browsing×Climate analogue2,470.60.552,570.70.522,540.10.922,551.00.382,623.20.047
Water availability×Height2,472.40.099------------
Browsing×Height1,451.70.21------------
Climate analogue×Height2,451.40.27------------
Water availability×Browsing×Climate analogue4,480.40.854,572.60.0494,552.40.0574,561.20.334,620.70.57
Water availability×Browsing×Height2,453.20.048------------
Water availability×Climate analogue×Height4,460.20.94------------
Browsing×Climate analogue×Height2,471.00.39------------
Water availability×Browsing×Climate analogue×Height4,480.30.87------------
A linear mixed model was performed with a random effect of blocks (n = 5), nested within the water availability treatment (split-block design). To account for differences between the initial mass of seedlings, we included height at the beginning of the experiment and its interactions as a covariate in models with total mass and shoot:root ratio. Numbers in bold are statistically significant (α = 0.05). F = F value, P = p value, df = degrees of freedom reported as numerator, denominator.
Figure A1. Soil water content during ten weeks of growth under three levels of water availability from a greenhouse experiment. Soil water content was measured for every water availability treatment (control: 80% of pot capacity; moderate reduction: 50%; high reduction: 25%) by sampling soil from random seedling pots and calculating percentage ((wet mass − dry mass)/wet mass × 100) (n = 25/water availability treatment). Water availability treatments began on May 10. Watering frequency was reduced from once every three days to once every four days after three weeks of the experiment (6 June 2019) due to high water content in the high reduction treatment.
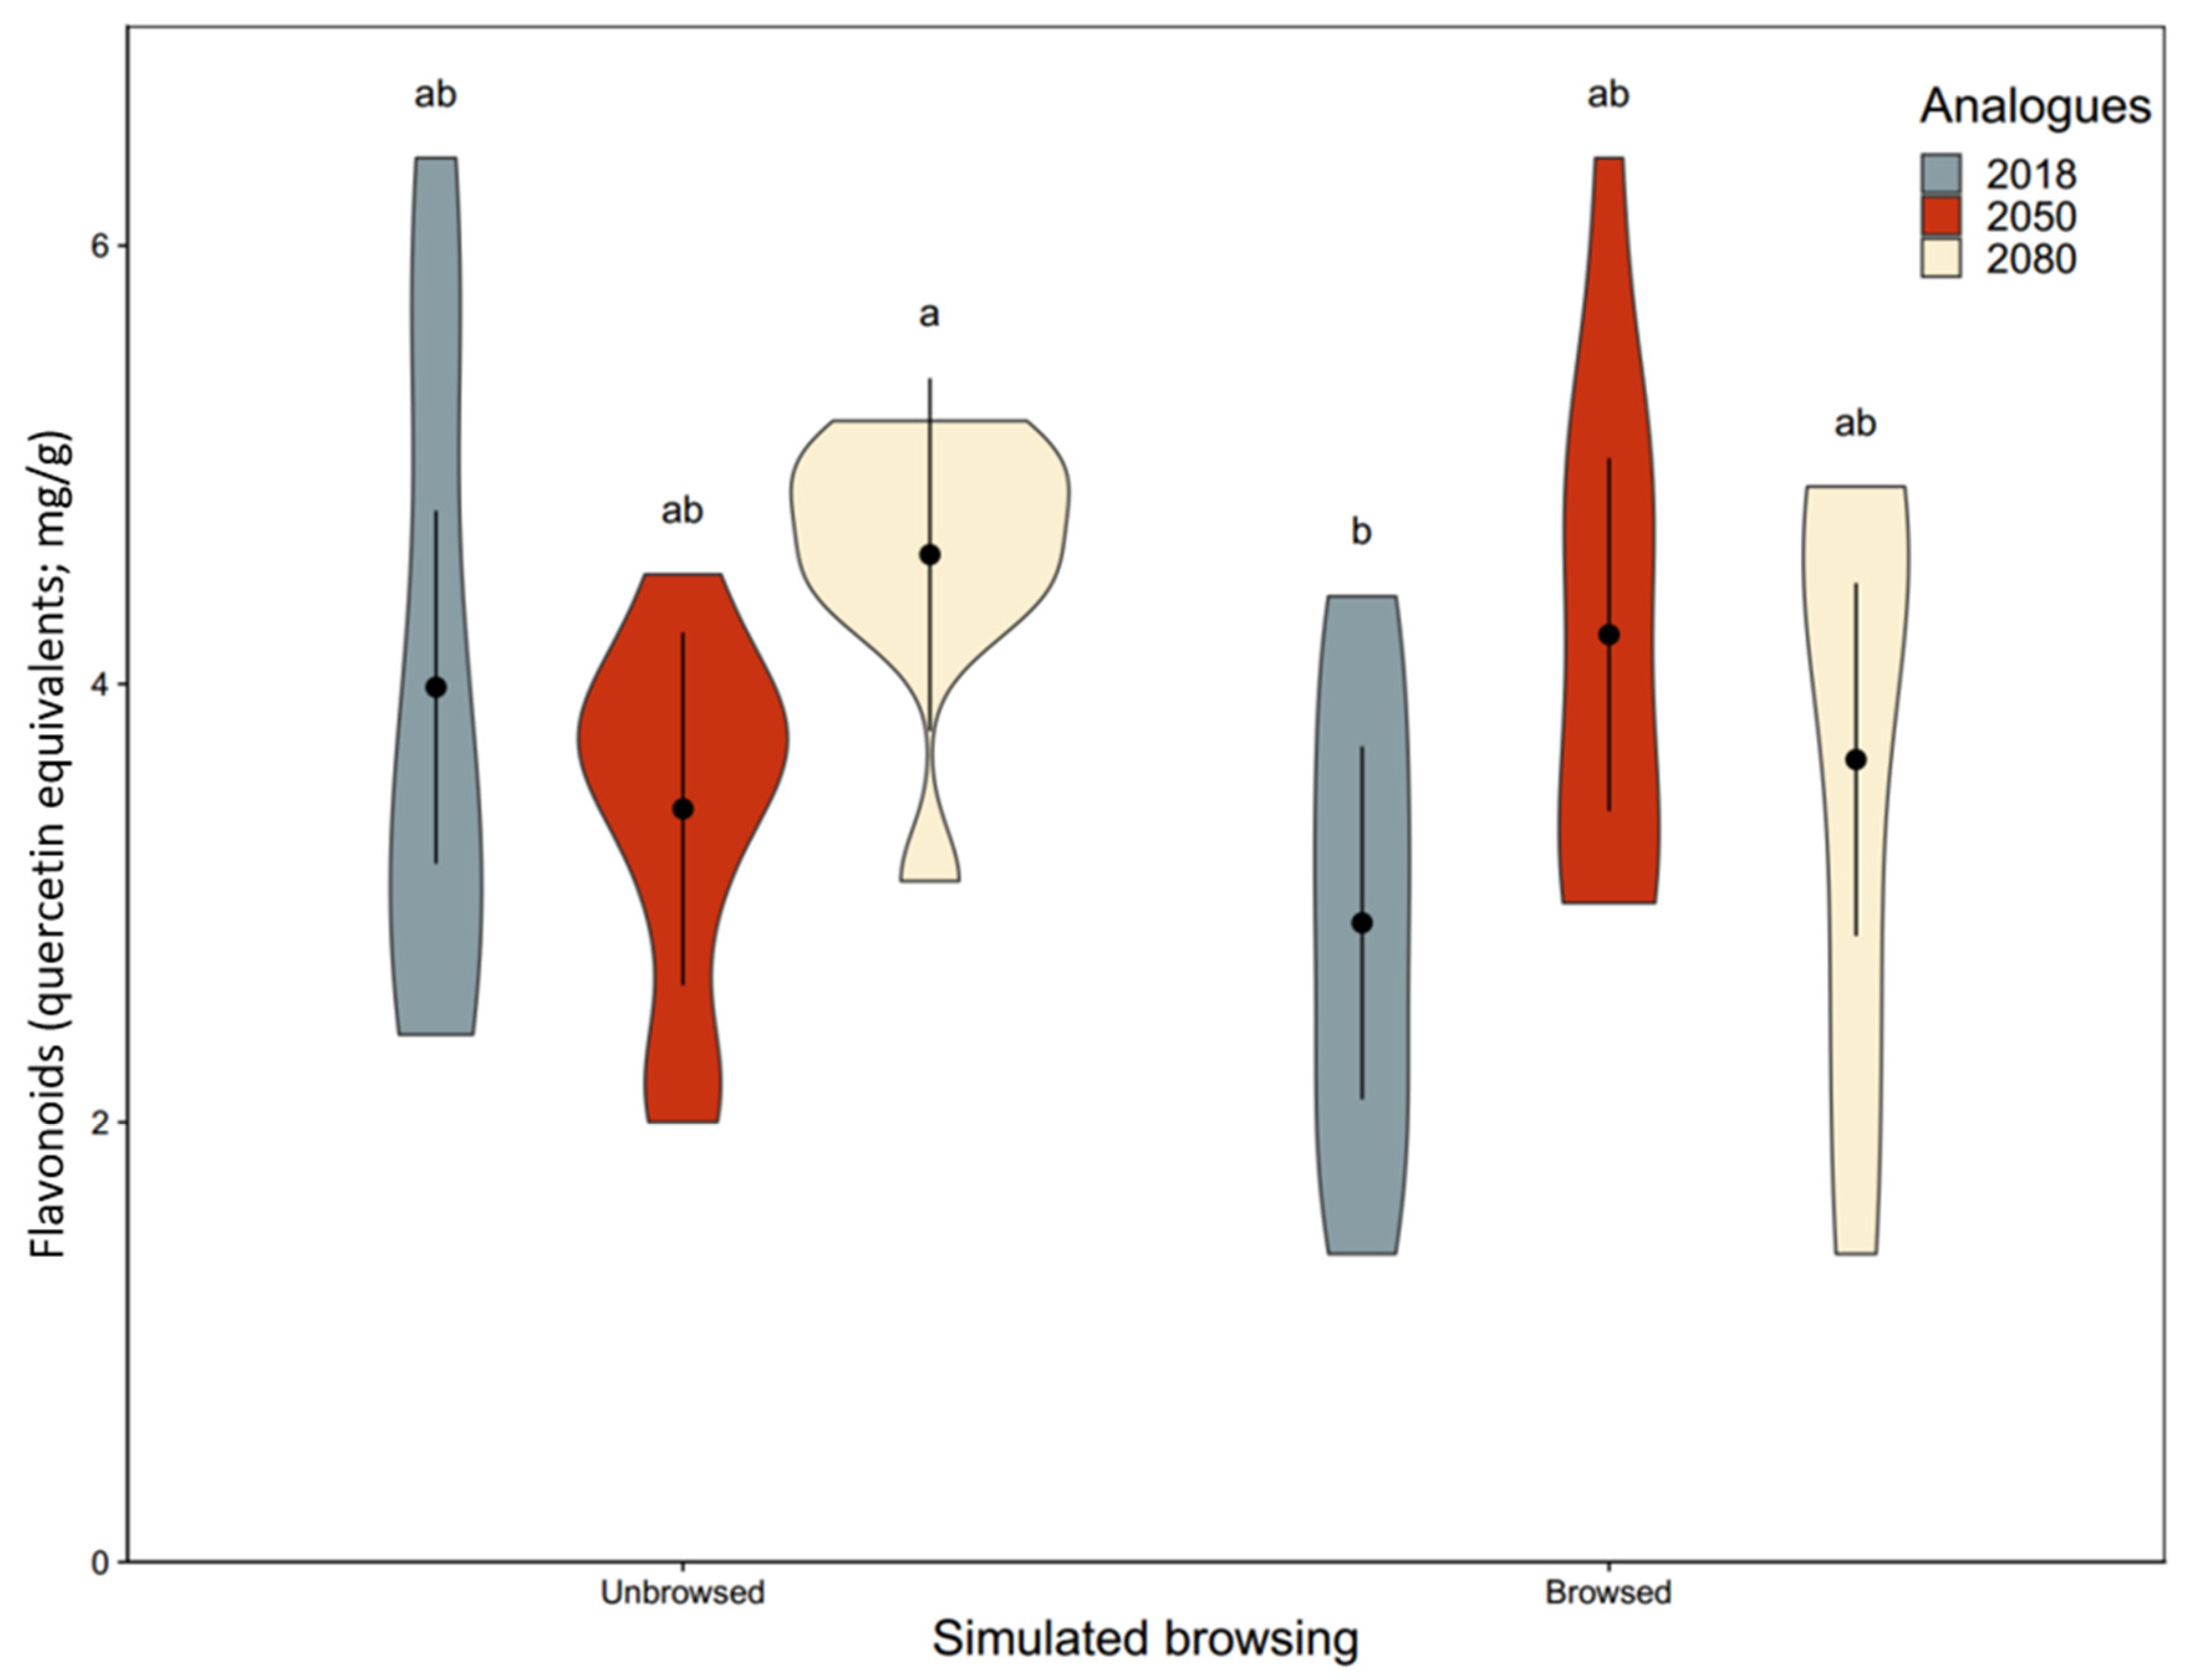
Forests 12 01396 g0a1
Figure A2. Simulated winter browsing effect on flavonoid concentration in three climate analogues black cherry (Prunus serotina Ehrh.) seedlings. Seedling dry mass ( x ¯ ± 95%CI of model estimates) was measured after ten weeks of growth in a greenhouse. Three different climate analogues were used (2018: analogue to the current climate at Réserve faunique de Portneuf (Québec, QC, Canada); 2050: analogue to the climate predicted for mid-century; 2080: analogue to the climate predicted for the end of the century). The analysis was performed using a linear mixed model with a random effect of blocks (n = 5). Different letters indicate a posteriori least square mean differences performed on climate analogue and browsing treatment (α = 0.05). Shapes represent the distribution of the data.
Forests 12 01396 g0a2
Figure A3. Differential effect of water availability on northern red oak (Quercus rubra L.) mass among climate analogues. Seedling dry mass ( x ¯ ± 95%CI of model estimates) was measured after ten weeks of growth in a greenhouse under two levels of water availability (control: 80% of pot capacity; high reduction: 25%). Three different climate analogues were used (2018: analogue to the current climate at Réserve faunique de Portneuf (Québec, QC, Canada); 2050: analogue to the climate predicted for mid-century; 2080: analogue to the climate predicted for the end of the century). The analysis was performed using a linear mixed model with a random effect of blocks (n = 5). To account for differences between the initial mass of seedlings, height at the beginning of the experiment and its interactions were included as a covariate in the model. Different letters indicate a posteriori least square mean differences performed on climate analogue and water availability treatment (α = 0.05). Shapes represent the distribution of the data.
Forests 12 01396 g0a3
Figure A4. Shoot:root ratio of northern white cedar (Thuja occidentalis L.) seedlings from three climate analogues after simulated winter browsing and water availability treatment. Seedling’s shoot:root ratio ( x ¯   ± 95%CI of model estimates) was measured after ten weeks of growth in a greenhouse under two levels of water availability (control: 80% of pot capacity; high reduction: 25%). Three different climate analogues were used (2018: analogue to the current climate at Réserve faunique de Portneuf (Québec, QC, Canada); 2050: analogue to the climate predicted for mid-century; 2080: analogue to the climate predicted for the end of the century). The analysis was performed using a linear mixed model with a random effect of blocks (n = 5), and while the interaction among all the experimental treatment was statistically significant, the a posteriori test did not reveal statistically significant difference among groups. To account for differences between the initial mass of seedlings, height at the beginning of the experiment and its interactions were included as a covariate in the model. Shapes represent the distribution of the data.
Forests 12 01396 g0a4
Figure A5. Flavonoid concentration of northern white cedar (Thuja occidentalis L.) seedlings from three climate analogues after simulated winter browsing. Seedling’s dry mass ( x ¯   ± 95%CI of model estimates) was measured after ten weeks of growth in a greenhouse. Three different climate analogues were used (2018: analogue to the current climate at Réserve faunique de Portneuf (Québec, QC, Canada); 2050: analogue to the climate predicted for mid-century; 2080: analogue to the climate predicted for the end of the century). The analysis was performed using a linear mixed model with a random effect of blocks (n = 5). Shapes represent the distribution of the data. The interaction between browsing and climate analogue was statistically significant, however, the a posteriori test did not reveal statistically significant difference among groups.
Forests 12 01396 g0a5

References

  1. Millar, C.I.; Stephenson, N.L. Temperate forest health in an era of emerging megadisturbance. Science 2015, 349, 823–826. [Google Scholar] [CrossRef]
  2. Gray, L.K.; Hamann, A. Tracking suitable habitat for tree populations under climate change in western North America. Clim. Chang. 2013, 117, 289–303. [Google Scholar] [CrossRef]
  3. Zhu, K.; Woodall, C.; Clark, J.S. Failure to migrate: Lack of tree range expansion in response to climate change. Glob. Chang. Biol. 2011, 18, 1042–1052. [Google Scholar] [CrossRef]
  4. Ste-Marie, C.; Nelson, E.A.; Dabros, A.; Bonneau, M.-E. Assisted migration: Introduction to a multifaceted concept. For. Chron. 2011, 87, 724–730. [Google Scholar] [CrossRef] [Green Version]
  5. Pedlar, H.J.; McKenney, D.W.; Aubin, I.; Beardmore, T.; Beaulieu, J.; Iverson, L.; O’Neill, G.A.; Winder, R.S.; Ste-Marie, C. Placing Forestry in the Assisted Migration Debate. Bioscience 2012, 62, 835–842. [Google Scholar] [CrossRef]
  6. Millar, C.I.; Stephenson, N.L.; Stephens, S.L. Climate Change and Forests of the Future: Managing in the Face of Uncertainty. Ecol. Appl. 2007, 17, 2145–2151. [Google Scholar] [CrossRef]
  7. Seedlot Selection Tool. Available online: https://seedlotselectiontool.org/sst/ (accessed on 25 September 2020).
  8. Winder, R.; Nelson, E.; Beardmore, T. Ecological implications for assisted migration in Canadian forests. For. Chron. 2011, 87, 731–744. [Google Scholar] [CrossRef]
  9. Côté, S.D.; Rooney, T.; Tremblay, J.-P.; Dussault, C.; Waller, D.M. Ecological Impacts of Deer Overabundance. Annu. Rev. Ecol. Evol. Syst. 2004, 35, 113–147. [Google Scholar] [CrossRef] [Green Version]
  10. Petersson, L.K.; Milberg, P.; Bergstedt, J.; Dahlgren, J.; Felton, A.M.; Götmark, F.; Salk, C.; Löf, M. Changing land use and increasing abundance of deer cause natural regeneration failure of oaks: Six decades of landscape-scale evidence. For. Ecol. Manag. 2019, 444, 299–307. [Google Scholar] [CrossRef]
  11. Pike, C.; Potter, K.M.; Berrang, P.; Crane, B.; Baggs, J.; Leites, L.; Luther, T. New Seed-Collection Zones for the Eastern United States: The Eastern Seed Zone Forum. J. For. 2020, 118, 444–451. [Google Scholar] [CrossRef] [Green Version]
  12. Benito-Garzón, M.; Fernández-Manjarrés, J.F. Testing scenarios for assisted migration of forest trees in Europe. New For. 2015, 46, 979–994. [Google Scholar] [CrossRef]
  13. Hester, J.A.; Bergman, M.; Iason, G.R.; Moen, J. Impacts of Large Herbivore on Plant Community Structure and Dynamics. In Large Herbivore Ecology, Ecosystem Dynamics and Conservation; Danell, H., Bergström, R., Duncan, P., Pastor, J., Eds.; Cambridge University Press: Cambridge, UK, 2006; pp. 97–141. [Google Scholar]
  14. Wise, M.J.; Abrahamson, W.G. Applying the Limiting Resource Model to Plant Tolerance of Apical Meristem Damage. Am. Nat. 2008, 172, 635–647. [Google Scholar] [CrossRef]
  15. Bergström, R.; Danell, K. Effects of Simulated Winter Browsing by Moose on Morphology and Biomass of Two Birch Species. J. Ecol. 1987, 75, 533–544. [Google Scholar] [CrossRef]
  16. Guillet, C.; Bergström, R. Compensatory growth of fast-growing willow (Salix) coppice in response to simulated large herbivore browsing. Oikos 2006, 113, 33–42. [Google Scholar] [CrossRef]
  17. Belsky, A.J. Does Herbivory Benefit Plants? A Review of the Evidence. Am. Nat. 1986, 127, 870–892. [Google Scholar] [CrossRef]
  18. Wise, M.J.; Abrahamson, W.G. Beyond the compensatory continuum: Environmental resource levels and plant tolerance of herbivory. Oikos 2005, 109, 417–428. [Google Scholar] [CrossRef]
  19. Hawkes, C.V.; Sullivan, J.J. The Impact of Herbivory on Plants in Different Resource Conditions: A Meta-Analysis. Ecology 2001, 82, 2045–2058. [Google Scholar] [CrossRef]
  20. Barton, K.E.; Shiels, A.B. Additive and non-additive responses of seedlings to simulated herbivory and drought. Biotropica 2020, 169, 1033–1042. [Google Scholar] [CrossRef]
  21. Sun, Y.; Ding, J.; Frye, M.J. Effects of Resource Availability on Tolerance of Herbivory in the Invasive Alternanthera Philox-eroides and the Native Alternanthera Sessilis. Weed Res. 2010, 50, 527–536. [Google Scholar] [CrossRef]
  22. Jamieson, M.A.; Trowbridge, A.; Raffa, K.F.; Lindroth, R.L. Consequences of Climate Warming and Altered Precipitation Patterns for Plant-Insect and Multitrophic Interactions. Plant Physiol. 2012, 160, 1719–1727. [Google Scholar] [CrossRef] [Green Version]
  23. Michaelian, M.; Hogg, E.H.; Hall, R.J.; Arsenault, E. Massive mortality of aspen following severe drought along the southern edge of the Canadian boreal forest. Glob. Chang. Biol. 2011, 17, 2084–2094. [Google Scholar] [CrossRef] [Green Version]
  24. Williamson, B.T.; Colombo, S.J.; Duinker, P.N.; Gray, P.A.; Hennessey, R.J.; Houle, D.; Johnston, M.H.; Ogden, A.E.; Spittlehouse, D.L. Climate Change and Canada’s Forests: From Impacts to Adaptation. Sustainable Forest Management Network and Natural Resources Canada; Canadian Forest Service, Northern Forestry Centre: Edmonton, AB, Canada, 2009; p. 112. [Google Scholar]
  25. McCarthy, M.C.; Enquist, B.J. Consistency between an allometric approach and optimal partitioning theory in global patterns of plant biomass allocation. Funct. Ecol. 2007, 21, 713–720. [Google Scholar] [CrossRef]
  26. Eziz, A.; Yan, Z.; Tian, D.; Han, W.; Tang, Z.; Fang, J. Drought effect on plant biomass allocation: A meta-analysis. Ecol. Evol. 2017, 7, 11002–11010. [Google Scholar] [CrossRef]
  27. Gedroc, J.J.; McConnaughay, K.D.M.; Coleman, J.S. Plasticity in Root Shoot Partitioning: Optimal, Ontogenetic, or Both? Funct. Ecol. 1996, 10, 44–50. [Google Scholar] [CrossRef]
  28. Kullberg, Y.; Welander, N. Effects of simulated winter browsing and drought on growth of Quercus robur L. seedlings during establishment. For. Ecol. Manag. 2003, 173, 125–133. [Google Scholar] [CrossRef]
  29. Gutbrodt, B.; Dorn, S.; Mody, K. Drought stress affects constitutive but not induced herbivore resistance in apple plants. Arthropod Plant Interact. 2012, 6, 171–179. [Google Scholar] [CrossRef] [Green Version]
  30. Koricheva, J.; Larsson, S.; Haukioja, E.; Keinänen, M. Regulation of Woody Plant Secondary Metabolism by Resource Availability: Hypothesis Testing by Means of Meta-Analysis. Oikos 1998, 83, 212–226. [Google Scholar] [CrossRef]
  31. Grenier, P.; Parent, A.-C.; Huard, D.; Anctil, F.; Chaumont, D. An Assessment of Six Dissimilarity Metrics for Climate Analogs. J. Appl. Meteorol. Clim. 2013, 52, 733–752. [Google Scholar] [CrossRef]
  32. Saucier, J.-P.; Robitaille, A.; Grondin, P. Cadre Bioclimatique Du Québec. In Manuel De Foresterie, 2nd ed.; Doucet, R., Côté, M., Eds.; Multimonde: Québec, Canada, 2009; pp. 186–205. [Google Scholar]
  33. Champagne, E.; Royo, A.A.; Tremblay, J.-P.; Raymond, P. Tree assisted migration in a browsed landscape: Can we predict susceptibility to herbivores? For. Ecol. Manag. 2021, 498, 119576. [Google Scholar] [CrossRef]
  34. Périé, C.; de Blois, S.; Lambert, M.-C.; Casajus, N. Effets Anticipés Des. Changements Climatiques Sur L’habitat Des. Espèces Arborescentes Au Québec; Gouvernement du Québec, Ministère des Ressources Naturelles: Quebec, QC, Canada, 2014. [Google Scholar]
  35. Bergström, R.; Edenius, L. From twigs to landscapes—Methods for studying ecological effects of forest ungulates. J. Nat. Conserv. 2003, 10, 203–211. [Google Scholar] [CrossRef]
  36. Champagne, E.; Turgeon, R.; Munson, A.D.; Raymond, P. Dataset of Seedlings Response to Simulated Browsing and Water Stress: Insights for Assisted Migration Plantations. 2021. Available online: https://figshare.com/articles/dataset/Seedlings_response_to_simulated_browsing_and_water_stress_insights_for_assisted_migration_plantations/14356007/2 (accessed on 1 April 2021).
  37. Potvin, F. L’inventaire Du Brout: Revue Des. Méthodes Et Description De Deux Techniques; Ministère de l’Environnement et de la Faune: Québec, QC, Canada, 1995; p. 70. [Google Scholar]
  38. Soil Water. Available online: http://prometheuswiki.org/tiki-pagehistory.php?page=Soil%20Water&preview=9 (accessed on 25 September 2020).
  39. Passioura, J.B. The perils of pot experiments. Funct. Plant Biol. 2006, 33, 1075–1079. [Google Scholar] [CrossRef]
  40. Jafarnia, S.; Akbarinia, M.; Hosseinpour, B.; Sanavi, S.M.; Salami, S. Effect of drought stress on some growth, morphological, physiological, and biochemical parameters of two different populations of Quercus brantii. iForest 2018, 11, 212–220. [Google Scholar] [CrossRef]
  41. Ma, F.; Xu, T.T.; Ji, M.F.; Zhao, C.M. Differential drought tolerance in tree populations from contrasting elevations. AoB Plants 2014, 6, 069. [Google Scholar] [CrossRef] [Green Version]
  42. Champagne, E.; Royo, A.A.; Tremblay, J.-P.; Raymond, P. Phytochemicals Involved in Plant Resistance to Leporids and Cervids: A Systematic Review. J. Chem. Ecol. 2020, 46, 84–98. [Google Scholar] [CrossRef] [PubMed]
  43. Appel, H.M.; Govenor, H.L.; D’Ascenzo, M.; Siska, E.; Schultz, J. Limitations of Folin Assays of Foliar Phenolics in Ecological Studies. J. Chem. Ecol. 2001, 27, 761–778. [Google Scholar] [CrossRef]
  44. Mattson, W.J. Herbivory in Relation to Plant Nitrogen Content. Annu. Rev. Ecol. Syst. 1980, 11, 119–161. [Google Scholar] [CrossRef]
  45. Sauvesty, A.; Page, F.; Huot, J. A simple method for extracting plant phenolic compounds. Can. J. For. Res. 1992, 22, 654–659. [Google Scholar] [CrossRef]
  46. Pękal, A.; Pyrzynska, K. Evaluation of Aluminium Complexation Reaction for Flavonoid Content Assay. Food Anal. Methods 2014, 7, 1776–1782. [Google Scholar] [CrossRef] [Green Version]
  47. Kuznetsova, A.; Brockhoff, P.B.; Christensen, R.H.B. lmerTest Package: Tests in Linear Mixed Effects Models. J. Stat. Softw. 2017, 82, 1–26. [Google Scholar] [CrossRef] [Green Version]
  48. Russell, V.L. Least-Squares Means: The R Package Lsmeans. J. Stat. Softw. 2016, 69, 1–33. [Google Scholar]
  49. R Core Team. R: A Language and Environment for Statistical Computing; R Foundation for Statistical Computing: Vienna, Austria, 2019. [Google Scholar]
  50. Muehleisen, A.J.; Engelbrecht, B.M.J.; Jones, F.A.; Manzané-Pinzón, E.; Comita, L.S. Local adaptation to herbivory within tropical tree species along a rainfall gradient. Ecology 2020, 101, e03151. [Google Scholar] [CrossRef]
  51. Sork, V.L.; Stowe, K.A.; Hochwender, C. Evidence for Local Adaptation in Closely Adjacent Subpopulations of Northern Red Oak (Quercus rubra L.) Expressed as Resistance to Leaf Herbivores. Am. Nat. 1993, 142, 928–936. [Google Scholar] [CrossRef] [PubMed]
  52. Garrido, E.; Llamas-Guzmán, L.P.; Fornoni, J. The effect of frequency-dependent selection on resistance and tolerance to herbivory. J. Evol. Biol. 2016, 29, 483–489. [Google Scholar] [CrossRef] [PubMed]
  53. Barton, K.E.; Koricheva, J. The Ontogeny of Plant Defense and Herbivory: Characterizing General Patterns Using Me-ta-Analysis. Am. Nat. 2010, 175, 481–493. [Google Scholar] [CrossRef] [PubMed] [Green Version]
  54. Boisvert-Marsh, L.; Royer-Tardif, S.; Nolet, P.; Doyon, F.; Aubin, I. Using a Trait-Based Approach to Compare Tree Species Sensitivity to Climate Change Stressors in Eastern Canada and Inform Adaptation Practices. Forests 2020, 11, 989. [Google Scholar] [CrossRef]
  55. Dey, D.C. Sustaining Oak Forests in Eastern North America: Regeneration and Recruitment, the Pillars of Sustainability. For. Sci. 2014, 60, 926–942. [Google Scholar] [CrossRef]
  56. Abrams, M.D.; Kloeppel, B.D.; Kubiske, M.E. Ecophysicological and Morphological Responses to Shade and Drought in Two Contrasting Ecotypes of Prunus Serotina. Tree Physiol. 1992, 10, 343–355. [Google Scholar] [CrossRef]
  57. Marquis, D.A. Black Cherry. In Silvics of North America, Volume 2: Hardwoods; Burns, R.M., Honkala, B.H., Eds.; United States Department of Agriculture (USDA), Forest Service: Washington, DC, USA, 1990. [Google Scholar]
  58. Tardif, J.; Bergeron, Y. Comparative Dendroclimatological Analysis of Two Black Ash and Two White Cedar Populations from Contrasting Sites in the Lake Duparquet Region, Northwestern Quebec. Can. J. For. Res. 1997, 27, 108–116. [Google Scholar] [CrossRef]
  59. Housset, J.M.; Girardin, M.P.; Baconnet, M.; Carcaillet, C.; Bergeron, Y. Unexpected warming-induced growth decline in Thuja occidentalis at its northern limits in North America. J. Biogeogr. 2015, 42, 1233–1245. [Google Scholar] [CrossRef]
  60. Godman, R.M.; Yawney, H.W.; Tubbs, C.H. Sugar Maple. In Silvics of North America, Volume 2: Hardwoods; Burns, R.M., Honkala, B.H., Eds.; United States Department of Agriculture (USDA), Forest Service: Washington, DC, USA, 1990. [Google Scholar]
  61. Netherer, S.; Matthews, B.; Katzensteiner, K.; Blackwell, E.; Henschke, P.; Hietz, P.; Pennerstorfer, J.; Rosner, S.; Kikuta, S.; Schume, H.; et al. Do Water-Limiting Conditions Predispose Norway Spruce to Bark Beetle Attack? New Phytol. 2014, 205, 1128–1141. [Google Scholar] [CrossRef] [PubMed]
  62. Schall, P.; Lödige, C.; Beck, M.; Ammer, C. Biomass allocation to roots and shoots is more sensitive to shade and drought in European beech than in Norway spruce seedlings. For. Ecol. Manag. 2012, 266, 246–253. [Google Scholar] [CrossRef]
  63. Puglielli, G.; Laanisto, L.; Poorter, H.; Niinemets, Ü. Global patterns of biomass allocation in woody species with different tolerances of shade and drought: Evidence for multiple strategies. New Phytol. 2021, 229, 308–322. [Google Scholar] [CrossRef] [PubMed]
  64. Edenius, L. Browsing by Moose on Scots Pine in Relation to Plant Resource Availability. Ecology 1993, 74, 2261–2269. [Google Scholar] [CrossRef]
  65. Persson, I.L.; Bergström, R.; Danell, K. Browse Biomass Production and Regrowth Capacity after Biomass Loss in Deciduous and Coniferous Trees: Responses to Moose Browsing Along a Productivity Gradient. Oikos 2007, 116, 1639–1650. [Google Scholar] [CrossRef]
  66. O’Reilly-Wapstra, J.; Moore, B.; Brewer, M.; Beaton, J.; Sim, D.; Wiggins, N.L.; Iason, G.R. Pinus sylvestris sapling growth and recovery from mammalian browsing. For. Ecol. Manag. 2014, 325, 18–25. [Google Scholar] [CrossRef]
  67. Johnston, W.F. Northern White-Cedar. In Silvics of North America. Volume 1: Conifers; Burns, R.M., Honkala, B.H., Eds.; United States Department of Agriculture (USDA), Forest Service: Washington, DC, USA, 1990. [Google Scholar]
  68. Cornett, M.W.; Frelich, L.; Puettmann, K.J.; Reich, P. Conservation implications of browsing by Odocoileus virginianus in remnant upland Thuja occidentalis forests. Biol. Conserv. 2000, 93, 359–369. [Google Scholar] [CrossRef]
  69. Larouche, C.; Kenefic, L.; Ruel, J.-C. Northern White-Cedar Regeneration Dynamics on the Penobscot Experimental Forest in Maine: 40-Year Results. North. J. Appl. For. 2010, 27, 5–12. [Google Scholar] [CrossRef] [Green Version]
  70. Vitt, P.; Havens, K.; Kramer, A.T.; Sollenberger, D.; Yates, E. Assisted migration of plants: Changes in latitudes, changes in attitudes. Biol. Conserv. 2010, 143, 18–27. [Google Scholar] [CrossRef]
Figure 1. Greenhouse experimental design and illustrations of the simulated browsing treatments. (a) Picture of the greenhouse before distribution of seedlings in blocks and schematic illustration of the experimental design. Water reduction treatment was applied on the main plots (control, moderate reduction, high reduction), while the simulated browsing treatment, geographic provenance and species were distributed randomly within the main plots; (b) Browsing by white-tailed deer (Odocoileus virginianus) on sugar maple (Acer saccharum) at the plantation site (Réserve faunique de Portneuf, QC, Canada); (c) Simulated browsing on the apical shoot of white cedar (Thuja occidentalis); (d) Simulated browsing on white pine (Pinus strobus); (e) Example of a white pine (red ellipse) that experienced a second bud burst in the fall preceding the simulation experiment.
Forests 12 01396 g001
Figure 2. Differential effect of simulated winter browsing and reduced water availability on total mass of five seedling’s species from a greenhouse experiment. Dry mass ( x ¯ ± 95%CI of model estimates) of (a) black cherry (Prunus serotina Ehrh.); (b) northern red oak (Quercus rubra L.); (c) sugar maple (Acer saccharum Marsh.); (d) white pine (Pinus strobus L.); (e) white cedar (Thuja occidentalis L.). We measured the dry mass after ten weeks of growth under two or three levels of water availability reduction (control: 80% of pot capacity; moderate reduction: 50%; high reduction: 25%). We used a linear mixed model with a random effect of blocks (n = 5) to evaluate the effect of treatments on mass. To account for differences between the initial mass of seedlings, height at the beginning of the experiment and its interactions were included as a covariate in the model. Different letters indicate a posteriori least square mean differences performed on either simulated browsing or water stress treatment or both (α = 0.05). Violin shapes represent the distribution of the data.
Forests 12 01396 g002
Table 1. Soil water content (mean ± sd % of pot capacity) under two or three water reduction levels (control, moderate reduction and high reduction) of black cherry (Prunus serotina Ehrh.), northern red oak (Quercus rubra L.), sugar maple (Acer saccharum Marsh.), white pine (Pinus strobus L.) and northern white cedar (Thuja occidentalis L.) seedlings at the end of a ten week greenhouse experiment (n = 5/water availability treatment/species). We measured the soil water content by sampling soil from random seedling pots and calculating percentage ((wet mass − dry mass)/wet mass × 100). We used one linear mixed model per species (blocks as random effect) to evaluate differences among treatment levels at the end of the experiment, using least-means differences for fixed effects when there was three level of treatment. Letters indicate statistically significant differences within a species (α = 0.05).
Water Availability TreatmentSoil Water Content (% ± SD)
Black Cherry 1RED OAKSugar MapleWhite PineWhite Cedar
Control58 ± 6 a59 ± 7 a61 ± 3 a61 ± 339 ± 13 ab
Moderate reduction--38 ± 22 b50 ± 2042 ± 19 a
High reduction19 ± 4 b23 ± 12 b20 ± 9 b38 ± 1322 ± 7 b
1 Black cherry seedlings were removed from the experiment after three weeks, these means are the last recorded value for this species, before a watering frequency reduction for the last seven weeks of experiment.
Publisher’s Note: MDPI stays neutral with regard to jurisdictional claims in published maps and institutional affiliations.

