Article

Impacts of Payment for Forest Ecosystem Services in Protecting Forests in Dak Lak Province, Vietnam

by
Thu Thuy Pham
1,*,
Thi Thanh Thuy Le
2,
Hoa Nie Kdam Tuyet
3,
Van Trương Pham
4,
Phuong Hanh Nie Kdam Tran
3,
Trung Dung Tran
5,
Ngoc My Hoa Tran
6,
Thi Thuy Anh Nguyen
7 and
Thi Van Anh Nguyen
8
1
Center for International Forestry Research, Bogor 16115, Indonesia
2
Independent Researcher, Hanoi 100000, Vietnam
3
Tay Nguyen Center for Rural Development, Dak Lak 630000, Vietnam
4
Faculty of Economics, Tay Nguyen University, Dak Lak 630000, Vietnam
5
Faculty of Natural Sciences and Technology, Tay Nguyen University, Buôn Ma Thuột 630000, Vietnam
6
Hanoi University of Science, Vietnam National University, Hanoi 100000, Vietnam
7
Diplomatic Academy of Vietnam, Hanoi 100000, Vietnam
8
Hanoi University of Social Sciences and Humanities, Vietnam National University, Hanoi 100000, Vietnam
*
Author to whom correspondence should be addressed.
Forests 2021, 12(10), 1383; https://doi.org/10.3390/f12101383
Submission received: 24 August 2021 / Revised: 23 September 2021 / Accepted: 29 September 2021 / Published: 11 October 2021
(This article belongs to the Special Issue Methods and Models to Assess Forest Ecosystem Services)

Abstract

:
Vietnam’s Payment for Forest Ecosystem Services (PFES) scheme has the goal of protecting remaining natural forests by providing financial support to people involved in forest protection. However, studying the case of Dak Lak province in the Central Highlands region of Vietnam shows that even after eight years of PFES implementation, achieving this goal remains a challenge. Although PFES does provide a stable income source and higher payments than state forest protection programs, enables the mobilization of more personnel resources for patrolling forest and relieves a great burden on the state budget in terms of investment in forest protection and development, forest cover in Dak Lak province is still decreasing, mainly due to conversion for other land uses, especially commercial agricultural and industrial crops. These drivers are rooted in national socio-economic planning aimed at boosting economic growth and in local people’s need to sustain their livelihoods. In addition, our paper shows that illegal logging is still widespread in Dak Lak. Weak law enforcement in areas of forest managed by state forest authorities and state companies also contributes to deforestation. However, these drivers are neither fully recognized nor addressed, and instead, the blame for deforestation is laid on local communities. PFES alone cannot protect forests in Dak Lak province. It needs to be backed up by political commitment to address underlying drivers of deforestation, improved social programs to help local people diversify their income sources and clarity over land use.

1. Introduction

The international community has long seen Payment for Environmental Services (PES) as an approach with the potential to protect and enhance ecosystem services and contribute to poverty reduction in developing countries [1,2,3,4,5,6,7]. Currently, there is no common international definition of PES, and the concept is viewed through different lenses. The most popular definition used by international scholars is Wunder’s (2005) framework, which sees PES as a voluntary, conditional transaction with at least one seller, one buyer and a well-defined environmental service [8]. PES operates by trading ecosystem services using an agreed standard unit of exchange between environmental service buyers and sellers [9]. The focus on monetary value and the ability to commodify environmental services has gained increasing political attention and boosted support for PES [10]. However, an increasing number of studies are pointing out that PES should not be seen as a purely economic and market-based approach, but as an institutional approach to improve the relationship between the state and communities [11], and instead of focusing on the buyer and seller relationship, PES should be defined in terms of its additionality (what the environmental service status would be in the absence of PES) and linking it to offsite externalities [12]. Moreover, PES literature and frameworks often overlook the political economy of drivers of environmental services loss and degradation leading to failures of PES implementation [13]. Narrowing PES to an economic problem and solution also creates technical and ethnical problems, particularly if environmental services production and uses are driven by power asymmetries, and inequity exists in accessing and benefiting from these environmental services [9,14].
In reality, despite a vast available theoretical framework, with the array of definitions of PES, countries interpret and adopt PES differently to serve their political needs and to fit with political, economic and social texts. For example, in Europe, PES schemes are seen as important policy instruments in the EU Water Framework Directive [15], the EU Biodiversity Strategy to 2020 and in the Roadmap for a Resource Efficient Europe [16]. In many EU countries such as Germany and France, governments can pay for landowners to conserve certain high biodiversity value areas [17] and improve water quality [18]. PES schemes in Latin America, Africa and Asia also have different focuses and institutional arrangements. Mexico’s PES is a combination of market-based instruments, state regulation and subsidies [19]. In Ecuador, although PES is built on market-based instruments, it has been refined over time to meet stakeholders’ interests in water services provision [20]. In Madagascar, PES is adopted as a community-based conservation intervention to provide financial profits for local communities [21]. In Brazil, PES is adopted by stakeholders as a key component for incentivizing landowners to move away from deforestation and for distributing REDD+ (Reducing Emissions from Deforestation and Degradation) payments to local people [22]. In South Africa, PES is expected to contribute to the restoration of natural capital in rural areas [23]. In Costa Rica, although the government aims to develop a true market-based approach where environmental service users directly buy environmental services, PES still operates primarily by strong state interventions [24]. In most of these schemes, service buyers are commonly public agencies and communities, while local households act as environmental service providers [11].
In Asia, most PES schemes focus on watershed management and vary from command-and-control to more decentralized, participatory approaches to watershed management [25]. However, as most forest and agricultural lands in Asia are state-controlled with weak recognition of customary and community rights and have unclear tenure, PES schemes are often top-down and are not voluntary [25,26]. Arriving late in the PES policy arena, in 2008, Vietnam became the first country in Asia to initiate a national PES policy. To highlight the role of forest environmental services, the country named its PES program Payment for Forest Environmental Services (PFES) and now views PFES as one of its most successful forestry policies of the past decade [27]. The Vietnam Forestry Law (2017) defines five types of forest environmental services under the national PFES scheme: (i) soil protection, reduction of erosion and sedimentation in reservoirs, rivers and streams (watersheds); (ii) regulation and maintenance of water sources for production and social life; (iii) forest carbon sequestration and retention, reduction of greenhouse gas emissions by measures of preventing forest degeneration and forest area decrease and developing forests in a sustainable manner; (iv) protection of natural landscapes and conservation of biodiversity of eco-systems for tourism; and (v) provision of spawning grounds, sources of feed and natural seeds, use of water from forests for aquaculture [28]. The law also specifies that a trust fund called the Vietnam Forestry Protection and Development Fund and its provincial units be established to receive payments from users of these environmental services and transfer them to forest managers. Users of these environmental services have to pay fixed payment rates determined by the government. In other words, PFES is a government-mandated scheme rather than a true market-based approach. Among the five environmental services listed in the law, PFES can only operate for the first two forest environmental services. The general public pay additional fees to their electricity and water bills for PFES. These payments are collected by water and hydropower companies and transferred to the trust fund.
Dak Lak province is located at the heart of the Central Highlands region, which has one of the two largest intact forest areas in Vietnam at around 2,562,000 hectares (ha) as of 2017 [29]. The province itself also has a large forest area at around 512,850 ha, 91.38% of which is some of the most intact natural forest in Vietnam, and contains globally outstanding biodiversity [30,31]. However, increasing pressure has led to a decrease in forest area in Dak Lak [30,31], and the rate of decrease has reached an alarming level in recent years [32]. Between 2005–2015, around 582,657 ha of natural forest was lost and around 2.4 million ha became degraded in the region [33]. Rubber, coffee, cassava and pepper crop expansion have been identified as the largest drivers of this deforestation. Deforestation is also due to a high poverty rate, with 22.53% of households being poor or near poor, and land use conflicts between the agriculture, forestry, mining and energy sectors [34]. The central and Dak Lak provincial governments both consider protecting remaining forests to be a priority, and have put numerous policies in place to achieve this goal [35,36,37,38,39]. The government sees Payment for Forest Ecosystem Services (PFES) as a promising solution [40,41]. PFES was first piloted in Vietnam in 2008. It began being applied nationwide in 2010, reaching Dak Lak province in 2013. Total PFES revenue in Dak Lak over the 2013–2018 period was USD 15.4 million. Numerous studies have attempted to analyze the environmental impacts of PFES in different parts of Vietnam, including Son La [42,43,44], Dong Nai [45], Bac Kan [46,47], Lam Dong [48,49], Dien Bien and Lai Chau [50] and Thua Thien Hue provinces [51,52]. However, there is minimal information on the impacts of PFES in Dak Lak province. Despite a lack of rigorous assessment on PFES impacts, the government and donors aim to include PFES as a key policy component of other policies, including Reducing Emissions from Deforestation and Forest Degradation (REDD+) [31,53,54,55]. There is an urgent need for greater understanding of PFES impacts in Dak Lak province to assess whether it meets government expectations for forest protection, and to offer lessons for REDD+. Such knowledge would help in developing and refining a sound evidence base for policy [56,57,58]. By employing a mixed research method including a literature review, key informant interviews, household surveys and validation workshops, this paper presents stakeholders’ perceptions on PFES impacts in Dak Lak. The paper contributes to PFES policy evaluation in Vietnam, and provides lessons learned for future forestry and payment for ecosystem services policies globally.

2. Methods

The research team applied a wide range of methods. First, we reviewed secondary data in the form of government statistics and reports on PFES impacts in Dak Lak. Key informant interviews were conducted with 50 people, including three provincial, twelve district, eight commune and twenty-seven village government staff directly involved in PFES implementation in the study sites. These key informants were selected as they are directly involved in the designing, implementation and monitoring of PFES in Dak Lak. These interviews aimed to ascertain the status of PFES implementation in Dak Lak province, as well as interviewees’ perceptions of opportunities and challenges for PFES implementation and their assessments of its impacts.
We chose eight pairs of study villages as our study sites (Figure 1 and Table 1). The research team undertook several steps in selecting these villages. First, we reviewed government socio-economic reports and reports provided by the Dak Lak Forest Protection and Development Fund to identify 15 pairs of villages (PFES and non-PFES) with similar political, social and economic conditions, following a method developed by previous scholars [45,59]. More specifically, we identified villages that have similar characteristics, such as population, village area, ethnicity, distance to roads and markets, forest dependence, forest tenure, forest area, experience with a forest conservation schemes (both state and non-state programs) and major deforestation threats. We then visited these villages to validate their similarities and enquire whether villagers were willing to participate in our study. This resulted in the final selection of eight pairs of study villages (Table 1 and Table 2, Figure 1).
Common incomes sources for villagers in the study villages are derived from agriculture production, from collecting forest products, forest protection and cattle raising.
Household surveys were conducted with 480 households (30 per village) in PFES and non-PFES sites. The survey instrument elicited information on households’ income sources, their involvement in forest protection in general and PFES, in particular, and their views on forest area and quality before and after PFES. Moreover, specifically, the survey is also structured to include a set of open-ended questions to measure (i) the potential effect of PFES on household well-being on the basis of objective metrics (livelihood, assets and income before and after PFES) and subjective metrics (perceived well-being status and the reasons for change); (ii) the potential effect of PFES on land and resource use at the level of the household; and (iii) household knowledge of and involvement in the process of establishing and implementing PFES. The households were randomly selected by the research team from lists of all villagers provided by local governments. The research team used a random number generator in Excel to select the households. We conducted both descriptive and regression analysis for our survey data. The key informant interviews were also transcribed and analyzed using thematic and text analysis.
A consultation workshop involving 25 participants from government agencies, academia, local civil society organizations and representatives from study villages was held in September 2020 in the provincial capital Buôn Ma Thuột in order to obtain feedback from stakeholders on the study’s findings.

3. Results

3.1. Overview of PFES in Dak Lak Province

PFES has been implemented in Dak Lak province since 2013. This section presents the institutional setting to operate PFES in Dak Lak, and identifies buyers, sellers, levels of payment and how payments are collected and distributed in the province.

3.1.1. Environmental Service Users in Dak Lak

The Dak Lak Provincial Forest Protection and Development Fund (FPDF) under the Dak Lak Department of Agriculture and Rural Development (DARD) is the authorized agency in charge of mobilizing, receiving and managing PFES payments made by environmental service users and transferring them to environmental services providers to protect forests.
Currently, members of the public are charged for using ecosystem services at a rate VND 36 for every kWh of electricity they use, and VND 52 for every cubic meter of water. At the time of writing and current rate of exchange, VND 23,000 is equivalent to USD 1. The public pays these additional charges through their water and electricity bills, and water supply and hydropower companies collect these payments. Other user groups, such as tourism agencies, aquaculture farms and industrial companies have yet to pay fees, despite national policies mandating them to do so.
PFES revenues for Dak Lak also come from two sources: the Vietnam Forest Protection Fund, which collects payments from users operating in interprovincial catchments, and Dak Lak Forest Protection and Development Fund, which collects payments from users only operating in Dak Lak province. Table 3 shows that nearly 90% of PFES revenue for Dak Lak was allocated from the Vietnam Forest Protection and Development Fund (VNFF) at the central level. Hydropower companies paid 99.4% of this revenue, while only 0.6% was paid by water plants [60].

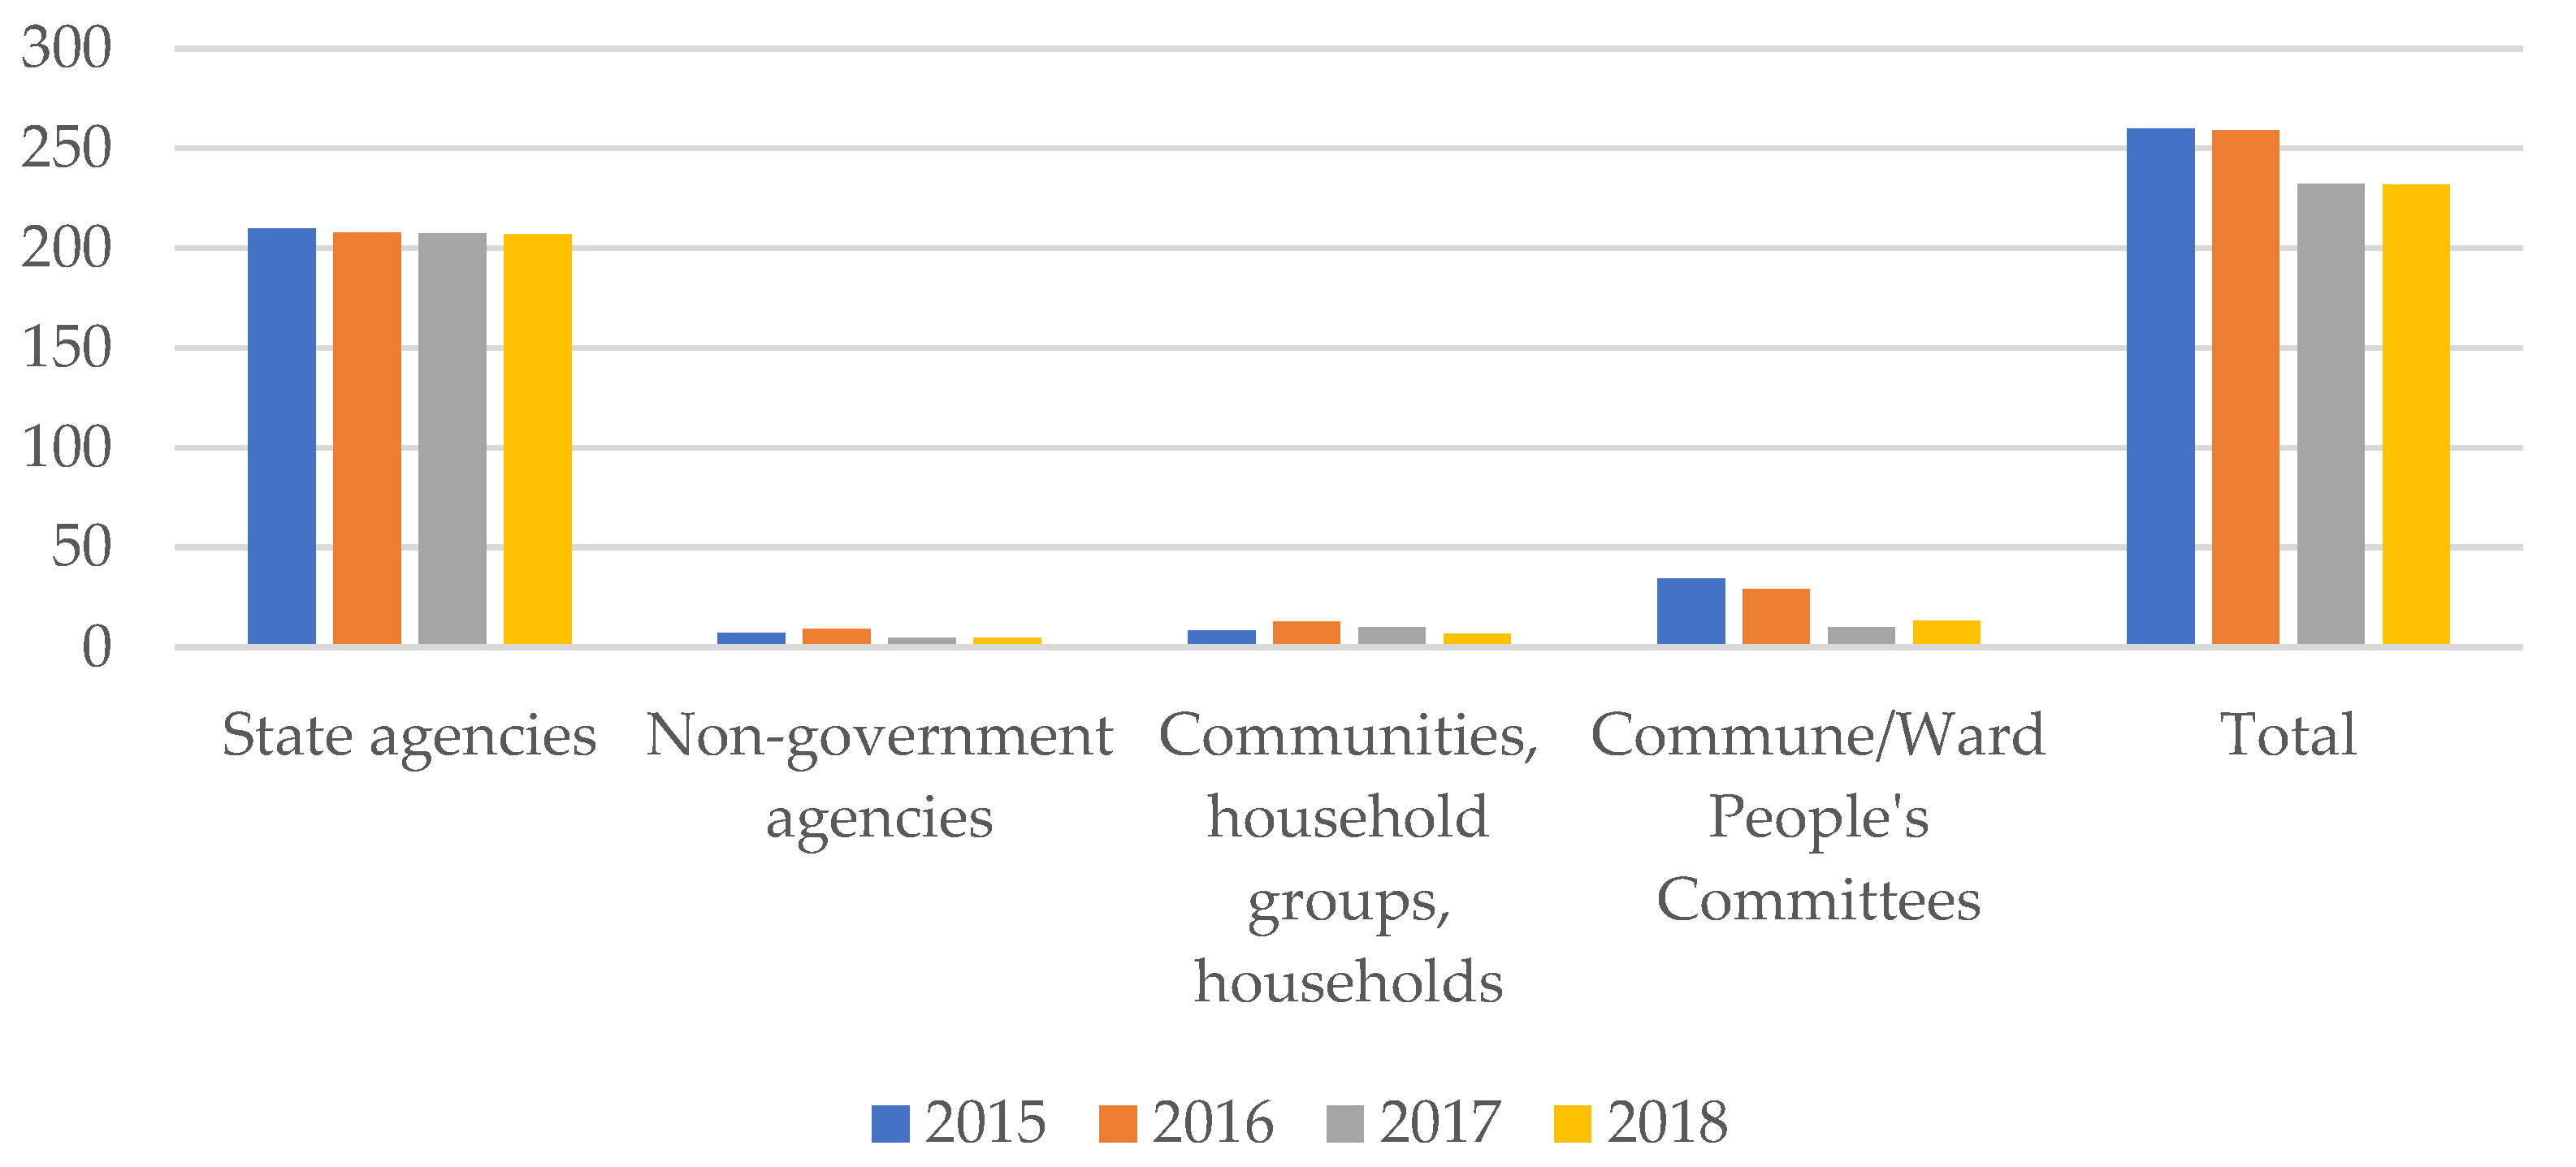
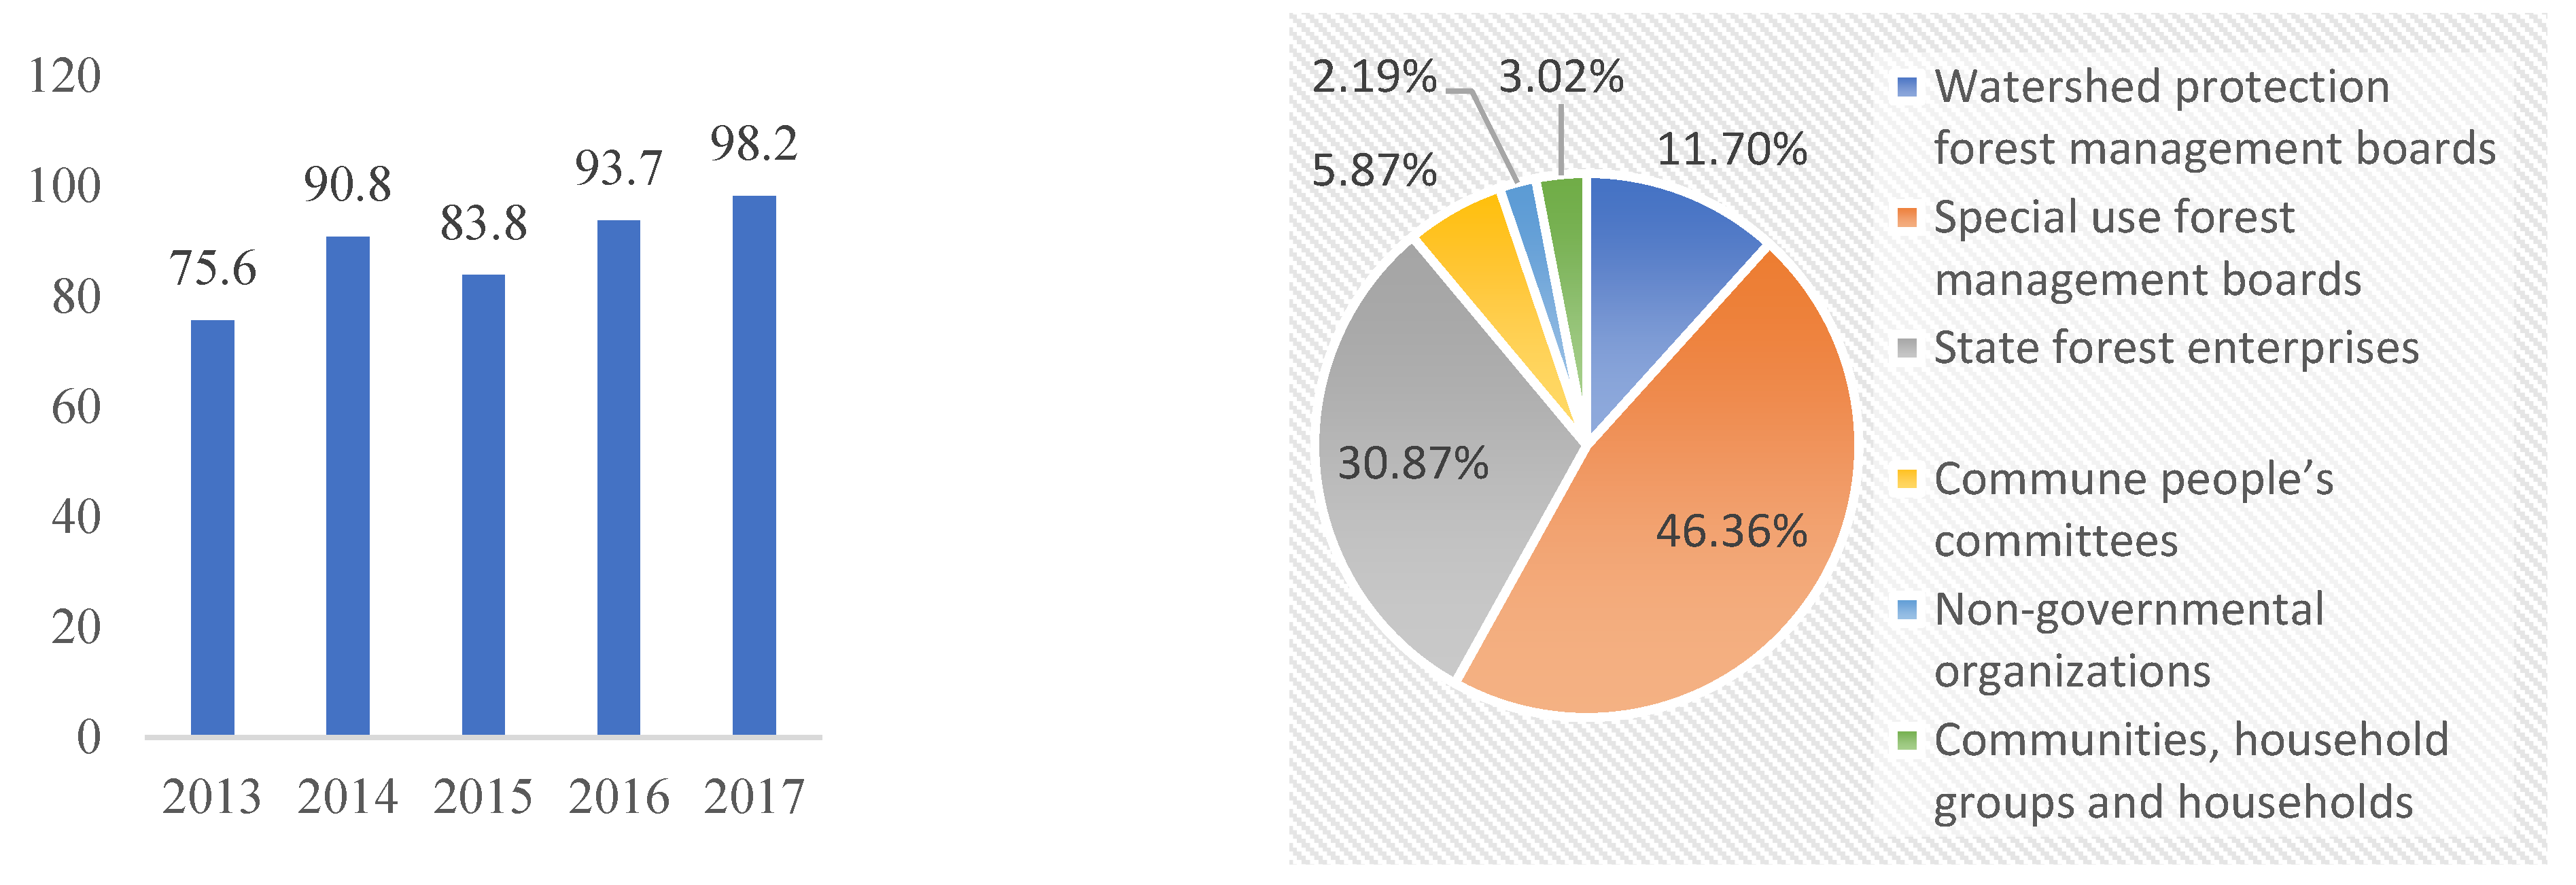
3.1.2. Environmental Services Providers in Dak Lak

More than 170 forest owner environmental service providers receive PFES payments. In 2018, nearly 90% of the paid forest area (approximately 207,000 ha) was managed by state agencies such as national parks, protection forest management boards and state forest enterprises. Only 10% of the paid forest area was managed by local communities, households or commune people’s committees, with communities and household groups managing, protecting and receiving PFES payments for around 6610 ha (2.11%) and commune people’s committees managing 13,040 ha of paid forest (5.69%) (Figure 2).

3.1.3. How PFES Payments Are Collected and Distributed

The Provincial People’s Committee determines levels of PFES payments each year. These are determined by amounts collected in payments from environmental service users, the size of forest area currently under PFES, and the size and quality of forest managed by each forest manager. Payment rates vary between catchments and years depending on the amounts of PFES revenue collected (Table 4). In 2015, as the Dak Lak Provincial People’s Committee approved the use of outstanding PFES balances from previous years to increase the payment rate for forest owners, the payment rate in 2015 was higher than in other years. In 2016, Decree 147/2016/ND-CP on amending Decree 99/2010/ND-CP on the Payment of Forest Environment Services Policy stipulated increases in the fees charged to ecosystem service users from VND 20 to VND 36 per kWh for hydropower plants and VND 40 to VND 52 per m3 for water plants. As a result, revenues from PFES were higher in 2017 and 2018, leading to people receiving higher payments.
The Dak Lak FPDF collected total PFES revenue of VND 356 billion in the period from 2013–2018, with 2018 seeing the highest revenue at VND 84 billion, and 2015 the lowest at VND 47 billion.
Total disbursement of PFES revenue in 2013–2018 was VND 316 billion for three main purposes: payment for forest owners and ecosystem service providers, Dak Lak FPDF management costs and scattered tree planting (Table 5). Payments to forest owners accounted for 90% of total expenditure—in the case of individual forest owners, to cover management costs, and in the case of state agencies, to cover the costs of contracting people to protect forests.
Total payments to forest owners reached their highest level in 2018 at VND 69 billion, compared with VND 28 billion in 2013. PFES revenue disbursement rates went up every year, from 75.6% in 2013 to 98.2% in 2018. Forest owners received average annual payments of around VND 41 billion. State agencies again accounted for the largest share of payments. In 2018, 46.36% of PFES payments were made to national park management boards, with 30.87% paid to state forest enterprises and protection forest management boards. Only 3.2% was paid to communities, household groups and individual households (Figure 3).

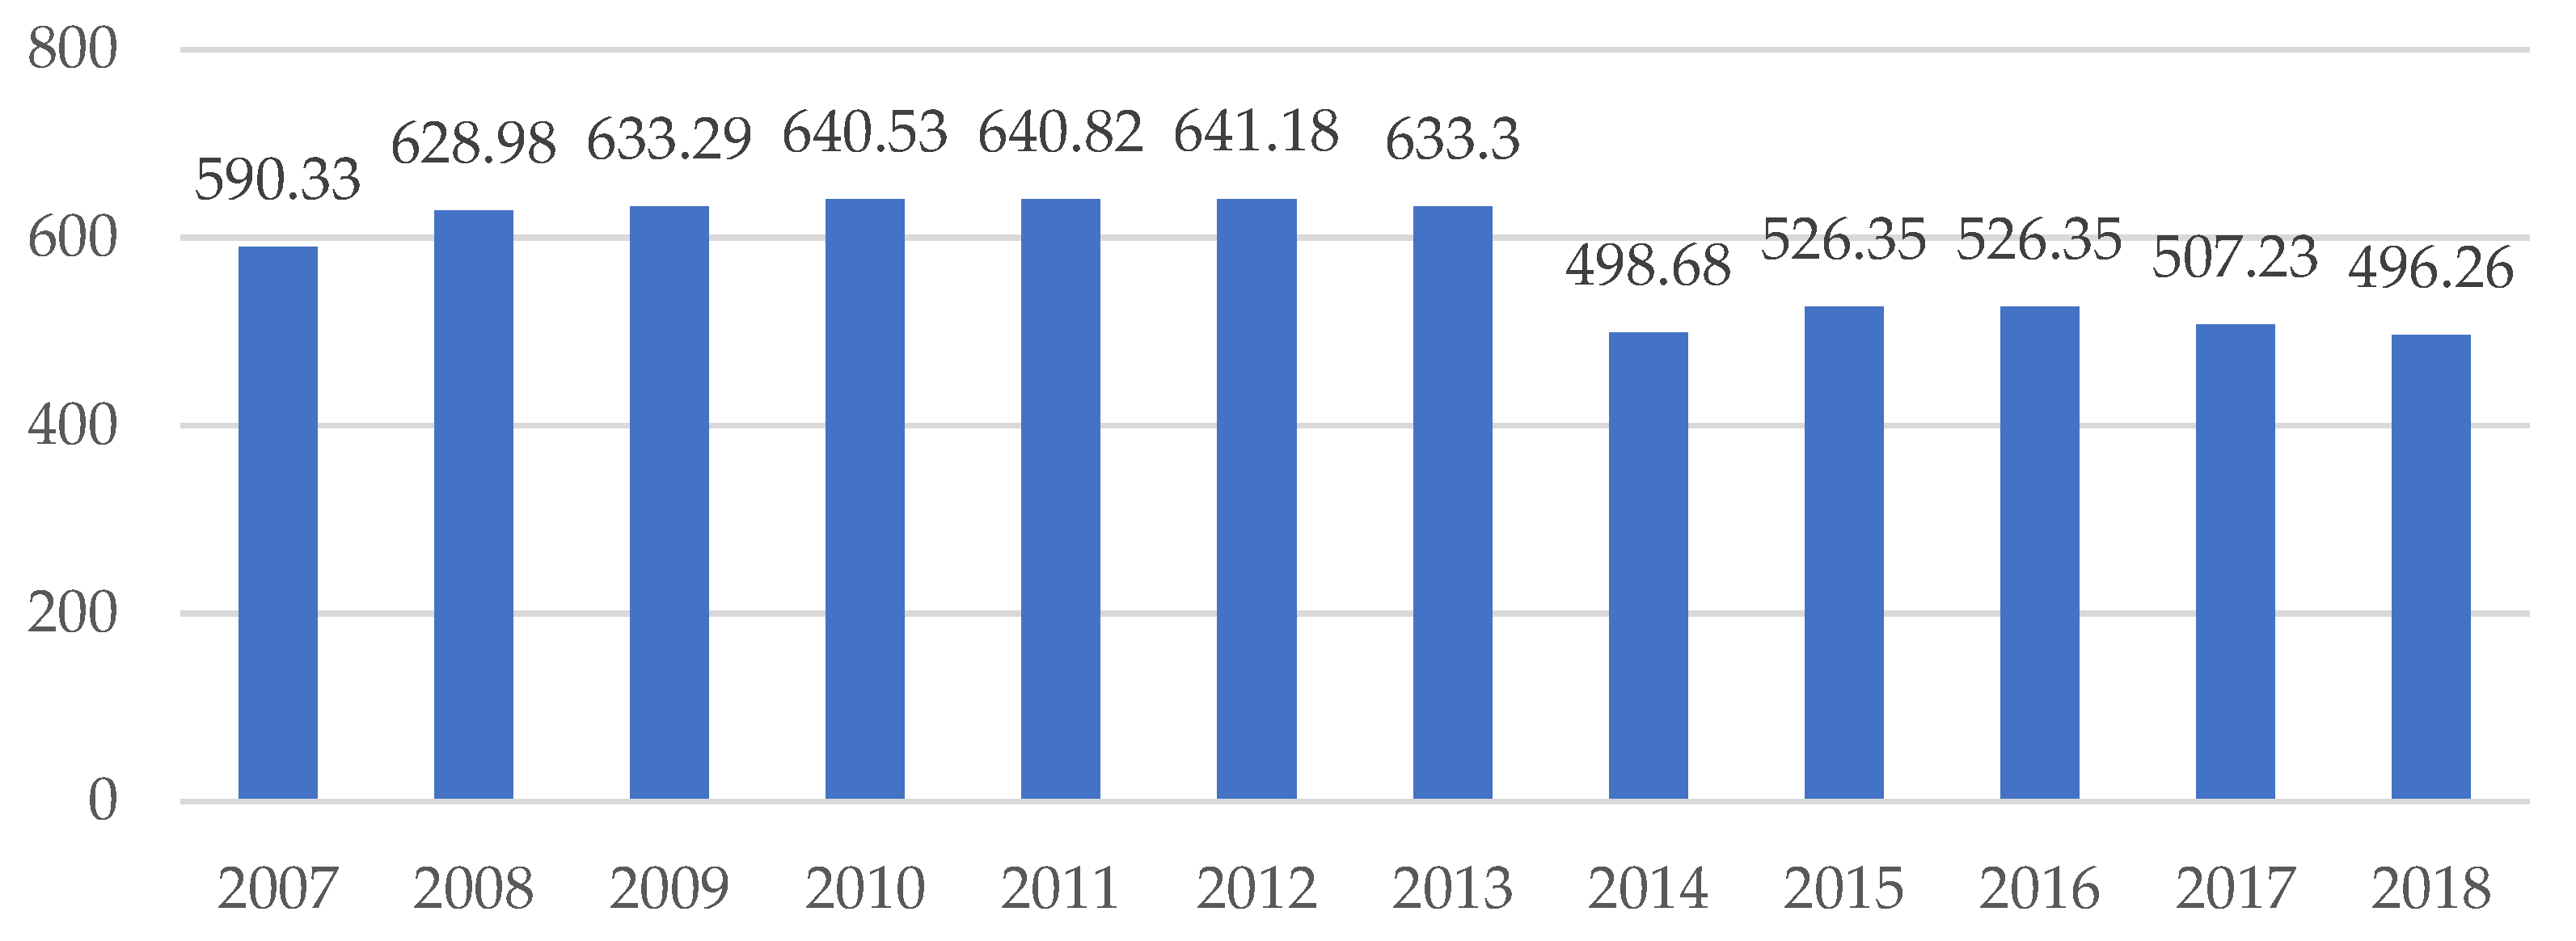
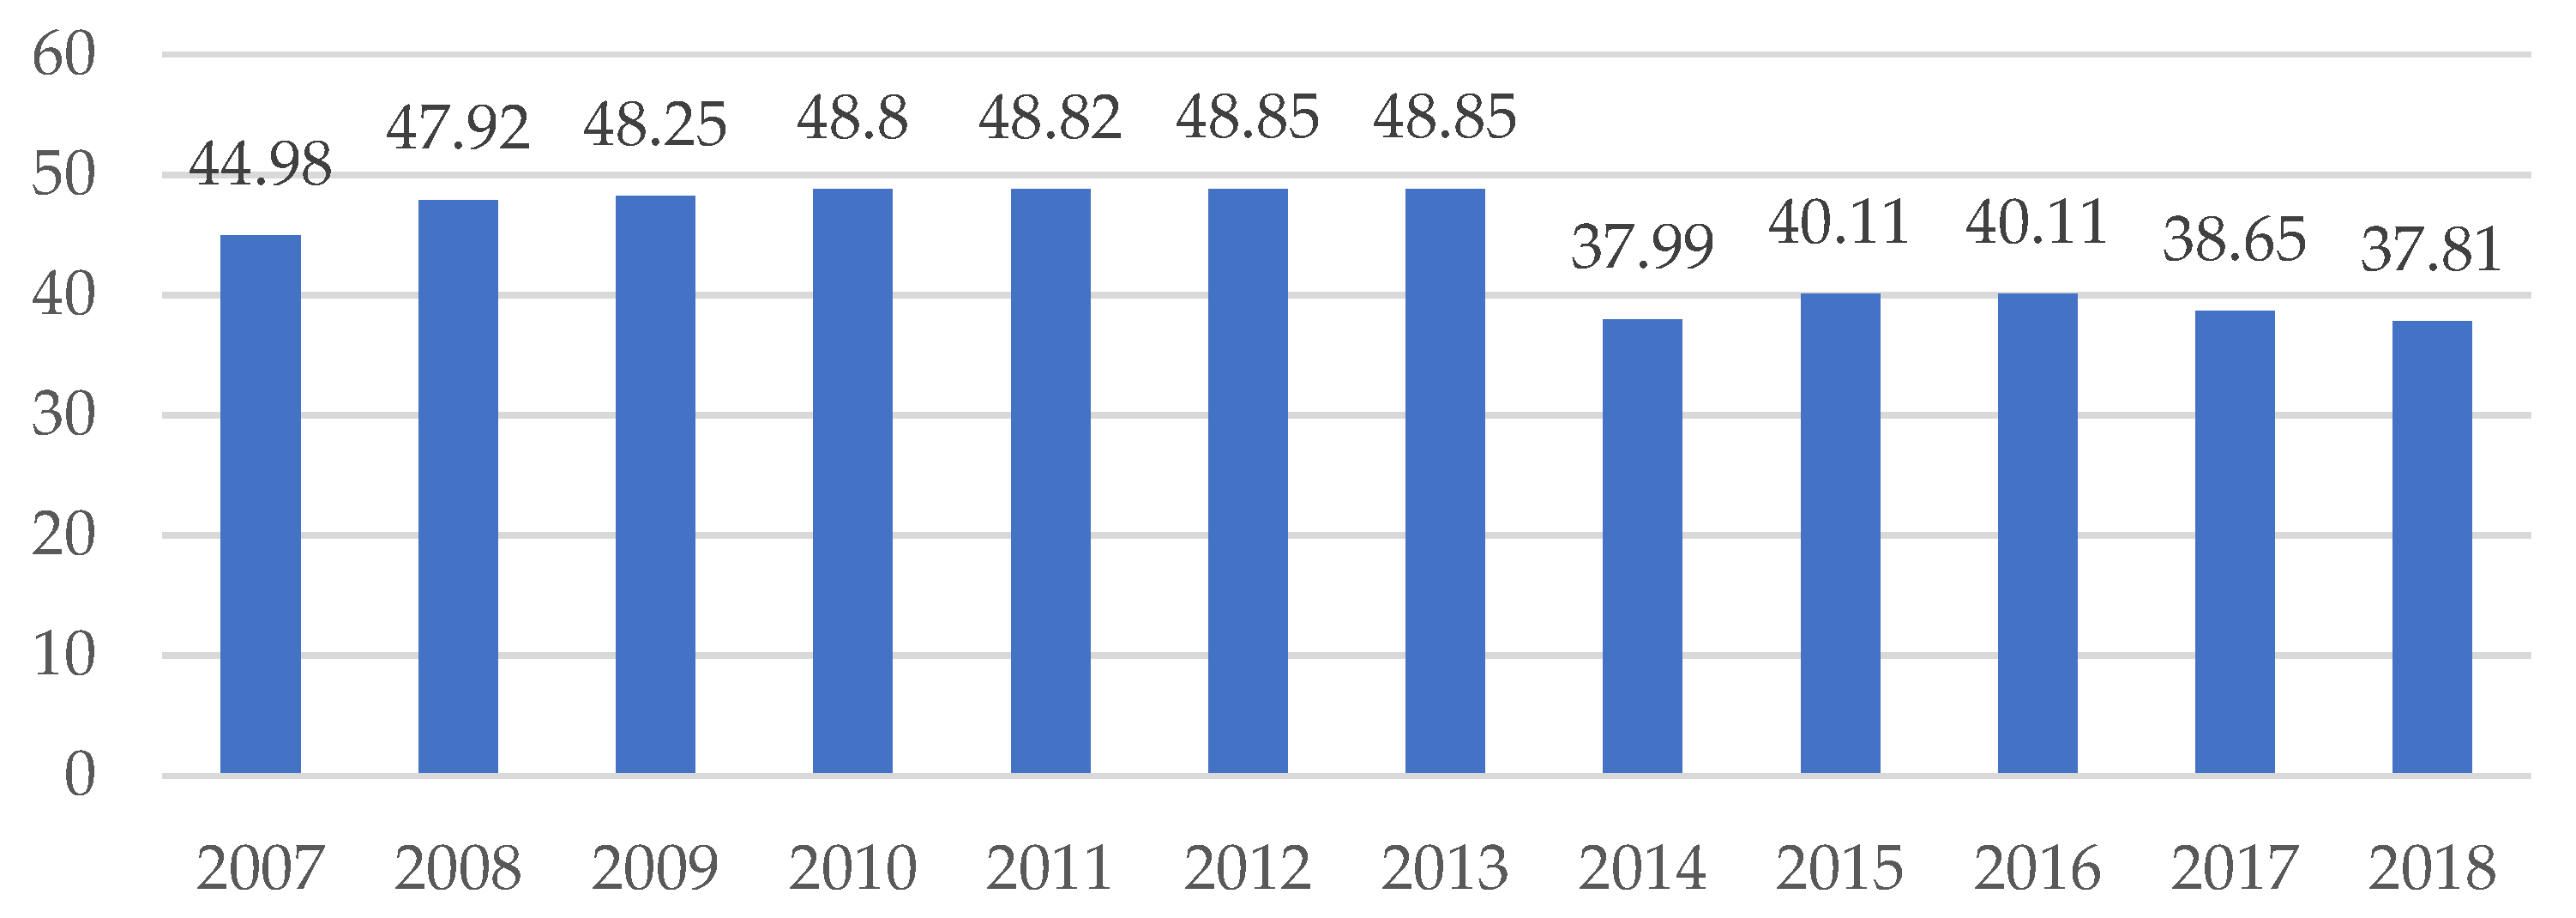
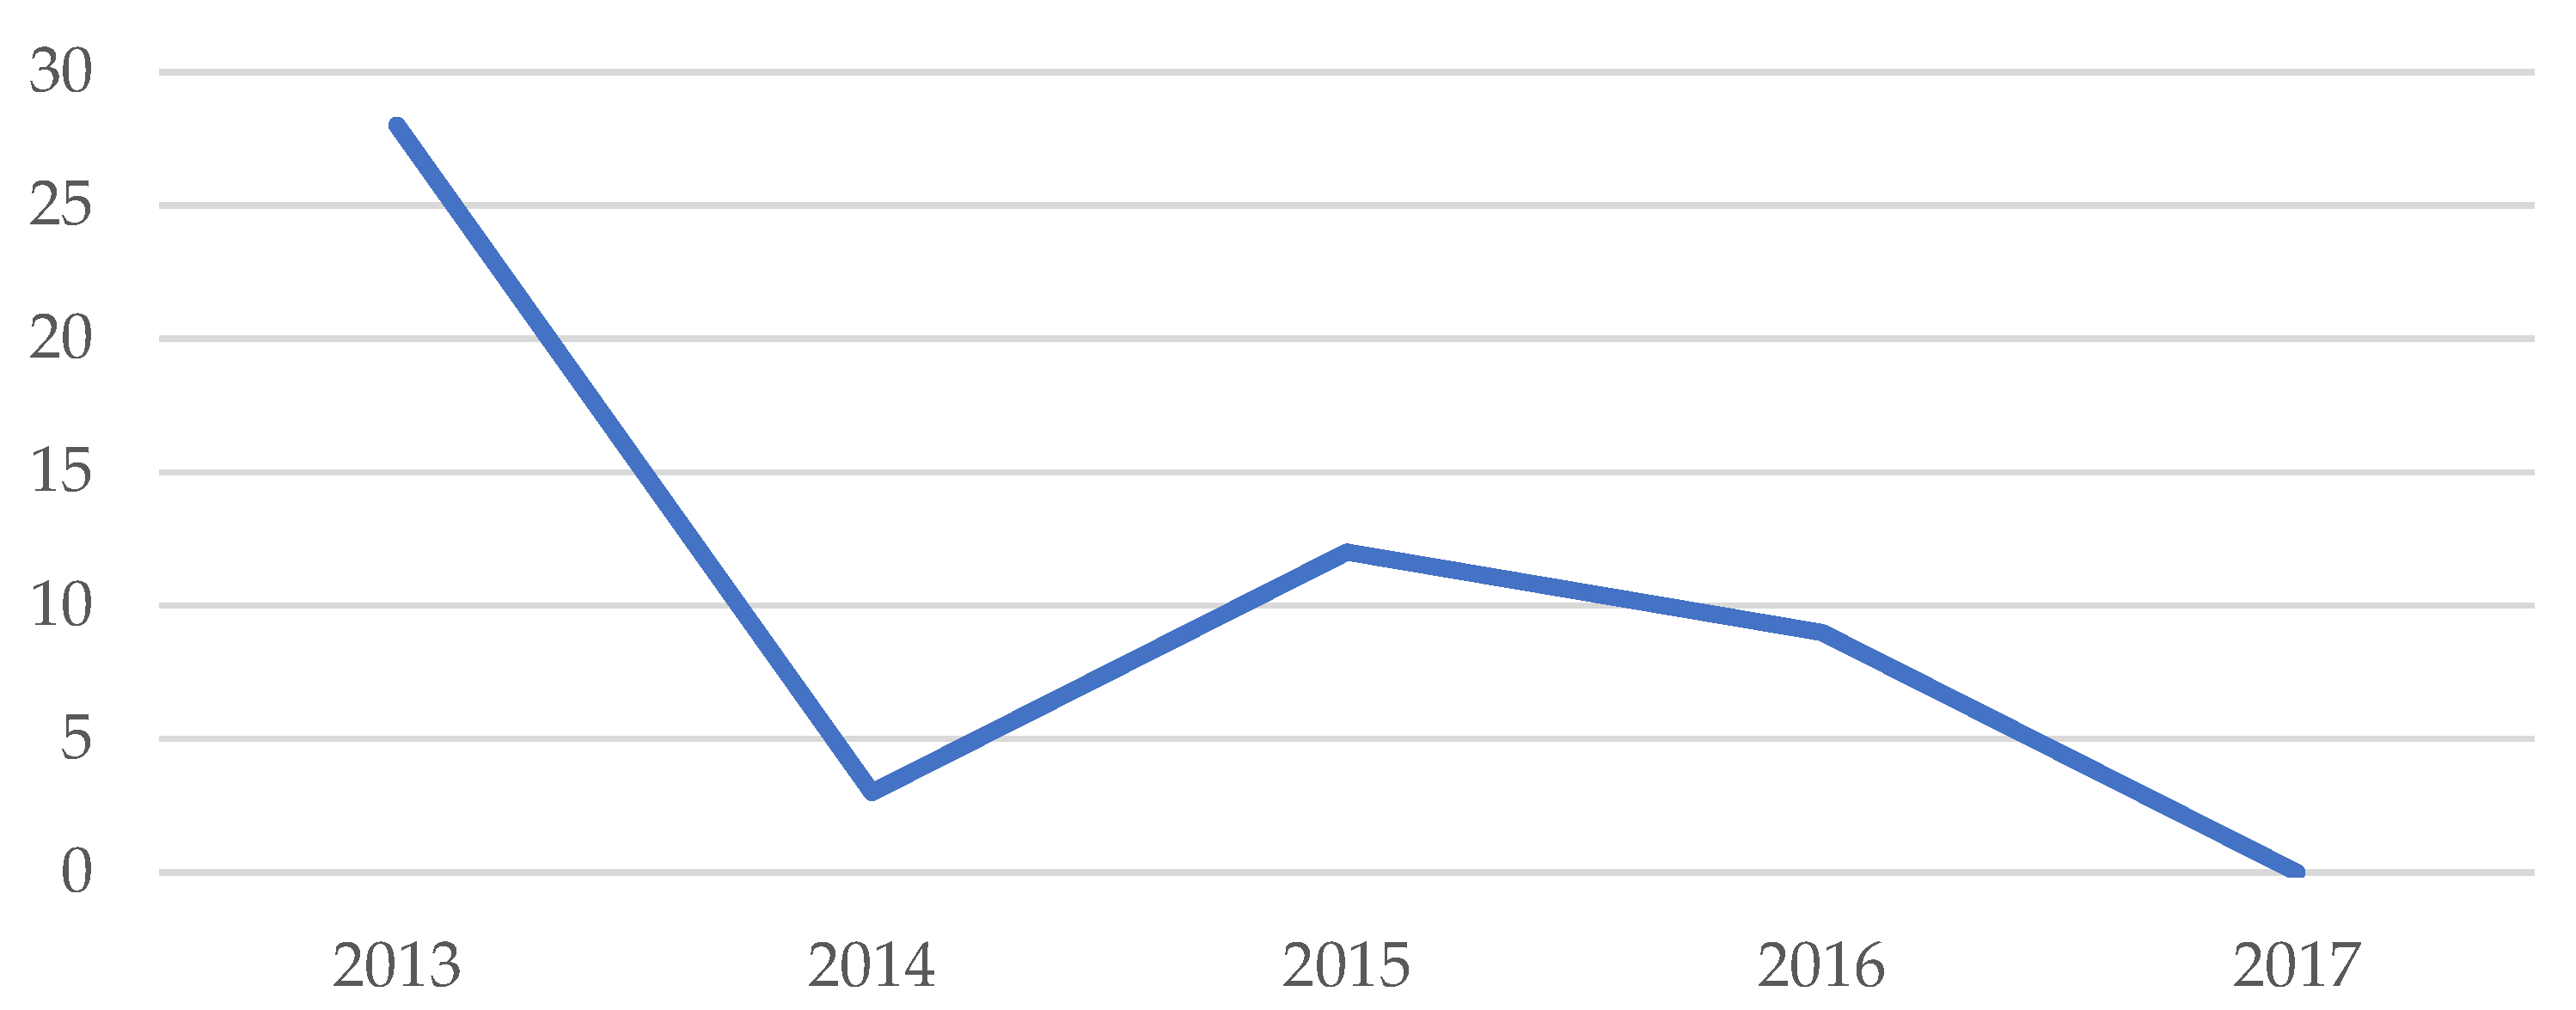
3.2. PFES Impacts on Forest Area Change in Dak Lak Province and Study Districts

As the primary objective of PFES is to improve forest quality and quantity, while the level of payment and financial benefits each environmental services provider obtains from PFES depends on the area of forest they have successfully managed. The Government of Vietnam currently uses forest area as the main criteria to assess PFES impacts [39].
Prior to PFES, the Government of Vietnam issued many policies to prevent loss of natural forests in the Central Highlands region, including Dak Lak, such as land-use allocation, contracting forestland to individuals, investments in plantation development and a ban in the 1990s on the export of logs and lumber. Following PFES, in 2016, another national logging ban was issued, but forest encroachment still persists following five years of implementation [66].
In 2018, the total area of forest receiving PFES payments was nearly 232,000 ha, with the province accounting for 44.5% of these. Paid forest comprised special use forest at 36.7%, watershed protection forest at 32.2% and production forest at 31.1%. Most local authorities and village heads claimed PFES had helped restore forests, reduce soil erosion and protect water and biodiversity. However, 11.54% of government officials interviewed claimed these impacts had been very minor, while 15.38% said that illegal logging remains a common problem. Forest area fluctuated and was on a downward trend during the 2013–2018 period after PFES was implemented (Figure 4 and Figure 5).
There was a considerable decrease in forest area in 2014 compared to 2013, with a 21% decrease from 633,330 ha to 498,660 ha. Though there was a slight increase in total forest area from 2015–2016, it decreased again from 2017–2018. For the five years from 2008–2012 prior to PFES being implemented, forest area increased slightly, but the five years after PFES (2014–2018) saw a significant decrease in forest area. Comparing total forest area in 2013 and 2018 shows that 137,070 ha of forest was lost during the five years after PFES, with forest cover percentage falling from 48.25% in 2013 to only 37.81% in 2018, its lowest level in the 10 years from 2008–2018. According to the Department of Agriculture and Rural Development, forest cover in the Central Highlands province of Dak Lak fell to 505,076 ha, a decrease of 10,533 ha [68].
The same trend happened in the districts where household interviews were conducted, where forest area decreased sharply in 2014, rose slightly in 2015–2016 and then decreased again in 2017–2018 (Figure 6). In the 2014–2018 period, Buôn Đôn district lost around 7000 ha of forest, while more than 10,000 ha was cut down in Krông Bông district. Only M’Drắk district saw an increase of 3200 ha in forest area in 2018 compared to 2013.
By forest type, one year after PFES, natural forest in Buôn Đôn and Krông Bông districts had fallen by more than 7000 ha each, while plantation forest area also fell by 8000 ha in M’Drắk and by more than 2000 ha in Krông Bông. Only M’Drắk district saw an increase in natural forest area (6000 ha). Three years after PFES (2016), natural forest and plantation forest area had both increased but were still lower than they had been in 2013. In 2017–2018, a downward trend reoccurred in all three districts for both natural and plantation forest.
This decline in forest area is due to several reasons. First, according to MARD Report No. 2764 in 2015 entitled ‘Changes in forest cover and timber volume in Central Highland provinces’, this decrease was due to the conversion of heavily degraded production forest into industrial crop, fruit tree and, especially, rubber plantations (35.8%) [69]. The area of natural forests was 461,300 ha, a decrease of 10,198 ha from 2016, partly due to coffee expansion [70] and illegal logging, mostly in the three study districts of Buôn Đôn, Krông Bông and M’Drắk [69].
Second, forests were also cut for infrastructure development, including hydropower plant construction, irrigation development and agriculture cultivation, as well as for construction of industrial zones, roads and other infrastructure in line with the provincial socio-economic development plan, without compensatory afforestation or careful environmental impact assessments. Despite supplying only small amounts of electricity, several hydropower plants were approved for construction, even when they encroached directly on national parks. The Ea K’Tuor Hydropower plant, for instance, can only supply 5 MW of electricity, but destroyed five hectares of forest in the core zone of Chư Yang Sin National Park [71]. Moreover, in plantation areas, people harvested timber after one rotation without replanting.
Third, shifting agriculture, households encroaching on forest and weak monitoring and law enforcement also attributed to the loss of natural forest [72]. Population growth and migration have created pressures on natural resources and social burdens on the province.
Fourth, the government agencies we interviewed saw natural factors such as forest fires and landslides as key drivers of deforestation, with illegal logging also seen as a major cause [73]. However, the number of forest fires has declined over time (Figure 7).
Between 2013–2017, 829 violations were recorded, comprising 608 cases of forest cutting and 169 cases of illegal logging and transportation [60]. Such violations resulted in the loss of 213.37 ha of forest and 302.3 m3 of timber. The number of violation cases was highest in 2014, with 194 cases of forest clearing and 37 cases of illegal logging and transporting of forest products. The number of cases decreased gradually after 2015, with 2017 seeing the lowest number of violations at 116 cases. This reduction might have been due to an increase in awareness raising and communication activities, and PFES payments inspiring forest owners to engage in forest protection.
However, numbers of violations have increased again more recently. In 2021, the province’s economic police reported detecting 248 cases of illegal deforestation and forest product trading in 2020, with prosecutions in 41 cases involving 134 defendants, and more cases of large-scale deforestation still under investigation [74]. Similarly, inside the natural forest plot managed by the company Krông Bông Forestry Ltd., 414 cases of large-scale illegal logging caused 108 ha of forest loss. Around 80% of these cases involved local people expanding farmland. Estimates indicate that around 4100 households in Dak Lak province had cleared forest for agriculture, and this trend is on the increase. Individually, these encroached-upon patches of forest are disbursed, appear like natural forest and are too small to be the subject of criminal prosecution [66].

3.3. PFES Impacts at the Village and Household Levels
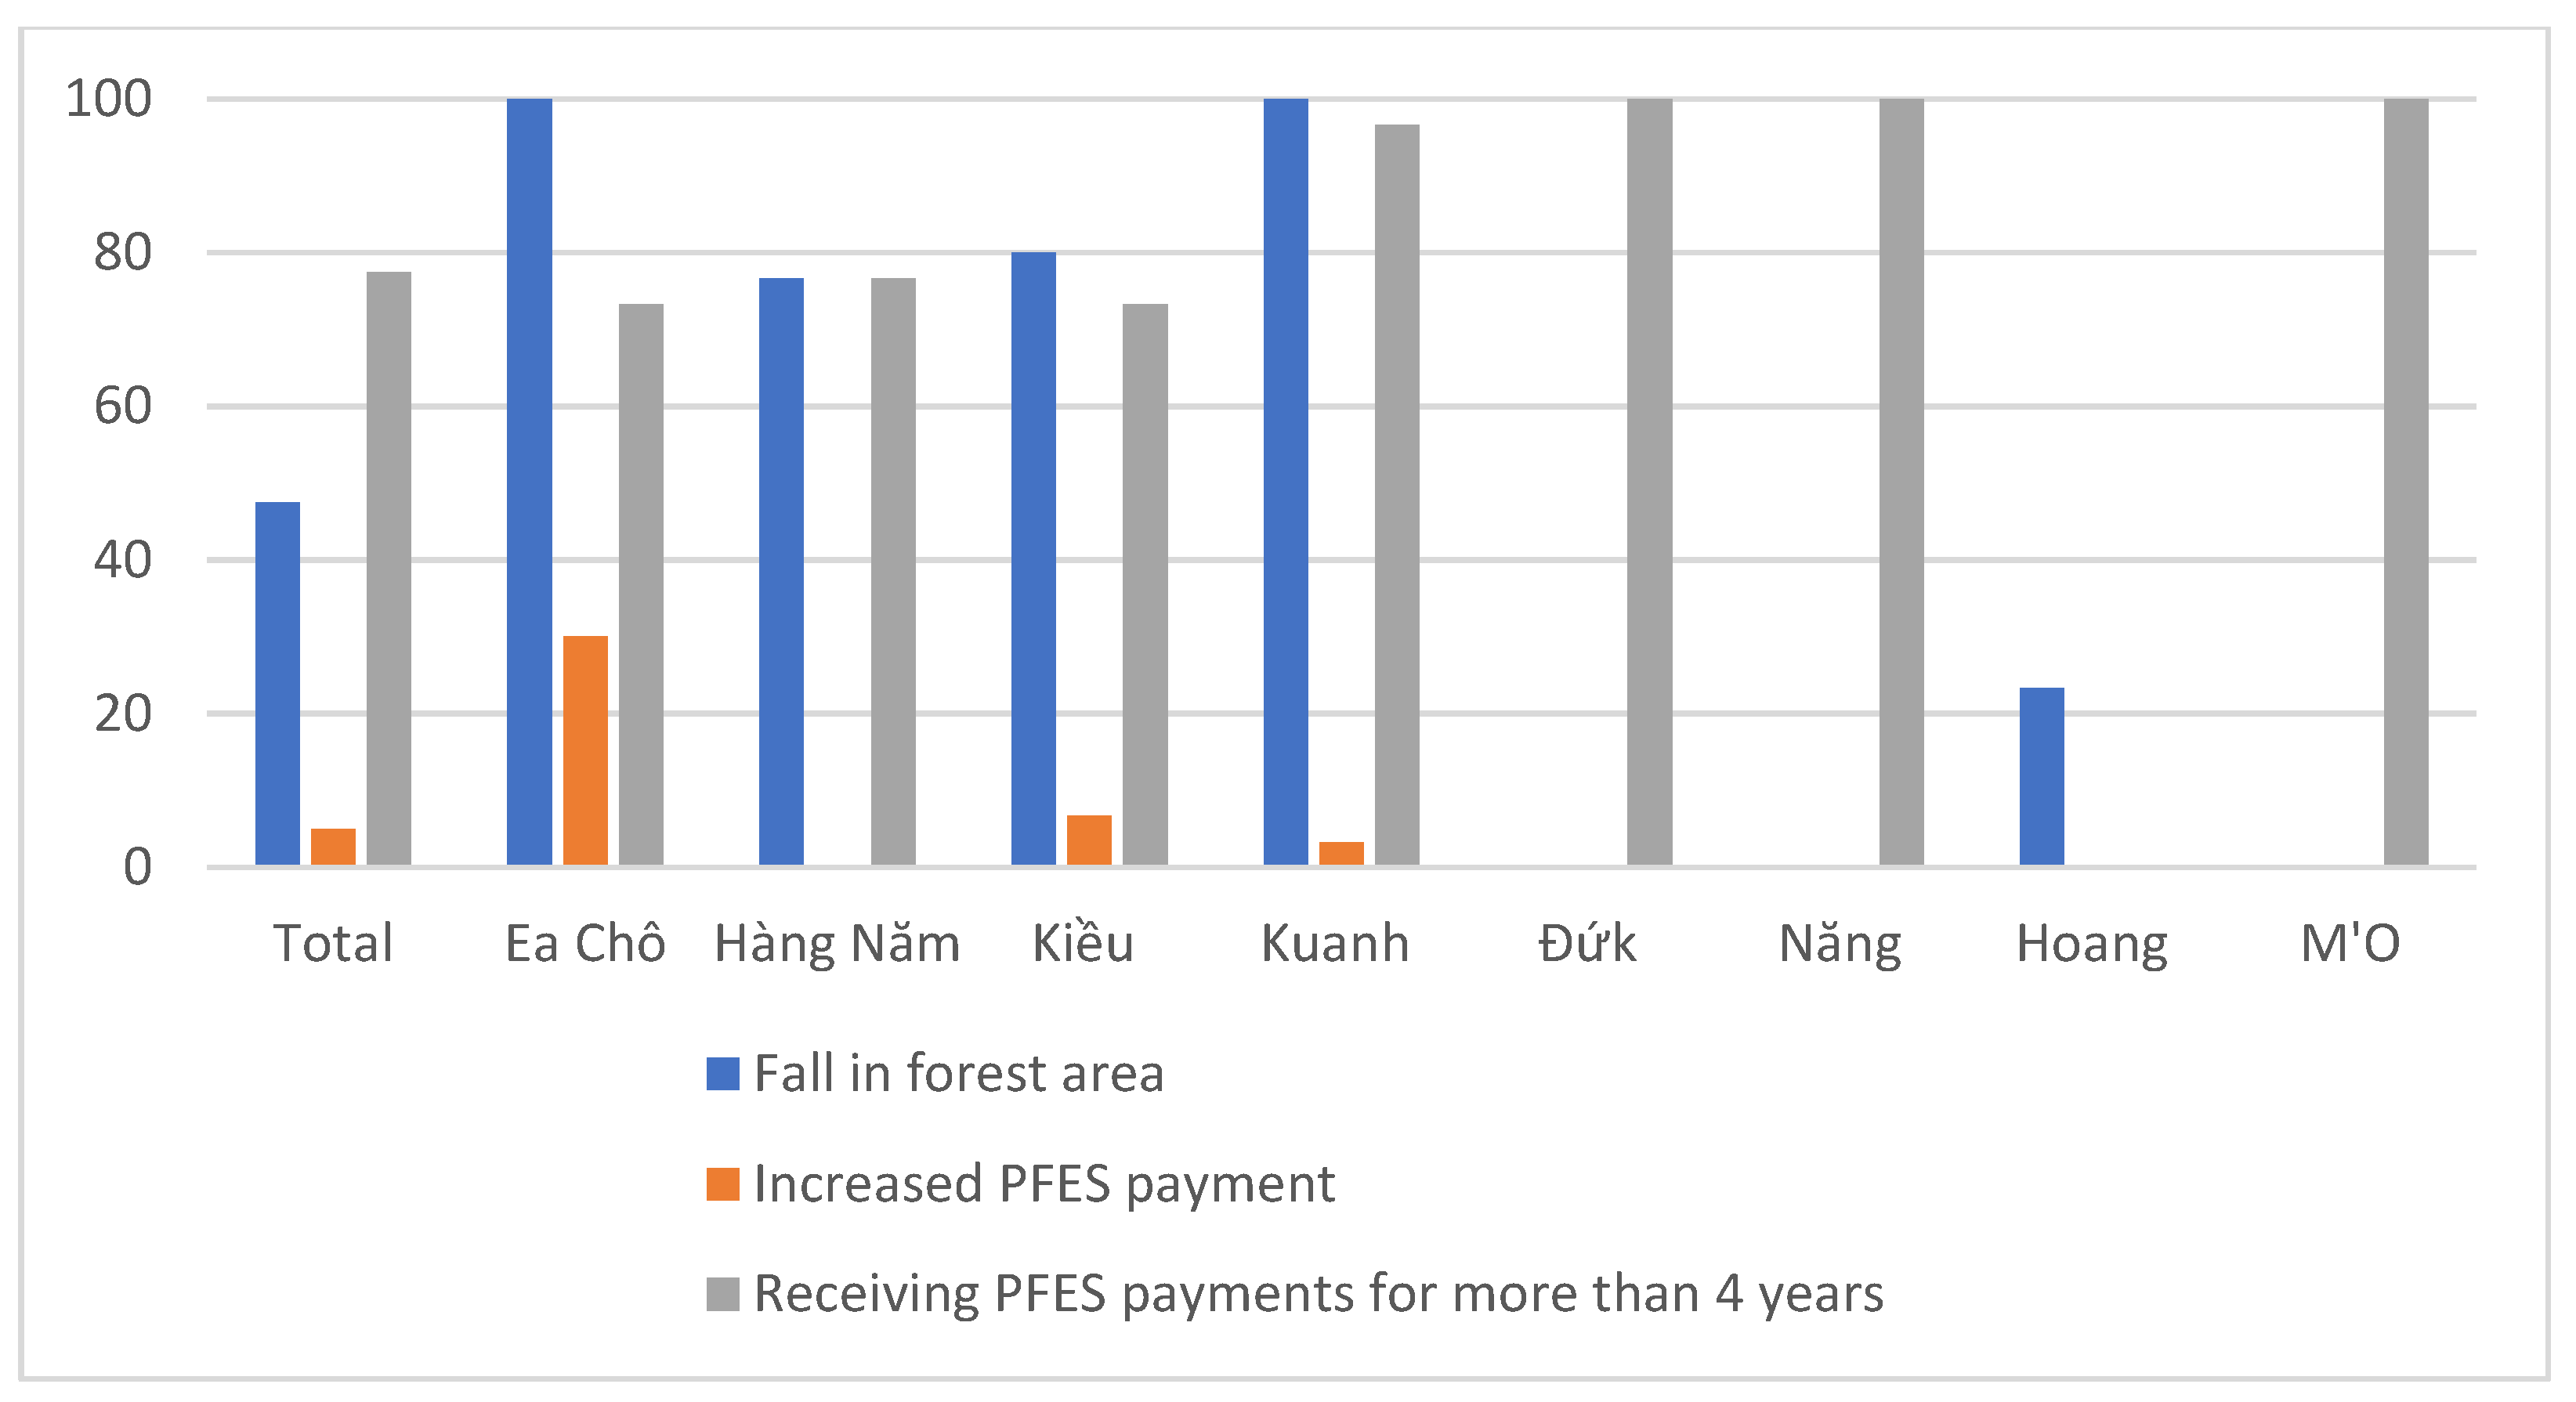
According to interviewed government officials, PFES effectiveness can be measured at the household level by increases in forest area and by the PFES payments households have received over a four-year period. When forests are well protected, households continue to receive PFES payments. Another measure is the number of days per year people spend patrolling forests to reduce encroachment.

3.3.1. Forest Area

Most households in PFES study villages are contracted to protect forest by the Chu Yang Sin national park, Nui Vong Phu forest management boards and commune people’s committees. Local communities and households were only paid directly by PFES programs in three of the eight villages. Forest area under these PFES schemes remained the same in 2017 and 2018 (Table 6).
In PFES sites, 90% of people interviewed in Krông Bông district and 85% in M’Drak district said that forest had improved following PFES. In Buôn Đôn district, though PFES was not implemented, 70% of interviewees still assumed that PFES would help improve the forest. However, the percentages of households saying they had encroached on forests after PFES were 3.75% in PFES sites and only 3.33% in non-PFES sites. Households claimed to have encroached on relatively small areas in both PFES and non-PFES sites, at 0.51 ha and 0.5 ha, respectively. While 100% of households encroaching on forests in PFES sites claimed they needed to expand their farming land, in non-PFES sites, 62.5% claimed they encroached on forests for agriculture production and 37.5% for planting new plantation forest. According to one key informant, the market, price and demand for acacia have increased in recent years, and despite government agencies launching different programs on forest protection, local people have tended to clear forest to grow acacia.

3.3.2. PFES Payment Stability

PFES contributes 6–18% of household earnings in PFES villages (Table 7). Most interviewees said these payments have incentivized them to protect forests. Table 7 also shows PFES payments being higher than payments from government programs in non-PFES sites.
Prior to PFES, people were paid only VND 50,000/ha, and so had little incentive to patrol or plant forests. In 2018, Dak Lak FPDF planned to pay community, household group and individual household forest owners a total of around VND 1.9 billion at a payment rate of VND 300,000/ha/year. Of this amount, more than VND 646 million was paid to 11 communities, with each community receiving an average of more than VND 60 million/year. The remaining amount was paid to household group and individual household forest owners, with each household receiving at least VND 2.5 million from PFES for forest protection in addition to income from selling NTFPs such as bamboo shoots, rattan, etc.
Although 77.5% of surveyed households in PFES sites received continuous PFES payments, 47.5% of households had forest area under PFES contracts reduced over time, while PFES payments only increased for 5% of households. This indicates that forests have neither been protected nor increased in area in line with local government expectations (Figure 8).

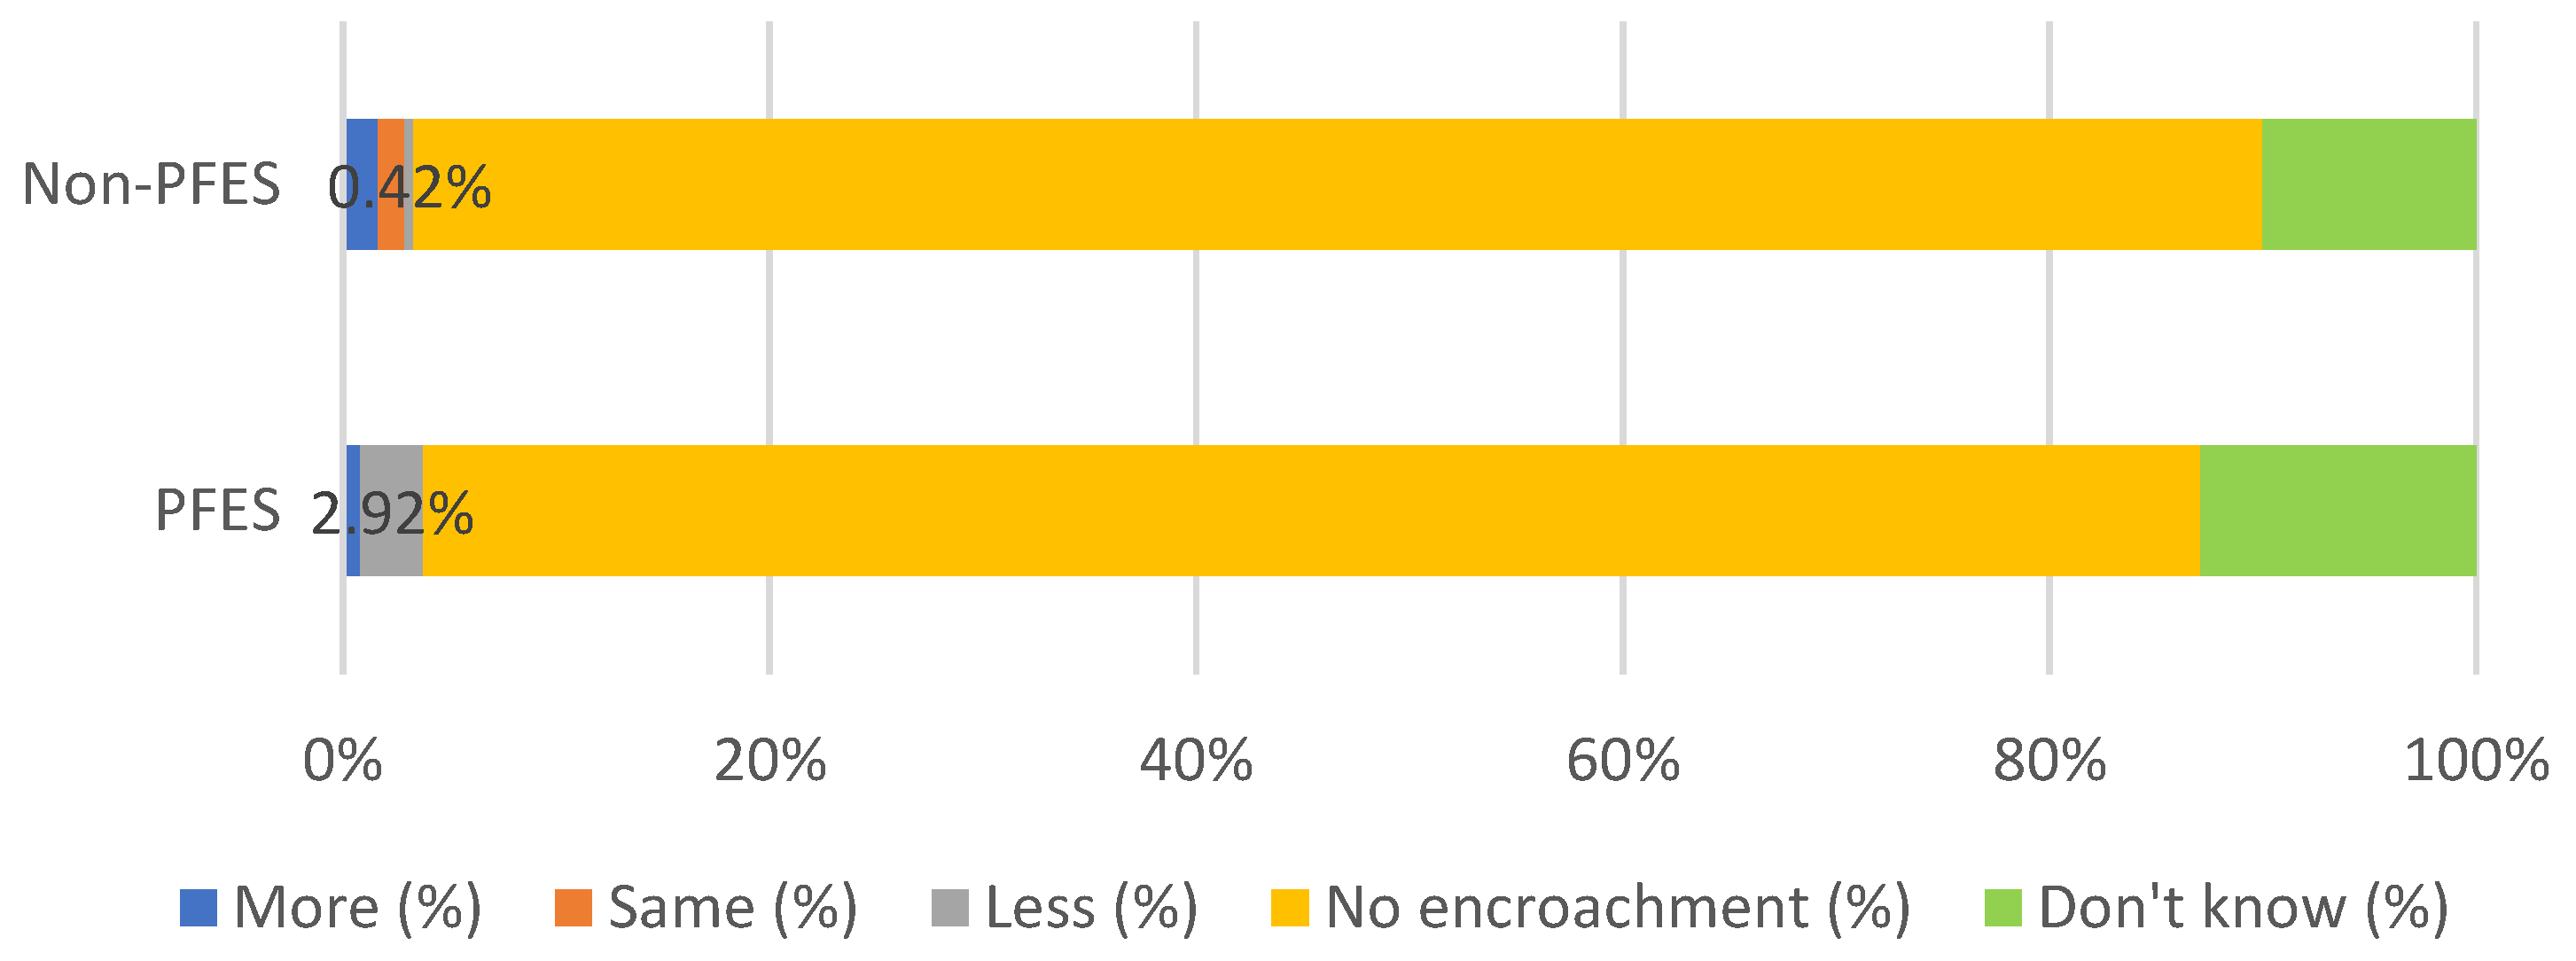
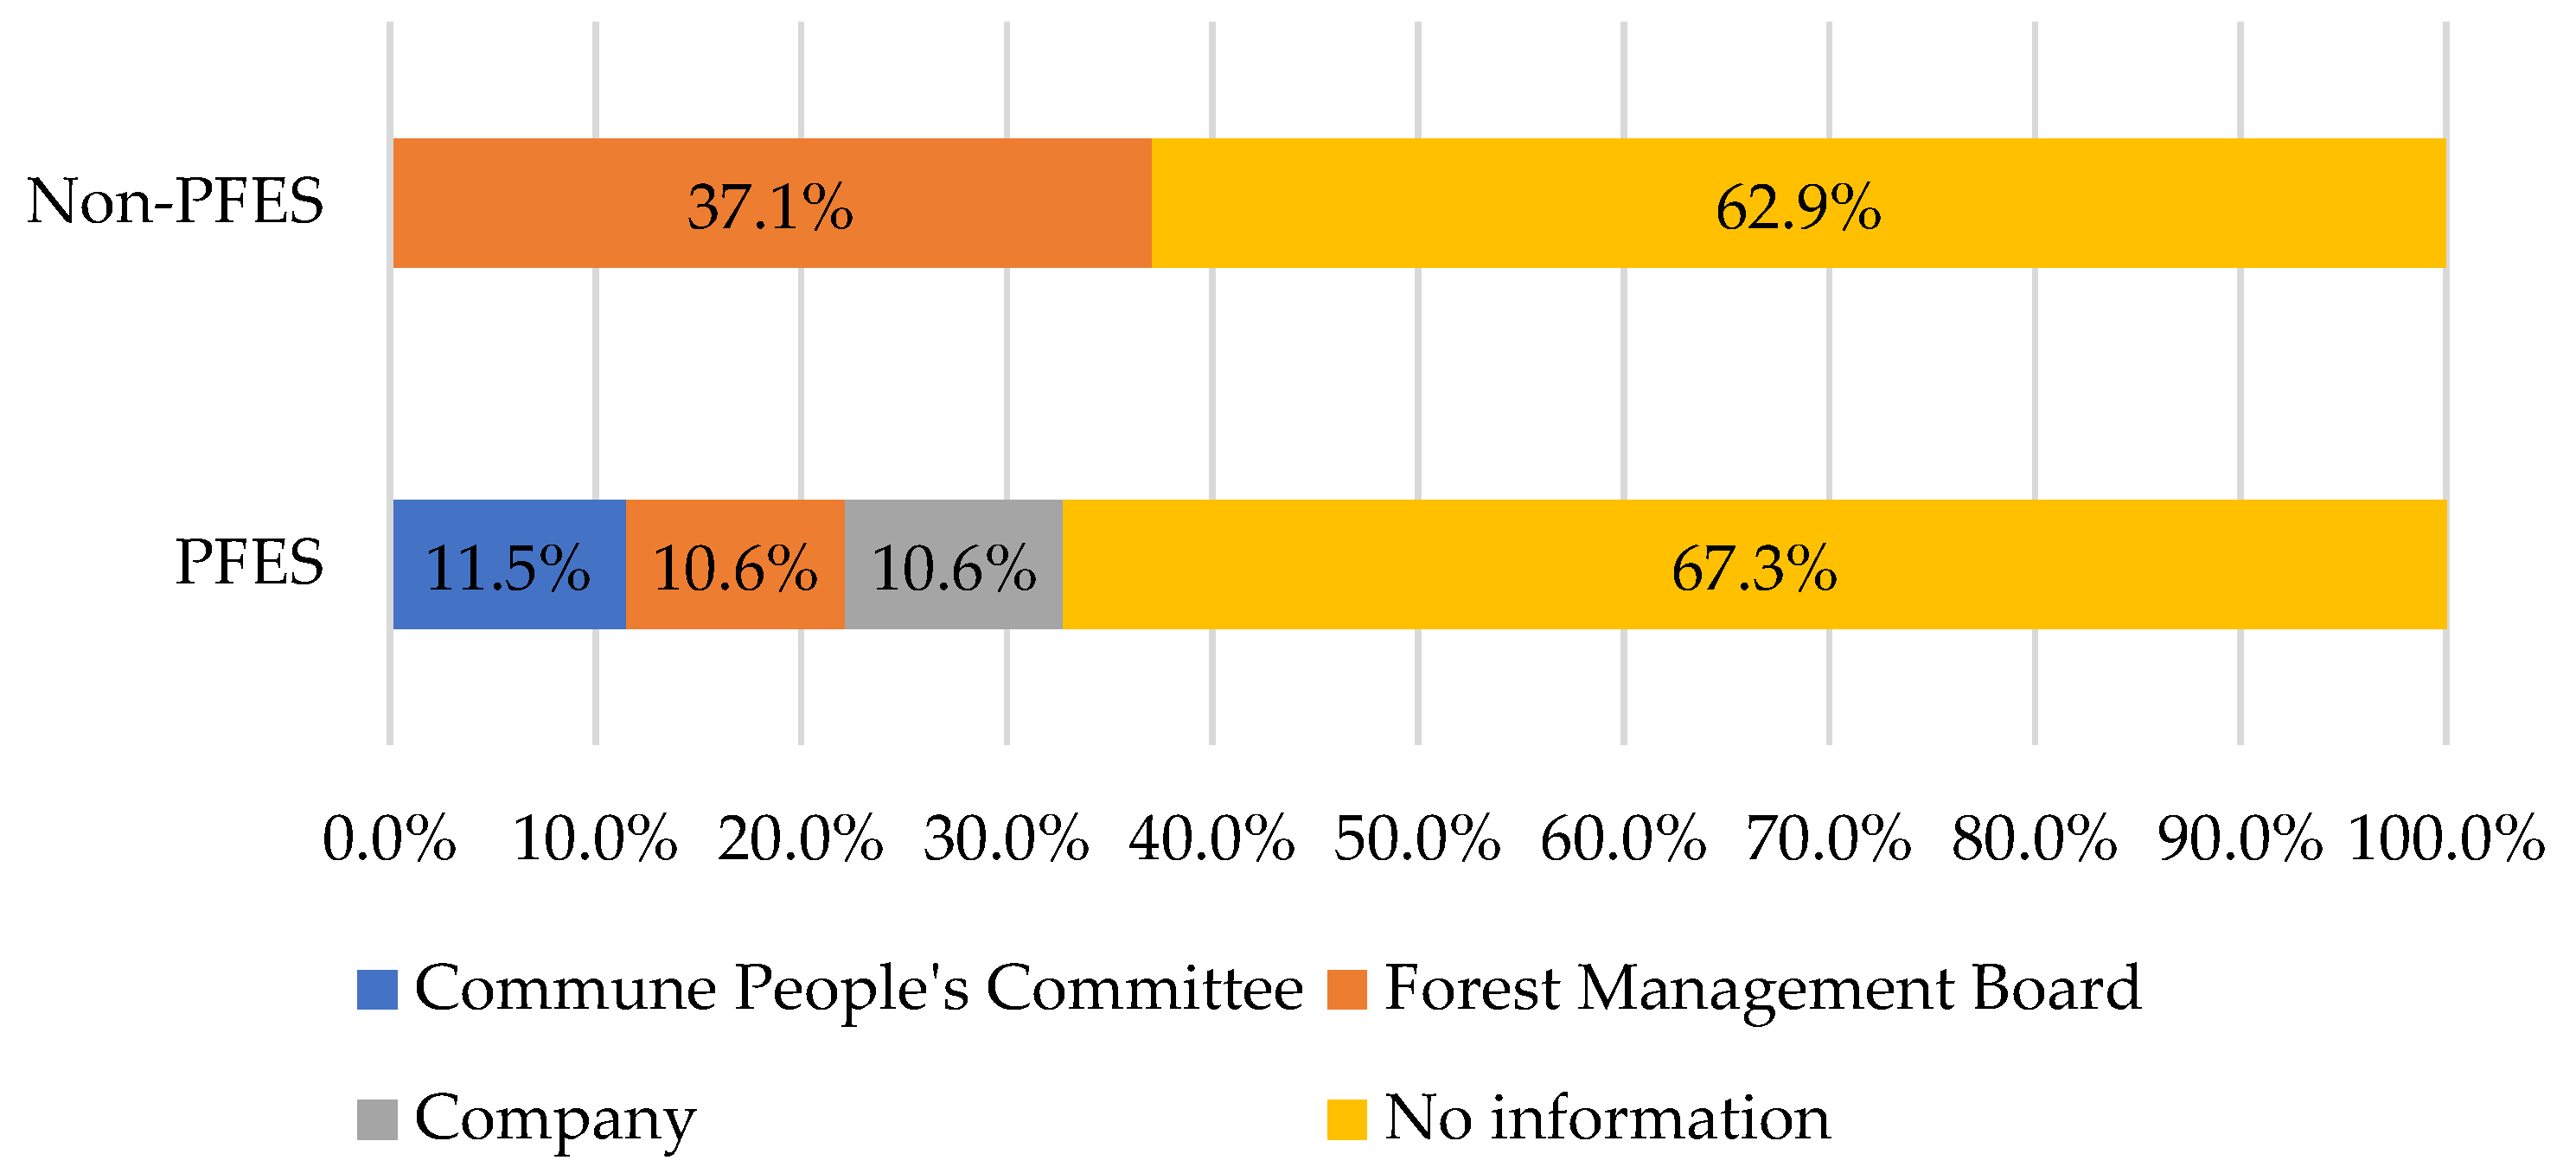
3.3.3. Numbers of Days per Year Spent Patrolling Forests to Reduce Encroachment

Table 8 shows that for the first four village pairs in M’Drak district, PFES has helped encourage households to patrol forests. In non-PFES sites, no villagers patrolled forests. However, for three of four village pairs where forest protection payments were received in non-PFES villages located in national park buffer zones, villagers spent more time patrolling forest compared to villagers in PFES sites.
Villagers feel that although spending more time patrolling reduces encroachment, it does still occur. Encroachment is defined as a human activity to eliminate timber and non-timber forest products, which are used illegally and without government permission [75]. In Krông Bông district, almost all cases of encroachment were on primary forest, while in M’Drắk, people encroached on different types of forest, from primary to bamboo forest. In villages without PFES, several households said they had cut down primary forest and converted it for crops. When asked to compare the extent of forest encroachment before and after PFES, more people in villages without PFES than in villages with PFES said they cut more forest after PFES. However, the difference was not significant, at 2.50% in villages without PFES and 1.67% in villages with PFES. Meanwhile, the number of households claiming they had encroached on forests less after PFES was seven times higher in PFES than in non-PFES sites (Figure 9).
Figure 10 shows natural forests still being encroached upon after PFES, although the percentage of those encroaching on natural forests (55%) was lower in PFES sites than non-PFES sites (75%).
More than 60% of households encroaching on forest were unaware of who managed the land they encroached upon, while 35.42% said it belonged to forest management boards, 8.33% thought it was under company management, and 4.11% said it belonged to commune people’s committees.
Most interviewed government officials said people encroaching on forests to collect non-timber forest products (NTFPs), such as mushrooms and bamboo shoots for their daily needs and to sell to local markets for additional income, put high pressure on forests in both PFES and non-PFES sites, but due to strengthened law enforcement in PFES sites, encroachment on natural forest is lower than in non-PFES sites where people are not offered PFES payments.
Local stakeholders also identified several issues currently limiting the policy.
First, service providers are paid to conduct patrols and take other measures to protect the forest, but community-led patrolling is challenging. The payments people receive are deemed too low for the time and effort they expend traversing harsh craggy mountains. Villagers are not properly equipped with uniforms, personal protective equipment or other facilities. Crucially, they have no power to address any violations they encounter. Violators are increasingly aggressive and better equipped, while community patrol teams are unable to impose fines and lack the means to protect themselves. Other issues are the different payment rates applied for different watersheds (Table 3) creating a sense of inequity, and households not following patrolling schedules and having difficulties managing timesheets. In addition, forest encroachment persists due to limited local awareness, and a greater influx of immigrants who lack land for cultivation. All interviewed government officials and village heads shared a common view on the challenges in addressing violations: an unclear legal framework on monitoring and evaluation systems and local people fighting for the right to access timber for building traditional houses. The fragmented and remote nature of forests makes their protection even more challenging.
Second, government officials and village heads highlighted issues affecting effective PFES implementation: low PFES payments, late PFES payments and payments through bank accounts not being feasible for communities living in remote areas, as collecting them becomes too costly. Most villagers interviewed claimed that the level of PFES payment is low and cannot compete with other land uses such as coffee production. Most villagers surveyed said that annual incomes from coffee production can be 10–30 times higher than the annual PFES payments. According to the local government officials in the workshop, this results in forest area in the study sites still being put under considerable pressure. Late PFES payments are also seen by villagers as a major drawback of PFES policies. More than 90% of villagers interviewed said they received PFES payments late. Late payments not only create mistrust of government officers’ accountability in communities, but also create frustration for PFES recipients. However, the interviewed government officials said late payments were due to environmental service users’ untimely payments to the Provincial Forest Protection and Development Fund as well as the time required to validate forest areas and address land use conflicts. Moreover, in order to ensure payment transparency, the government distributes PFES payments through bank accounts, whereas most villagers said opening bank accounts is challenging for them due to language barriers and their lack of knowledge of and access to banking services and facilities. Many villagers said banks are too far from where they live, so accessing them is also problematic and expensive.

4. Discussion

Although it seems intuitive to think that paying for forest conservation would reduce deforestation, the evidence available from existing PFES programs is mixed [76]. On the one hand, income from PFES has enabled the mobilization of more personnel resources for patrolling forest and relieved a great burden on the state budget in terms of investment in forest protection and development [41]. The diversification of sources of finance for forest protection and development, including PFES, is the key to future implementation of other policies, such as Reducing Emissions from Deforestation and Forest Degradation (REDD+) in the Central Highlands region, including Dak Lak province [53].
On the other hand, the case of Dak Lak also shows PFES still facing challenges in terms of protecting forests. Our paper shows that despite the PFES program being implemented in Dak Lak province, the area of forest, and notably, natural forest, is still declining, and logging in natural forests remains a widespread problem [77,78,79,80,81,82]. In fact, PFES plays a minor role in maintaining natural forest cover in Vietnam [83]. This is also consistent with other reports highlighting natural forest in Dak Lak being cut down illegally and encroached upon while forest owners fail to take adequate measures to prevent the situation and often shift responsibility to others [84,85]. Moreover, counting per capita PFES income, the average income per person is still very modest for the effort they have to put in to protect forest effectively [86]. The payment rate of VND 150,000–300,000/ha/year for forestry enterprises to protect forests is equal to just one-fifth of the actual costs involved [84]. Moreover, the logging ban both before and after PFES has failed to reduce natural forest loss and has had negative impacts on local employment, income generation and fuelwood and timber availability [50,87]. The low levels of PFES payments have proved to be a challenge and not a viable economic incentive for implementing PFES, suggesting that PFES may only succeed in areas that have low opportunity costs [88]. It is interesting to note that while applying different payment levels is seen as an appropriate institutional setting for incentivizing local people to put more effort into forest protection [88,89] and for ensuring equitable payments (the more effort forest managers put into forests and the more buyers they can sell environmental services to, the higher the payment would be), the fact is that villagers see the differing levels of payment between watersheds as inequitable distribution of benefits. This is because the current PFES payment structure does not build on environmental service outcomes (forest area and forest quality), but rather, depends mainly on the availability and number of environmental service providers. This also reveals the complexities and diversities of how local people interpret equity, and suggests that taking shortcuts in designing and implementing PFES might fail local expectations and jeopardize compliance [88,90]. Our findings concur in part with the current narrative from government officials saying local people drive forest loss, with swidden cultivation being a root cause of the problem [91]. Though it is indeed a contributory factor as people collect NTFPs and timber for food, housing and income needs, key drivers including large-scale agriculture expansion and illegal logging are still not fully acknowledged. Previous studies show that in Dak Lak province, each household uses an average 0.5 m3 of timber and five wooden pillars (0.6 m3) per year. Relative to the growth rate of natural forest, this demand could be met fully without jeopardizing ecological systems [92]. However, significant levels of unplanned exploitation and illegal exploitation by forest loggers have caused the area of forest to decline [92]. Our paper shows that people still encroach on forests to expand their farmland and plant rubber, even when forests are managed by national park authorities, private companies and local governments. This is consistent with previous studies finding natural forests under state management tending to decrease or stagnate due to the conversion of natural forests into rubber plantations [80]. However, the scale of deforestation caused by local people—our paper shows each household encroaching on an average 0.5 ha of forest—is much lower than natural forest loss in areas managed by large-scale forest companies, which receive the second-largest share of PFES payments. Since 2020, more than 51,000 ha of forest in Dak Lak belonging to state forest enterprises (SFEs) and commune people’s committee was cut down illegally [74,93,94,95]. The fact that areas under state agency and private sector management are still being cleared shows not only weak law enforcement, but also that land-use change conflicts are still widespread in the study sites. As previous studies have shown, land tenure security is a key challenge for administrating PES programs, and without addressing this problem, implementation of PFES will be hampered [96,97,98,99,100,101,102]. Addressing unclear land tenure is essential for effective PFES implementation. Furthermore, our paper also supports previous studies showing challenges in PFES contract compliance [103] affecting both the effectiveness and efficiency of any PFES scheme [94].
Many authors have criticized the one-dimensional perspective regarding drivers of deforestation and forest degradation often found in public policies and discourse, and suggest more comprehensive analyses of all underlying factors, including coffee production and land-use systems [91]. As Dak Lak province is one of largest coffee producing regions in the country, and coffee production provides livelihoods for around half a million smallholder households and supplemental income for half a million seasonal workers, coffee expansion has become a major economic strategy and is also contributing to deforestation and degradation [30,104]. Previous studies have shown drivers of forest loss before PFES including pressures from population growth and migration, insufficient land for cultivation needs, limited access to credit and extension services, low levels of education, lack of participatory policy planning and implementation, poor coordination between government institutions and poor infrastructure. Another driver, migration, has remained widespread after PFES [30,79,92], and, despite government agencies perceiving it as a major social issue and driver of deforestation, is not being properly addressed. Earlier studies also show that without migrants being allocated sufficient land for cultivation, the risk of forest encroachment for farming will always exist [85]. Without addressing these underlying issues, PFES alone cannot address deforestation effectively.
Moreover, many scholars have argued that the current forest management governance structure is inadequate for effective forest protection and management in Vietnam [98,105]. Our findings point to local households’ weak understanding of forest boundaries and land-use conflicts being major drivers of deforestation [106] before and after PFES. Many studies conducted before PFES showed that despite the Forest Land Allocation program in Dak Lak province aiming to enhance local rights and local access to forest resources, forest area still declined [92]. This is because the allocation of forest land-use rights for forest owners only exists on paper, and there is insufficient recognition of customary rights [107]. Land users’ capacity to shift to sustainable land practices, while influenced by direct payments from PFES, is affected by national strategies and institutional reform, particularly on land management [108].
Although our paper discusses PFES as a specific case study in Vietnam, it provides further evidence to strengthen existing global PES experiences which highlight that there is no one-size-fits-all formula for PES design, and PES concepts need to be adjusted to specific contexts [25,26]. It also shows challenges for developing countries to achieve their goal of reducing forest loss with PES schemes, particularly when such schemes are not considered financially attractive by local people. Our paper also shows that local people’s motivation to participate in PFES is not driven solely by economic factors, such as level of payment, but also by how payment distribution is structured. As local people see late payment and payments through banking systems as major pitfalls for PFES, further refinement of PFES rules is clearly called for. As each province, district, commune and village has its own social, political and economic contexts, a payment distribution and benefit-sharing mechanism that might work in one place might not necessarily be appropriate in another. Therefore, local government agencies have to assess their own context in designing payment modalities that comply with the national legal framework, by adapting to the local context and building on the interest, capacity and consensus of pertinent actors [96,109]. No matter how the payment distribution mechanism is designed and selected, it has to be conducted in a participatory manner where stakeholders are properly consulted [43,109].

5. Conclusions

With its commencement in Dak Lak province in 2013, PFES was expected to pull more resources into forest protection, which would contribute to the prevention of further forest loss in the Central Highlands region. However, this study finds that after eight years of PFES implementation, the area of natural forest is still on a downward trajectory. Underlying reasons for the inability of PFES to reduce forest loss include weak law enforcement, low PFES payments, late payment and unclear tenure, while drivers of deforestation are strongly associated with provincial economic development plans. Though PFES additionality is limited, PFES has contributed to local household incomes and helped raise people’s awareness in regard to environmental protection. Protecting forests in Dak Lak province requires addressing underlying drivers of deforestation and weak law enforcement, and providing sufficient incentives such as alternative livelihood options for local people to engage in PFES. Reducing and preventing forest loss also requires strong political commitment from the government in balancing environmental and economic development goals, because drivers of deforestation and degradation fall outside the forestry sector and are rooted in national priorities to boost economic growth. In order to mobilize local people to engage in forest protection, PFES needs to take local perceptions of equity into account, tailor payment distribution to suit local preferences, improve the effectiveness of forest law enforcement and monitoring and evaluation systems and adopt participatory and inclusive decision making. Strengthening and clarifying land tenure and enhancing local knowledge of land use and forest protection policies are also essential for reducing forest loss. Differentiating payments based on the opportunity costs of forest environmental services could also enhance the efficiency and effectiveness of PFES.

Author Contributions

Conceptualization, T.T.P. and T.T.T.L.; methodology, T.T.P.; validation, T.T.P., N.M.H.T., H.N.K.T., V.T.P. and P.H.N.K.T.; formal analysis, T.T.P., T.T.T.L., V.T.P. and H.N.K.T.; investigation H.N.K.T., V.T.P., P.H.N.K.T., and T.D.T.; resources, T.T.P.; data curation, V.T.P. and N.M.H.T.; writing—original draft preparation, T.T.P. and T.T.T.L.; writing—review and editing, T.T.P.; visualization, T.T.A.N. and T.V.A.N.; supervision, T.T.P.; funding acquisition, T.T.P. All authors have read and agreed to the published version of the manuscript.

Funding

This research was funded Norwegian Agency for Development Cooperation: QZA-21/0124, Partnerships for Enhanced Engagement in Research (PEER) funded by USAID and the CGIAR Research Program on Forests, Trees and Agroforestry (CRP-FTA) with financial support from CGIAR Fund donors.

Data Availability Statement

The data that support the findings of this study are available from the corresponding author, Pham Thu Thuy, upon reasonable request.

Conflicts of Interest

The authors declare no conflict of interest. The funders had no role in the design of the study; in the collection, analyses or interpretation of data; in the writing of the manuscript, or in the decision to publish the results.

References

  1. Clements, T.; John, A.; Nielsen, K.; An, D.; Tan, S.; Milner-Gulland, E.J. Payments for biodiversity conservation in the context of weak institutions: Comparison of three programs from Cambodia. Ecol. Econ. 2010, 69, 1283–1291. [Google Scholar] [CrossRef]
  2. Rodríguez-de-Francisco, J.C.; Budds, J.; Boelens, R. Payment for environmental services and unequal resource control in Pimampiro, Ecuador. Soc. Nat. Resour. 2013, 26, 1217–1233. [Google Scholar] [CrossRef]
  3. Tacconi, L.; Mahanty, S.; Suich, H. The livelihood impacts of payments for environmental services and implications for REDD+. Soc. Nat. Resour. 2013, 26, 733–744. [Google Scholar] [CrossRef]
  4. Sanchez-Azofeifa, G.A.; Pfaff, A.; Robalino, J.A.; Boomhower, J.P. Costa Rica’s payment for environmental services program: Intention, implementation, and impact. Conserv. Biol. 2007, 21, 1165–1173. [Google Scholar] [CrossRef] [PubMed] [Green Version]
  5. Boelens, R.; Hoogesteger, J.; Rodriguez de Francisco, J.C. Commoditizing water territories: The clash between Andean water rights cultures and payment for environmental services policies. Capital. Nat. Soc. 2014, 25, 84–102. [Google Scholar] [CrossRef]
  6. Pham, T.T.; Hoang, M.H.; Campbell, B.M. Pro-poor payments for environmental services: Challenges for the government and administrative agencies in Vietnam. Public Adm. Dev. Int. J. Manag. Res. Pract. 2008, 28, 363–373. [Google Scholar] [CrossRef]
  7. Pham, T.T.; Campbell, B.M.; Garnett, S. Lessons for pro-poor payments for environmental services: An analysis of projects in Vietnam. Asia Pac. J. Public Adm. 2009, 31, 117–133. [Google Scholar] [CrossRef]
  8. Wunder, S. Payments for Environmental Services: Some Nuts and Bolts; Occasional Paper 42; CIFOR: Bogor, Indonesia, 2005. [Google Scholar]
  9. Kosoy, N.; Corbera, E. Payments for ecosystem services as commodity fetishism. Ecol. Econ. 2010, 69, 1228–1236. [Google Scholar] [CrossRef]
  10. Gómez-Baggethun, E.; De Groot, R.; Lomas, P.L.; Montes, C. The history of ecosystem services in economic theory and practice: From early notions to markets and payment schemes. Ecol. Econ. 2010, 69, 1209–1218. [Google Scholar] [CrossRef]
  11. Vatn, A. An institutional analysis of payments for environmental services. Ecol. Econ. 2010, 69, 1245–1252. [Google Scholar] [CrossRef]
  12. Wunder, S. Revisiting the concept of payments for environmental services. Ecol. Econ. 2015, 117, 234–243. [Google Scholar] [CrossRef]
  13. Muradian, R.; Corbera, E.; Pascual, U.; Kosoy, N.; May, P.H. Reconciling theory and practice: An alternative conceptual framework for understanding payments for environmental services. Ecol. Econ. 2010, 69, 1202–1208. [Google Scholar] [CrossRef]
  14. Pascual, U.; Muradian, R.; Rodríguez, L.C.; Duraiappah, A. Exploring the links between equity and efficiency in payments for environmental services: A conceptual approach. Ecol. Econ. 2010, 69, 1237–1244. [Google Scholar] [CrossRef]
  15. COST European Cooperation in Science and Technology. CA15206—Payments for Ecosystem Services (Forests for Water). 2021. Available online: https://www.cost.eu/actions/CA15206 (accessed on 1 August 2021).
  16. European Commission. Payments for Ecosystem Services. 2012. Available online: https://ec.europa.eu/environment/integration/research/newsalert/pdf/30si_en.pdf (accessed on 1 August 2021).
  17. FACE EU. Payments for Ecosystem Services. Ecosystem Services. 2017. Available online: https://www.face.eu/sites/default/files/documents/english/payments_for_ecosystem_services_final_en_0.pdf (accessed on 1 August 2021).
  18. CPES. Channel Payment for Ecosystem. 2021. Available online: https://www.cpes-interreg.eu/en/cpes-project/the-project (accessed on 1 August 2021).
  19. McAfee, K.; Shapiro, E.N. Payments for ecosystem services in Mexico: Nature, neoliberalism, social movements, and the state. Ann. Assoc. Am. Geogr. 2010, 100, 579–599. [Google Scholar] [CrossRef]
  20. Rodríguez-de-Francisco, J.C.; Boelens, R. PES hydrosocial territories: De-territorialization and re-patterning of water control arenas in the Andean highlands. Water Int. 2016, 41, 140–156. [Google Scholar] [CrossRef]
  21. Sommerville, M.; Jones, J.P.; Rahajaharison, M.; Milner-Gulland, E.J. The role of fairness and benefit distribution in community-based Payment for Environmental Services interventions: A case study from Menabe, Madagascar. Ecol. Econ. 2010, 69, 1262–1271. [Google Scholar] [CrossRef]
  22. Börner, J.; Wunder, S.; Wertz-Kanounnikoff, S.; Tito, M.R.; Pereira, L.; Nascimento, N. Direct conservation payments in the Brazilian Amazon: Scope and equity implications. Ecol. Econ. 2010, 69, 1272–1282. [Google Scholar] [CrossRef]
  23. Blignaut, J.; Mander, M.; Schulze, R.; Horan, M.; Dickens, C.; Pringle, C.; Mavundla, K.; Mahlangu, I.; Wilson, A.; McKean, S. Restoring and managing natural capital towards fostering economic development: Evidence from the Drakensberg, South Africa. Ecol. Econ. 2010, 69, 1313–1323. [Google Scholar] [CrossRef] [Green Version]
  24. Fletcher, R.; Breitling, J. Market mechanism or subsidy in disguise? Governing payment for environmental services in Costa Rica. Geoforum 2012, 43, 402–411. [Google Scholar] [CrossRef]
  25. Huang, M.; Upadhyaya, S.K. Watershed-Based Payment for Environmental Services in Asia. Working Paper 06–07. Available online: https://sanremcrsp.cired.vt.edu/wp-content/uploads/2013/11/Sept.2007.PESAsia.pdf (accessed on 1 August 2021).
  26. Leimona, B.; Van Noordwijk, M.; De Groot, R.; Leemans, R. Fairly efficient, efficiently fair: Lessons from designing and testing payment schemes for ecosystem services in Asia. Ecosyst. Serv. 2015, 12, 16–28. [Google Scholar] [CrossRef] [Green Version]
  27. Trieu, V.H.; Pham, T.T.; Dao, T.L.C. Vietnam Forestry Development Strategy: Implementation Results for 2006–2020 and Recommendations for the 2021–2030 Strategy; Occasional Paper 213; CIFOR: Bogor, Indonesia, 2020. [Google Scholar]
  28. Vietnam Forestry Law. LAW ON FORESTRY: Article 61; World Resources Institute: Washington, DC, USA, 2017. [Google Scholar]
  29. Nguyen, C.T.; Vuong, V.Q. 8 Years of Organizing and Operating the Forest Protection and Development Fund (2008–2015) and 5 Years of Implementing the Policy on Payment for Forest Environmental Services (2011–2015). In ADB/CDTA-8592: Improving Payment for Forest Environmental Services (PFES) Implementation Project; CIFOR: Bogor, Indonesia, 2016; Available online: http://www.gms-eoc.org/uploads/resources/1193/attachment/3-PFES-VNFF-Assessment-Report.pdf (accessed on 1 August 2021).
  30. Lindskog, E.; Dow, K.; Axberg, G.N.; Miller, F.; Hancock, A. When Rapid Changes in Environmental, Social and Economic Conditions Converge: Challenges to Sustainable Livelihoods in Dak Lak, Vietnam; Stockholm Environment Institute: Stockholm, Sweden, 2005. [Google Scholar]
  31. Food and Agriculture Organization of the United Nations (FAO). Concept Note on Achieving Emission Reductions in the Central Highlands of Vietnam; FAO: Rome, Italy, 2018; Available online: https://www.greenclimate.fund/sites/default/files/document/20120-achieving-emission-reductions-central-highlands-Vietnam-support-national-redd-action-programme.pdf (accessed on 1 August 2021).
  32. Pham, T.M. Socio-Economic Analysis of Shifting Cultivation versus Agroforestry System in The Upper Stream of Lower Mekong Watershed in Dak Lak Province. Ho Chi Minh City. 1999. Available online: http://www.mekonginfo.org/assets/midocs/0002413-farming-socio-economic-analysis-of-shifting-cultivation-versus-agroforestry-system-in-the-upper-stream-of-lower-mekong-watershed-in-dak-lak-provincecase-study.pdf (accessed on 1 August 2021).
  33. Kissinger, G. Policy Responses to Direct and Underlying Drivers of Deforestation: Examining Rubber and Coffee in the Central Highlands of Vietnam. Forests 2020, 11, 733. [Google Scholar] [CrossRef]
  34. MOLIS—Ministry of Labor, W.I. Decision 1052/QĐ-LĐTBXH on Results of Reviewing Poor Households and Near-Poor HouseHolds in 2018 Based on Multidimensional Poverty Standards Applied in the Period 2016–2020. Hanoi, Vietnam. 29 July 2019. Available online: https://thuvienphapluat.vn/van-ban/Van-hoa-Xa-hoi/Quyet-dinh-1052-QD-LDTBXH-2019-ket-qua-ho-ngheo-ho-can-ngheo-chuan-ngheo-tiep-can-da-chieu-420130.aspx (accessed on 1 August 2021).
  35. Dak Lak People’s Council. Resolution 22/2011/NQ-HĐND on the Management and Protection of Forests in Dak Lak Province in the Period 2011–2015; Dak Lak People’s Council: Buon Ma Thuot, Vietnam, 2011; Available online: http://vbpl.vn/daklak/Pages/vbpq-toanvan.aspx?ItemID=58196 (accessed on 1 August 2021).
  36. Dak Lak Provincial People’s Committee. Decision on Issued Plan Implementation of the Project for Sustainable Forest Protection, Recovery and Development in the Highlands Period of 2016–2030 Approved at Decision No. 297/QD-TTG of Government; Dak Lak Provincial People’s Committee: Buon Ma Thuot, Vietnam, 2019. [Google Scholar]
  37. Minh, T.; Van Tiep, C. Tighten Management and Protection of Central Highlands Forests. 21 August 2020. Available online: http://baodaklak.vn/channel/3483/202008/siet-chat-cong-tac-quan-ly-bao-ve-rung-tay-nguyen-5696564 (accessed on 1 August 2021).
  38. Quang, H. Dak Lak Implemented Many Solutions to Develop and Protect Forests. 2018. Available online: https://dangcongsan.vn/kinh-te/dak-lak-thuc-hien-nhieu-giai-phap-phat-trien-bao-ve-rung-473162.html (accessed on 1 August 2021).
  39. Vietnam Government. Decree No. 156/2018/ND-CP of the Government: Detailing the Implementation of a Number of Articles of the Law on Forestry. 2018. Available online: http://www.chinhphu.vn/portal/page/portal/English (accessed on 1 August 2021).
  40. Nguyen, C. Payment for Forest Environment Services in 2018 in Dak Lak Province, a Year to Look Back. 2018. Available online: https://daklakff.vn/tin-tuc/chi-tra-dich-vu-moi-truong-rung-nam-2018-tai-tinh-dak-lak-mot-nam-nhin-lai.html (accessed on 1 August 2021).
  41. Ho, T. Social Issues. 12 July 2021. Available online: https://danviet.vn/hieu-qua-tu-chinh-sach-chi-tra-dich-vu-moi-truong-rung-o-dak-lak-20210712085740771.htm (accessed on 1 August 2021).
  42. Duong, T.B.N.; de Groot, W.T. The impact of payment for forest environmental services (PFES) on community-level forest management in Vietnam. For. Policy Econ. 2020, 113, 102135. [Google Scholar] [CrossRef]
  43. Pham, T.T.; Moeliono, M.; Brockhaus, M.; Le, N.D.; Wong, G.Y.; Le, M.T. Local Preferences and Strategies for Effective, Efficient, and Equitable Distribution of PES Revenues in Vietnam: Lessons for REDD+. Hum. Ecol. 2014, 42, 885–899. [Google Scholar] [CrossRef]
  44. Pham, T.T.; Ngo, H.C.; Dao, T.L.C.; Hoang, T.L.; Fisher, M.R. The politics of numbers and additionality governing the national Payment for Forest Environmental Services scheme in Vietnam: A case study from Son La province. Forest Soc. 2020, 4, 379–404. [Google Scholar] [CrossRef]
  45. Pham, T.T.; Nguyen, D.T.; Dao, T.L.C.; Hoang, T.L.; Pham, H.L.; Nguyen, T.L.; Tran, K.B. Impacts of Payment for Forest Environmental Services in Cat Tien National Park. Forests 2021, 12, 921. [Google Scholar] [CrossRef]
  46. Dam, V.B.; Catacutan, D.C.; Hoang, M.H. Importance of national policy and local interpretation in designing payment for forest environmental services scheme for the Ta Leng river basin in Northeast Vietnam. Environ. Nat. Resour. Res. 2014, 4, 39. [Google Scholar] [CrossRef] [Green Version]
  47. Nielsen, M.R.; Theilade, I.; Meilby, H.; Nguyen, H.N.; Nguyen, T.L. Can PES and REDD+ match Willingness to Accept payments in contracts for reforestation and avoided forest degradation? The case of farmers in upland Bac Kan, Vietnam. Land Use Policy 2018, 79, 822–833. [Google Scholar] [CrossRef]
  48. Chiramba, T.; Mogoi, S.; Martinez, I.; Jones, T. Payment for Forest Ecosystem Services (PFES): Pilot Implementation in Lam Dong Province, Vietnam. In Proceedings of the UN-Water International Conference, Zaragoza, Spain, 3–5 October 2011; Available online: https://www.un.org/waterforlifedecade/green_economy_2011/pdf/biodiversity_protection_cases_Vietnam.pdf (accessed on 1 August 2021).
  49. Pham, T.T.; Bennet, K.; Vu, T.P.; Brunner, J.; Le, N.D.; Nguyen, D.T. Payments for Forest Environmental Services in Vietnam: From Policy to Practice; Occasional Paper 93; CIFOR: Bogor, Indonesia, 2013. [Google Scholar]
  50. Pham, T.T.; Le, N.D.; Vu, T.P.; Nguyen, H.T.; Nguyen, V.T. Forest Land Allocation and Payments for Forest Environmental Services in Four Northwestern Provinces of Vietnam: From Policy to Practice; Occasional Paper 155; CIFOR: Bogor, Indonesia, 2016. [Google Scholar]
  51. Loft, L.; Le, N.D.; Pham, T.T.; Yang, A.L.; Tjajadi, J.S.; Wong, G.Y. Whose equity matters? National to local equity perceptions in Vietnam’s payments for forest ecosystem services scheme. Ecol. Econ. 2017, 135, 164–175. [Google Scholar] [CrossRef]
  52. Hoang, P.B.N.; Fujiwara, T. Three years implementation of PFES in Thua Thien Hue Province, Vietnam. The Jpn. For. Soc. Congr. 2019, 130, 793. [Google Scholar] [CrossRef]
  53. EU REDD Facility. Overview of Planned Public Investments Related to Land-Use in Central Highland Region of Vietnam, 2016–2020; EU REDD Facility: Barcelona, Spain, 2018. [Google Scholar]
  54. Phan, H.H. Gendered Access to Resources and Its Implications for REDD+: A Case Study from the Central Highlands, Vietnam. Ph.D. Thesis, University of East Anglia, Norwich, UK, 2018. Available online: https://ueaeprints.uea.ac.uk/id/eprint/68198/1/Hao_Phuong_Phan_Final_Submission_August_2018.pdf (accessed on 1 August 2021).
  55. Ministry of Agriculture and Rural Development (MARD). Participation, Self-Assess. Redd+ Readiness Package Vietnam; MARD: Hanoi, Vietnam, 2016; Available online: https://www.forestcarbonpartnership.org/system/files/documents/Vietnam%20R-Package%2017Aug16.pdf (accessed on 1 August 2021).
  56. Sanderson, I. Evaluation, policy learning and evidence-based policy making. Public Adm. 2002, 80, 1–22. [Google Scholar] [CrossRef]
  57. Bennett, C.J.; Howlett, M. The lessons of learning: Reconciling theories of policy learning and policy change. Policy Sci. 1992, 25, 275–294. [Google Scholar] [CrossRef]
  58. May, P. Policy Learning and Failure. J. Publ. Policy 1992, 12, 331–354. [Google Scholar] [CrossRef]
  59. Sunderlin, W.D.; Larson, A.M.; Duchelle, A.E.; Sills, E.O.; Luttrell, C.; Jagger, P.; Pattanayak, S.; Cronkleton, P.; Ekaputri, A.D.; de Sassi, C.; et al. Technical Guidelines for Research on REDD+ Subnational Initiatives, 2nd ed.; CIFOR: Bogor, Indonesia, 2016. [Google Scholar]
  60. Dak Lak Provincial Forest Protection and Development Fund. Progress Report on Results of Five Years of Implementing Policies on Payment for Forest Ecosystem Services in Dak Lak from 2013–2017; Dak Lak Provincial Forest Protection and Development Fund: Hanoi, Vietnam, 2018. [Google Scholar]
  61. Dak Lak Provincial Forest Protection and Development Fund. Report on Results of Implementing Policies on Payment for Forest Ecosystem Services in Dak Lak in 2018; Dak Lak Provincial Forest Protection and Development Fund: Hanoi, Vietnam, 2019. [Google Scholar]
  62. Dak Lak Provincial People’s Committee. Decision on Approval for the Plan on Collecting and Spending of Payment for Forest Environment Services in 2015; Dak Lak Provincial Forest Protection and Development Fund: Hanoi, Vietnam, 2015. [Google Scholar]
  63. Dak Lak Provincial People’s Committee. Decision on Approval for the Plan on Collecting and Spending of Payment for Forest Ecosystem Services in 2016; Dak Lak Provincial Forest Protection and Development Fund: Hanoi, Vietnam, 2016. [Google Scholar]
  64. Dak Lak Provincial People’s Committee. Decision on Approval for the Plan on Collecting and Spending of Payment for Forest Ecosystem Services in 2017; Dak Lak Provincial Forest Protection and Development Fund: Hanoi, Vietnam, 2017. [Google Scholar]
  65. Dak Lak Provincial People’s Committee. Decision on Approval for the Plan on Collecting and Spending of Payment for Forest Ecosystem Services in 2018; Dak Lak Provincial Forest Protection and Development Fund: Hanoi, Vietnam, 2018. [Google Scholar]
  66. BT. ANTV: Legal News. 1 July 2021. Available online: https://www.antv.gov.vn/tin-tuc/phap-luat/nan-pha-rung-chiem-dat-san-xuat-tai-dak-lak-354545.html (accessed on 1 August 2021).
  67. Dak Lak Forest Protection Department. PFES Implementation Status; Dak Lak Forest Protection Department: Hanoi, Vietnam, 2019. [Google Scholar]
  68. Vietnam News Agency. Dak Lak’s Forest Coverage Decreases; Vietnam News Agency: Hanoi, Vietnam, 2018; Available online: https://en.Vietnamplus.vn/dak-laks-forest-coverage-decreases/140624.vnp (accessed on 1 August 2021).
  69. Hoai, N. Deforestation in Connivance with Dak Lak Authorities. 9 April 2012. Available online: https://sggpnews.org.vn/national/deforestation-in-connivance-with-dak-lak-authorities-14838.html (accessed on 1 August 2021).
  70. Meyfroidt, P.; Vu, T.P.; Hoang, V.A. Trajectories of deforestation, coffee expansion and displacement of shifting cultivation in the Central Highlands of Vietnam. Glob. Environ. Chang. 2013, 23, 1187–1198. [Google Scholar] [CrossRef]
  71. Nhung, P.H.; Duan, V. Encroaching a National Park to Build Hydropower: Authority Says Yes. 22 August 2013. Available online: https://www.thiennhien.net/2013/08/22/vu-xe-vuon-quoc-gia-lam-thuy-dien-co-quan-chuc-nang-da-dong-y (accessed on 1 August 2021).
  72. Van, H. Forest in Central Highland Reduces Seriously. 16 April 2015. Available online: https://baotintuc.vn/kinh-te/rung-tay-nguyen-giam-nghiem-trong-20150416150701069.htm (accessed on 1 August 2021).
  73. Ministry of Natural Resources and Environment (MONRE). Current Status and Changes of Forests in Central Highlands. 7 August 2014. Available online: http://www.monre.gov.vn/English/Pages/Current-status-and-changes-of-forests-in-central-highlands.aspx (accessed on 1 August 2021).
  74. Ngoc, H.; Le, M. Dak Lak: Investigate Tens of Thousands of Hectares of Destroyed and Encroached Forests. Security & Economy. 2 March 2021. Available online: https://congan.com.vn/an-ninh-kinh-te/dak-lak-dieu-tra-hang-chuc-ngan-ha-rung-bi-tan-pha-lan-chiem-vo-toi-va_108158.html (accessed on 1 August 2021).
  75. Sugandi, D.; Hamdanah, H. Effect of Forest Encroachment in Cisangkuy Sub Watershed. IOP Conf. Ser. Earth Environ. Sci. 2019, 286, 12025. [Google Scholar] [CrossRef]
  76. Pagiola, S. Using PFES to Implement REDD; Latin America and Caribbean Sustainable Development Department, World Bank: Washington, DC, USA, 2011; Available online: https://documents1.worldbank.org/curated/en/540231468325271699/pdf/862730NWP0PESL00Box385172B00PUBLIC0.pdf (accessed on 1 August 2021).
  77. Nguyen, C.L. The Culprit of Large-Scale Deforestation Has Been Found in Dak Lak. News and Legal Issues. 24 June 2020. Available online: https://nhandan.vn/thoi-su-phap-luat/da-tim-ra-thu-pham-pha-rung-quy-mo-lon-o-dak-lak-475549 (accessed on 1 August 2021).
  78. N.G. Discovered 7 Slats of Cam Xe Wood that Had Been Cut by "Loggers" and Hidden in the Fields. 3 June 2020. Available online: https://baodansinh.vn/dak-lak-phat-hien-7-long-go-cam-xe-bi-lam-tac-xe-hop-cat-giau-trong-ray-20200603102837158.htm (accessed on 1 August 2021).
  79. Trung, D. 37 People in Phu Yen Were Arrested When Entering the Conservation Area in Dak Lak for Deforestation. Legal News. 29 April 2021. Available online: https://Vietnamnet.vn/vn/phap-luat/ho-so-vu-an/vao-khu-bao-ton-o-dak-lak-pha-rung-37-nguoi-o-phu-yen-bi-bat-731605.html (accessed on 1 August 2021).
  80. Cochard, R.; Ngo, D.T.; Waeber, P.O.; Kull, C.A. Extent and causes of forest cover changes in Vietnam’s provinces 1993–2013: A review and analysis of official data. Environ. Rev. 2016, 25, 199–217. [Google Scholar] [CrossRef] [Green Version]
  81. Cao Nguyen. Another Large Deforestation Case Was Discovered, Nearly 40m3 of Timber Was Collected in Dak Lak. 11 March 2021. Available online: https://nld.com.vn/thoi-su/lai-phat-hien-vu-pha-rung-lon-thu-gan-40m3-go-o-dak-lak-20210311070113042.htm (accessed on 1 August 2021).
  82. Vietnam News Agency. Dak Lak Investigates Forest Destruction; Vietnam News Agency: Hanoi, Vietnam, 2019; Available online: https://Vietnamnews.vn/society/569083/dak-lak-investigates-forest-destruction.html (accessed on 1 August 2021).
  83. Cochard, R.; Ngo, D.T.; Kull, C.A. Vietnam’s forest cover changes 2005–2016: Veering from transition to (yet more) transaction? World Dev. 2020, 135, 105051. [Google Scholar] [CrossRef]
  84. Bao, T. Why is Dak Lak Constantly Losing Forests? Society, 13 March 2021. Available online: https://laodong.vn/xa-hoi/vi-sao-dak-lak-lien-tuc-bi-mat-rung-888549.ldo (accessed on 1 August 2021).
  85. Cong, B. Forests in Dak Lak Were Destroyed Widely in the Helplessness of Forest Owners. Society, 30 March 2021. Available online: https://vov.vn/xa-hoi/rung-tai-dak-lak-bi-pha-tran-lan-trong-su-bat-luc-cua-chu-rung-846623.vov (accessed on 1 August 2021).
  86. Quang, H. The Number of Households Receiving Payment for Forest Environmental Services in Dak Lak is Still Low. Society, 26 November 2018. Available online: https://dantocmiennui.vn/so-ho-duoc-chi-tra-dich-vu-moi-truong-rung-tai-dak-lak-con-thap/203769.html (accessed on 1 August 2021).
  87. Vu, H.T.; Pham, X.P. Impacts and effectiveness of logging bans in natural forests: Vietnam. In Forests Out of Bounds: Impacts and Effectiveness of Logging Bans in Natural Forests in Asia-Pacific; Durst, P.B., Waggener, T.R., Enters, T., Cheng, T.L., Eds.; FAO: Bangkok, Thailand, 2001; p. 185. [Google Scholar]
  88. Wunder, S.; Brouwer, R.; Engel, S.; Ezzine-de-Blas, D.; Muradian, R.; Pascual, U.; Pinto, R. From principles to practice in paying for nature’s services. Nat. Sustain. 2018, 1, 145–150. [Google Scholar] [CrossRef]
  89. Ezzine-de-Blas, D.; Wunder, S.; Ruiz-Pérez, M.; Moreno-Sanchez, R.d.P. Global Patterns in the Implementation of Payments for Environmental Services. PLoS ONE 2016, 11, e0149847. [Google Scholar] [CrossRef] [PubMed] [Green Version]
  90. Wunder, S.; Engel, S.; Pagiola, S. Taking stock: A comparative analysis of payments for environmental services programs in developed and developing countries. Ecol. Econ. 2008, 65, 834–852. [Google Scholar] [CrossRef]
  91. Trædal, L.T.; Vedeld, P.O. Livelihoods and Land Uses in Environmental Policy Approaches: The Case of PES and REDD+ in the Lam Dong Province of Vietnam. Forests 2017, 8, 39. [Google Scholar] [CrossRef] [Green Version]
  92. Tran, N.T.; Nguyen, Q.T.; Sikor, T. The Local Outcomes of Forest Land Allocation: Evidence from Dak Lak; Buon Ma Thuot: Dak Lak; Department of Agriculture and Rural Development: Pretoria, South Africa, 2003; Available online: http://mekonginfo.org/assets/midocs/0003346-environment-the-local-outcomes-of-forest-land-allocation-evidence-from-dak-lak.pdf (accessed on 1 August 2021).
  93. Nguyen, C.L.; Do, H. The Natural Forest Bordering Dak Lak and Gia Lai Has Been Destroyed. News and Legal Issues, 23 February 2021. Available online: https://nhandan.vn/thoi-su-phap-luat/rung-tu-nhien-giap-ranh-giua-dak-lak-va-gia-lai-bi-tan-pha-636282 (accessed on 1 August 2021).
  94. Ngoc, G. Dak Lak: Deforestation Caused the Loss of Nearly 30 Billion VND, the Director and 8 Subordinates Were Prosecuted. 2 August 2021. Available online: https://danviet.vn/dak-lak-de-mat-rung-gay-thiet-hai-gan-30-ty-dong-giam-doc-va-8-thuoc-cap-bi-truy-to-20210802164531112.htm (accessed on 1 August 2021).
  95. Pham, H. Dak Lak: Many Forest Areas Have Been Encroached on And Invaded. Readers & Law, 28 February 2021. Available online: https://baotainguyenmoitruong.vn/dak-lak-nhieu-dien-tich-rung-bi-lan-chiem-xam-canh-320926.html (accessed on 1 August 2021).
  96. Pham, T.T.; Brockhaus, M.; Wong, G.; Dung, L.N.; Tjajadi, J.S.; Loft, L.; Luttrell, C.; Assembe Mvondo, S. Approaches to Benefit Sharing: A Preliminary Comparative Analysis of 13 REDD+ Countries; Working Paper 108; CIFOR: Bogor, Indonesia, 2013. [Google Scholar]
  97. Phạm, T.T.; Đào, T.L.C.; Nguyễn, T.L.; Hoàng, T.L.; Nguyễn, Đ.T.; và Phạm, H.L. Economic and Social Impacts of Payment for Forest Environmental Services in Cat Tien National Park; Working Paper 215; CIFOR: Bogor, Indonesia, 2020. [Google Scholar]
  98. Pham, T.T.; Ngo, H.C.; Dao, T.L.C.; Hoang, T.L.; Moeliono, M. Participation and influence of REDD+ actors in Vietnam, 2011–2019. Glob. Environ. Chang. 2021, 68, 102249. [Google Scholar] [CrossRef]
  99. Jones, K.W.; Etchart, N.; Holland, M.; Naughton-Treves, L.; Arriagada, R. The impact of paying for forest conservation on perceived tenure security in Ecuador. Conserv. Lett. 2020, 13, e12710. [Google Scholar] [CrossRef] [Green Version]
  100. Johnson, M.K.; Lien, A.M.; Sherman, N.R.; López-Hoffman, L. Barriers to PES programs in Indigenous communities: A lesson in land tenure insecurity from the Hopi Indian reservation. Ecosyst. Serv. 2018, 32, 62–69. [Google Scholar] [CrossRef]
  101. Naughton-Treves, L.; Wendland, K. Land tenure and tropical forest carbon management. World Dev. 2014, 55, 1–6. [Google Scholar] [CrossRef]
  102. Mahanty, S.; Suich, H.; Tacconi, L. Access and benefits in payments for environmental services and implications for REDD+: Lessons from seven PES schemes. Land Use Policy 2013, 31, 38–47. [Google Scholar] [CrossRef]
  103. Costedoat, S.; Corbera, E.; Ezzine-de-Blas, D.; Honey-Rosés, J.; Baylis, K.; Castillo-Santiago, M.A. How Effective Are Biodiversity Conservation Payments in Mexico? PLoS ONE 2015, 10, e0119881. [Google Scholar] [CrossRef] [Green Version]
  104. Scherr, S.J.; Mankad, K.; Jaffee, S.; Negra, C.; Tanja Havemann, J.K. Steps Toward Green: Policy Responses to the Environmental Footprint of Commodity Agriculture in East and Southeast Asia; EcoAgriculture Partners and the World Bank: Washington, DC, USA, 2015. [Google Scholar]
  105. Pham, T.T.; Hoang, T.L.; Nguyen, D.T.; Dao, T.L.C.; Ngo, H.C.; Pham, V.H. The Context of REDD+ in Vietnam: Drivers, Agents and Institutions, 2nd ed.; Occasional Paper 196; CIFOR: Bogor, Indonesia, 2019. [Google Scholar]
  106. Sikor, T.; Tran, N.T. Exclusive versus inclusive devolution in forest management: Insights from forest land allocation in Vietnam’s Central Highlands. Land Use Policy. 2007, 24, 644–653. [Google Scholar] [CrossRef]
  107. Bayrak, M.M. State of Forest Governance in Vietnam: Where Are the Local Communities? In Population, Development, and the Environment; James, H., Ed.; Palgrave Macmillan: Singapore, 2019; pp. 273–295. [Google Scholar] [CrossRef]
  108. Wegner, G.I. Payments for ecosystem services (PES): A flexible, participatory, and integrated approach for improved conservation and equity outcomes. Environ. Dev. Sustain. 2016, 18, 617–644. [Google Scholar] [CrossRef]
  109. Pham, T.T.; Wong, G.; Le, N.D.; Brockhaus, M. The Distribution of Payment for Forest Environmental Services (PFES) in Vietnam: Research Evidence to Inform Payment Guidelines; Occasional Paper 163; CIFOR: Bogor, Indonesia, 2016. [Google Scholar]
Figure 1. Study village locations.
Forests 12 01383 g001
Figure 2. Forest area by forest owner receiving PFES (×1000 ha). Sources: [62,63,64,65].
Forests 12 01383 g002
Figure 3. Disbursement rates (VND × billion) and percentages of payments by forest owner, 2013–2017. Source: Reproduced with permission from Dak Lak Provincial Forest Protection and Development Fund [60].
Forests 12 01383 g003
Figure 4. Forest area change in Dak Lak province, 2007–2018 (ha × 1000). Source: Reproduced with permission from Dak Lak Forest Protection Department [67].
Forests 12 01383 g004
Figure 5. Forest cover change in Dak Lak province, 2007–2018 (%). Sources: Reproduced with permission from Dak Lak Forest Protection Department [67].
Forests 12 01383 g005
Figure 6. Area of natural forest and plantation forest in the study districts. Source: Reproduced with permission from Dak Lak Forest Protection Department [67].
Forests 12 01383 g006
Figure 7. Numbers of forest fires. Source: Reproduced with permission from Dak Lak Provincial Forest Protection and Development Fund [60].
Forests 12 01383 g007
Figure 8. Forest and PFES status in study villages (% of respondents) in 2019. Sources: Household surveys (2021), [61].
Forests 12 01383 g008
Figure 9. Extent of forest encroachment compared to before PFES.
Forests 12 01383 g009
Figure 10. Ownership of encroached forest.
Forests 12 01383 g010
Table 1. List of study villages.
PairName of DistrictPFESNon-PFES
1M’DrakĐứkM’ Jam
2M’DrakNăngM’ Bơn A
3M’DrakHoangEa Thi
4M’DrakM’oM’ Liă
5M’DrakEa chôEa Rông
6Krông BôngHàng NămTrí
7Buôn ĐônKiềuN’ Drếch
8Buôn ĐônKuanhĐôn
Table 2. Background information about the study sites.
VillagePFES StatusNo. of PeopleNo. of HouseholdsEthnicityDistance to Road (km)
ĐứkPFES536103Ê Đê6
NăngPFES597141Ê Đê7
HoangPFES28977Ê Đê6
M’oPFES629164Ê Đê0.5
M’JamNon-PFES338104Ê Đê5
M’Bơn ANon-PFES27974Ê Đê6
Ea ThiNon-PFES410114Ê Đê12
M’LiăNon-PFES41091Ê Đê5
Ea chôPFES47694M’nông5
Hàng NămPFES861168M’nông4
KiềuPFES614126M’nông6
KuanhPFES36879M’nông5
Ea RôngNon-PFES562162M’nông2
TríNon-PFES802210M’nông1
N’ DrếchNon-PFES32998M’nông2
ĐônNon-PFES508135M’nông1
Table 3. Total PFES collected from users in Dak Lak province (VND × million).
YearRevenue from cross Provincial PaymentsDomestic RevenueTotal
201355,0003219.0558,219.05
201452,0003856.5955,856.59
201543,5003638.7547,138.75
201642,0007642.4649,642.46
201755,2006647.4461,847.44
201876,6007471.0284,071.02
Total324,30032,475.31356,775.31
Sources: Reproduced with permission from Dak Lak Provincial Forest Protection and Development Fund [60,61].
Table 4. Payment rates for river basins in Dak Lak province (VND × 1000/ha/year).
YearSêrêpôkSông BaEa H’leoEa Krông Rou
2013150.00150.00--
2014154.00146.00283.00-
2015300.00254.00683.00247.00
2016161.00122.06446.43237.47
2017200.00200.00331.00295.00
2018300.00300.00600.00469.61
Sources: Reproduced with permission from Dak Lak Provincial Forest Protection and Development Fund [60,65].
Table 5. PFES revenue spending (VND × million).
YearFPDF Management CostsPayment to Forest OwnersScattered Tree PlantingTotal
20135764.6528,559.09-34,323.74
20145421.9233,642.93-39,064.85
20154156.8362,855.59-67,012.42
20164017.4237,227.97-41,245.39
20177563.6846,078.23813.4554,455.36
20189440.1669,442.191000.0079,882.35
Total36,364.66277,806.001813.45315,984.11
Sources: Reproduced with permission from Dak Lak Provincial Forest Protection and Development Fund [60,61].
Table 6. PFES payments (VND × million) and forest area (ha) in the study sites.
Village20172018
Forest AreaPFES PaymentForest AreaPFES Payment
Đứk770.00138.60770.00207.90
Năng885.00159.30885.00238.95
Hoang429.0082.14429.00123.21
M’o825.00148.50825.00222.75
Ea chô1650.00297.001650.00445.50
Hàng Năm1773.00323.201773.00323.20
Kiều1650.001650.001650.001650.00
Kuanh1820.00327.601820.00491.40
Source: Reproduced with permission from Dak Lak Provincial Forest Protection and Development Fund [61].
Table 7. Contributions of forest protection activities and PFES to household earnings (VND × million).
PFESNon-PFES
VillagePFES EarningsPFES as % of Household EarningsVillageEarnings from Forest Protection Contracts with National ParkForest Income as % of Household Earnings
Đứk8.1416.10M’Jam00
Năng5.546.18M’Bơn A00
Hoang5.766.37Ea Thi00
M’o4.127.04M’Liă00
Ea chô6.6610.21Ea Rông2.004.13
Hàng Năm7.5317.59Trí2.113.45
Kiều7.6513.29N’ Drếch2.067.87
Kuanh8.0618.54Đôn2.023.90
Table 8. Average patrol days per year in study sites.
PFESNon-PFES
Đứk33.47M’Jam-
Năng28.53M’Bơn A-
Hoang26.67Ea Thi-
M’o29.13M’Liă-
Ea chô26.93Ea Rông28.80
Hàng Năm26.53Trí18.23
Kiều21.70N’ Drếch27.20
Kuanh22.47Đôn29.33
Source: Household interviews.
Publisher’s Note: MDPI stays neutral with regard to jurisdictional claims in published maps and institutional affiliations.

