Article

Thinning Response and Potential Basal Area—A Case Study in a Mixed Sub-Humid Low-Elevation Oak-Hornbeam Forest

Institute of Silviculture, University of Natural Resources and Life Sciences, 1190 Vienna, Austria
*
Author to whom correspondence should be addressed.
Forests 2021, 12(10), 1354; https://doi.org/10.3390/f12101354
Submission received: 20 July 2021 / Revised: 28 September 2021 / Accepted: 3 October 2021 / Published: 5 October 2021
(This article belongs to the Section Forest Ecology and Management)

Abstract

:
Competition for resources (light, water, nutrients, etc.) limits the size and abundance of live trees a site can support. This carrying capacity determines the potential carbon sequestration in live trees and the maximum growing stock. Lower stocking through thinning can change growth and mortality. We were interested in the relations between stand structure, increment, and mortality using a long-unmanaged oak-hornbeam forest near Vienna, Austria, as a case study. We expected lower increment for heavily thinned compared to unmanaged stands. We tested the thinning response using three permanent growth plots, in which two were thinned (50% and 70% basal area removed) and one remained unmanaged. We calculated stand structure (basal area, stem density, diameter distribution) and increment and mortality of single trees. Over ten years, the heavily thinned stand had a similar increment as that of the moderately thinned and unthinned stands. The basal area of the unthinned stand remained constant and stem density decreased due to competition-related mortality. The studied oak-hornbeam stands responded well even to late and heavy thinning, suggesting a broad “plateau” of stocking and increment for these forest types. Lower stem density for thinned stands led to a much larger tree increment of single trees, compared to the unthinned reference. The findings of this study need verification for other soil and climatic conditions.

1. Introduction

Oaks (Quercus spp.) are widespread globally and Quercus petraea (Matt.) Liebl. (sessile oak) grows in Europe over an area of about 300 million hectares [1]. In Austria, Quercus petraea and Quercus robur L. (pedunculate oak) are, after Fagus sylvatica L. (European beech), the second most important broadleaf species, in terms of growing stock, increment, and harvesting [2]. Q. petraea and Q. robur forests cover an area of about 69,000 hectares in Austria, which represents about 2% of the total forest area in Austria. Although not significant in absolute terms, oak-dominated forests in Austria are common at low elevations near cities and probably have been managed since the early times of settlement [3].
Large parts of the original oak-dominated forests have been lost to settlement and agriculture, and the remaining forests are often under some form of conservation, such as the Vienna Woods near the city of Vienna in Austria. The majority (i.e., about 75%) of the Vienna Woods is now a UNESCO biosphere reserve of about 105,000 ha [4]. Oak species are common at the lower elevations of the Vienna Woods and on pseudogley and shallow soils, where European beech is less competitive and productivity is lower. These forests are unmanaged or only extensively managed, and should approach their carrying capacity and eventually reach old-growth conditions with a diverse stand structure, featuring a significant number of large old trees [5]. The stand structure is not only important for habitat conditions [6], regeneration [7], and carbon sequestration [8], but also for broadly determining tree growth [9,10].
Thinning reduces the number of trees in a stand and thus concentrates the growth on fewer trees, which grow faster than under unthinned conditions [11]. Stand increment can be increased by thinning, compared to unthinned conditions, when forests are water-limited and interception losses in dense stands occur [12]. This is also supported by the work of Assmann (1970) on temperate forests, which suggested that the increment of thinned stands can be higher than that of an unthinned stand. The increment determines the rate of carbon uptake and the basal area determines the carbon stocks in trees [13,14]. Although thinned stands may have a higher increment, the volume and carbon stocks are, in general, highest in unthinned stands that are composed of a large number of trees although with smaller dimensions [15]. Average thinning intensity is preferred by visitors, compared to very dense stands [16], and thus thinning can improve the recreation value and aesthetic appearance, which is particularly important for urban forests [17].
Q. petraea stands in Czech Republic responded well to thinning with a clear effect on diameter increment, and a smaller effect on height increment [18]. Thinning has been shown to reduce adverse effects of droughts and increase drought resistance of Q. petraea in France [19,20]. Survival of Q. petraea growing in Hungary was found to be moderately increased after thinning, with even stronger positive effects for coexisting Carpinus betulus L., the European hornbeam [21]. Improving survival is particularly important for oak forests, where summer conditions are usually critical for growth [22]. We are not aware of studies of thinning response and relations between basal area and stand increment in Austrian mixed oak-hornbeam stands.
There are indications that the forest carbon stocks are saturating in Europe, with the consequence that the potential for further net carbon uptake is decreasing [23]. This saturation is often coupled with unmanaged forests and lack of recent disturbances [24]. Both of these factors can considerably reduce carbon stocks, but allow for continued net carbon uptake. In forests that are in equilibrium (steady state of carbon pools), gains and losses balance each other [25]. The net gain (increment minus losses) approaches zero when potential stocking is reached (i.e., growing stock or basal area is largely constant and not increasing further). The potential stocking of oak-hornbeam forests in Austria is unknown. This study had the following objectives: (1) to determine the stand structure of low-elevation sub-humid oak-hornbeam stands in urban forests near the city of Vienna, and (2) to explore relations between stocking (basal area), increment, and mortality for three management alternatives: unthinned, and moderate and heavy thinning.

2. Materials and Methods
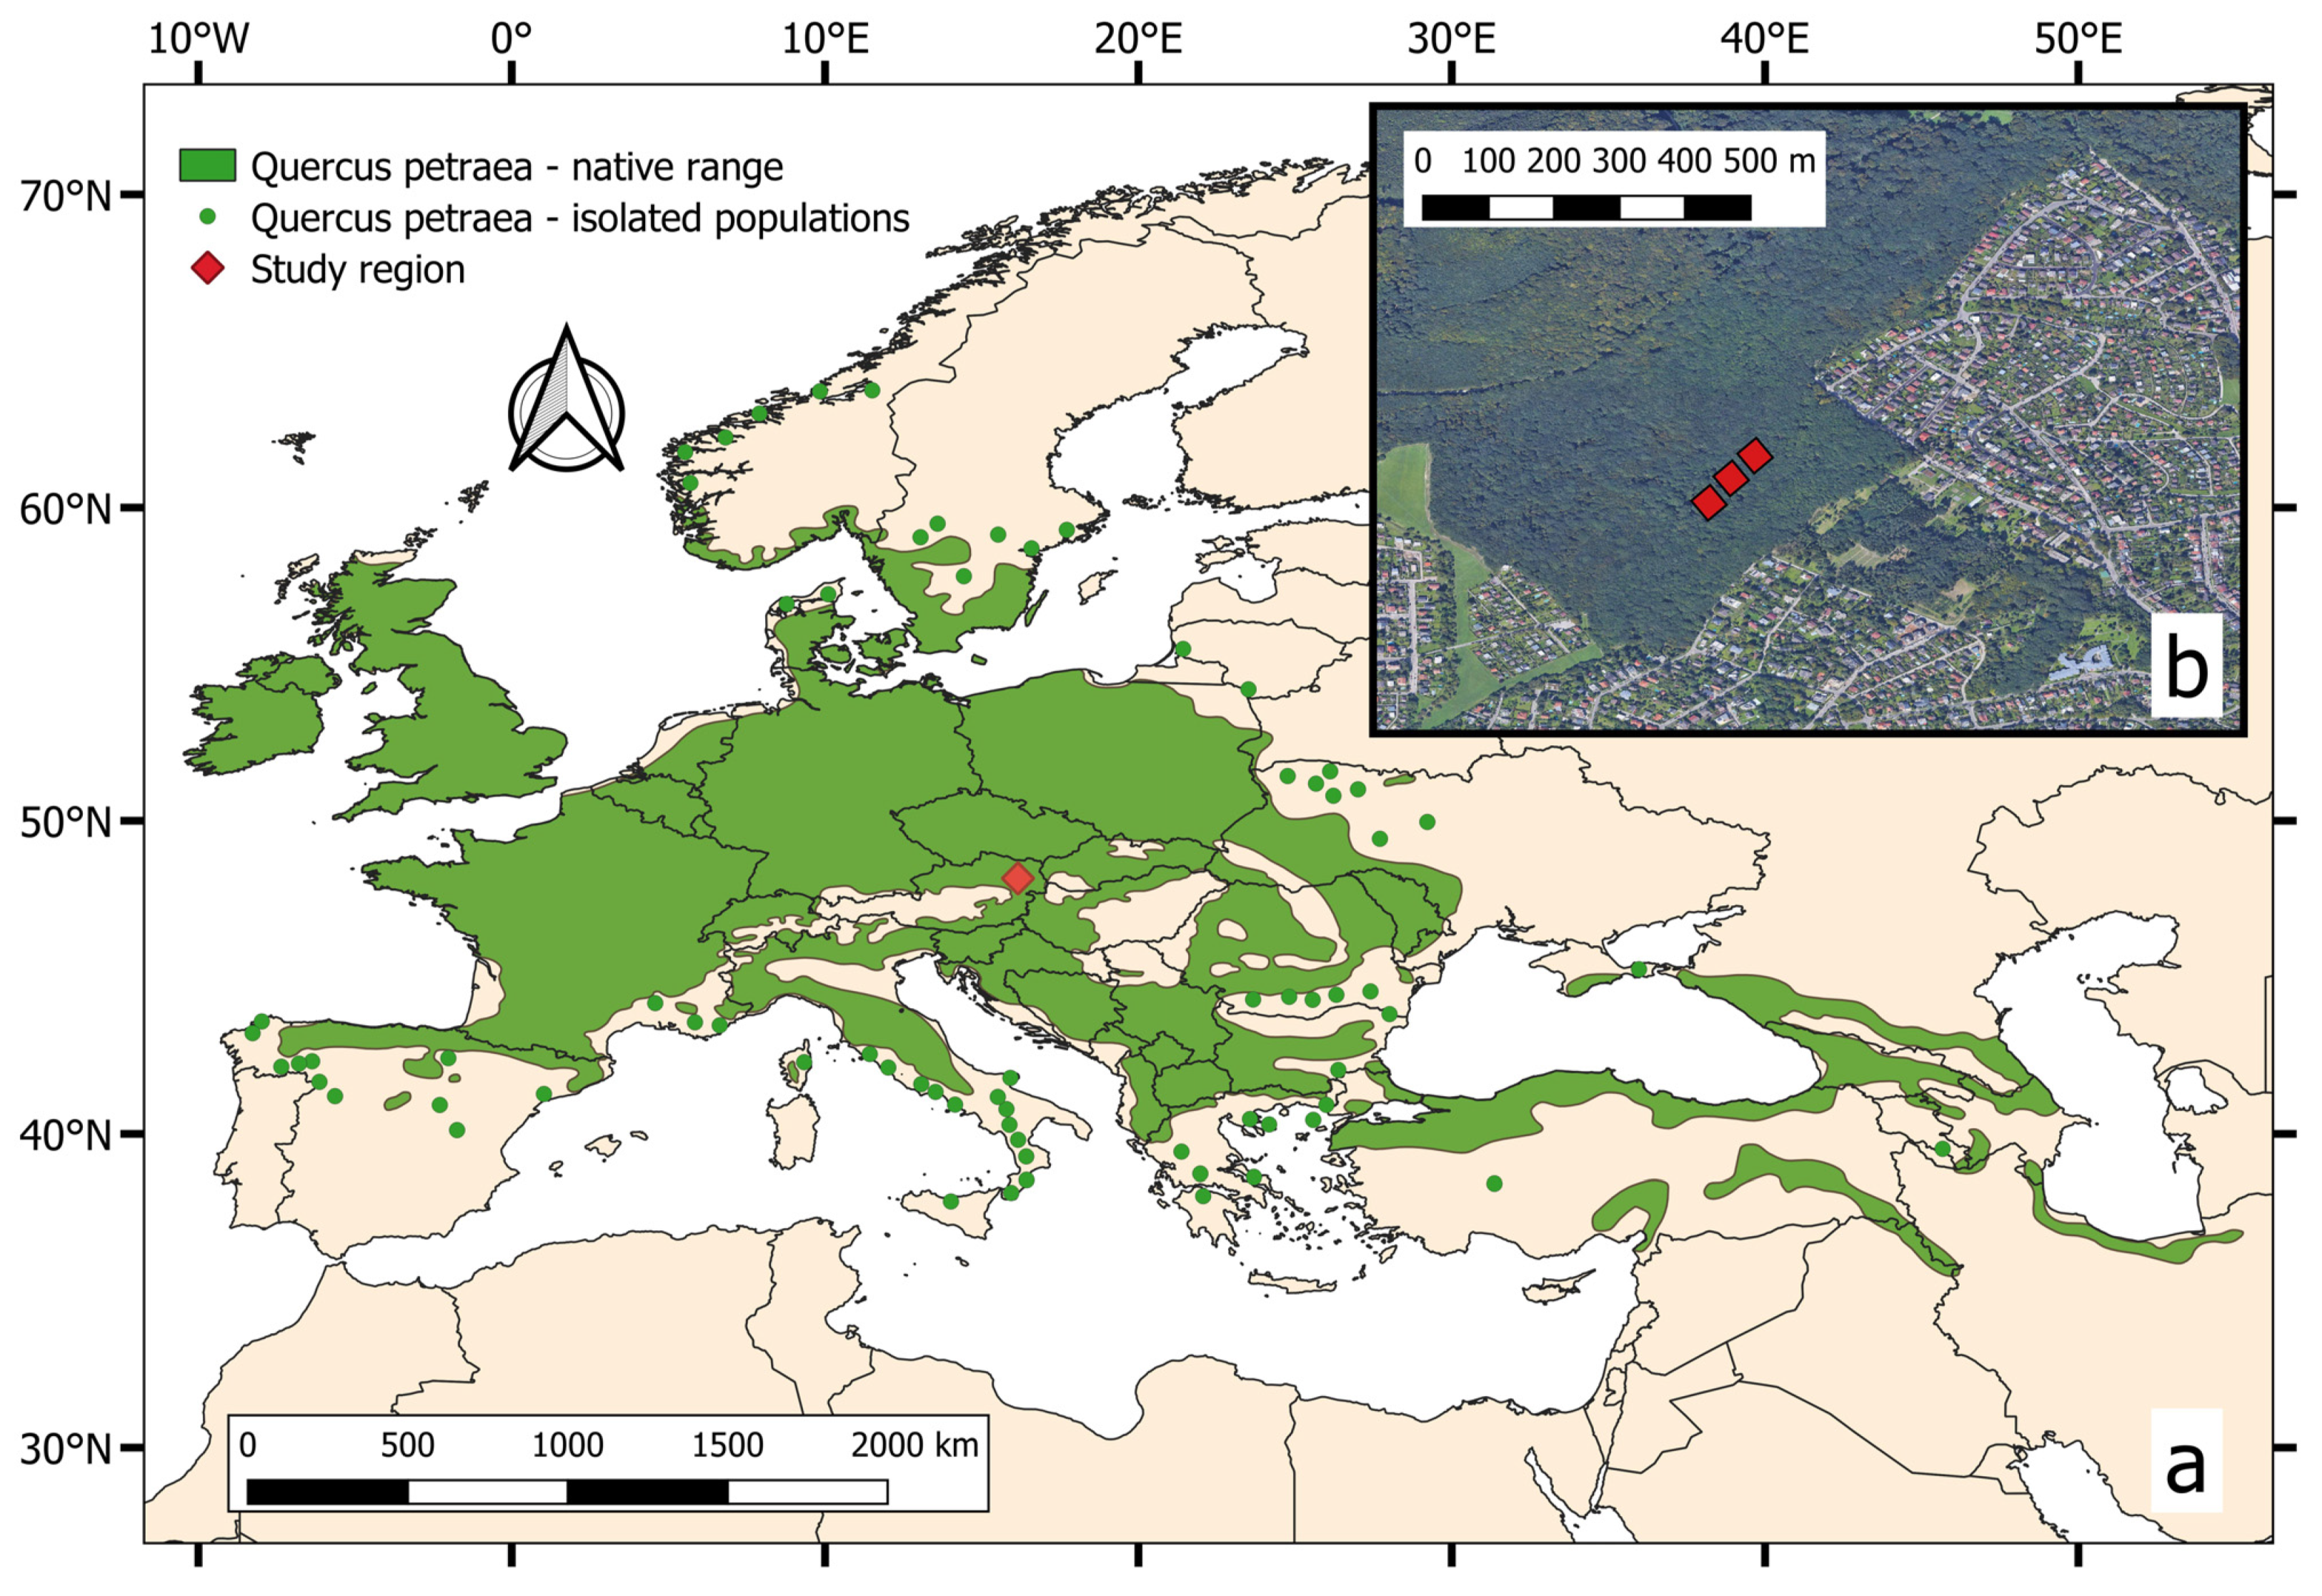
2.1. Data

We used data from a thinning trial established in 2009 in a mixed oak-hornbeam forest in the ‘Vienna Woods’, near Vienna, Austria (Figure 1). The site locations are approximately 48.22° N and 16.24° E. The forests in the study region are owned and managed by the Vienna Forest Administration (a public entity of the City of Vienna). After World War II, large parts of the forests near Vienna, including the study sites, were harvested to meet the demand for wood and the current stands are a result of that activity. Thus, the stands in this area have a similar stand structure (two-layered, oak dominating the first, hornbeam the second) and age (first layer 80–120 years, second layer 30–40 years) and were unthinned prior to 2009. Parts of the Vienna Woods are now a UNESCO biosphere reserve. The average annual precipitation is 630 mm, average annual potential evapotranspiration is 768 mm, and average daily temperature is 9.4 °C [26,27]. The aridity index using the UNEP definition is 0.82 mm/mm (annual precipitation sum/potential evapotranspiration) and Führer’s aridity index is 6.64 °C/mm [22]. From 1960 to present, precipitation exceeded potential evapotranspiration in fewer than ten years (Figure A1), confirming that these forests are usually water-limited [28,29]. More details on the study region can be found elsewhere [4].
Three plots were studied with a size between 0.2 to 0.25 hectares. A larger plot size was favoured over replications, because the terrain is heterogeneous and replicating the plots would have compromised the comparability of the site conditions. Within the same area, a grid-based forest inventory system (not used here) was established, using angle count sampling (‘Bitterlich sampling’) [31]. The elevation is about 300 m above sea level. The three plots are located within 20 m distance (about one tree length) along a footpath/skid trail used for harvesting (Figure 1b).
Two plots were thinned in 2009 (chainsaw and skidding on the ground) and one plot was kept unthinned as control. The treatments were (1) moderate thinning (removal of ~50% basal area) and (2) heavy thinning (removal of ~70% basal area). The moderate thinning was intended to induce more regeneration from seeds by more homogenous seed fall, in particular of Quercus spp. The thinning primarily targeted small-middle sized trees up to about 30 cm DBH (mostly hornbeam) to promote growth of larger-sized more valuable trees.
The plots were measured three times, in 2009, 2014 and 2019. For each tree reaching breast height (1.3 m above ground), the diameter at breast height (DBH), tree height, tree status (alive, standing dead, harvested), and species was determined.

2.2. Analysis

We computed the following stand structure metrics—basal area, stem density, average tree height, stand volume [32], and yield class, defined as average periodic increment at stand age of 100 years using the yield table ‘Eiche Ungarn’ [33]. We calculated species mixture (%) based on contribution to stand basal area of sessile oak, Quercus petraea (Matt.) Liebl. (pooled with occasional Turkey oak, Quercus cerris L.), European hornbeam, Carpinus betulus L., and European beech, Fagus sylvatica L. We calculated these stand structure metrics for 2009, 2014, and 2019, and for the two thinned plots, for both before and after thinning in 2009. More details on tree species, and their diameters and heights, are available in Figure A3 and Figure A6.
We calculated stem density by 10 cm diameter classes to explore potential changes in the stand structure and contributions of the species to the overall stem density, shown in Table 1. We calculated stand-level increment and losses (BA2 is zero) for the two periods with remeasurements (2009–2014 and 2014–2019, each spanning 5 years), after Equation (1).
BA_inc = (BA2 − BA1)/5
We explored the increment of single trees by calculation of the annual diameter increment per tree and analysed the role of tree size on increment using DBH. Because few trees had a DBH greater 40 cm, we separated 0–20 cm DBH and >20 cm DBH trees, and used Welch’s t-test to check for significant differences in diameter increment with tree size. We finally compared tree survival over a 10-year period between 2009 (after thinning) and 2019 to understand the combined effects of tree size and thinning intensity on tree survival.

3. Results

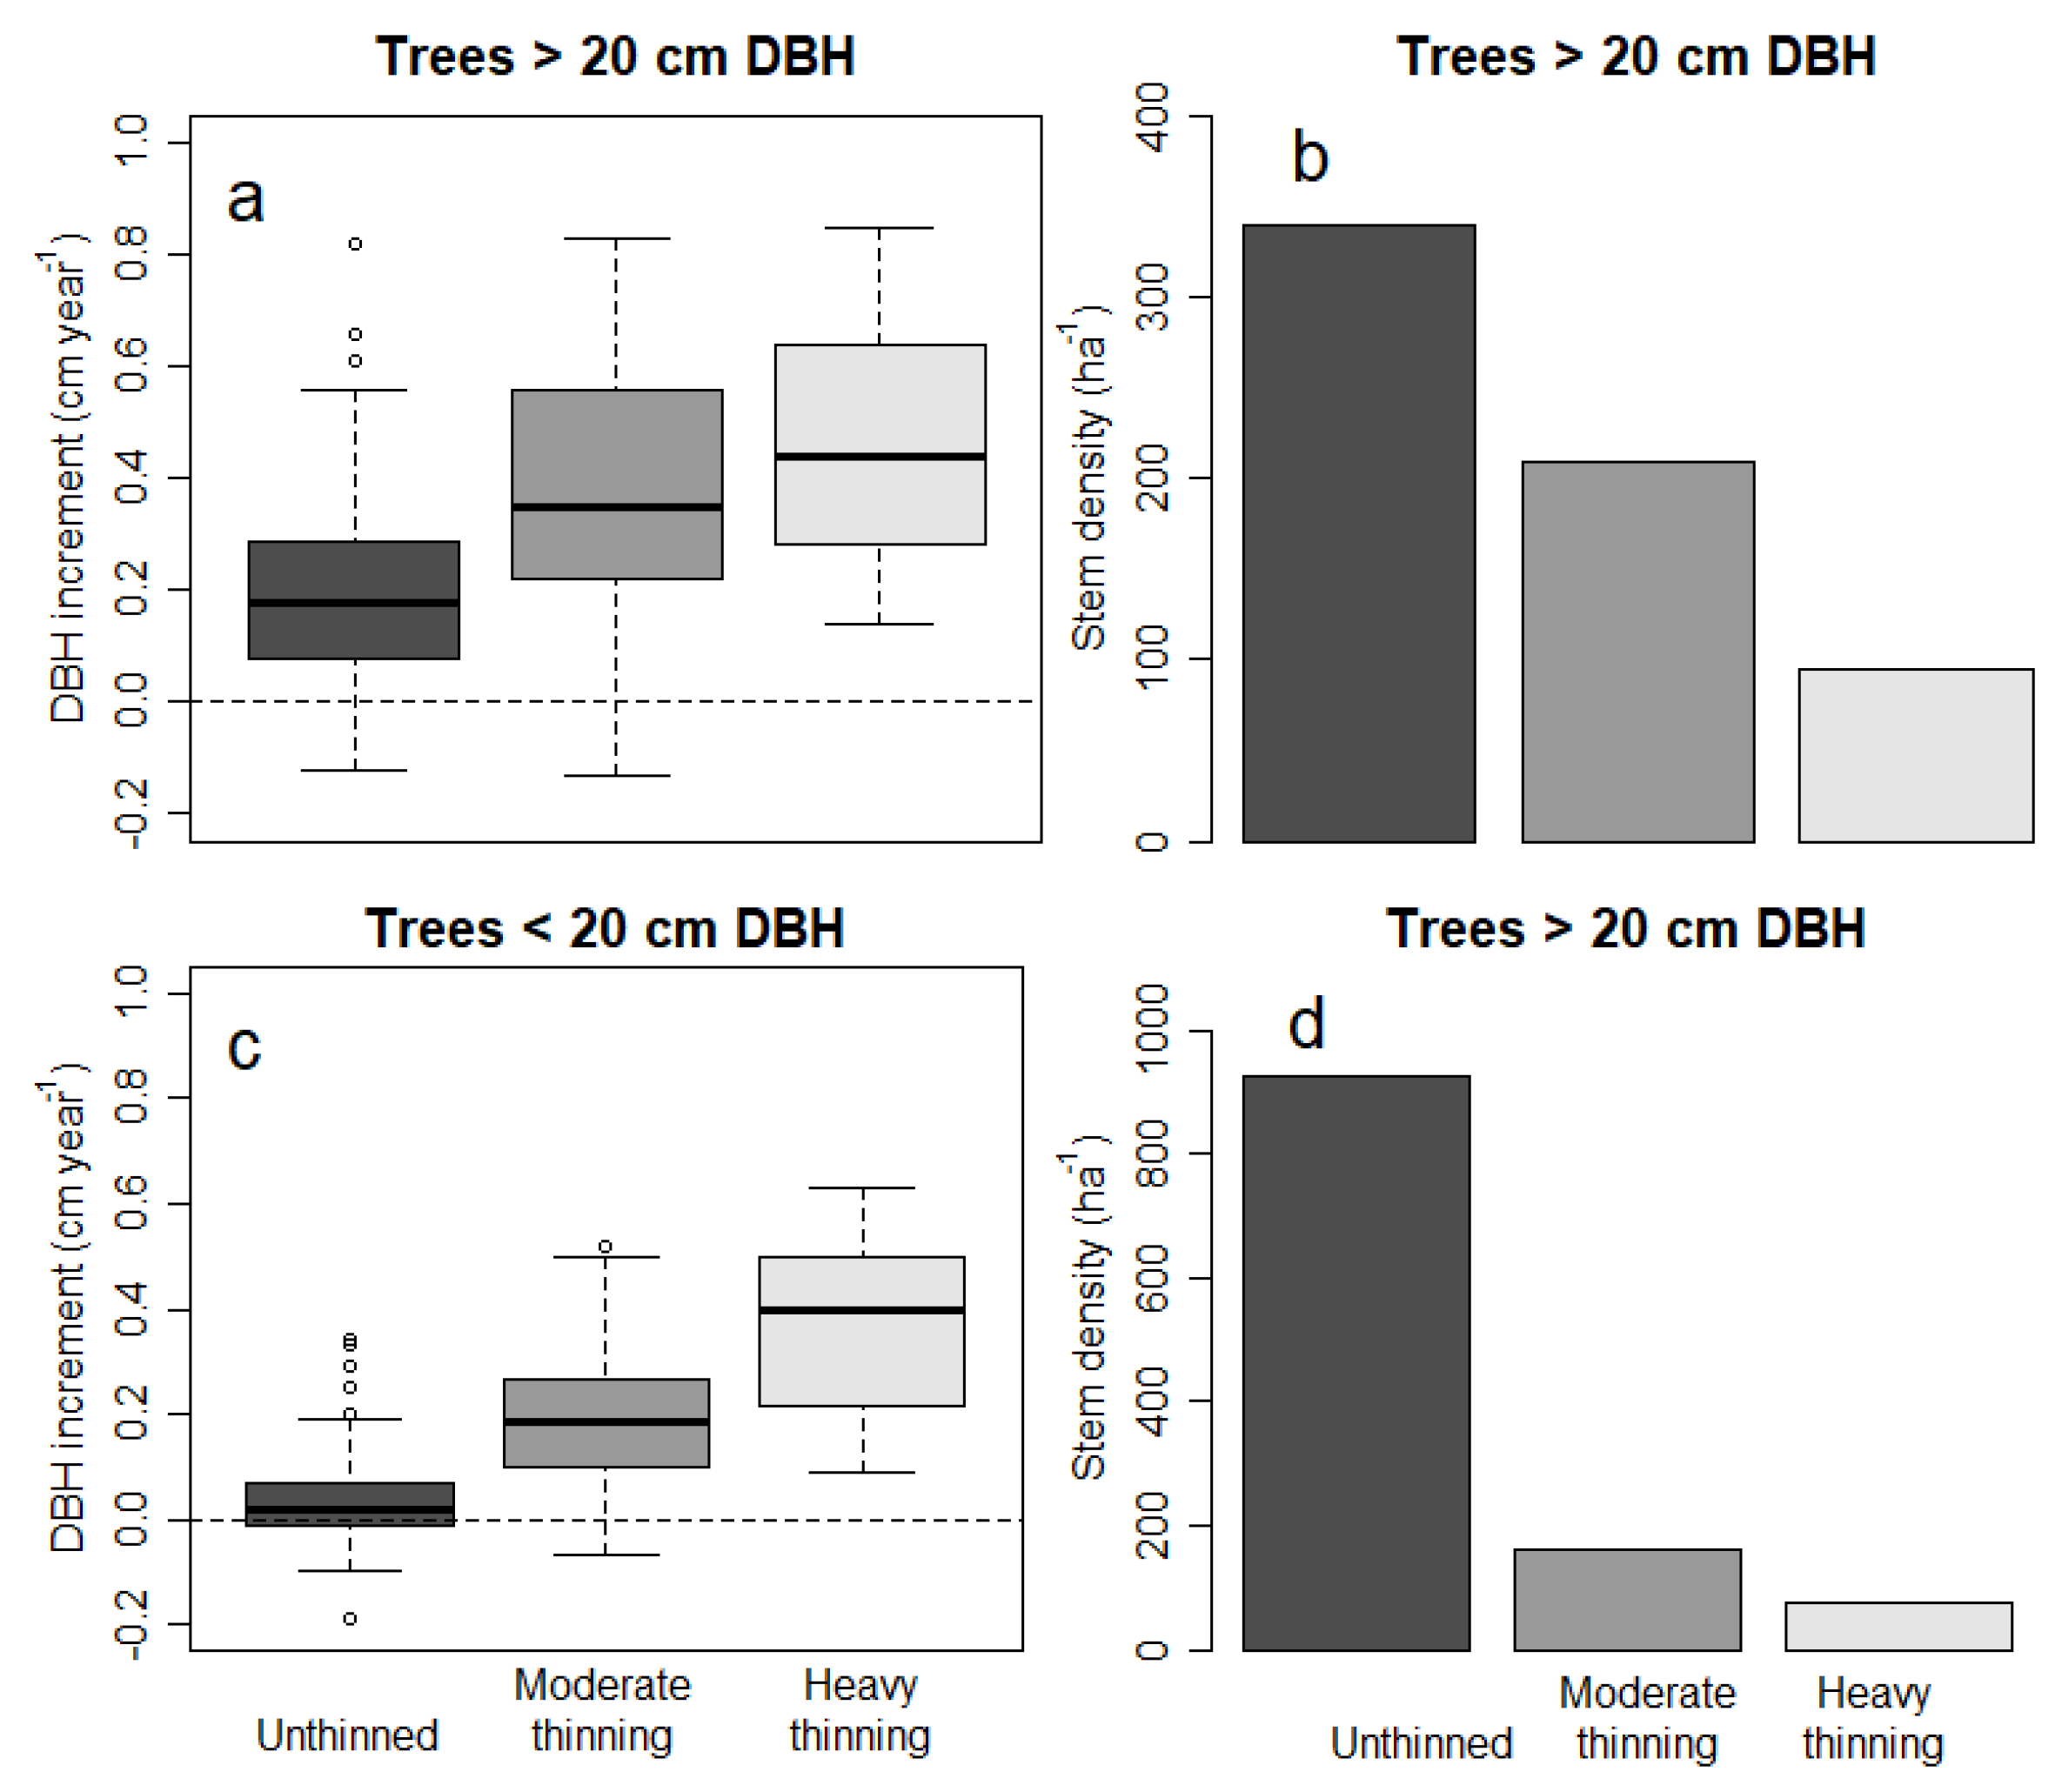
3.1. Thinning and Stand Structure

The basal area of unthinned oak-hornbeam forests near the city of Vienna did not increase after reaching 38–40 m2 ha−1 (Figure 2a). Although the basal area remained largely constant, the stem density continued to decrease for the unthinned stand and, thus, the average tree size increased (Figure 2b). For thinned forests, by comparison, the basal area increased and approached the basal area of the unthinned stand. The net increase in the basal area occurred because increment exceeded mortality (see next section). We also noted a constant stem density for thinned forests (independent of thinning intensity), and no mortality and no recruitment were observed within 10 years after thinning (Figure 2b). Proportionally, the thinning removed more stem density than basal area, and, in consequence, the harvesting targeted smaller diameter stems (see also the diameter distribution in Figure A2).
The stem density distributions of the three stands before thinning in 2009 were similar (Figure A2). We noted initially more trees with 10–20 cm DBH in the heavily thinned stand, whereas the moderately thinned stand had fewer trees with 0–10 cm and 20–30 cm DBH than the two other stands (Figure A2a). In contrast to the heavy thinning, trees with 0–10 cm were retained at a density of 60 ha−1 in the moderately thinned stand (Figure A2b). For the unthinned stand, stem density decreased from 2009 to 2019, particularly for trees below 20 cm DBH. From these results, we cannot determine the processes behind the observed changes in stand structure over time. Because each tree was observed separately, we were able to analyse increment and losses in terms of basal area.

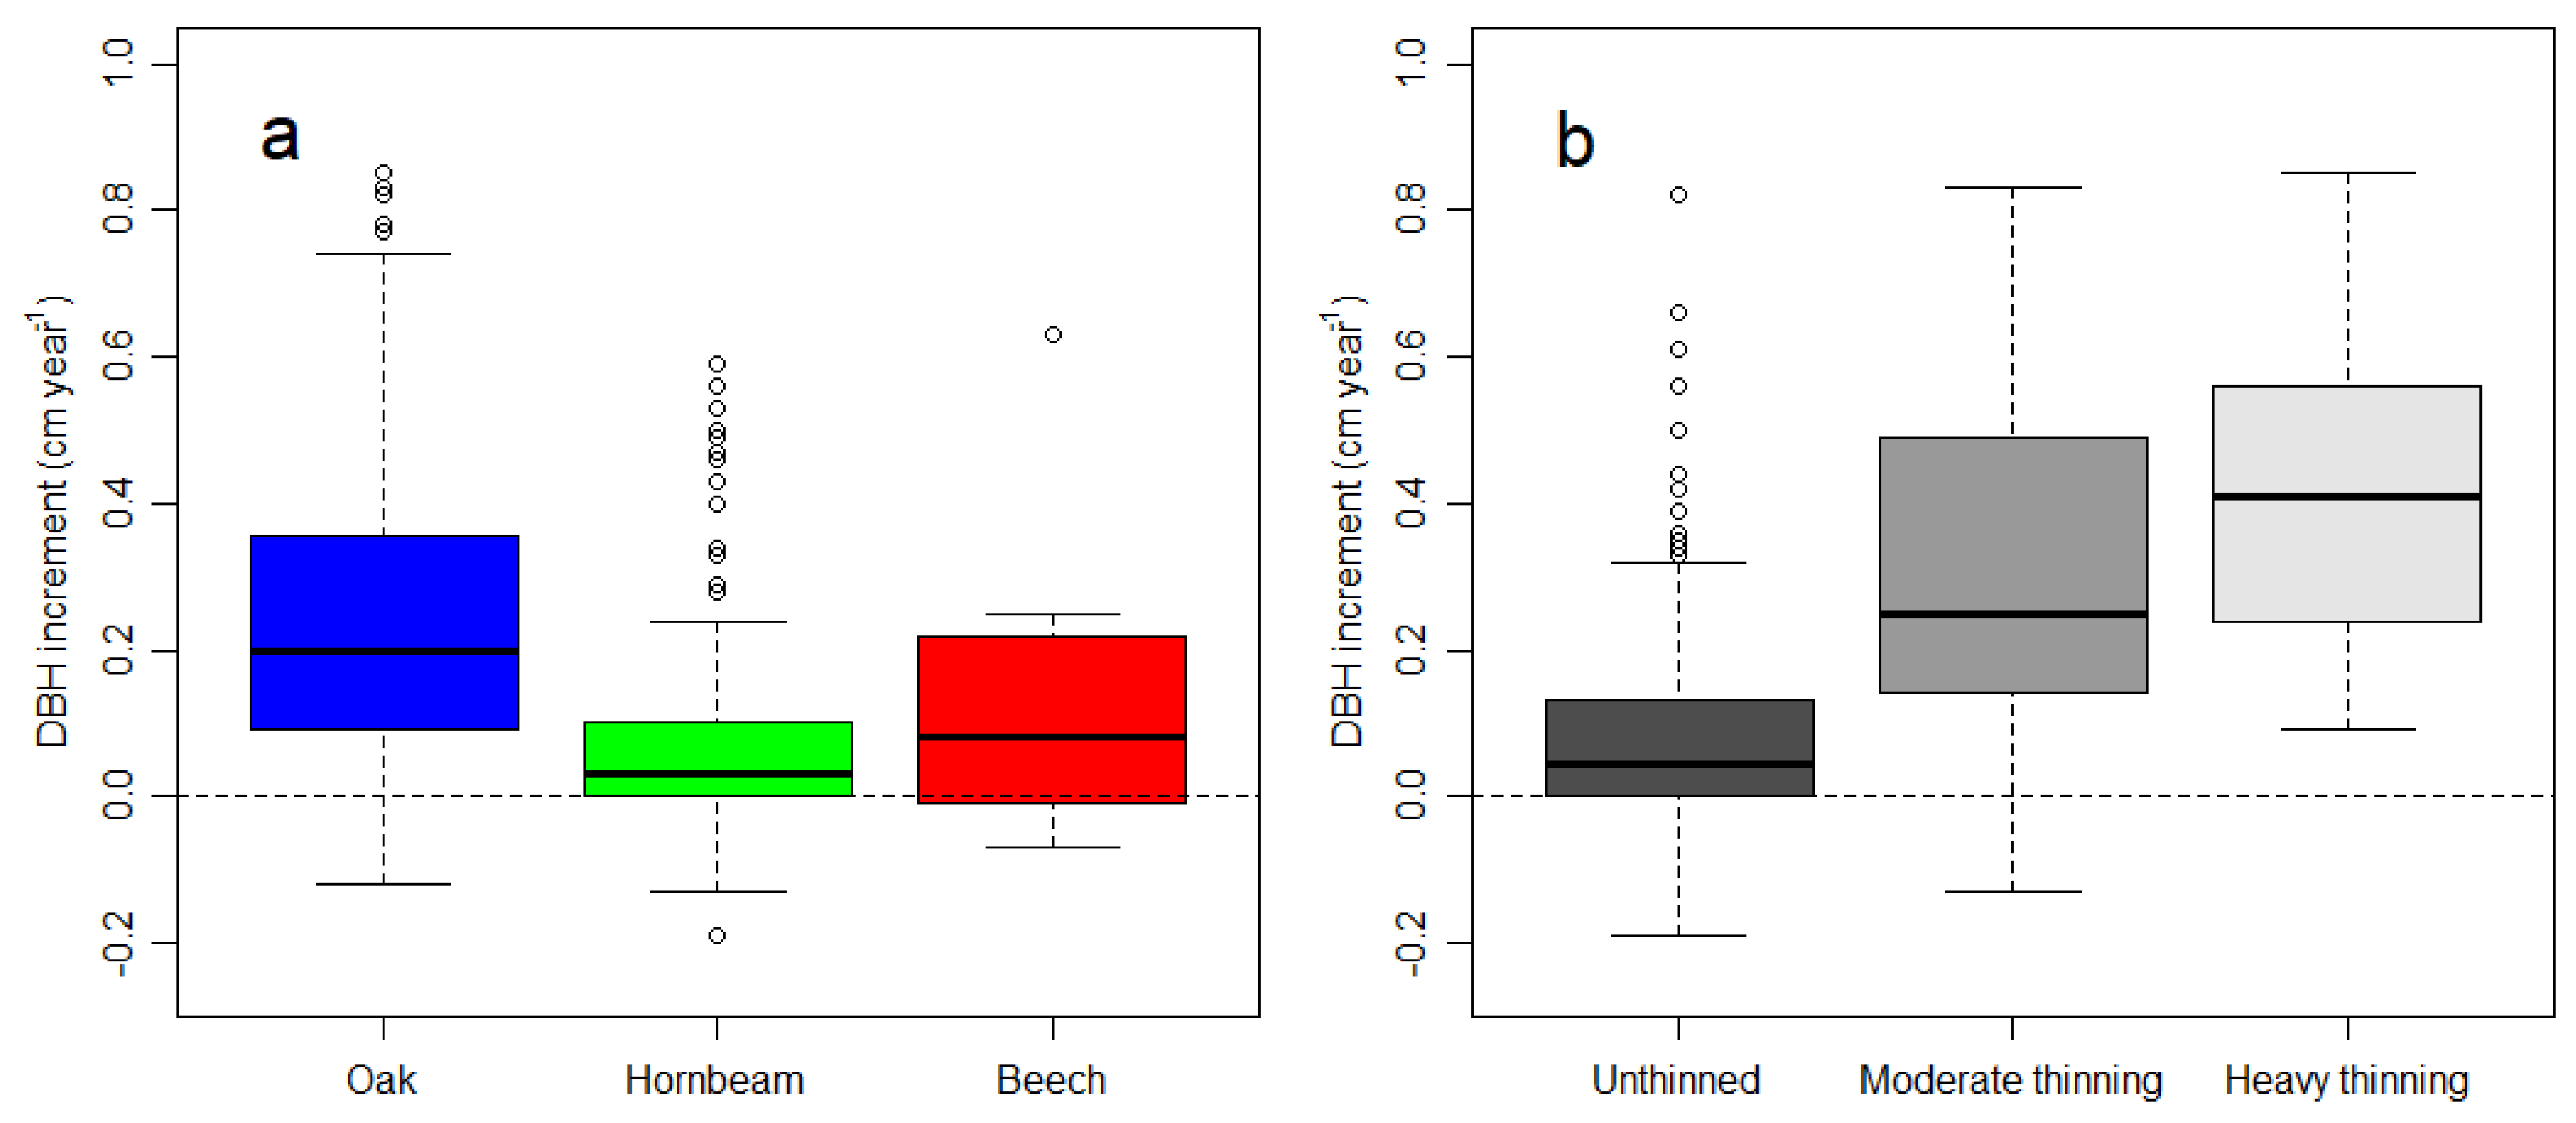
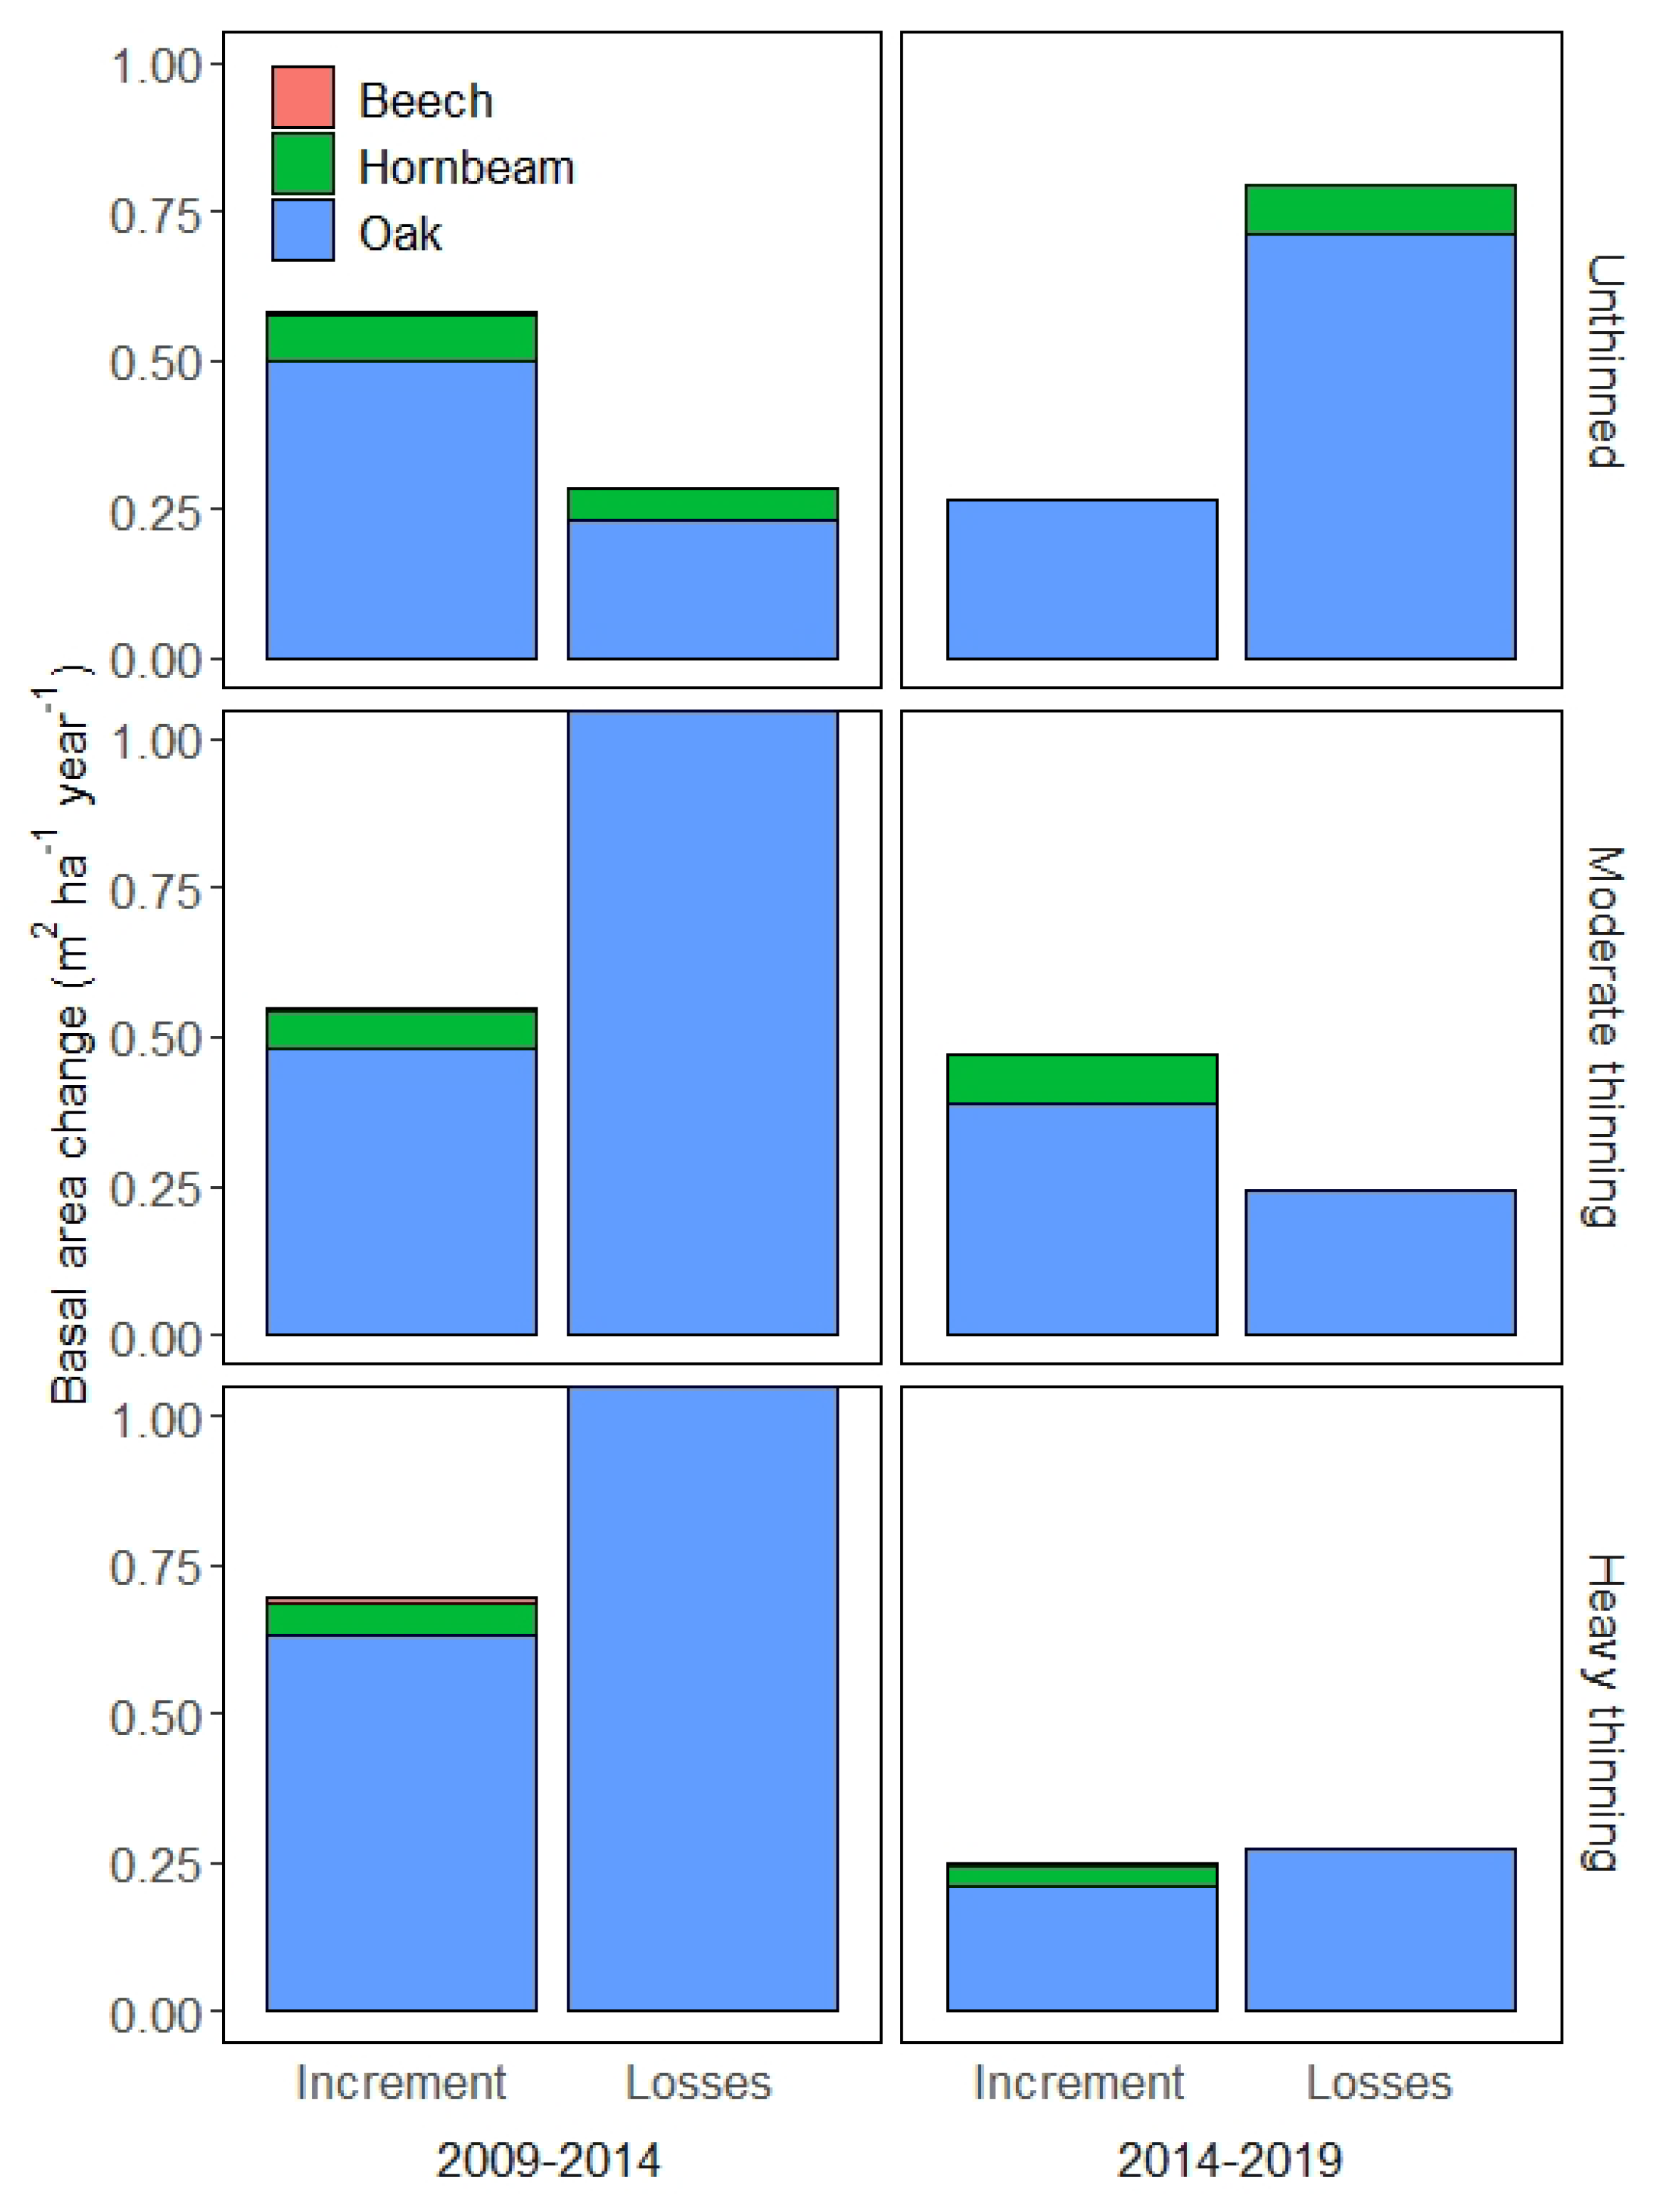
3.2. Increment and Losses

We measured the plots three times after thinning in 2009 and calculated the increment and losses (i.e., mortality and harvesting) for two periods, 2009–2014 and 2014–2019. The balance of the increment and losses determines the net change, i.e., whether a stand accumulates or loses basal area. The forests in the study region were mixed and composed predominantly of oak and hornbeam (Table 1, Figure A3). In Figure 3, we show the increment and losses separately for oak, hornbeam, and beech, which is a minor admixed species. Hornbeam and beech had smaller diameters and smaller diameter increments (Figure A3 and Figure A7).
Between 2009 and 2014, immediately after thinning in 2009, the increment ranged between 0.54 and 0.69 m2 ha−1 year−1, and oak contributed by far the most (>85%) to the increment. The unthinned stand with the highest basal area (37 m2 ha−1) had the second largest increment (0.58 m2 ha−1 year−1) and the heavily thinned stand with the lowest basal area (11 m2 ha−1) was the fastest growing (0.69 m2 ha−1 year−1). The smallest increment was observed between 2009 and 2014 for the moderately thinned stand (basal area of 16 m2 ha−1), of 0.54 m2 ha−1 year−1. The increment was considerably lower than the losses for the two thinned stands, because harvesting removed 30–50% of basal area and the ratio between the losses and the increment was about 7.4; thus, seven times more basal area was lost than gained by increment (Figure 3). The net change for unthinned stand, in contrast, was positive (0.58 − 0.29 = +0.29 m2 ha−1 year−1).
Five to ten years after thinning in 2014–2019, these patterns considerably changed. The unthinned stand lost three times more basal area (solely due to mortality) than grew through increment. The climate conditions did not vary considerably between the two periods (Figure A1). The stand that grew less in the previous period (high forest conversion) was subsequently the only stand with a positive net change in basal area (Figure 3). We note here that, despite the reduction in plot basal area by 30–50%, there was still considerable mortality in the two thinned stands, although the mortality rate was three times smaller than mortality under unthinned conditions. The largest loss due to mortality was found for the stand with the highest basal area (unthinned in 2014–2019, Figure 2 and Figure 3). Thinning primarily targeted small diameter trees (Figure 3) and natural mortality under unthinned conditions was also more frequent for trees <20 cm DBH (Figure A4). We were next interested whether thinning (naturally through mortality or artificially through harvesting) led to an increase in the diameters of larger trees.
Larger trees grew faster across the three studied stands based on the 10 year diameter increment between 2000 and 2019, and grouped using 20 cm DBH to separate large and small trees (Figure 4a,c). Small trees were more abundant than large trees (Figure 4b,d). A more detailed grouping of trees according to their DBH showed that few trees had a DBH larger than 40 cm (Figure A2, Figure A3 and Figure A4). For the dense, unthinned stand, we noted a significant effect of tree size on diameter increment, with large trees growing significantly faster (p < 0.001). For the two thinned stands, the faster increment of large trees was not significantly different from that of small trees (p 0.123 heavy thinning, p 0.149 moderate thinning). There was a clear link between faster diameter increment and thinning intensity (see also Figure A5). Negative diameter increments, presumably caused by bark shedding of slow growing trees, were most frequent in the unthinned stand (Figure A5 and Figure A7). Under unthinned conditions, the diameter increment was smallest (Figure 4 and Figure A7), consistent with larger stem density; however, the increment was comparable at the plot level (Figure 3). Thinning increased the diameter increment 2–2.5-fold for large trees having >20 cm DBH and even 7–9 times for trees with DBH smaller than 20 cm. The diameter increment did not vary significantly by thinning intensity, for both large and small trees, despite a larger average increment for the strongly thinned stand (Figure 4). Comparing both thinned stands with unthinned conditions showed a significantly larger increment associated with thinning, irrespective of whether 30 or 50% of the basal area was removed.

4. Discussion

Our study indicates (1) that the studied oak-hornbeam forests respond well to thinning, both at the stand and tree levels; (2) that maximum basal area is reached at 35–40 m2 ha−1, where increment stagnates and mortality becomes more frequent; and (3) both harvesting and natural mortality result in reduction in the density of small diameter trees, whereas harvesting concentrates the growth on the (fewer) remaining trees more efficiently. Below, we separately discuss these topics and their relevance for carbon sequestration and habitat value.

4.1. Thinning Response

The thinning applied in the study region removed a considerable share (50–70%) of the basal area, mostly composed of trees with DBH smaller than 30 cm. This reduced the basal area and in situ carbon storage, assuming that basal area is correlated with tree carbon [34]. Basal area measurements require less time, e.g., using sampling-by-diameter [31,35], than measuring both diameters and tree height, which are needed to accurately estimate tree volume using an allometric function [32,36]. In this study, the reduction in tree carbon by removing small diameter trees (‘thinning from below’) is most likely smaller, because mostly hornbeam trees with smaller diameter and smaller tree height were removed (Figure A6, Table 1). Hornbeam and beech trees exhibited lower diameter increments than oak (Figure A7). A large number of small trees collectively have a smaller volume than a few large trees [36].
Diameter increment increased more than two-fold for trees larger than 20 cm DBH; thus, the carbon allocation into larger sized wood more than doubled (Figure 4). For trees smaller than 20 cm DBH, the increase in increment by thinning is even larger, particularly after removing 50% of the basal area. Large diameter coarse woody debris has slower decay and thus longer carbon residence time [37]. Additional benefits of more and larger-sized trees include more flexibility in potential wood products [38] and more diverse habitat; for instance, for cavity-dwelling animals and other organisms specialising in large-dimension wood [39]. For carbon accounting purposes, internal decay of large trees needs to be considered to avoid overestimating biomass and, in consequence, carbon stocks by applying allometric functions [40,41].

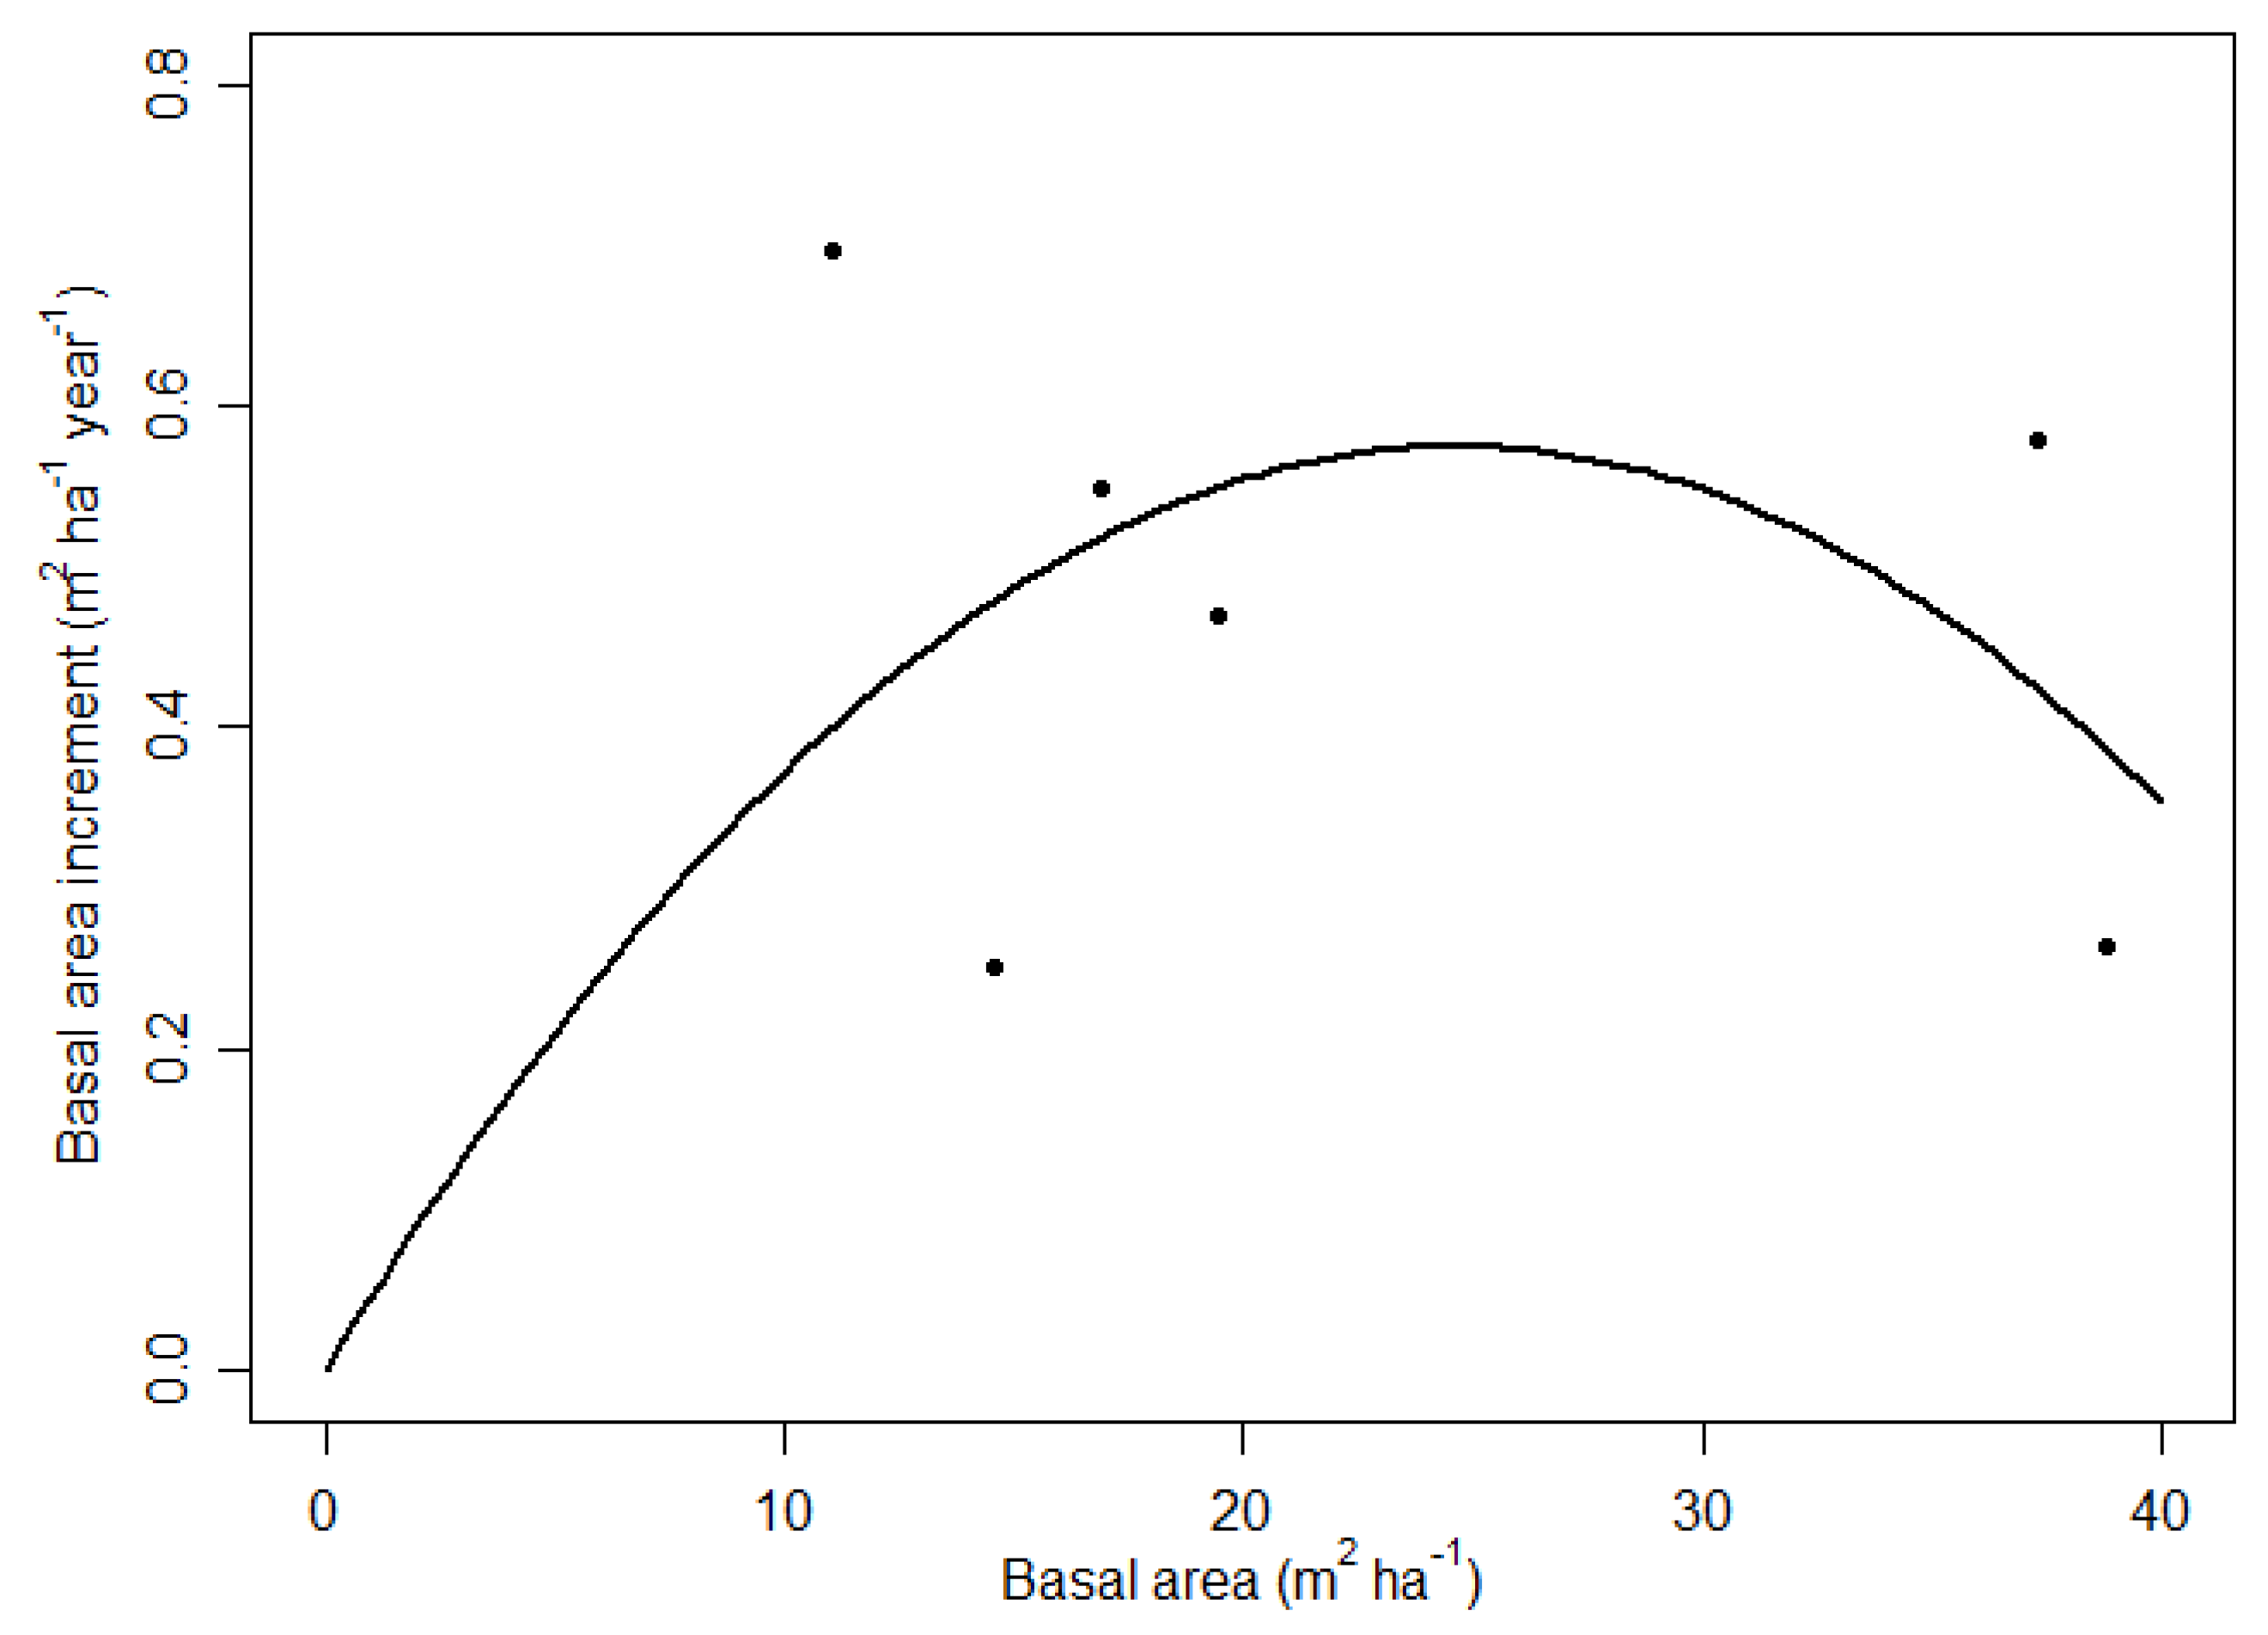
4.2. Maximum Basal Area

Our results suggest that the studied oak-hornbeam stands have a maximum basal area of 35–40 m2 ha−1 (Figure 2). In the unthinned stand, the increment ranged between 0.25 and 0.6 m2 ha−1 year−1, and mortality due to competition is in the same range. The basal area remained largely unchanged over the 10 year measurement period. There is scant published information on the maximum basal area of unmanaged oak-hornbeam forests. A study on oak-hornbeam stands on floodplains in Northern Italy reported stagnating basal area at about 25–30 m2 ha−1 [42]. With an average temperature of 13.2 °C and total annual precipitation of 658 mm, the Italian study had a similar precipitation but a temperature of almost 4 °C higher than this study. The Italian stands were reportedly unmanaged since the 1980s, and earlier a coppice with a standards system was in place (similar to the management applied to the intensively thinned stand of this study).
In Romania, the Runcu-Grosi Natural Reserve has a stem density of 713 ha−1, growing stock of 577 m3 ha−1, and basal area of 39.3 m2 ha−1 [43]. The annual temperature ranges between 7.6 and 9.4 °C, and total precipitation from 750 to 925 mm; thus, the Romanian stands had similar a temperature and higher precipitation than the stands used in this study (9.4 °C, 630 mm) based on gridded climate data [26]. In a nearby study (about 2 km northwest of our study site) an ‘overmature’ coppice (dominated by oak and hornbeam) had a stem density (>5 cm DBH) of 1881 ha−1, growing stock of 412 m3 ha−1, and basal area of 45.6 m2 ha−1 [8]. An earlier Austrian study [8] did not measure or report the increment or mortality; thus, we can only assume that these stands were close to their maximum basal area. This suggests that oak-hornbeam stands in this region can have a basal area of up to 46 m2 ha−1, and thus about 6 m2 ha−1 more than that observed in this study. Most likely the authors included dead standing trees in this reported basal area [8], because the authors compared the total carbon stocks of oak stands. We note that in this study dead trees were not tallied.
The available literature suggests that oak-hornbeam forests have a maximum basal area of about 40 m2 ha−1, where the carbon pool in live trees is highest (using the basal area as a proxy for carbon). This study provides evidence that increment stagnates at this point and mortality exceeds increment (cf. Figure 4), resulting in a net decrease in basal area/carbon in live trees. Plotting increment versus basal area [11] indicates that oak-hornbeam stands may have a rather wide ‘plateau’, where basal area is largely unaffected by decreasing basal area (Figure 5). This was an unexpected result because initially we expected a stronger decrease in increment for the heavy thinned stand. This means that (1) oak and hornbeam are plastic tree species and utilise the additional available resources (light, water, nutrients) made available through thinning; and (2) oak-hornbeam stands can be thinned by up to 70% basal area without decreasing increment. It is important to maintain crown cover across the area with even distribution of retained trees and primarily targeting small-mid diameter trees, to reach the same outcome as that found by this study. Further research is needed to test the effects of targeting large diameters when thinning, such as in a selective final harvest or shelterwood cut.

4.3. Harvesting versus Natural Mortality

Tree death by harvesting or mortality results in decreasing stem density. Over ten years, natural mortality reduced stem density by about 250 ha−1, whereas thinning removed 1760–1955 ha−1. Assuming net basal area increment of 0.25 m2 ha−1 year−1, it will take another 60–70 years to reach pre-thinning basal area. A thinned stand will be composed of a smaller number of large trees (Figure A4) than can be expected under unthinned conditions. We noted mortality of about 0.25 m2 ha−1 year−1, irrespective of whether a stand had been recently thinned, when comparing the unthinned stand in 2009–2014 with the thinned stands in 2014–2019 (see Figure 3). Although studying the reasons for these surprisingly large losses were beyond the scope of this study, this study provides some indication about natural mortality and the rate of deadwood increase. The trees in the studied stands grew in height until about 30 cm DBH, reaching their maximum height at about 25 m (Figure A6). Because thinning mostly targeted small trees, the average tree height in the two thinned stands increased by 4.5 to 5 m (Table 1). Because tree volume can be estimated as the product of basal area, average tree height, and a form factor, the increase in average tree height through thinning partly compensates for the lower basal area after thinning. Considering two stands with the same basal area but different tree diameters (and in consequence tree height), the stand with large trees can be expected to have a larger stand volume.
In conclusion, harvesting speeds up the natural process of tree mortality. Thinned stands have had, for several decades, a lower basal area than that of unthinned stands. Evaluating the effects of thinning on forest carbon stocks requires measurements of standing and lying deadwood and coarse woody debris [37,44], reliable biomass functions, and accurate tree height measurements [36,45]. This case study provides some evidence that oak-hornbeam forests may have a broad “plateau-like” relationship between increment and stocking (Assmann 1970), when stands approach their maximum basal area. Our results encourage verifying whether similar patterns can be found in contrasting soil and climate conditions and other widespread Central-European tree species, such as Fagus sylvatica or Picea abies.

5. Conclusions

We demonstrate that the oak-hornbeam forests studied here have a maximum basal area of 35–40 m2/ha, at which further net accumulation of basal area slows considerably. This decrease in net accumulation is caused by increasing mortality and stagnating increment as stands approach their carrying capacity. This study suggests that, for continued uptake (i.e., carbon, biomass, or volume), the stocking of forest ecosystems has to be below the potential steady state. Continued carbon uptake by live trees, and thus maintaining the carbon sink in a forest, can be achieved by harvesting or natural mortality.

Author Contributions

Conceptualization, M.N. and H.H.; formal analysis, data curation, writing—original draft preparation, M.N.; writing—review and editing, M.N. and H.H.; funding acquisition, H.H. All authors have read and agreed to the published version of the manuscript.

Funding

The research was funded by the University of Natural Resources and Life Sciences, Vienna.

Data Availability Statement

The data used in this analysis is available over https://figshare.com/articles/dataset/Thinning_response_of_oak-hornbeam_forests_near_Vienna_Austria/14604546 (accessed on 4 October 2021) and is also available from the corresponding author upon request.

Acknowledgments

We thank the Viennese Forest Administration for permission to establish and maintain the research sites. We are grateful for the logistic support and field measurements by Raphael Klumpp and Franz Reinthaler.

Conflicts of Interest

The authors declare no conflict of interest.

Appendix A

Figure A1. Annual precipitation sum (P, solid black line) and annual potential evapotranspiration (PET, solid red line) in the study area using gridded climate data [27]. Dashed vertical lines indicate the three measurements—2009, 2014 and 2019. P larger PET indicate positive water balance and water surplus (i.e., more rainfall than energy input for water evapotranspiration).
Forests 12 01354 g0a1
Figure A2. Stem density by diameter at breast height (DBH) classes in centimetres. For 2009, we show the conditions before thinning.
Forests 12 01354 g0a2
Figure A3. (a) Stem density in 2009 before thinning grouped into 10 cm DBH classes with colour-coded species. (b) Oak includes sessile oak Quercus petraea and Turkey oak Quercus cerris, (c) European hornbeam Carpinus betulus, European beech Fagus sylvatica.
Forests 12 01354 g0a3
Figure A4. (a) Stem density in 2009 and the share of dead trees by 2019. No mortality occurred between 2014 and 2019 for the thinned stands. (b) The share of dead trees compared to stem density in 2009 is 18.2% for unthinned conditions, (c) 12.8% for moderate thinning, and 9.8% for heavy thinning.
Forests 12 01354 g0a4
Figure A5. DBH increment (2009–2019) versus DBH of repeatedly measured trees (see Figure 4) grouped by the three stands. We show trend lines for trees with <40 cm DBH.
Forests 12 01354 g0a5
Figure A6. Diameter at breast height (DBH) versus tree height of all measured trees in the three stands with colour-coded species. We show all observations from 2009, 2014, and 2019.
Forests 12 01354 g0a6
Figure A7. DBH increment by species (a) and by stand (b). The boxes represent the median and the 25th and 75th percentile, the whiskers extend to 1.5 of the interquartile range. Observations outside the interquartile range are shown as dots.
Forests 12 01354 g0a7

References

  1. Caudullo, G.; Welk, E.; San-Miguel-Ayanz, J. Chorological maps for the main European woody species. Data Br. 2017, 12, 662–666. [Google Scholar] [CrossRef]
  2. BFW. Österreichische Waldinventur. 2017. Available online: http://bfw.ac.at/rz/wi.home (accessed on 4 March 2021).
  3. Haneca, K.; Van acker, J.; Beeckman, H. Growth trends reveal the forest structure during Roman and Medieval times in Western Europe: A comparison between archaeological and actual oak ring series (Quercus robur and Quercus petraea). Ann. For. Sci. 2005, 62, 797–805. [Google Scholar] [CrossRef] [Green Version]
  4. Pötzelsberger, E.; Wolfslehner, B.; Hasenauer, H. Climate change impacts on key forest functions of the Vienna Woods. Eur. J. For. Res. 2015, 134, 481–496. [Google Scholar] [CrossRef]
  5. Oettel, J.; Lapin, K.; Kindermann, G.; Steiner, H.; Schweinzer, K.; Frank, G.; Essl, F. Patterns and drivers of deadwood volume and composition in different forest types of the Austrian natural forest reserves. For. Ecol. Manag. 2020, 463, 118016. [Google Scholar] [CrossRef]
  6. Mölder, A.; Meyer, P.; Nagel, R.V. Integrative management to sustain biodiversity and ecological continuity in Central European temperate oak (Quercus robur, Q. petraea) forests: An overview. For. Ecol. Manag. 2019, 437, 324–339. [Google Scholar] [CrossRef]
  7. Ortmann-Ajkai, A.; Csicsek, G.; Hollos, R.; Kevey, B.; Borhidi, A. Comparison of spontaneous regeneration in unmanaged oak (Quercus robur L.) and beech (Fagus sylvatica L.) forests: Implications for close-to-nature silviculture. Austrian J. For. Sci. 2016, 133, 223–250. [Google Scholar]
  8. Bruckman, V.J.; Terada, T.; Fukuda, K.; Yamamoto, H.; Hochbichler, E. Overmature periurban Quercus–Carpinus coppice forests in Austria and Japan: A comparison of carbon stocks, stand characteristics and conversion to high forest. Eur. J. For. Res. 2016, 135, 1–13. [Google Scholar] [CrossRef]
  9. Stimm, K.; Heym, M.; Uhl, E.; Tretter, S.; Pretzsch, H. Height growth-related competitiveness of oak (Quercus petraea (Matt.) Liebl. and Quercus robur L.) under climate change in Central Europe. Is silvicultural assistance still required in mixed-species stands? For. Ecol. Manag. 2021, 482, 118780. [Google Scholar] [CrossRef]
  10. Zeller, L.; Pretzsch, H. Effect of forest structure on stand productivity in Central European forests depends on developmental stage and tree species diversity. For. Ecol. Manag. 2019, 434, 193–204. [Google Scholar] [CrossRef]
  11. Assmann, E. The Principles of Forest Yield Study; Pergamon Press: New York, NY, USA, 1970. [Google Scholar]
  12. Gavinet, J.; Ourcival, J.M.; Gauzere, J.; García de Jalón, L.; Limousin, J.M. Drought mitigation by thinning: Benefits from the stem to the stand along 15 years of experimental rainfall exclusion in a holm oak coppice. For. Ecol. Manag. 2020, 473, 118266. [Google Scholar] [CrossRef]
  13. Hochbichler, E.; Bellos, P.; Lick, E. Biomass functions for estimating needle and branch biomass of spruce (Picea abies) and Scots pine (Pinus sylvestris) and branch biomass of beech (Fagus sylvatica) and oak (Quercus robur and petrea). Austrian J. For. Sci. 2006, 123, 35–46. [Google Scholar]
  14. Suchomel, C.; Pyttel, P.; Becker, G.; Bauhus, J. Biomass equations for sessile oak (Quercus petraea (Matt.) Liebl.) and hornbeam (Carpinus betulus L.) in aged coppiced forests in southwest Germany. Biomass Bioenergy 2012, 1–9. [Google Scholar] [CrossRef]
  15. Del Río, M.; Calama, R.; Cañellas, I.; Roig, S.; Montero, G. Thinning intensity and growth response in SW-European Scots pine stands. Ann. For. Sci. 2008, 65, 308. [Google Scholar] [CrossRef] [Green Version]
  16. Jensen, F.S.; Skovsgaard, J.P. Precommercial thinning of pedunculate oak: Recreational preferences of the population of Denmark for different thinning practices in young stands. Scand. J. For. Res. 2009, 24, 28–36. [Google Scholar] [CrossRef]
  17. Tyrväinen, L.; Silvennoinen, H.; Kolehmainen, O. Ecological and aesthetic values in urban forest management. Urban For. Urban Green. 2003, 1, 135–149. [Google Scholar] [CrossRef]
  18. Fedorová, B.; Kadavý, J.; Adamec, Z.; Kneifl, M.; Knott, R. Response of diameter and height increment to thinning in oak-hornbeam coppice in the southeastern part of the Czech Republic. J. For. Sci. 2016, 62, 229–235. [Google Scholar] [CrossRef] [Green Version]
  19. Schmitt, A.; Trouvé, R.; Seynave, I.; Lebourgeois, F. Decreasing stand density favors resistance, resilience, and recovery of Quercus petraea trees to a severe drought, particularly on dry sites. Ann. For. Sci. 2020, 77. [Google Scholar] [CrossRef]
  20. Breda, N.; Granier, A.; Aussenac, G. Effects of thinning on soil and tree water relations, transpiration and growth in an oak forest (Quercus petraea (Matt.) Liebl.). Tree Physiol. 1995, 15, 295–306. [Google Scholar] [CrossRef]
  21. Tinya, F.; Kovács, B.; Aszalós, R.; Tóth, B.; Csépányi, P.; Németh, C.; Ódor, P. Initial regeneration success of tree species after different forestry treatments in a sessile oak-hornbeam forest. For. Ecol. Manag. 2020, 459, 117810. [Google Scholar] [CrossRef]
  22. Führer, E.; Horváth, L.; Jagodics, A.; Machon, A.; Szabados, I. Application of a new aridity index in Hungarian forestry practice. Idojaras 2011, 115, 205–216. [Google Scholar]
  23. Nabuurs, G.-J.; Lindner, M.; Verkerk, P.J.; Gunia, K.; Deda, P.; Michalak, R.; Grassi, G. First signs of carbon sink saturation in European forest biomass. Nat. Clim. Chang. 2013, 3, 792–796. [Google Scholar] [CrossRef]
  24. Seidl, R.; Schelhaas, M.-J.; Rammer, W.; Verkerk, P.J. Increasing forest disturbances in Europe and their impact on carbon storage. Nat. Clim. Chang. 2014, 4, 806–810. [Google Scholar] [CrossRef] [PubMed] [Green Version]
  25. Paul, T.; Kimberley, M.O.; Beets, P.N. Natural forests in New Zealand – a large terrestrial carbon pool in a national state of equilibrium. For. Ecosyst. 2021, 8. [Google Scholar] [CrossRef]
  26. Fick, S.E.; Hijmans, R.J. WorldClim 2: New 1-km spatial resolution climate surfaces for global land areas. Int. J. Climatol. 2017, 37, 4302–4315. [Google Scholar] [CrossRef]
  27. Abatzoglou, J.T.; Dobrowski, S.Z.; Parks, S.A.; Hegewisch, K.C. TerraClimate, a high-resolution global dataset of monthly climate and climatic water balance from 1958-2015. Sci. Data 2018, 5, 1–12. [Google Scholar] [CrossRef] [Green Version]
  28. Boisvenue, C.; Running, S.W. Impacts of climate change on natural forest productivity - evidence since the middle of the 20th century. Glob. Chang. Biol. 2006, 12, 862–882. [Google Scholar] [CrossRef]
  29. Creed, I.F.; Spargo, A.T.; Jones, J.A.; Buttle, J.M.; Adams, M.B.; Beall, F.D.; Booth, E.G.; Campbell, J.L.; Clow, D.; Elder, K.; et al. Changing forest water yields in response to climate warming: Results from long-term experimental watershed sites across North America. Glob. Chang. Biol. 2014, 20, 3191–3208. [Google Scholar] [CrossRef] [Green Version]
  30. San-Miguel-Ayanz, J.; de Rigo, D.; Caudullo, G.; Houston Durrant, T.; Mauri, A. European Atlas of Forest Tree Species; Publication Office of the European Union: Luxembourg, Belgium, 2016; ISBN 978-92-79-52833-0. [Google Scholar]
  31. Hasenauer, H.; Eastaugh, C.S. Assessing Forest Production Using Terrestrial Monitoring Data. Int. J. For. Res. 2012, 1–8. [Google Scholar] [CrossRef] [Green Version]
  32. Pollanschütz, J. Formzahlfunktionen der Hauptbaumarten Österreichs. Informationsd. Forstl. Bundesversuchsanstalt Wien 1974, 153, 341–343. [Google Scholar]
  33. Marschall, J. Hilfstafeln für die Forsteinrichtung, 5th ed.; Österreichischer Agrarverlag: Wien, Austria, 1992. [Google Scholar]
  34. Burrows, W.H.; Henry, B.K.; Back, P.V.; Hoffmann, M.B.; Tait, L.J.; Anderson, E.R.; Menke, N.; Danaher, T.; Carter, J.O.; McKeon, G.M. Growth and carbon stock change in eucalypt woodlands in northeast Australia: Ecological and greenhouse sink implications. Glob. Chang. Biol. 2002, 8, 769–784. [Google Scholar] [CrossRef]
  35. Bitterlich, W. Die Winkelzaehlprobe. Allg. Forst-und Holzwirtschaftliche Zeitung 1948, 59, 4–5. [Google Scholar]
  36. Neumann, M.; Moreno, A.; Mues, V.; Härkönen, S.; Mura, M.; Bouriaud, O.; Lang, M.; Achten, W.M.J.; Thivolle-Cazat, A.; Bronisz, K.; et al. Comparison of carbon estimation methods for European forests. For. Ecol. Manag. 2016, 361, 397–420. [Google Scholar] [CrossRef]
  37. Harmon, M.E.; Fasth, B.G.; Yatskov, M.; Kastendick, D.; Rock, J.; Woodall, C.W. Release of coarse woody detritus-related carbon: A synthesis across forest biomes. Carbon Balance Manag. 2020, 15, 1–21. [Google Scholar] [CrossRef]
  38. Pukkala, T. Does management improve the carbon balance of forestry? Forestry 2017, 90, 125–135. [Google Scholar] [CrossRef]
  39. Thom, D.; Seidl, R. Natural disturbance impacts on ecosystem services and biodiversity in temperate and boreal forests. Biol. Rev. 2016, 91, 760–781. [Google Scholar] [CrossRef] [PubMed]
  40. Dean, C.; Kirkpatrick, J.B.; Osborn, J.; Doyle, R.B.; Fitzgerald, N.B.; Roxburgh, S.H. Novel 3D geometry and models of the lower regions of large trees for use in carbon accounting of primary forests. AoB Plants 2018, 10, 1–20. [Google Scholar] [CrossRef] [Green Version]
  41. Roxburgh, S.H.; Wood, S.W.; Mackey, B.G.; Woldendorp, G.; Gibbons, P. Assessing the carbon sequestration potential of managed forests: A case study from temperate Australia. J. Appl. Ecol. 2006, 43, 1149–1159. [Google Scholar] [CrossRef]
  42. Grotti, M.; Chianucci, F.; Puletti, N.; Fardusi, M.J.; Castaldi, C.; Corona, P. Spatio-temporal variability in structure and diversity in a semi-natural mixed oak-hornbeam floodplain forest. Ecol. Indic. 2019, 104, 576–587. [Google Scholar] [CrossRef]
  43. Petritan, A.M.; Biris, I.A.; Merce, O.; Turcu, D.O.; Petritan, I.C. Structure and diversity of a natural temperate sessile oak (Quercus petraea L.) - European Beech (Fagus sylvatica L.) forest. For. Ecol. Manag. 2012, 280, 140–149. [Google Scholar] [CrossRef]
  44. Woldendorp, G.; Keenan, R.J.; Barry, S.; Spencer, R.D. Analysis of sampling methods for coarse woody debris. For. Ecol. Manag. 2004, 198, 133–148. [Google Scholar] [CrossRef]
  45. Stereńczak, K.; Mielcarek, M.; Wertz, B.; Bronisz, K.; Zajączkowski, G.; Jagodziński, A.M.; Ochał, W.; Skorupski, M. Factors influencing the accuracy of ground-based tree-height measurements for major European tree species. J. Environ. Manag. 2019, 231, 1284–1292. [Google Scholar] [CrossRef] [PubMed]
Figure 1. Current distribution of Quercus petraea, sessile oak [30] in Europe (a) and enlarged location of study area and the three sample plots (b).
Forests 12 01354 g001
Figure 2. Basal area (a) and stem density (b) of three oak-hornbeam stands with contrasting management. For the first measurement in year 2009, we show before and after treatment conditions for the thinned stands.
Forests 12 01354 g002
Figure 3. Increment versus losses in basal area (m2 ha−1 year−1) for the two periods with remeasurements (prior thinning) 2009–2014 and 2014–2019, with colour-coded species. We limited the extent of the vertical axis to 1 m2 ha−1 year−1 to enhance readability. For 2009–2014, losses of the moderately thinned stand were 4.61 m2 ha−1 year−1 and the losses of the heavily thinned stand were 5.71 m2 ha−1 year−1, whereas the unthinned stand lost 0.29 m2 ha−1 year−1.
Forests 12 01354 g003
Figure 4. Diameter increment of trees measured at both 2009 and 2019 separated into two DBH classes (a,c) and their stem density (b,d). We separated large trees and small trees using 20 cm DBH as the cut-off. The boxes in (a) and (c) represent the median and the 25th and 75th percentile, and the whiskers extend to 1.5 of the interquartile range. Observations outside the interquartile range are shown as dots.
Forests 12 01354 g004
Figure 5. Relationship between basal area and basal area increment for oak-hornbeam stands with different stocking (3 sites × 2 remeasurements). Dots with basal area of about 38 m2 ha−1 are unthinned. We added a second-order polynomial function forced through the plot origin to illustrate the plateau effect of stocking and increment [11].
Forests 12 01354 g005
Table 1. Stand structure of three stands in year 2009. For thinned stands we show condition before thinning (“2009 −“) and after thinning (“2009 +“). BA is basal area at breast height (1.3 m above ground) and NHA is stem density. Species mixture represents tree species proportions in percent of BA. Separated by commas, the first numbers represent sessile oak, Quercus petraea (Matt.) Liebl. (pooled with Turkey oak, Quercus cerris L.), the second number European hornbeam, Carpinus betulus L., and the third number European beech, Fagus sylvatica L. Volume is stem volume using the Austrian form factor functions [32]. Yield class is the cumulative increment at age 100 years using Austrian yield tables [33].
UnthinnedModerate ThinningHeavy Thinning
Measurement date20092009 −2009 +2009 −2009 +
BA (m2 ha−1)37.337.016.936.411.1
NHA (ha−1)173621704102135180
Species mixture (%)88, 12, <169, 30, 187, 12, 159, 41, <191, 8, 1
Mean tree height (m)12.212.617.112.917.9
Volume (m3 ha−1)327308157300106
Yield class (m3 ha−1 yr−1)4.54.54.5
Plot size (ha)0.250.20.2
Publisher’s Note: MDPI stays neutral with regard to jurisdictional claims in published maps and institutional affiliations.

