Article

Effect of Bamboo Nodes on the Mechanical Properties of P. edulis (Phyllostachys edulis) Bamboo

School of Civil Engineering, Central South University, Changsha 410075, China
*
Author to whom correspondence should be addressed.
Forests 2021, 12(10), 1309; https://doi.org/10.3390/f12101309
Submission received: 7 September 2021 / Revised: 19 September 2021 / Accepted: 22 September 2021 / Published: 25 September 2021
(This article belongs to the Section Wood Science and Forest Products)

Abstract

:
In the context of global sustainable development, the use of natural and renewable bamboo as a building material is of great significance for building engineering. As an important part of bamboo, there is still a lack of systematic research on the effect of bamboo nodes on the mechanical properties of bamboo. In this paper, compression parallel to the grain of the bamboo, bending, tensile parallel to the grain, shear parallel to the grain, compression perpendicular to the grain and tensile perpendicular to the grain tests of an entire bamboo culm of P. edulis bamboo were carried out, and the effects of bamboo nodes on moisture content, bearing capacity and mechanical properties were analyzed. The relationship between the mechanical properties and standardized parameters of the node and internode specimens was established. A conversion method of mechanical properties of the same test type was proposed, and a conversion method among different mechanical properties was proposed. The bamboo was graded by tensile strength parallel to the grain. The results show that bamboo nodes have an obvious effect on the moisture content. Bamboo nodes have different effects on the bearing capacity and mechanical properties of different types of specimens. The mechanical properties of P. edulis bamboo can be predicted by the relationship between the mechanical properties and the standardized parameters and the mechanical property conversion method. The strength classification of P. edulis bamboo can be predicted by standardized parameters.

1. Introduction

Currently, the main building materials in China include masonry, concrete and steel, which are nonrenewable and polluting. With the implementation of sustainable development strategies, the application of new building materials is very important. In recent years, wood and bamboo materials have become increasingly valued and favored by people. As a result of the lack of forest resources, wood has difficulty meeting the needs of development. Bamboo is rich in resources, and it has the advantages of a short growth cycle, a high ratio of strength to weight, a high ratio of rigidity to weight, good toughness and so on, which is called “plant reinforcement” and is an ideal new green building material [1,2,3,4,5].
A series of achievements have been made in the study of bamboo properties. The typical achievements include the effects of moisture content, bamboo age, height, wall thickness, diameter and density on the properties of original bamboo [6,7,8,9,10]; the properties and analysis of recombined bamboo and glued bamboo [11,12,13]; and the composite components of bamboo and other materials [14,15,16,17,18]. Currently, the body of research mainly focuses on modified bamboo and the combination of modified bamboo with other materials, but research on the performance of original bamboo is still not extensive enough. When modified bamboo is made or bonded with other materials, the adhesive will cause some negative effects on the environment. Therefore, it is of great significance to study how to utilize the structure of the original bamboo, and a clear grasp of the mechanical properties of the original bamboo is the basis of engineering applications. As an important part of bamboo, the effect of bamboo nodes on the mechanical properties of bamboo remains to be studied.
In this paper, bamboo stalks with the highest yield and the most widely used species were taken as the research object. Experiments of compression parallel to the grain, bending, tensile parallel to the grain, shear parallel to the grain, compression perpendicular to the grain and tensile perpendicular to the grain were carried out. The effect of bamboo nodes on the moisture content, bearing capacity and mechanical properties was studied, and the method of mechanical property conversion and hierarchical prediction of bamboo was proposed. The research results of this paper will greatly enrich the research results of the mechanical properties of the original bamboo and lay a theoretical foundation for the engineering applications of original bamboos.

2. Materials and Methods

2.1. Materials

The bamboo species in this study was P. edulis bamboo, which was cut during winter in Chenzhou city, Hunan Province, China. Twenty-five straight bamboos with a length of 6 m and an age of approximately 4 years were randomly cut from the bamboo forest in order to carry out the mechanical properties test.
The specimens with mechanical properties were divided into six categories: compression parallel to the grain (UC), bending (B), tensile parallel to the grain (UT), shear parallel to the grain (US), compression perpendicular to the grain (CC) and tensile perpendicular to the grain (CT). The specimens are shown in Figure 1. The ratio of the length to diameter of the UC and US specimens is 1. The B specimen size is 220 mm × 15 mm × t mm (t refers to the wall thickness); the size of the UT specimen is 330 mm × 15 mm × t mm; the CC specimen size is 15 mm × 15 mm × t mm; the CT specimen length is 100 mm. The factors of bamboo node and height were taken into full consideration, and the principle of uniform distribution along the height of bamboo stalk was followed.

2.2. Mechanical Properties Test and Calculation

A universal testing machine (ETM504C) was used to load all types of the mechanical property specimens. The loading rate of the UC, US and UT tests was 0.01 mm/s, the loading rate of the B test was 150 N/mm2 per minute, the loading rate of the CC test was 20 N/mm2 per minute and the loading rate of the CT test was 0.005 mm/s. The strength and elastic modulus of the specimen are calculated as follows [19,20].
f W = P max A
E W = 20 Δ P A Δ l
M O R W = 150 P max t b 2
M O E W = 1920000 Δ P 8 δ m t b 3
In the formula, fW is the strength of UC, US, UT, CC and CT specimens under moisture content W (MPa); EW is the compressive modulus and tensile modulus along the grain under moisture content W (MPa); MORW is the bending strength under moisture content W (MPa); MOEW is the flexural elastic modulus under moisture content W (MPa); Pmax is the failure load (N); A is the stressed area (mm2); t is the thickness of the specimen (mm); b is the height of the specimen (mm); ΔP is the difference between the upper and lower loads (N); ∆l is the difference of the specimen deformation values under upper and lower loads (mm); and δm is the deflection value of the pure bending section of the specimen under the action of ∆P (mm).

2.3. Adjustment of Mechanical Properties

After the loading failure of the specimen, a small specimen with a size of approximately 20 mm × 20 mm was immediately cut off near the failure part in order to carry out the moisture content test. The moisture content was calculated by Formula (5) [6]. Since the mechanical properties of bamboo are significantly affected by its moisture content, it is necessary to uniformly adjust the mechanical properties to the value under the standard moisture content (12%) with Formula (6) [19,20]:
W = m 1 m 0 m 0 × 100
M 12 = K W M W
K W = 1 a + b e c w
where W is the air dry moisture content (%); m1 and m0 are the masses of air dry and fully dry, respectively (g); an electronic balance was used for measurement; m0 was measured after drying in an oven; M12 is the strength or elastic modulus of the specimen under the standard moisture content (12%); MW is the strength or elastic modulus of the specimen when the moisture content is W; and KW is the moisture content correction coefficient, which is related to specific mechanical properties and the moisture content. Parameters a, b and c refer to the standards [19,20].

3. Results and Discussion

3.1. Failure Process and Morphology Analysis

The UC node and internode specimens gradually buckled with increasing load (Figure 2a) and eventually developed longitudinal cracks and failure. The typical load-displacement curve of the UC specimens is shown in Figure 3. The curve includes the elastic section, the elastic-plastic phase and the descending section. The specimens show good ductility failure characteristics. During the loading process, specimen B bent at the loading point, and the deformation gradually increased. When the load reaches a certain value, the fibre breaks, and the specimen is destroyed (Figure 2b). Bamboo bending shows a “semibrittle” failure feature (Figure 3), and the elastic plasticity of the load-displacement curve is short. The main failure mode of the UT specimen was transverse fracture failure at the centre of the specimen (Figure 2c), and the specimen showed obvious brittle failure characteristics (Figure 3). There is no obvious deformation during the process of loading of the US specimen, and the specimen was damaged due to longitudinal dislocation in the shear plane (Figure 2d). The typical load-displacement curve of the US specimen (Figure 3) shows the characteristics of brittle failure. The failure mode of the CC specimen is mainly pressure and bending failure (Figure 2e), showing a baroclinic failure mode. The typical load-displacement curve of the specimen (Figure 3) includes the elastic stage, the elastic-plastic stage and the descending stage, showing the characteristics of ductile failure. All CT specimens had fracture failure along the opening of the specimens (Figure 2f), and the typical load-displacement curve (Figure 3) indicates that the specimens exhibit brittle failure characteristics.

3.2. Location Distribution of the Bamboo Nodes

The distance between the bamboo nodes is different at different heights of the bamboo stalk, which increases gradually along the direction of bamboo growth (Figure 4). Suppose a bamboo stalk has n bamboo nodes, each node is numbered from bottom to top, and the lowest node is numbered one. The distribution of bamboo nodes of a randomly selected bamboo stalk was obtained by calculating statistics on the location of the nodes in the bamboo, as shown in Figure 5. As shown in Figure 5, the increase in bamboo node spacing gradually increases along the height direction. The fitting relation between the height of the bamboo stem and the number of the bamboo nodes is shown in Formula (8).
h = 5.82 n 2 + 174.19 n 182.65   ( R 2 = 0.9997 )

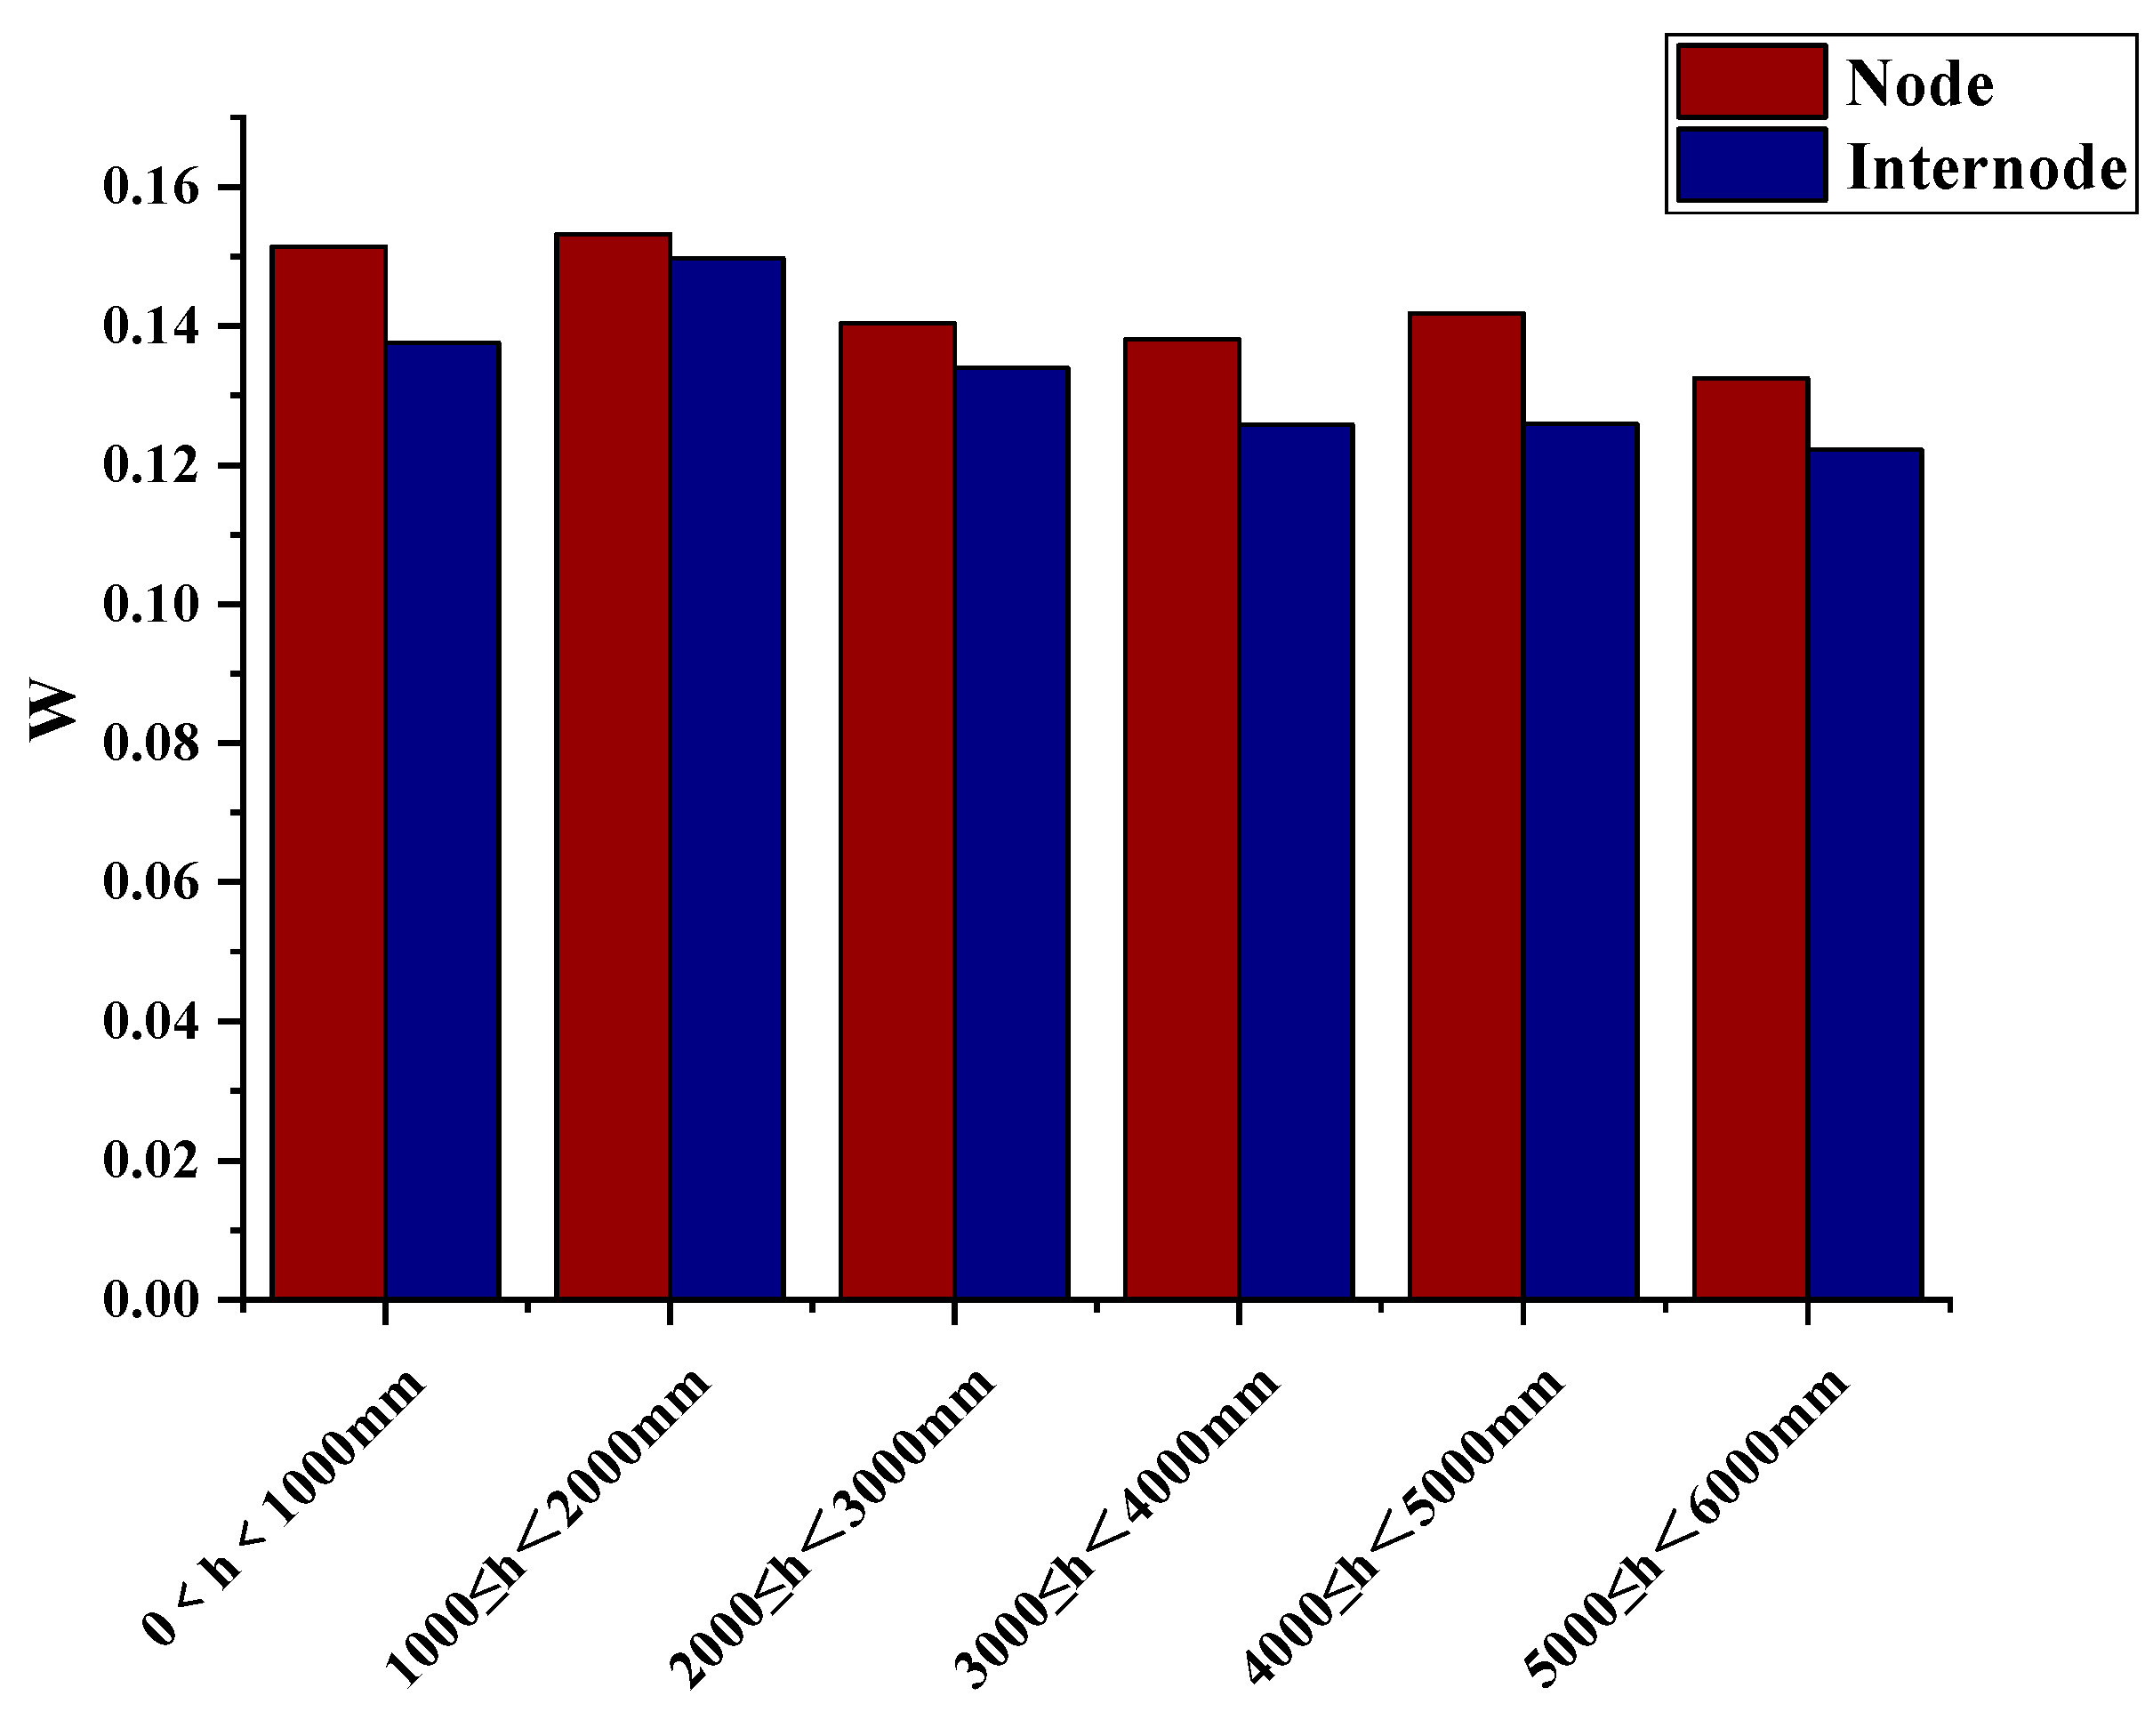
3.3. Effect of Bamboo Nodes on Moisture Content

The bamboo culms were evenly divided into six segments, each with a length of 1000 mm. The average moisture content of the specimens in each section was counted in order to obtain the statistical results of the moisture content, as shown in Figure 6. According to the results in Figure 6, the average moisture content of the specimens with nodes in each section is higher than that of the specimens without nodes. The average moisture content in each section of the specimens with nodes increased by 10.04%, 2.32%, 4.78%, 9.76%, 12.67% and 8.43%, respectively, compared with that of the specimens without nodes, and the average moisture content increased by 8.83%. Bamboo nodes have an obvious effect on moisture content, and bamboo nodes can lock in water to a certain extent.

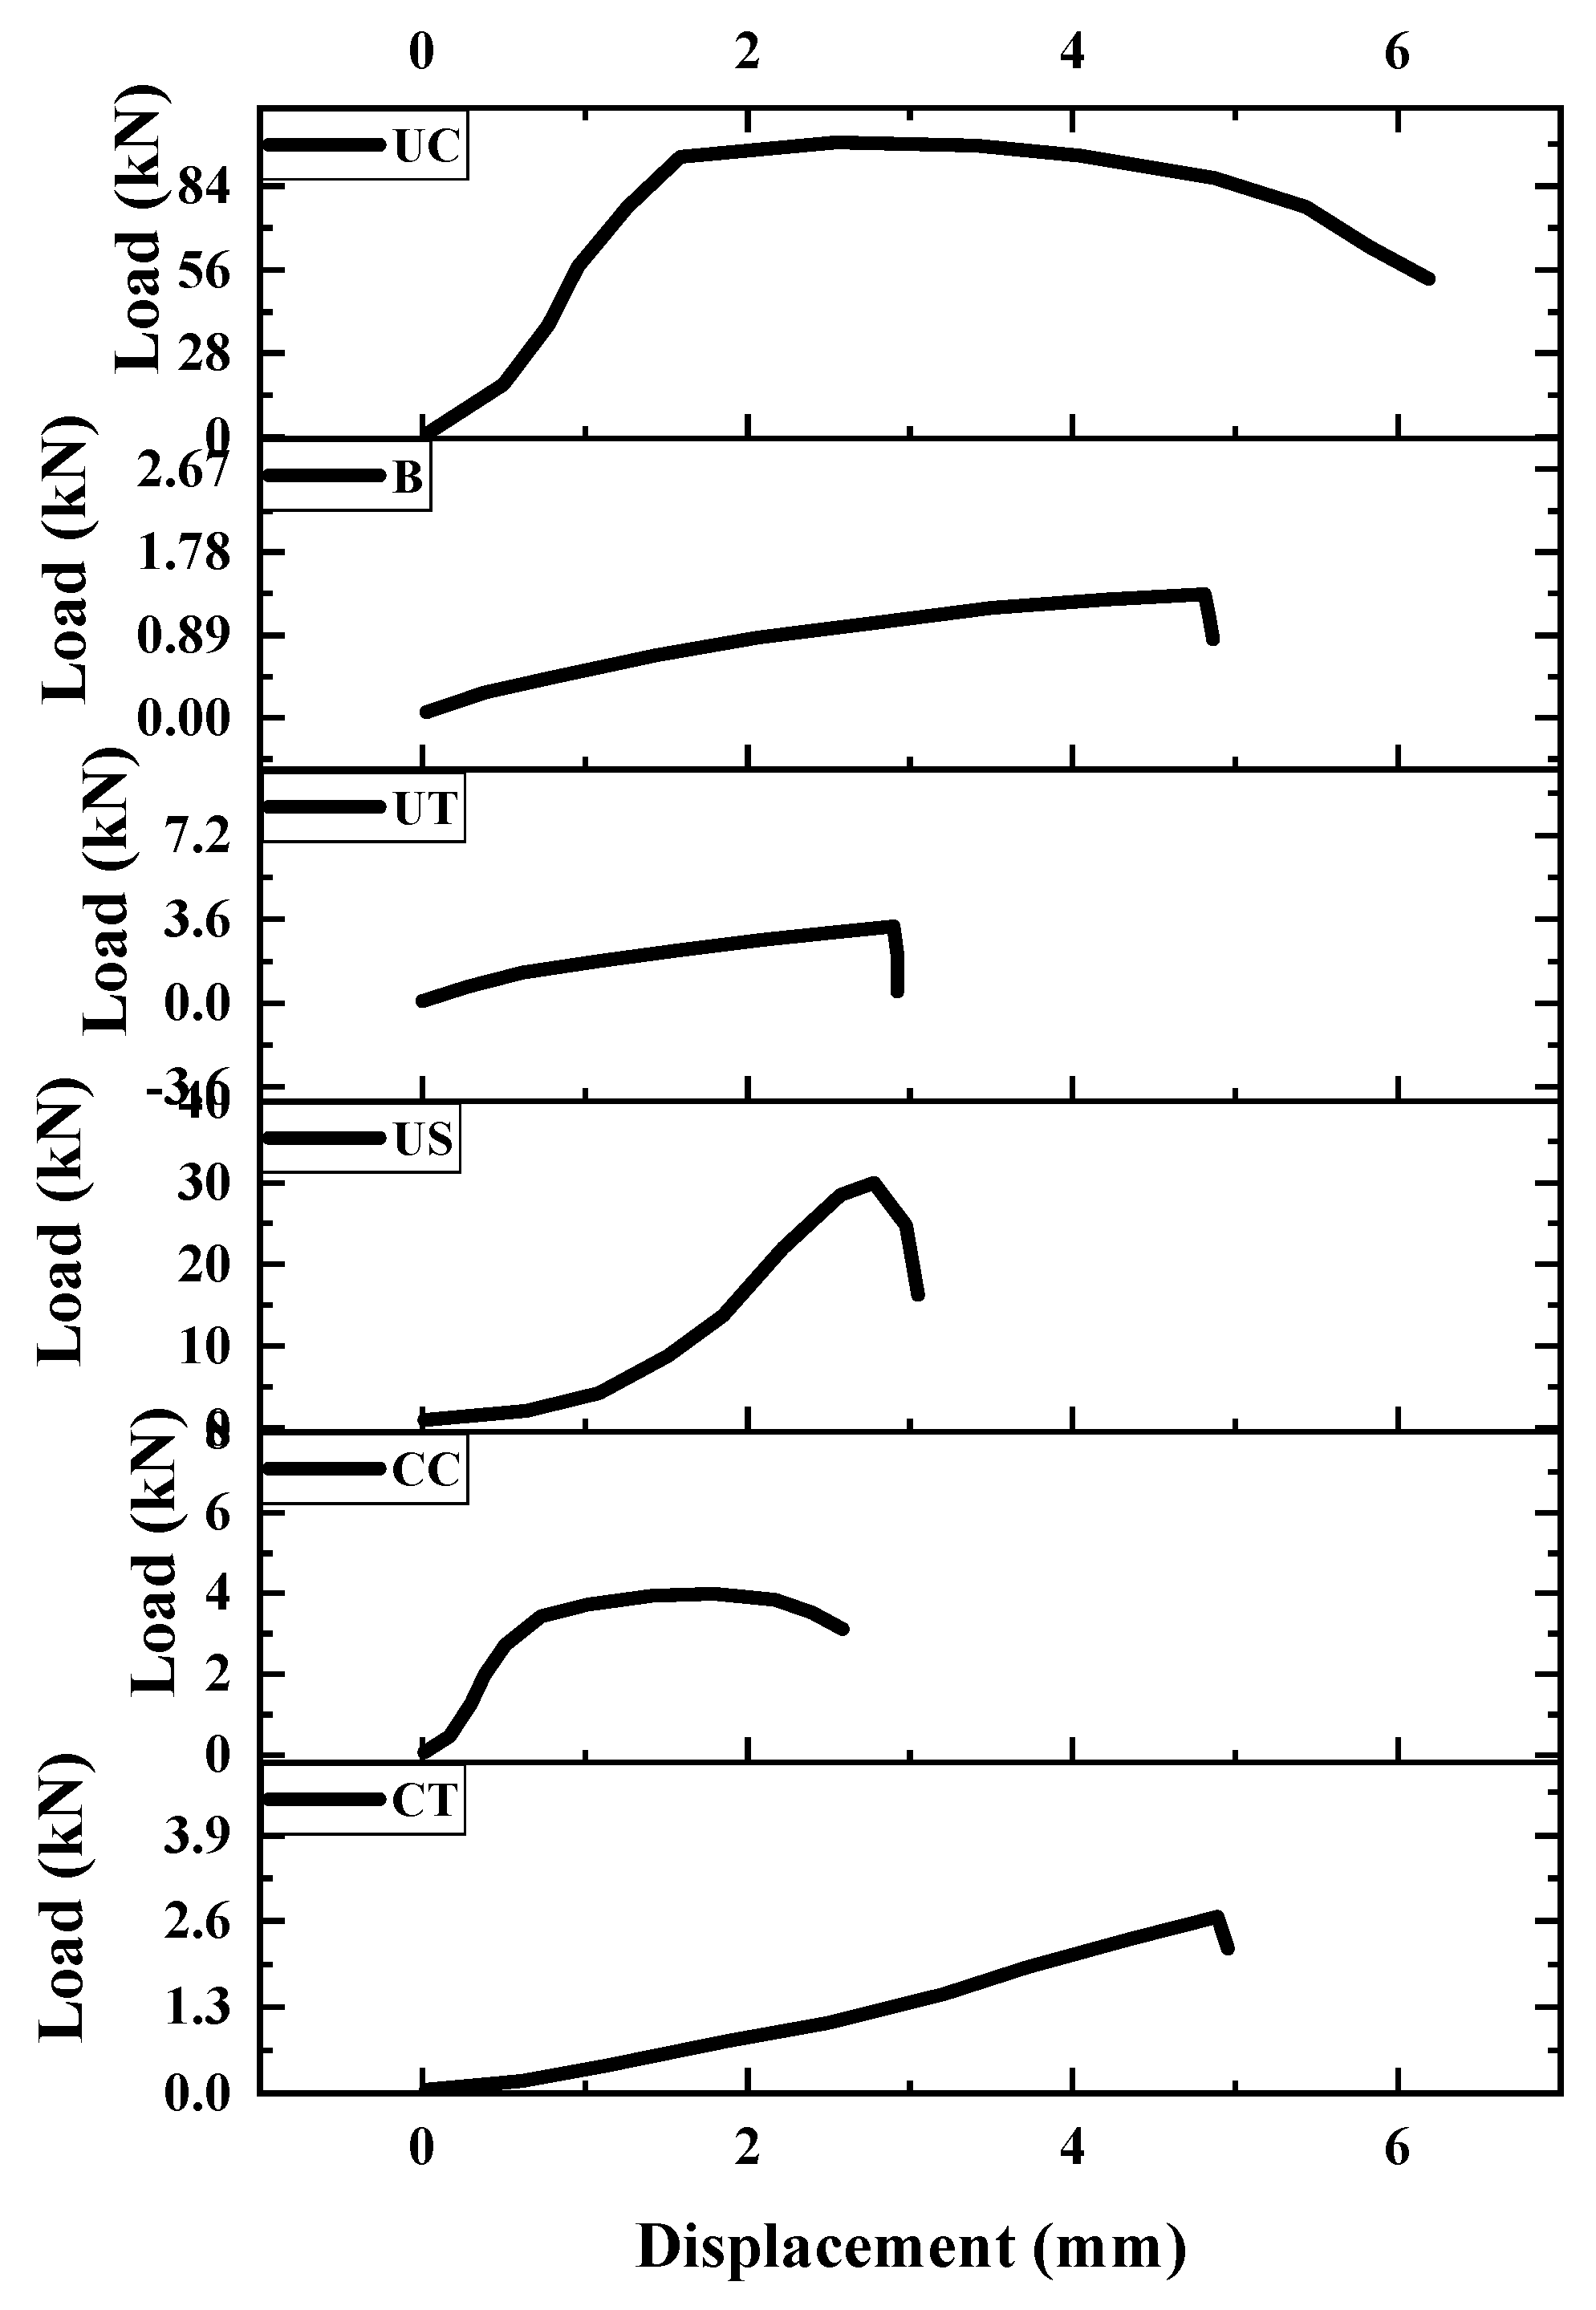
3.4. Influence of Bamboo Nodes on Bearing Capacity

The results shown in Table 1 were obtained by statistical analysis of the bearing capacity of the node and internode specimens with various mechanical properties. According to Table 1, among all kinds of specimens, specimen UC has the highest bearing capacity, while specimen B has the lowest bearing capacity. The bearing capacity of the UC, CC and CT node specimens is higher than that of internode specimens. The bearing capacity of the UT and B internode specimens is higher than that of the node specimens, and the bearing capacity of the US node specimens is similar to that of the internode specimens.

3.5. Effect of the Nodes on Mechanical Properties

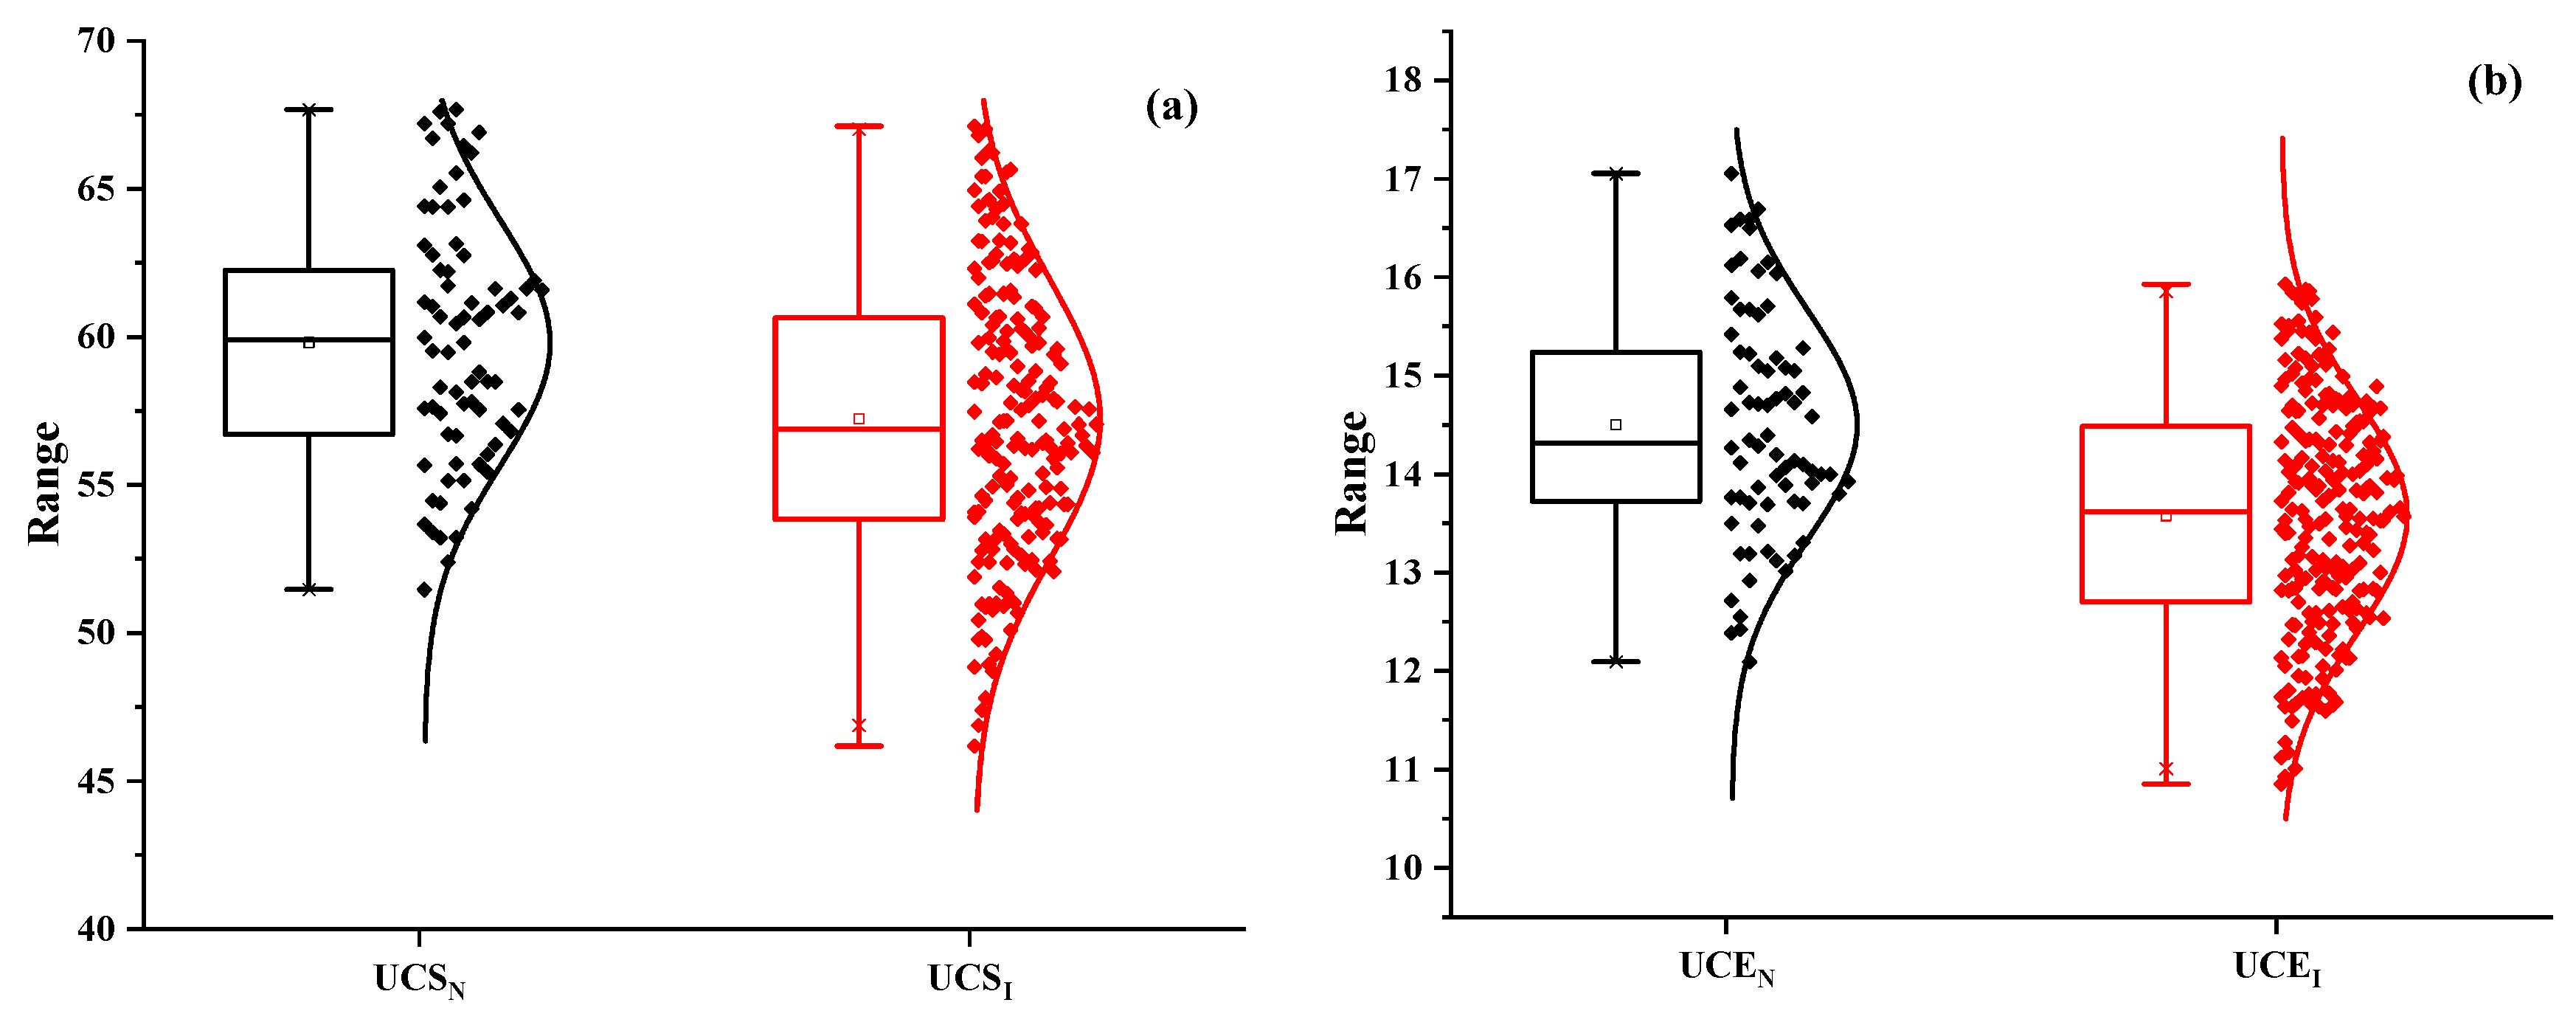
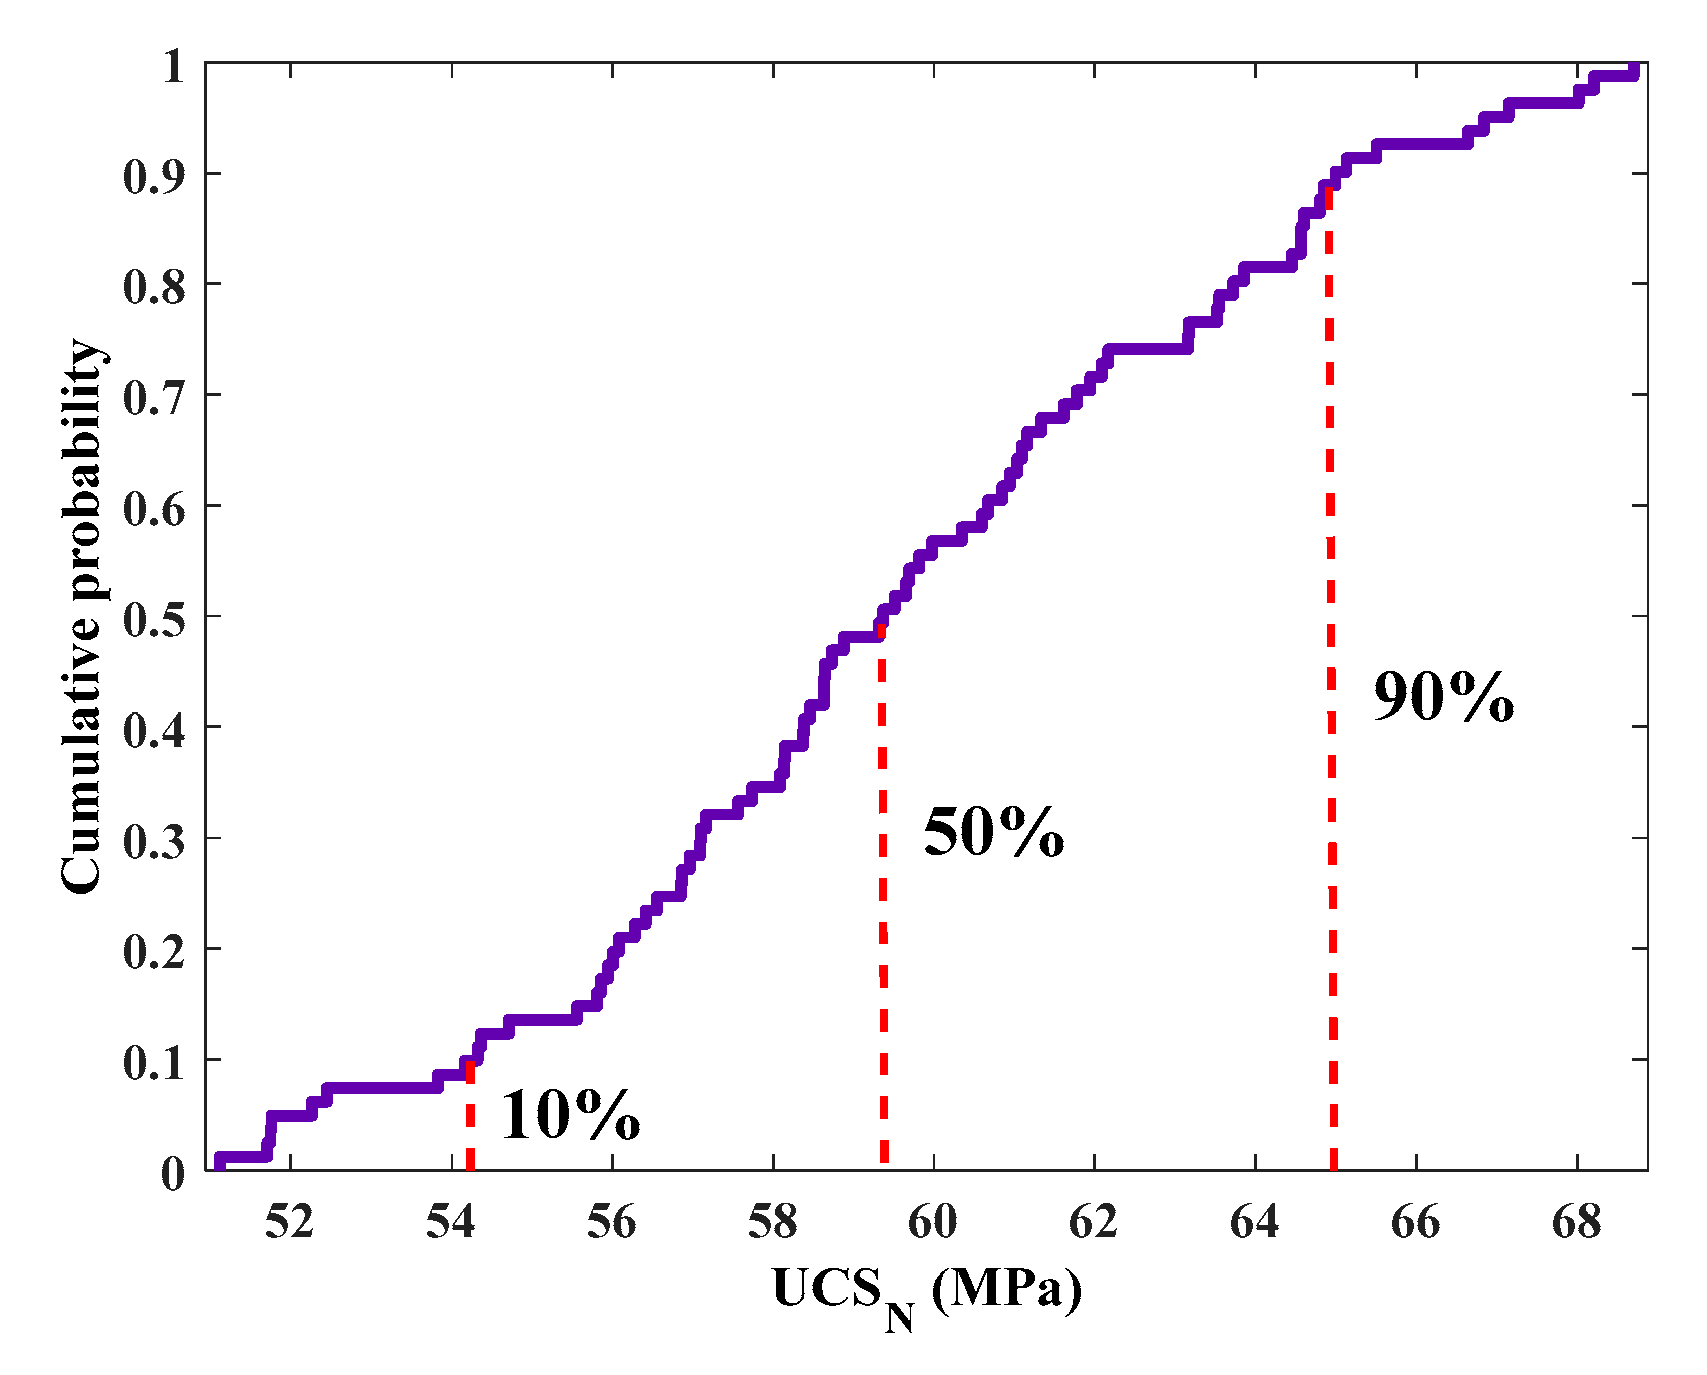
3.5.1. Characteristic Values of the Mechanical Properties of Entire Bamboo Stalks

The box normal curve shown in Figure 7 was obtained by statistical analysis of the mechanical properties of bamboo. After the outliers are removed, the statistical results are shown in Table 2, where “N” represents the node specimen and “I” represents the internode specimen. According to Figure 7 and Table 2, the bamboo is anisotropic with respect to the mechanical properties. UCS and MOR are high, while USS is low. The tensile and compressive strengths parallel to the grain (UCS and UTS) are significantly higher than the compressive strength perpendicular to the grain (CCS). The tensile strength parallel to the grain (UTS) is slightly higher than the bending strength (MOR). The tensile strengths parallel to the grain (UTS) and bending strength (MOR) are significantly higher than the compressive strength parallel to the grain (UCS), and the compressive strength perpendicular to the grain (CCS) is significantly higher than the tensile strength perpendicular to the grain (CTS).
Bamboo nodes have different effects on different mechanical properties. The UCS, UCE, UTE, CCS and CTS of the node specimens are higher than those of the internode specimens. The MOR, MOE and UTS of the internode specimens are higher than those of the node specimens. The USSs of the node specimen and the internode specimen are similar. The relative difference in mechanical properties between nodes in the transverse striation direction is more obvious.

3.5.2. Relationship between Bamboo Mechanical Properties and Standardized Parameters Considering the Effect of Bamboo Nodes

Based on the least square method, the mechanical properties of bamboo are fitted with the standardized parameter h/DB (where DB is the diameter of the second bamboo node at the bottom), and the fitting curve, as shown in Figure 8, and the fitting relation, as shown in Table 3, are obtained. As observed in Figure 8, UCSN, UCSI, UCEN, UCEI, MORN, MORI, MOEN, MOEI, UTSN, UTSI, USSN, USSI and CCSI increase with the increase in the standardization parameter h/DB. CCSN, CTSN and CTSI decrease with increasing h/DB. According to the fitting relation in Table 3, the mechanical properties of bamboo can be predicted by the standardized parameter h/DB.
The variation in the mechanical properties of bamboo with the standardized parameter h/DB reflects the variation in the mechanical properties along the height of the bamboo stalk to a certain extent. When the bamboo is stressed along the grain direction, the vascular bundle plays the role of bearing the load, and the basic organization plays the role of connecting and transferring the load [21]. The vascular bundle density increases with increasing bamboo stalk height, so the mechanical properties along the grain direction increase with increasing standardized parameter h/DB. The primary tissue plays a major role in the transverse tensile direction of bamboo, and the proportion of the primary tissue decreases with increasing bamboo stem height, so the CTS decreases with increasing standardized parameter h/DB. The vascular bundle plays a major role in the compression of the stria. Before the test, the protruding parts of the node specimens containing vascular bundles were disjointed and polished, and the proportion of vascular bundles worn off increased with increasing bamboo stalk height, so the CCSN showed an opposite trend with increasing standardized parameter h/DB.

3.5.3. Relationship between the Node and Internode Mechanical Properties

Based on the linear relationship between the mechanical properties of the node and internode specimens and the standardized parameter h/DB, the relationship between the mechanical properties of the node and internode specimens at the same position in the bamboo was derived, as shown in Table 4.

3.5.4. Mutual Relationship of Bamboo Mechanical Properties Considering the Effect of Bamboo Nodes

It is impossible to measure multiple mechanical properties of a single specimen at the same time, and the relationship between mechanical properties plays a vital role in the establishment of a bamboo mechanical property evaluation system. The establishment of the relationship between mechanical properties can greatly reduce material consumption and test costs.
It is generally believed that the relationship between mechanical properties is based on the same level and that the value of different mechanical properties with the same failure probability has a one-to-one relationship. From a mechanics performance value of 99 percentile values (percentile choose 0.01 + 0.01n, n = 0~98 and n is rounded; schematic diagram as shown in Figure 9) to establish the relationship between quantile values of each mechanical properties, the relationship between mechanical properties was fitted according to the percentile data. The relationship between mechanical properties form the basis of the bamboo performance evaluation system. The establishment of a relationship between the two mechanical properties can dramatically simplify the quality control process of mechanical stress classification and reduce material consumption in the performance test, especially for materials with a large performance variation coefficient [22]. The relationship between UCSN fitting based on the above method and the mechanical properties of the other node specimens is shown in Figure 10. Due to space constraints, the fitting curves of the other mechanical properties are not shown.
The relationship between the mechanical properties was derived by the above method, and the relationship between the mechanical properties and the standardized parameter h/DB was derived by using the linear relationship between mechanical properties and the standardized parameter h/DB. Formula (9) is used as the conversion formula between mechanical properties. α and β are defined as the conversion parameters of the bamboo’s mechanical properties by considering the effect of bamboo nodes, as shown in Table 5 and Table 6:
P 2 = α P 1 + β
where P1 and P2 are mechanical performance indices.

3.6. Classification of Bamboo Considering the Effect of Bamboo Nodes

The standard deviation can reflect the degree of discreteness among the data. In order to classify the data according to the standard deviation, it is necessary to ensure that the distribution of the data is normal. A Q–Q diagram is mainly used to judge whether a series of values conform to the normal distribution. The abscissa is the theoretical value, and the ordinate is the actual value. If most of the points are on the y = x line, then the data conform to a normal distribution. Figure 11 shows the Q–Q diagram of UTSN and UTSI. According to the Q–Q diagram, the distribution of UTSN and UTSI conforms to a normal distribution. The UTSN and UTSI were graded by 1/4 standard deviation in order to obtain the results shown in Table 7. According to Table 7, the standardized parameter h/DB can be used for hierarchical evaluation of bamboo.

4. Conclusions

(1)
The bamboo nodes have a significant effect on the moisture content, and their influences on the bearing capacity are as follows: the bearing capacity of the UC, CC and CT node specimens are higher than that of the internode specimen; the bearing capacity of the UT and B internode specimens are higher than that of the node specimens; and the bearing capacity of the US node and internode specimens are similar.
(2)
Bamboo joints have different effects on the mechanical properties. The UCS, UCE, UTE, CCS and CTS of the node specimens are higher than those of the internode specimens. The MOR, MOE and UTS of the internode specimens are higher than those of the node specimen. The USS of the node specimen and the internode specimen are similar. The relative difference in mechanical properties between nodes in the transverse striation direction is obvious.
(3)
The linear fitting relationship was obtained by fitting the mechanical properties of bamboo with the standardized parameter h/DB. The fitting results show that UCSN, UCSI, UCEN, UCEI, MORN, MORI, MOEN, MOEI, UTSN, UTSI, USSN, USSI and CCSI increase with increasing standardized parameter h/DB. CCSN, CTSN and CTSI decrease with increasing h/DB. The standardized parameter h/DB can be used to predict the mechanical properties of bamboo by fitting the relationship. Based on the relationship between the mechanical properties of bamboo and h/DB, the relationship between the performance values of the joints and the specimens with the same mechanical properties was deduced.
(4)
The relationship between the mechanical properties was established by fitting 99 quartiles of each mechanical property value.
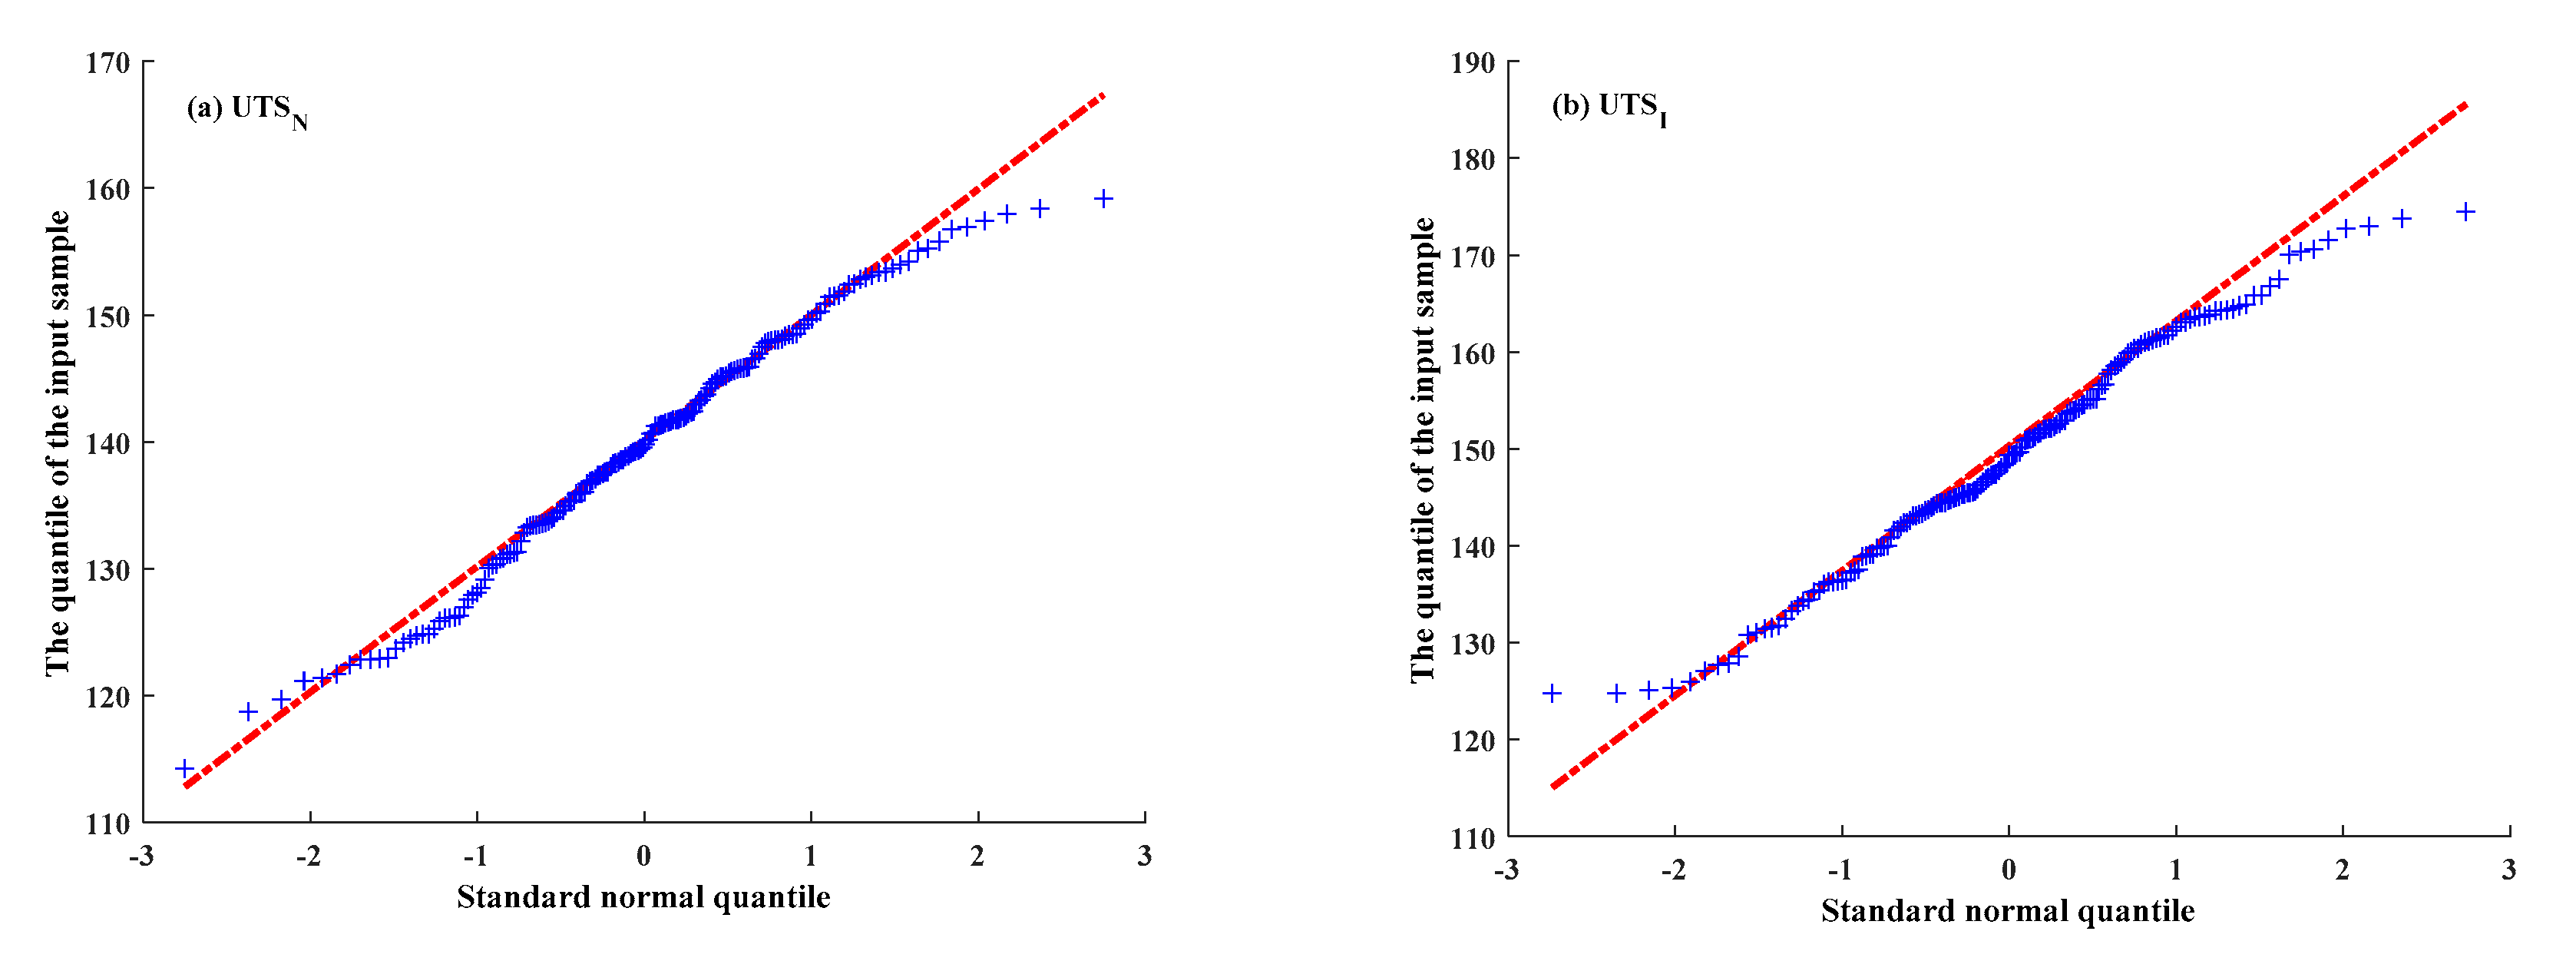
(5)
According to the standard deviation, UTSN and UTSI were divided into four grades, which could be predicted by the standardized parameter h/DB.

Author Contributions

Conceptualization, P.L. and Q.Z.; methodology, P.L.; software, P.L.; validation, P.L., F.F. and W.L.; formal analysis, P.L.; investigation, P.L.; resources, Q.Z.; data curation, P.L.; writing—original draft preparation, P.L.; writing—review and editing, P.L.; visualization, P.L.; supervision, P.L.; project administration, P.L.; funding acquisition, Q.Z. All authors have read and agreed to the published version of the manuscript.

Funding

This research was funded by the National Key R&D Program of China, grant number 2017YFC0703500.

Acknowledgments

We thank Chongqing University and Central South University for funding the support of this work.

Conflicts of Interest

The authors declare that they have no conflict of interest.

References

  1. Asif, M.; Rahman, K.; Faisal, M.; Islam, M. Comparative Study on Mechanical Properties of Bamboo Strip and Bamboo Strip-glass Fiber Reinforced Hybrid Composites. J. Eng. Adv. 2020, 1, 6–10. [Google Scholar] [CrossRef]
  2. Lee, C.; Chung, M. Effects of bamboo species, steam-heating treatment, and adhesives on mechanical properties and dimensional stability of oriented bamboo scrimber boards. BioResources 2020, 15, 5342–5354. [Google Scholar] [CrossRef]
  3. Deore, H.; Minde, P. Study of Bamboo Reinforcement Concrete As a Sustainable Material In Construction. J. Adv. Sch. Res. Allied Educ. 2018, 15, 305–307. [Google Scholar] [CrossRef]
  4. Parashar, S.; Tomar, P. Synergy of Sustainable Bio-composite Bamboo Material in Green Technology—An Explicit Report. In Proceedings of the International Conference on Sustainable Computing in Science, Technology and Management (SUSCOM), Jaipur, India, 26–28 February 2019. [Google Scholar] [CrossRef]
  5. Chaowana, K.; Wisadsatorn, S.; Chaowana, P. Bamboo as a Sustainable Building Material—Culm Characteristics and Properties. Sustainability 2021, 13, 7376. [Google Scholar] [CrossRef]
  6. Jakovljević, S.; Lisjak, D. Investigation into the effects of humidity on the mechanical and physical properties of bamboo. Constr. Build. Mater. 2019, 194, 386–396. [Google Scholar] [CrossRef]
  7. Liu, P.; Xiang, P.; Zhou, Q.; Zhang, H.; Tian, J.; Demis Argaw, M. Prediction of Mechanical Properties of Structural Bamboo and Its Relationship with Growth Parameters. J. Renew. Mater. 2021, 9, 2223. [Google Scholar] [CrossRef]
  8. Kumar, A.; Vlach, T.; Laiblova, L.; Hrouda, M.; Kasal, B.; Tywoniak, J.; Hajek, P. Engineered bamboo scrimber: Influence of density on the mechanical and water absorption properties. Constr. Build. Mater. 2016, 127, 815–827. [Google Scholar] [CrossRef]
  9. Girma, Y.; Assefa, D. The Effect of Age and Height on Some Selected Physical Properties of Ethiopian Highland Bamboo (Yushania Alpina). Int. J. Sci. Res. Manag. 2018, 6. [Google Scholar] [CrossRef] [Green Version]
  10. Tan, T.; Rahbar, N.; Allameh, S.; Kwofie, S.; Dissmore, D.; Ghavami, K.; Soboyejo, W. Mechanical properties of functionally graded hierarchical bamboo structures. Acta Biomater. 2011, 7, 3796–3803. [Google Scholar] [CrossRef] [PubMed]
  11. Fu, Y.; Fang, H. Investigation of Chair Legs of Recombinant Bamboo through Finite Element Technology. DEStech Trans. Comput. Sci. Eng. 2017. [Google Scholar] [CrossRef] [Green Version]
  12. Wei, Y.; Zhao, K.; Hang, C.; Chen, S.; Ding, M. Experimental Study on the Creep Behavior of Recombinant Bamboo. J. Renew. Mater. 2020, 8, 251–273. [Google Scholar] [CrossRef]
  13. Ngudiyono, N. Creep Shear Deformation Of Glued-Laminated Bamboo. Int. J. Geomate 2020, 19, 185–192. [Google Scholar] [CrossRef]
  14. Zhu, S.; Guo, Y.; Chen, Y.; Su, N.; Zhang, K.; Liu, S. Effects of the Incorporation of Nano-Bamboo Charcoal on the Mechanical Properties and Thermal Behavior of Bamboo-Plastic Composites. BioResources 2016, 11, 2684–2697. [Google Scholar] [CrossRef] [Green Version]
  15. Masood, S.; Khan, Z. Adoption of Green Building Technique: Replacement of Steel by Bamboo. Int. J. Trend Sci. Res. Dev. 2017, 1, 452–457. [Google Scholar] [CrossRef]
  16. Bashir, A.; Gupta, C.; Abubakr, M.A.; Abba, S.I. Analysis of Bamboo Fibre Reinforced Beam. J. Steel Struct. Constr. 2018, 4. [Google Scholar] [CrossRef]
  17. Giridhar, V. Flexural behavior of concrete with bamboo and steel reinforcement. Int. J. Emerg. Trends Eng. Dev. 2018, 6. [Google Scholar] [CrossRef]
  18. Shastry, A.; Unnikrishnan, S. Investigation on Elastic Properties of Bamboo and Behavior of Bamboo Reinforced Concrete Beams. Int. J. Earth Sci. Eng. 2017, 10, 304–312. [Google Scholar] [CrossRef]
  19. Chinese Standards Agency (CSA). Testing Methods for Physical and Mechanical Properties of Bamboo Used in Building. JG/T199-2007. 2007. Available online: https://www.chinesestandard.net/PDF/English.aspx/JGT199-2007 (accessed on 1 October 2007). (In Chinese).
  20. International Standards, Bamboo—Determination of Physical and Mechanical Properties—Part I: Requirements ISO 22157–1:2019 (E); International Organization for Standardization: Geneva, Switzerland, 2019; 25p, Available online: https://www.iso.org/standard/65950.html (accessed on 1 January 2019).
  21. Zhou, A.; Huang, D.; Che, S.; Zhang, P. Distribution of bamboo vascular bundles and their tensile mechanical properties. J. Build. Mater. 2012, 15, 730–734. (In Chinese) [Google Scholar]
  22. Zhao, X. Basic Research on Strength Properties of Xing’an Larch Gauge. Chin. Acad. For. 2010. Available online: http://libdb.csu.edu.cn/rwt/CNKI/https/NNYHGLUDN3WXTLUPMW4A/kcms/detail/detail.aspx?dbcode=CDFD&dbname=CDFD0911&filename=2010264558.nh&uniplatform=NZKPT&v=P3YFcP583RRQl%25mmd2FwOvRiYM1bcsxPvKHrXGN34ILGmYhV7AE55VJUHgg8AUQc%25mmd2FczHg (accessed on 1 June 2010). (In Chinese).
Figure 1. The specimen considering the effect of bamboo nodes.
Forests 12 01309 g001
Figure 2. Typical failure modes of specimens: (a) UC; (b) B; (c) UT; (d) US; (e) CC; (f) CT.
Forests 12 01309 g002
Figure 3. Typical load-displacement curve of the specimen.
Forests 12 01309 g003
Figure 4. Distribution of bamboo nodes along the growth direction of bamboo stalks.
Forests 12 01309 g004
Figure 5. Height statistics of bamboo nodes.
Forests 12 01309 g005
Figure 6. Statistics of the average moisture content of the specimens.
Forests 12 01309 g006
Figure 7. Box normal diagram of mechanical property statistics: (a) UCS; (b) UCE; (c) MOR; (d) MOE; (e) UTS; (f) UTE; (g) USS; (h) CCS; (i) CTS.
Forests 12 01309 g007aForests 12 01309 g007bForests 12 01309 g007c
Figure 8. Fitting curve of mechanical properties and standardized parameters: (a) UCS; (b) UCE; (c) MOR; (d) MOE; (e) UTS; (f) UTE; (g) USS; (h) CCS; (i) CTS.
Forests 12 01309 g008aForests 12 01309 g008b
Figure 9. Cumulative probability distribution curve.
Forests 12 01309 g009
Figure 10. Relationship between the mechanical properties of the node specimens and UCSN. (a) UCE; (b) MOR; (c) MOE; (d) UTS; (e) UTE; (f) USS; (g) CCS; (h) CTS.
Forests 12 01309 g010aForests 12 01309 g010b
Figure 11. Q–Q diagram of UTS: (a) UTSN; (b) UTSI.
Forests 12 01309 g011
Table 1. Bearing capacity statistics.
Specimens Type0 < h < 1000 mm1000 ≤ h < 2000 mm2000 ≤ h < 3000 mm3000 ≤ h < 4000 mm4000 ≤ h < 5000 mm5000 ≤ h < 6000 mmAverage
UCN149.82 135.60 119.42 106.39 85.17 84.93 113.56
UCI150.37 132.67 121.29 104.45 89.82 80.67 113.21
BN0.05 0.06 0.06 0.05 0.04 0.04 0.05
BI0.06 0.07 0.07 0.05 0.05 0.04 0.06
UTN4.45 4.35 3.81 3.71 3.98 3.70 4.00
UTI4.89 4.64 4.65 4.65 4.65 4.56 4.67
USN53.89 56.53 43.71 39.83 40.70 33.49 44.69
USI61.17 52.11 46.14 39.46 36.06 32.73 44.61
CCN4.61 4.45 2.41 4.93 3.68 3.18 3.88
CCI3.47 3.18 2.42 3.33 3.13 2.92 3.07
CTN2.83 2.01 2.65 2.32 2.01 1.99 2.30
CTI2.70 1.47 2.58 2.31 1.98 1.88 2.15
Note: “N” stands for node specimen, “I” stands for internode specimen and the rest is the same.
Table 2. Statistical results of the characteristic values of the mechanical properties.
Mechanical Performance IndexQuantityMeanStandard DeviationCoefficient of Variation
UCSN7459.8 MPa4.13 MPa0.069
UCSI23157.2 MPa4.68 MPa0.082
UCEN7414.5 GPa1.17 GPa0.080
UCEI23113.6 GPa1.18 GPa0.087
MORN75130 MPa6.65 MPa0.046
MORI80133 MPa7.19 MPa0.054
MOEN7517.4 GPa0.804 GPa0.046
MOEI8017.7 GPa1.37 GPa0.077
UTSN167140 MPa12.3 MPa0.088
UTSI147149 MPa
9.40926
9.41 MPa0.063
UTEN16716.5 GPa1.15 GPa0.070
UTEI15816.3 GPa1.18 GPa0.072
USSN6115.9 MPa1.62 MPa0.109
USSI14415.9 MPa1.1 MPa0.069
CCSN7737.3 MPa4.65 MPa0.125
CCSI10027.9 MPa1.37 MPa0.049
CTSN476.33 MPa0.489 MPa0.077
CTSI733.77 MPa0.517 MPa0.137
Table 3. Relationship between the physical and mechanical properties and h/DB.
The Fitting ParametersRelationsR2
UCSNUCSN = 0.203 h/DB + 54.3310.678
UCSIUCSI = 0.186 h/DB + 50.6650.661
UCENUCEN = 0.058 h/DB + 12.7960.546
UCEIUCEI = 0.062 h/DB+ 11.5540.595
MORNMORN = 0.277 h/DB + 124.20.541
MORIMORI = 0.302 h/DB + 125.480.585
MOENMOEN = 0.03 h/DB + 16.70.523
MOEIMOEI = 0.063 h/DB + 16.240.517
UTSNUSSN = 0.451 h/DB + 123.70.574
UTSIUSSI = 0.666 h/DB + 132.180.675
UTENUTSN = 0.041 h/DB + 14.980.299
UTEIUTSI = 0.048 h/DB + 14.8410.445
USSNUTEN = 0.061 h/DB + 13.860.694
USSIUTEI = 0.055 h/DB + 14.1850.640
CCSNCCSN = −0.33 h/DB + 43.740.591
CCSICCSI = 0.0335 h/DB + 26.4230.353
CTSNCTSN = −0.04 h/DB + 7.620.228
CTSICTSI = −0.017 h/DB + 4.2360.107
Table 4. The relationship between the mechanical properties of bamboo nodes and internodes.
Mechanical Performance IndexNode-InternodeInternode-Node
UCSUCSN = 1.09UCSI − 0.965 UCSI = 0.916UCSN + 0.884
UCEUCEN = 0.945UCEI + 1.987 UCEI = 1.07UCEN − 2.12
MORMORN = 0.917UCEI + 9.11 MORI = 1.09UCEN − 9.93
MOEMOEN = 0.476UCEI + 8.97 MOEI = 2.1UCEN − 18.83
UTSUTSN = 0.677UTSI + 34.2 UTSI = 1.47UTSN − 50.5
UTEUTEN = 0.854UTEI + 2.30 UTEI = 1.17UTEN − 2.70
USSUSSN = 1.11USSI − 1.87 USSI = 0.9USSN + 1.69
CCSCCSN = −9.85CCSI + 304 CCSI = −0.1CCSN + 30.86
CTSCTSN = 2.35CTSI − 2.35 CTSI = 0.CTSN + 0.99
Table 5. Mechanical property conversion parameters of node specimens.
Parameters P2UCSN2UCEN2MORN2MOEN2UTSN2UTEN2USSN2CCSN2CTSN2
P1
αUCSN11 0.3131.3880.162.3370.2800.2581.137−0.339
UCEN13.1281 4.4057.4210.8890.8173.604−1.084
MORN10.7090.2251 0.1141.6730.2010.1860.813−0.245
MOEN16.1161.9138.538114.2961.7171.5876.957−2.056
UTSN10.420.1340.5890.0671 0.120.1090.485−0.147
UTEN13.5161.1154.930.5628.3291 0.9174.041−1.223
USSN13.7871.1985.3240.6088.9211.0731 4.316−1.303
CCSN10.8610.2731.2050.1382.040.2440.2231 −0.298
CTSN1−2.879−0.889−4203−0.471−6.954−0.797−0.752−3.2271
βUCSN10−3.61548.6657.9620.155−0.4390.377−30.96126.627
UCEN112.601065.2819.97527.9642.9093.489−17.36322.712
MORN1−33.614−14.5190 2.505−80.342−10.135−8.611−70.08238.551
MOEN1−47.358−18.427−17.9130 −110.53−13.744−11.986−84.85742.386
UTSN10.967−3.58849.2898.1170−0.390.508−30.81926.872
UTEN12.39−3.1251.1628.3363.93800.834−28.9626.156
USSN1−0.094−3.86247.4677.899−1.16−0.6470−31.26426.967
CCSN127.9364.98887.06312.42464.3947.37.5670 17.406
CTSN178.11120.733157.2220.516181.8621.3920.59457.5330
Table 6. Mechanical property conversion parameters of internode specimens.
Parameters P2UCSN2UCEN2MORN2MOEN2UTSN2UTEN2USSN2CCSN2CTSN2
P1
αUCSN11 0.33418.5260.3283.0570.3010.2960.326−0.200
UCEN12.9711 5.5040.989.110.8950.8810.97−0.598
MORN10.5310.17710.1751.6240.160.1570.175−0.105
MOEN13.0021.0085.581 9.2480.9050.8880.987−0.600
UTSN10.3250.1090.6020.1081 0.0980.0960.106−0.065
UTEN13.311.1086.1511.08910.1371 0.9831.08−0.658
USSN13.3491.1216.1961.09810.2461.011 1.09−0.671
CCSN13.0261.0135.6531.0029.2840.9110.8951 −0.605
CTSN1−4.954−1.658−9.337−1.649−15.268−1.496−1.457−1.6311
βUCSN10−5.68826.965−1.175−27.072−1.09−1.2768.90615.297
UCEN117.28058.9874.44125.3684.0953.83514.52911.892
MORN1−13.334−10.1430−5.636−68.108−5.17−5.24.36217.853
MOEN14.345−4.31534.6690−15.0880.1890.04210.18814.432
UTSN19.224−2.65443.9381.72801.6521.44411.85613.449
UTEN13.867−4.41533.8070.064−15.6070−0.17210.1514.478
USSN14.707−4.12935.8150.405−12.8360.285010.48414.386
CCSN1−26.196−14.475−22.879−9.993−108.09−8.995−8.978020.549
CTSN176.36519.841169.0823.985206.8121.90321.31033.8950
Table 7. Bamboo tensile strength grading table along the grain.
IVIIIIII
UTSN Value (MPa)UTSN ≤ 131131 < UTSN ≤140140 < UTSN ≤148UTSN < 148
h/DBh/DB ≤ 1616 < h/DB ≤3636 < h/DB ≤54h/DB < 54
UTSI Value (MPa)UTSI ≤ 137137 < UTSI ≤149149 < UTSI ≤159UTSI < 159
h/DBh/DB ≤ 77 < h/DB ≤2525 < h/DB ≤40h/DB < 40
Publisher’s Note: MDPI stays neutral with regard to jurisdictional claims in published maps and institutional affiliations.

