Characterizing Growing Season Length of Subtropical Coniferous Forests with a Phenological Model

 , ,
, ,  and
and
Abstract
1. Introduction
2. Materials and Methods
2.1. Study Area
2.2. Net Ecosystem CO2 Exchange Using Eddy Covariance
2.3. Gross Primary Production Partitioning from NEE
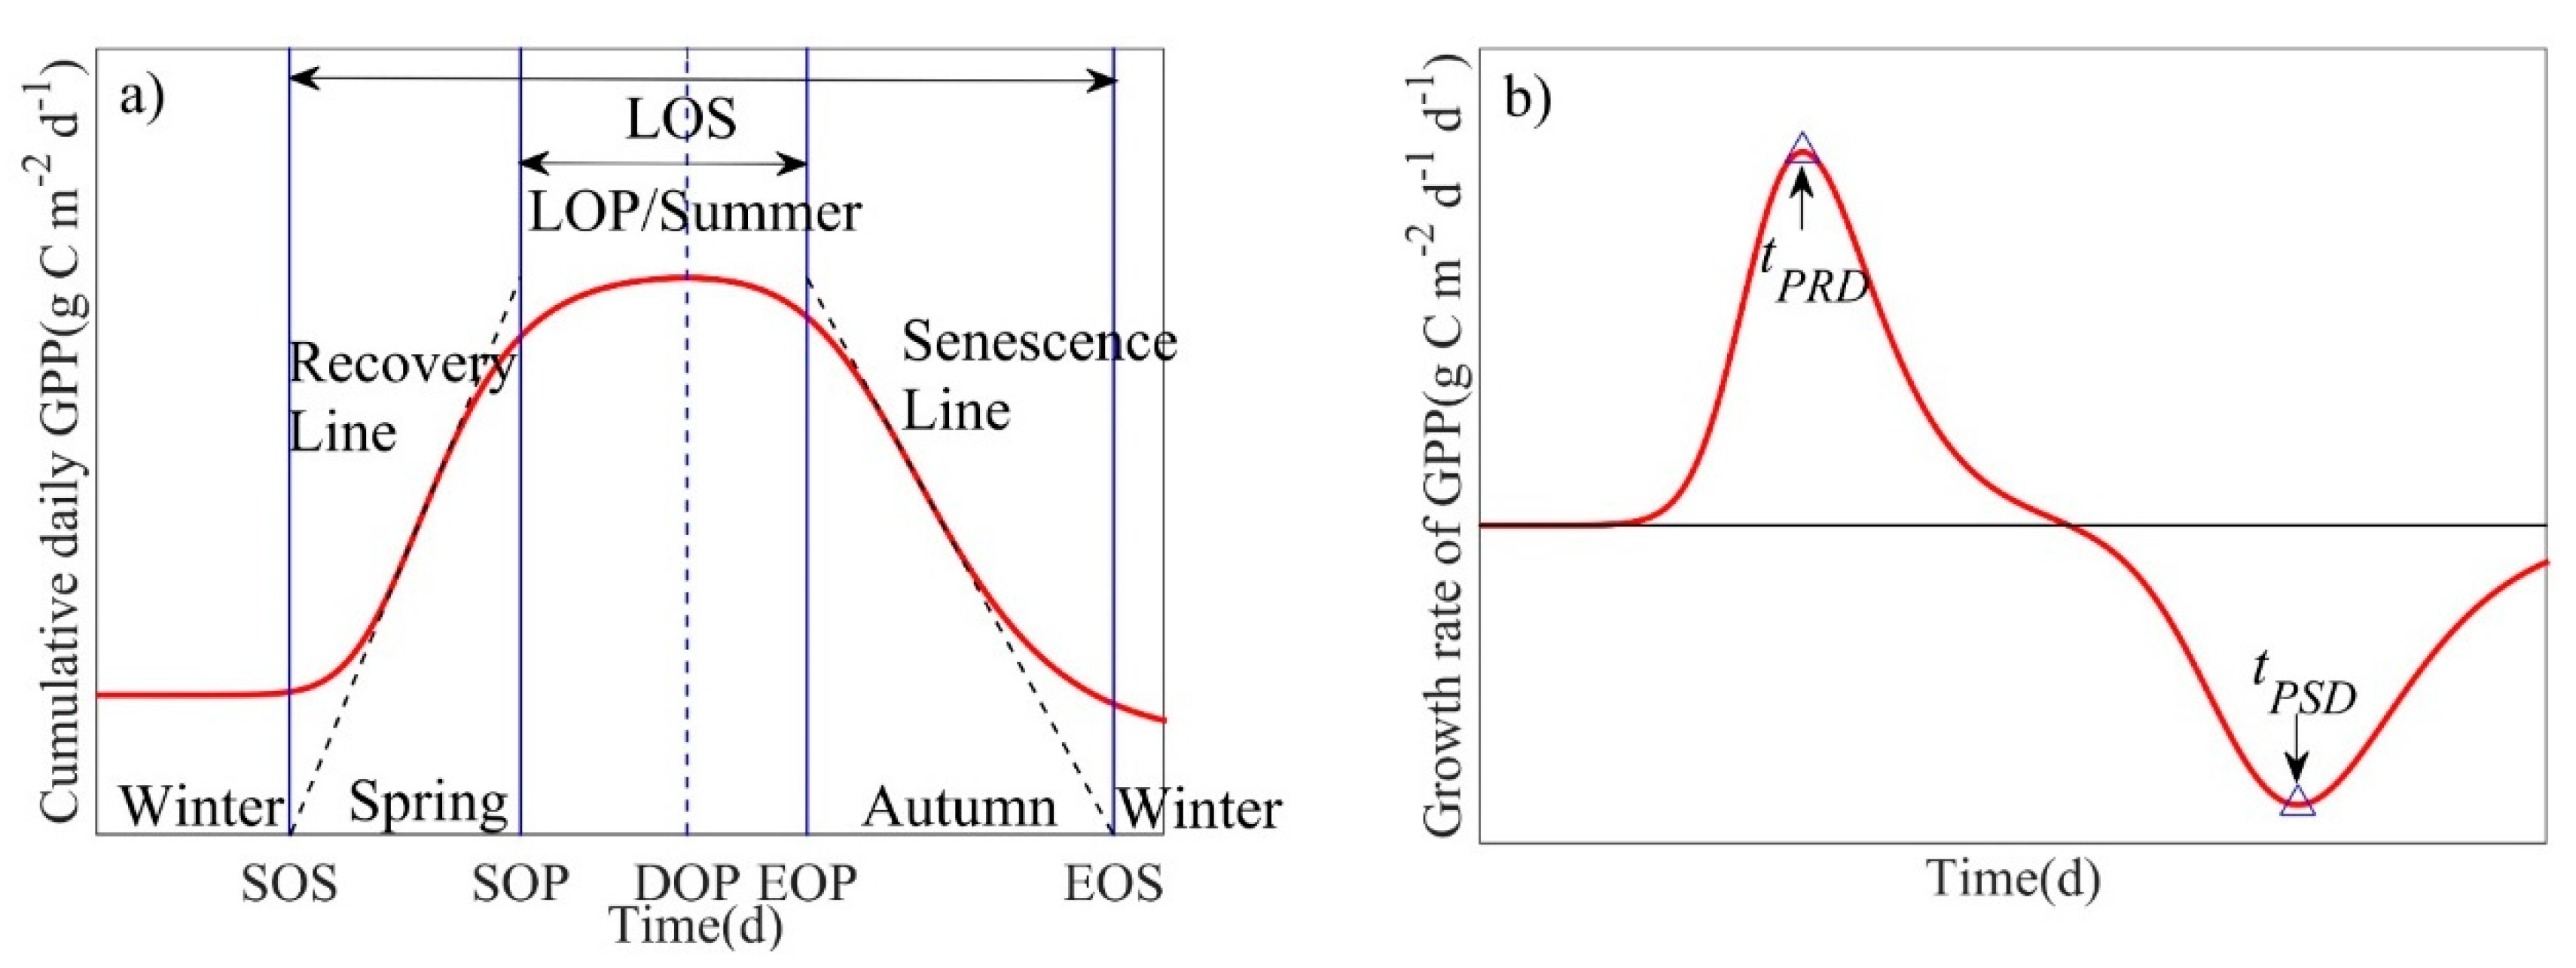
2.4. Ecosystem-Scale Plant Photosynthetic Phenology Model
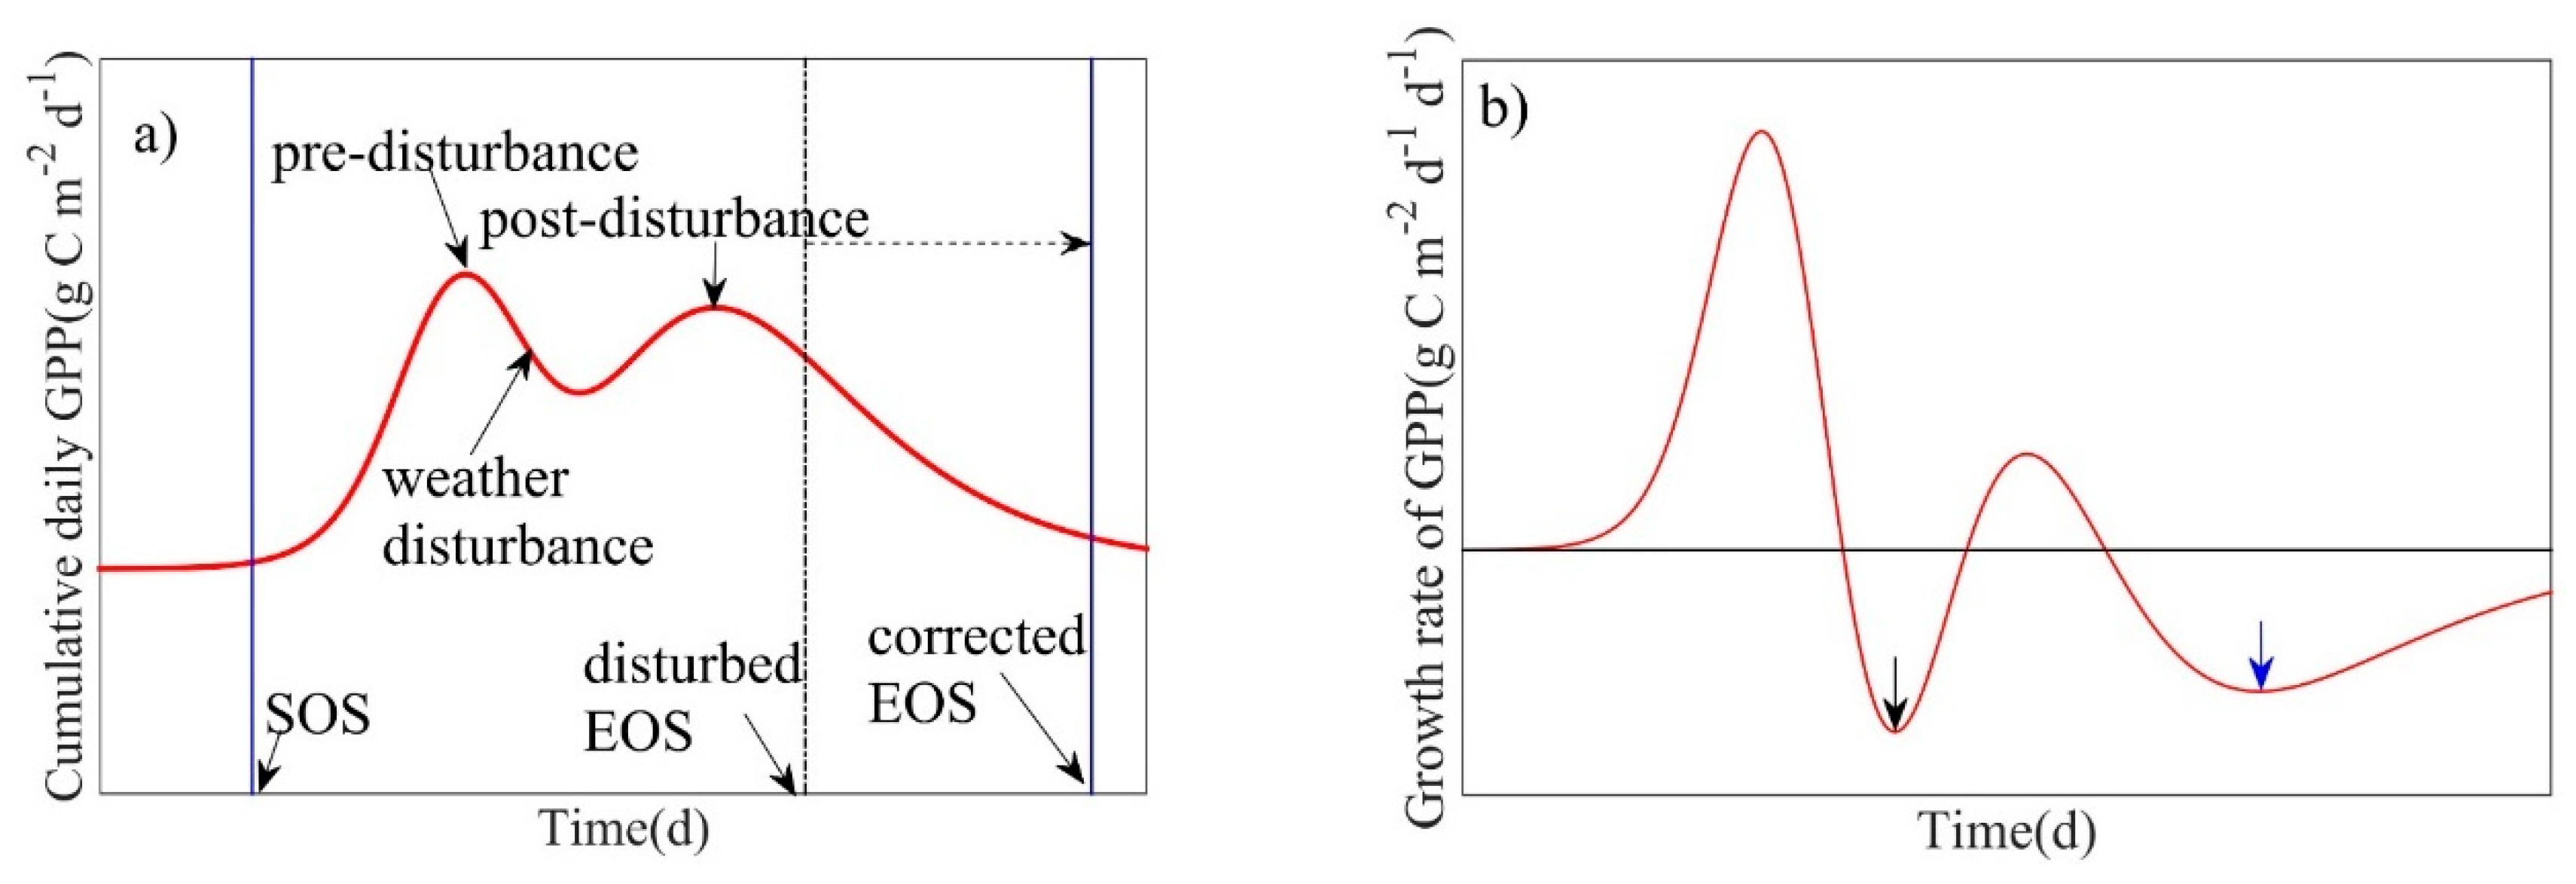
2.5. Response of Phenology Model to Disturbance and EOS Correction Approaches
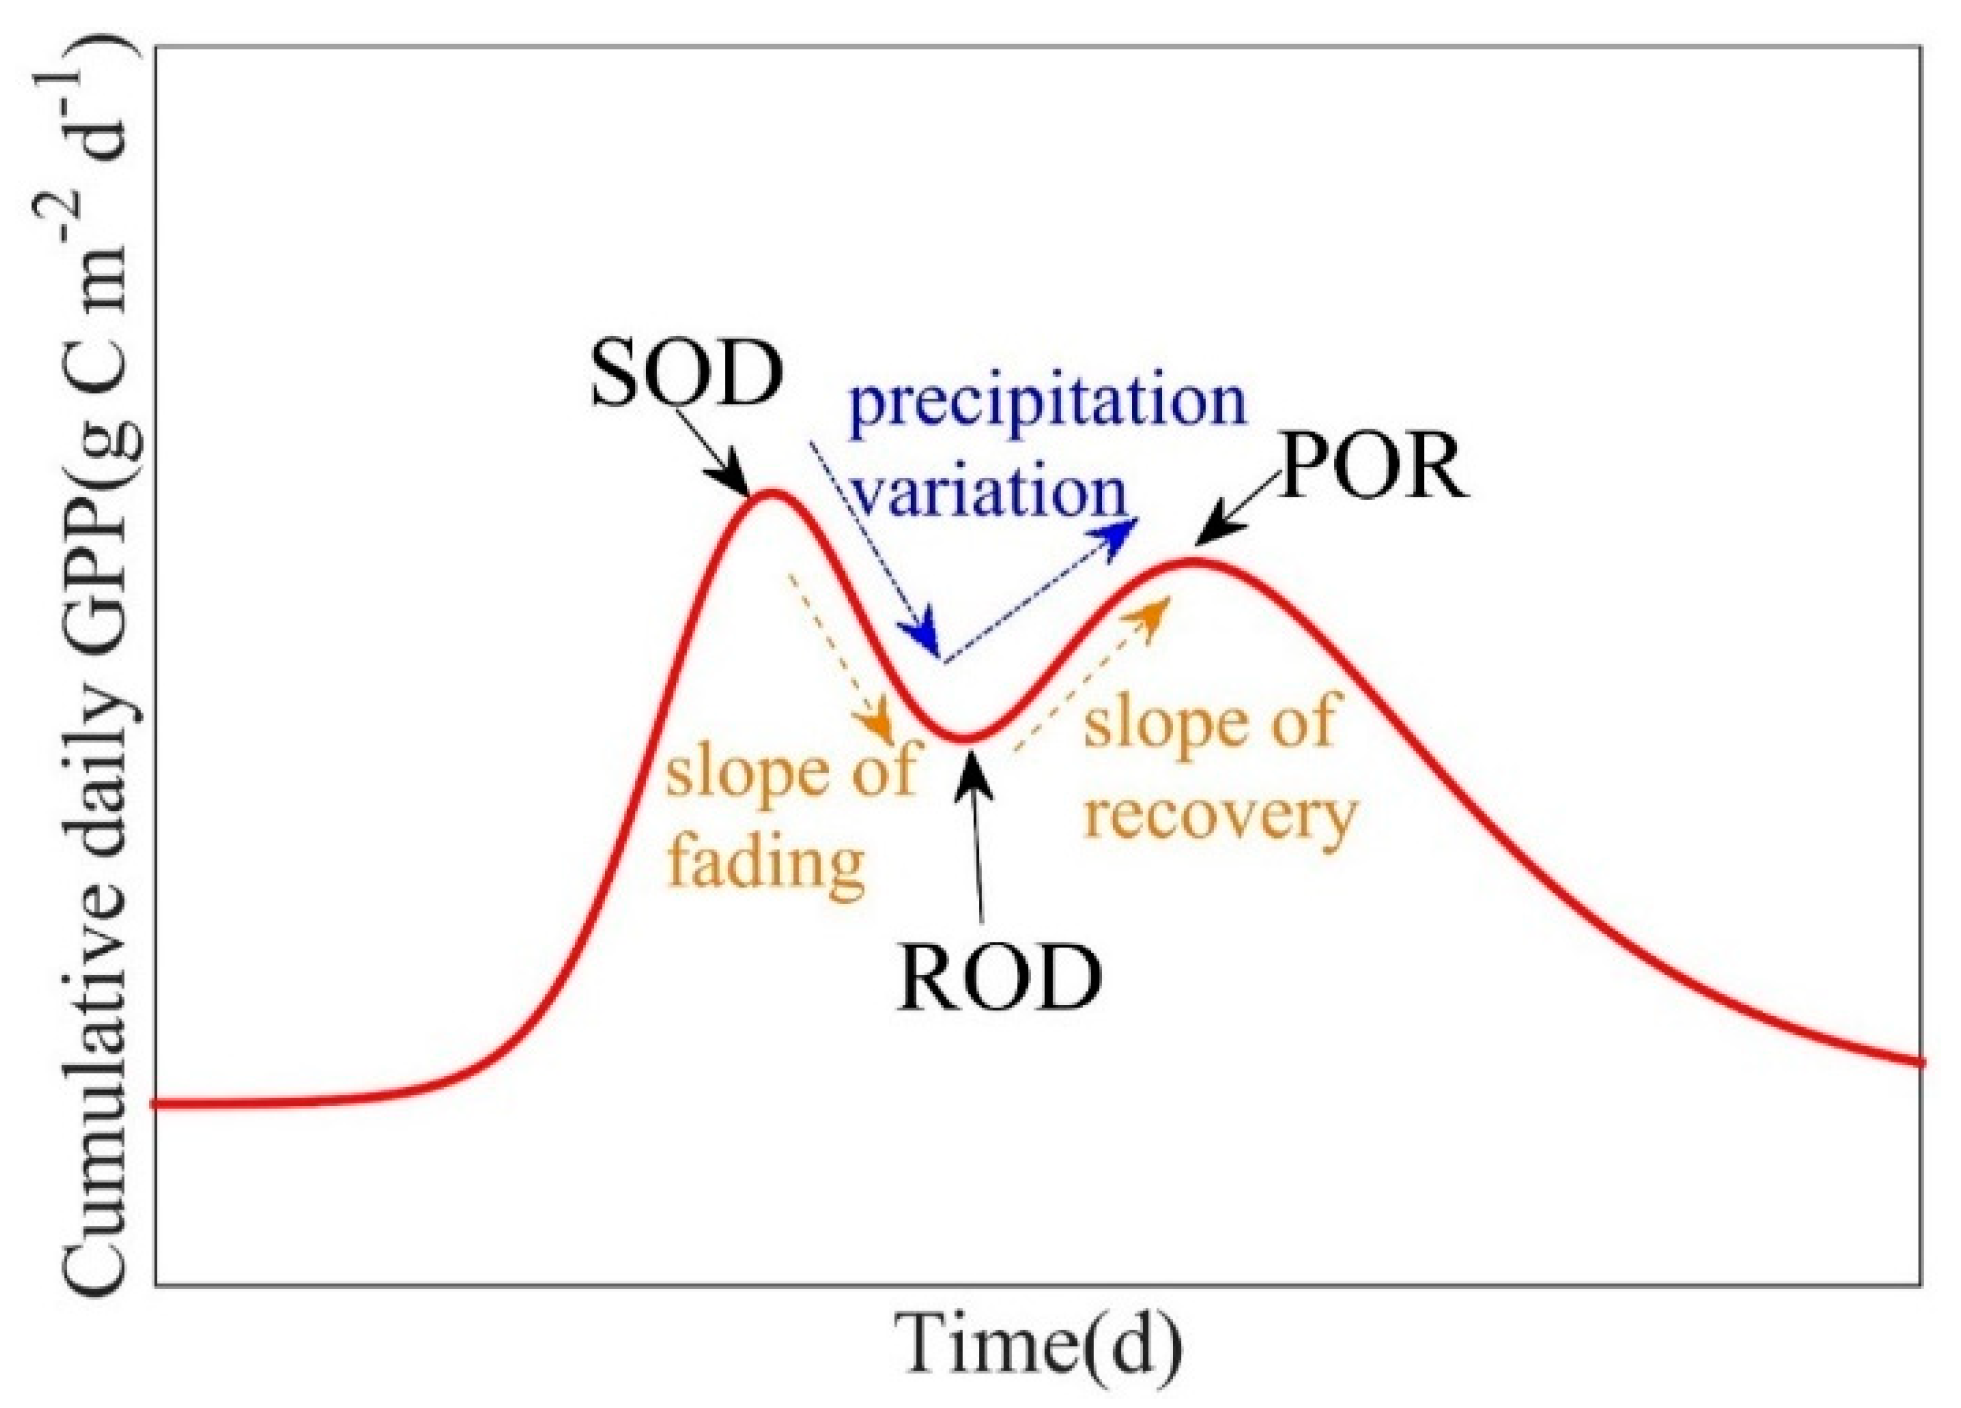
2.6. Identifying Anomalous Ecosystem Response to Weather Events Using GPP-Derived Phenological Process
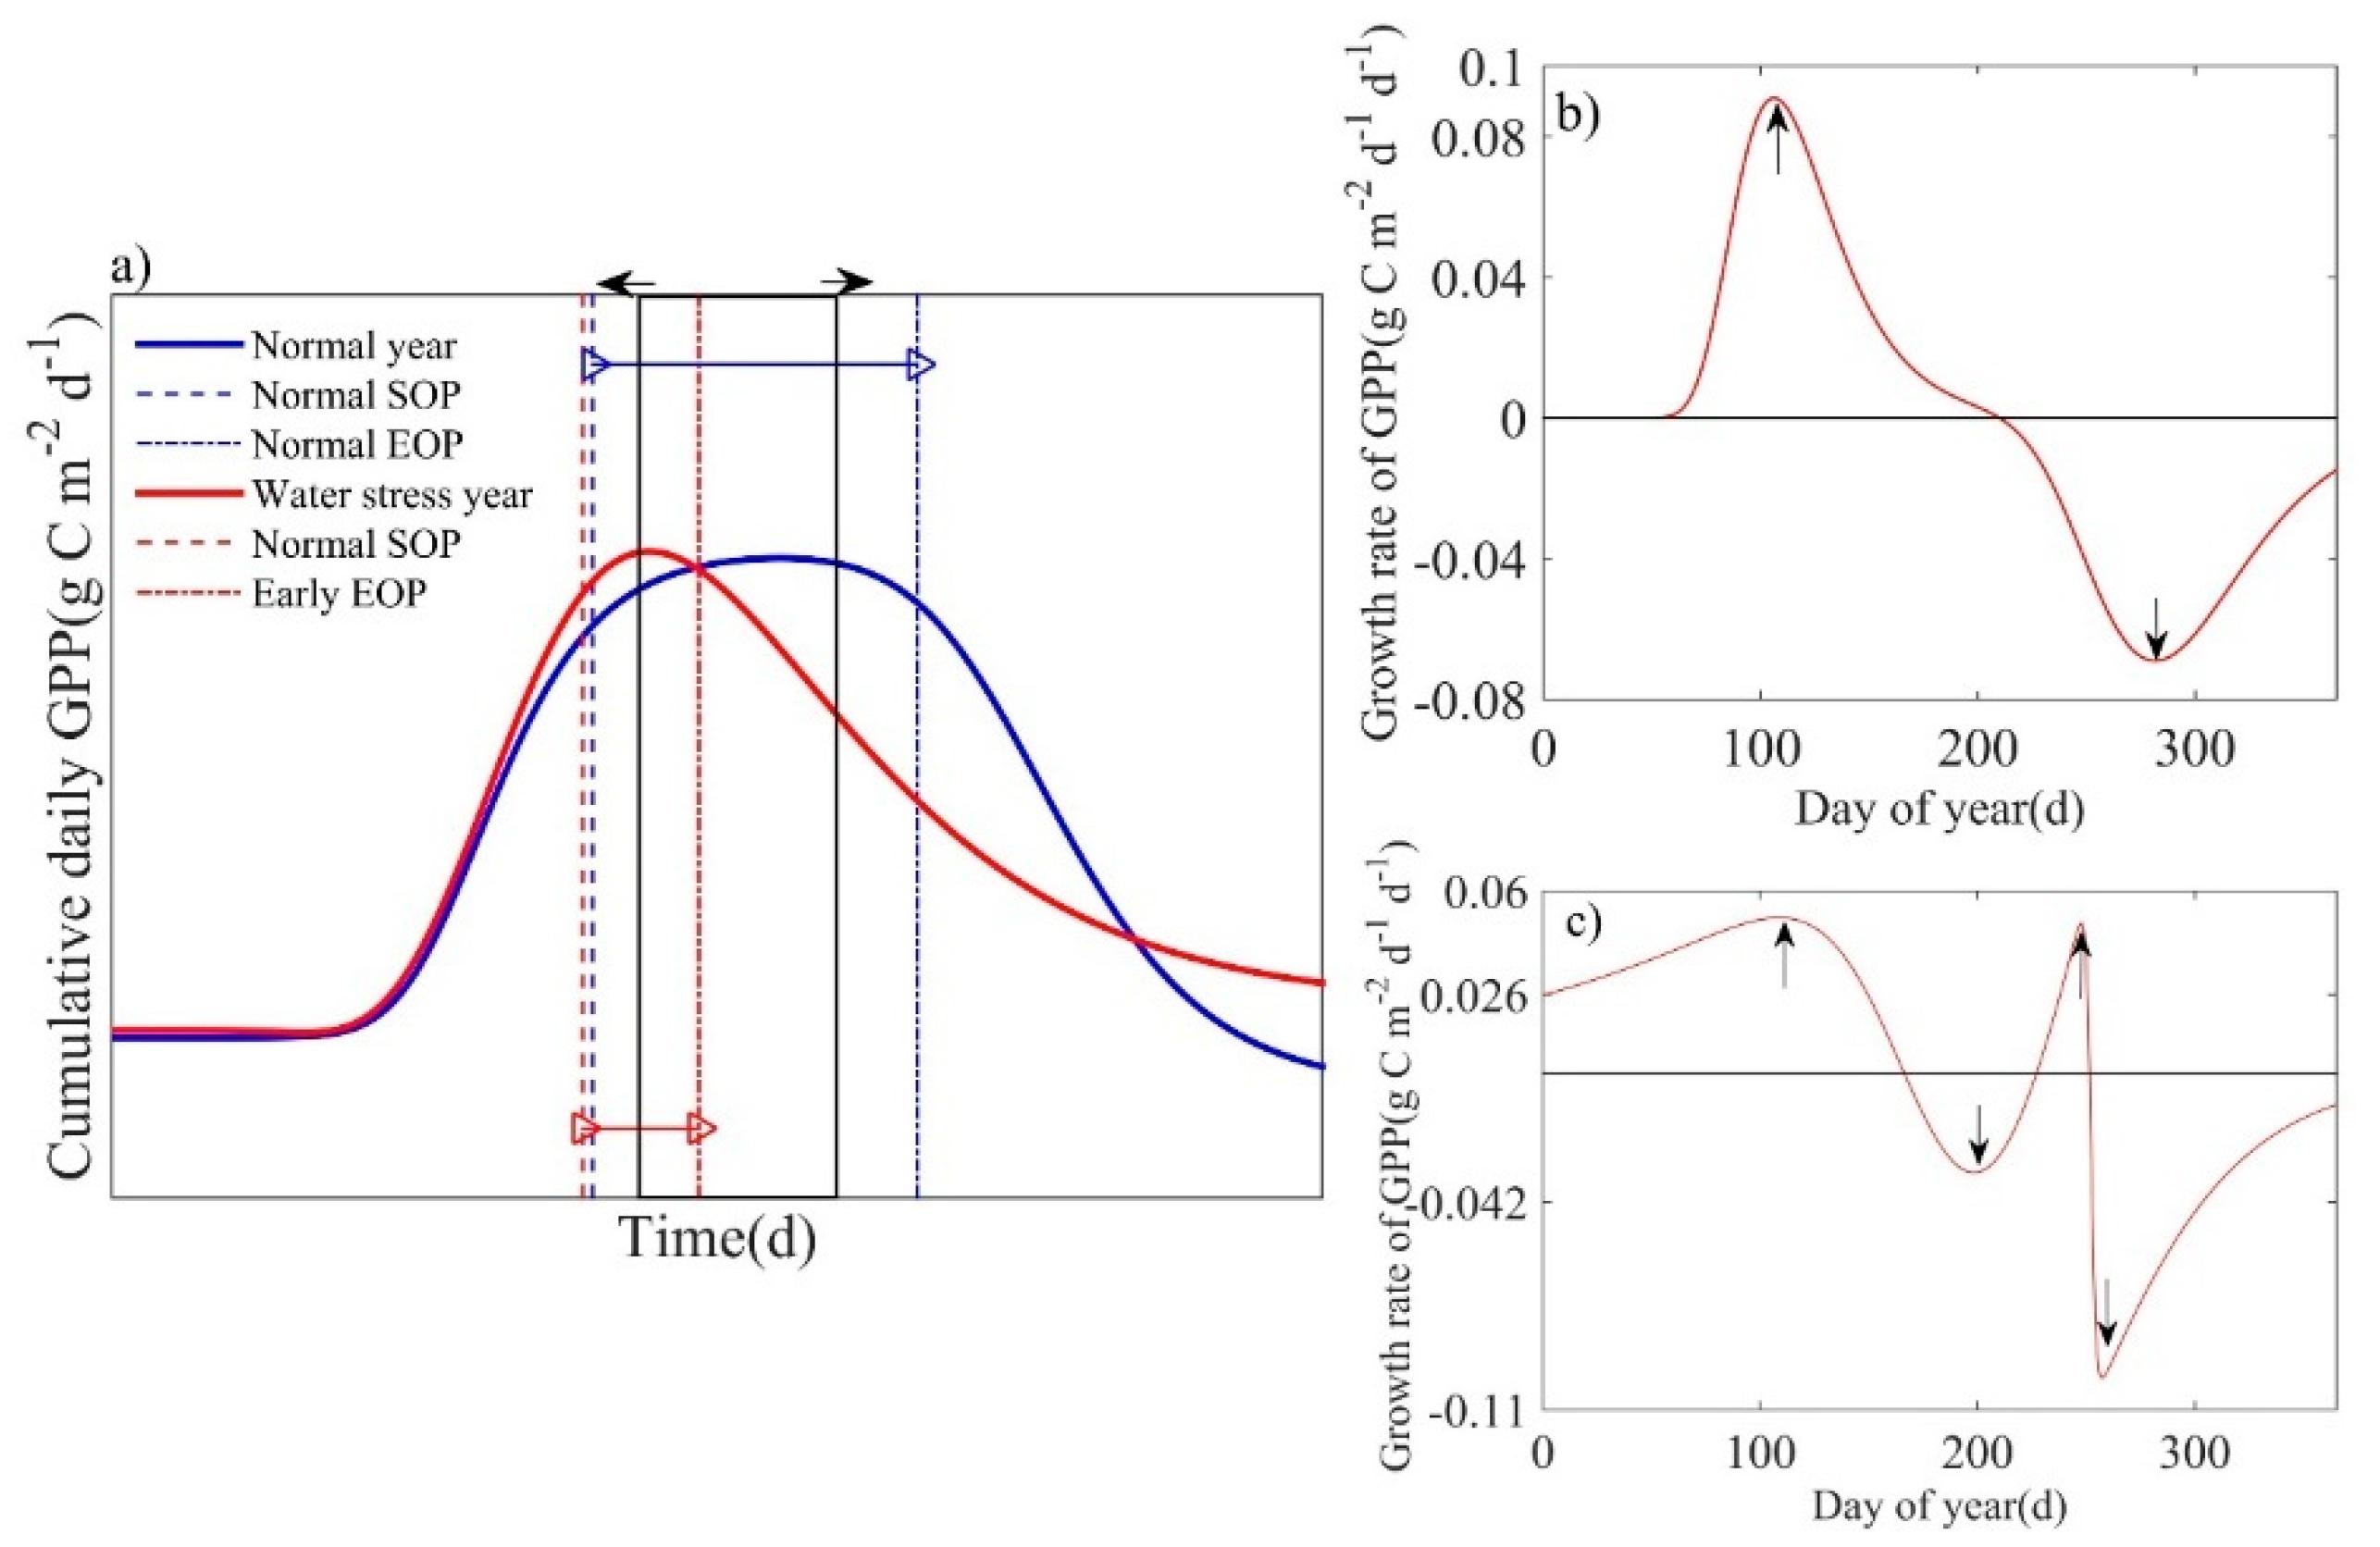
2.7. Response of Summer Day-to-Day Phenological Process
2.8. Long-Term Climate Data from NOAA
2.9. Statistical Analysis
3. Results
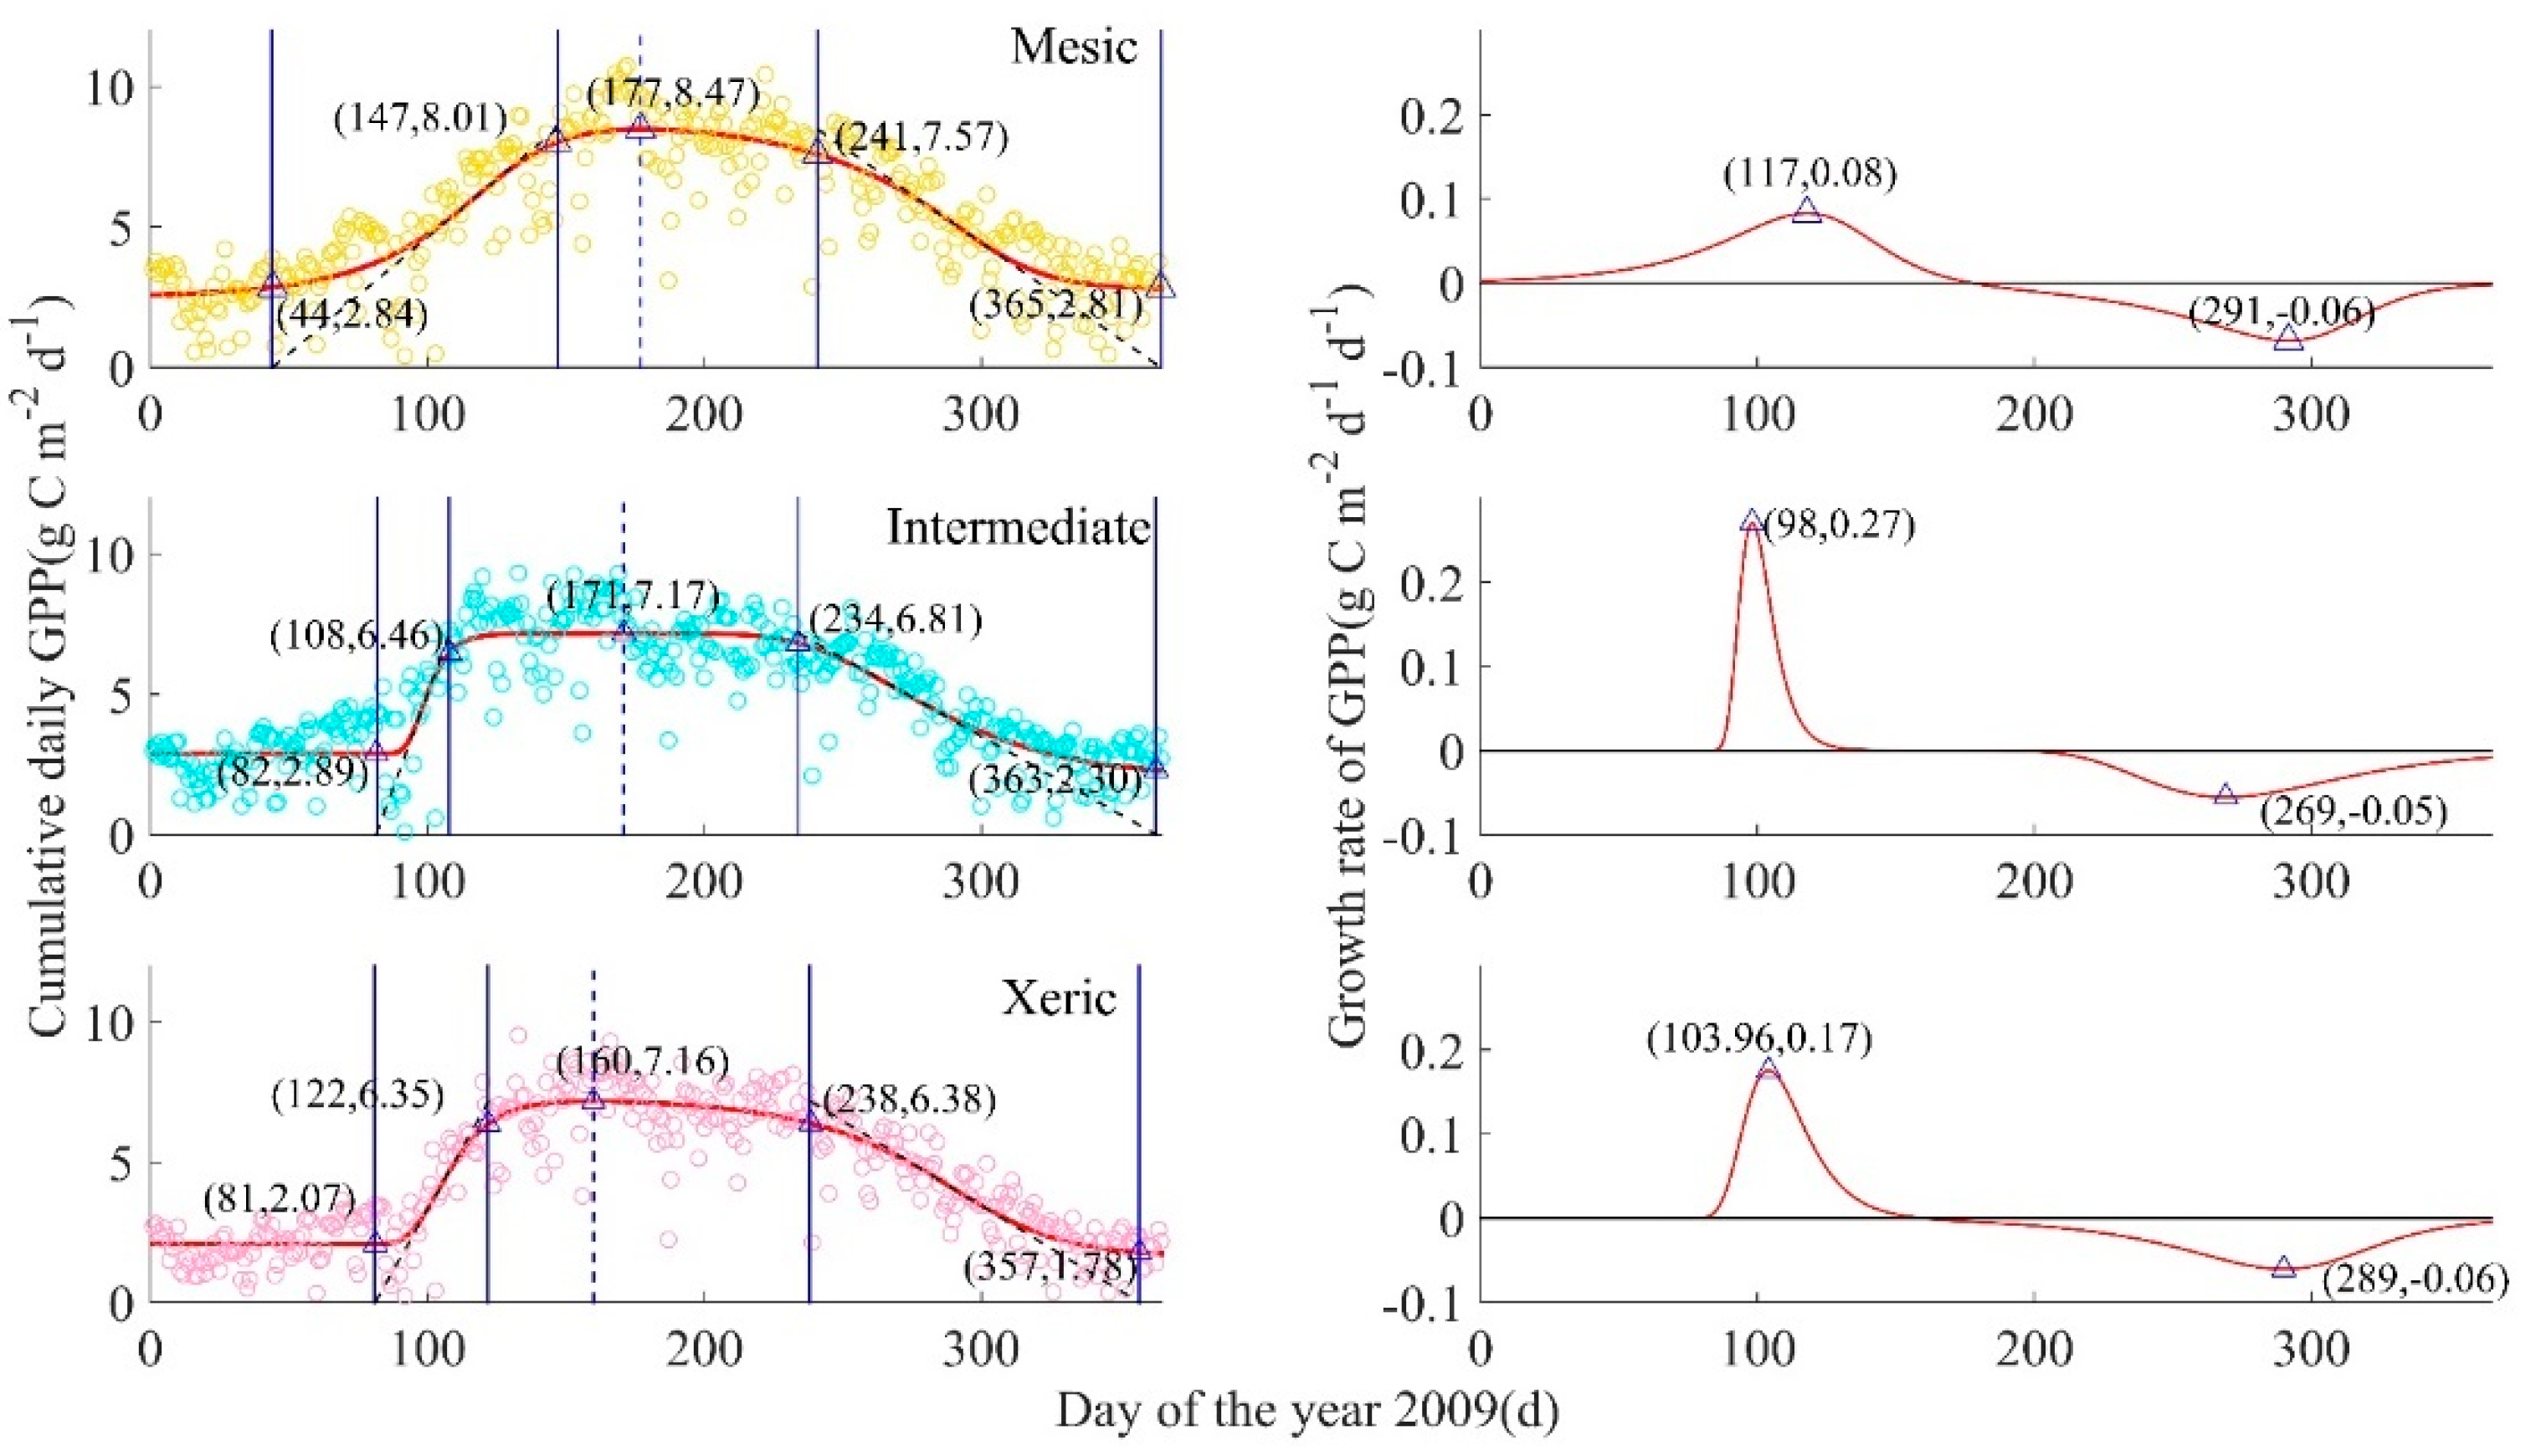
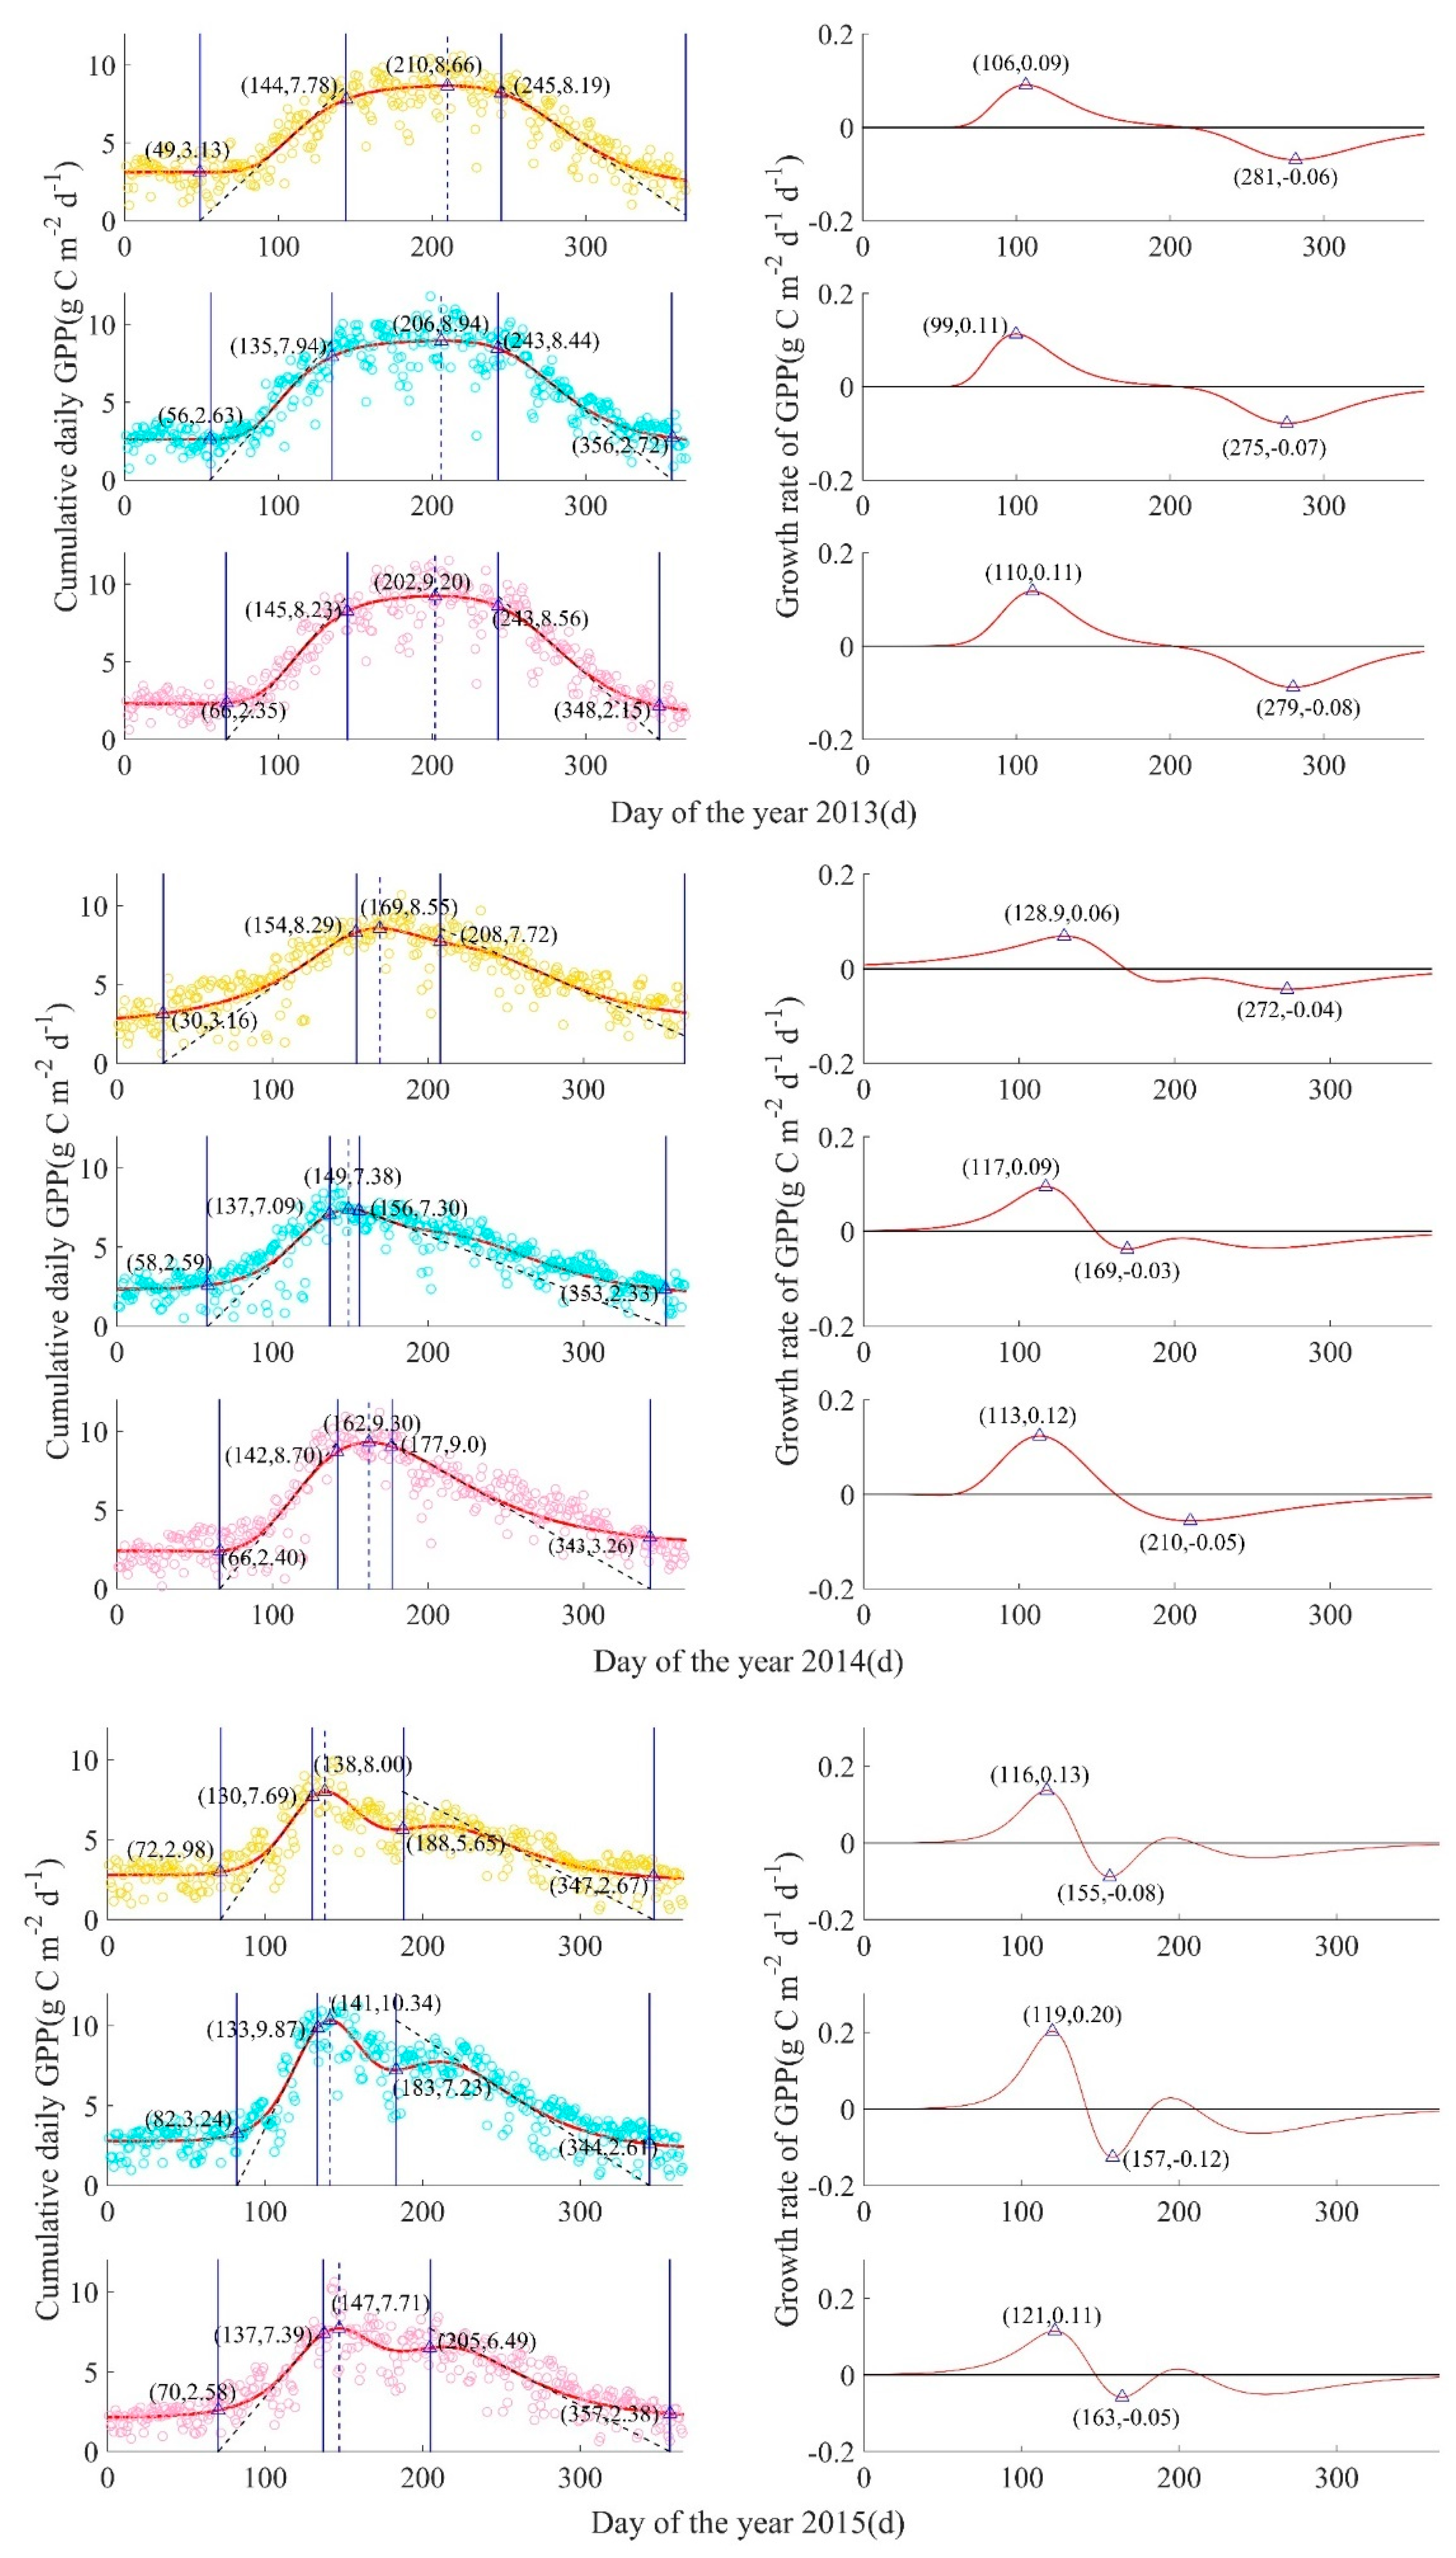
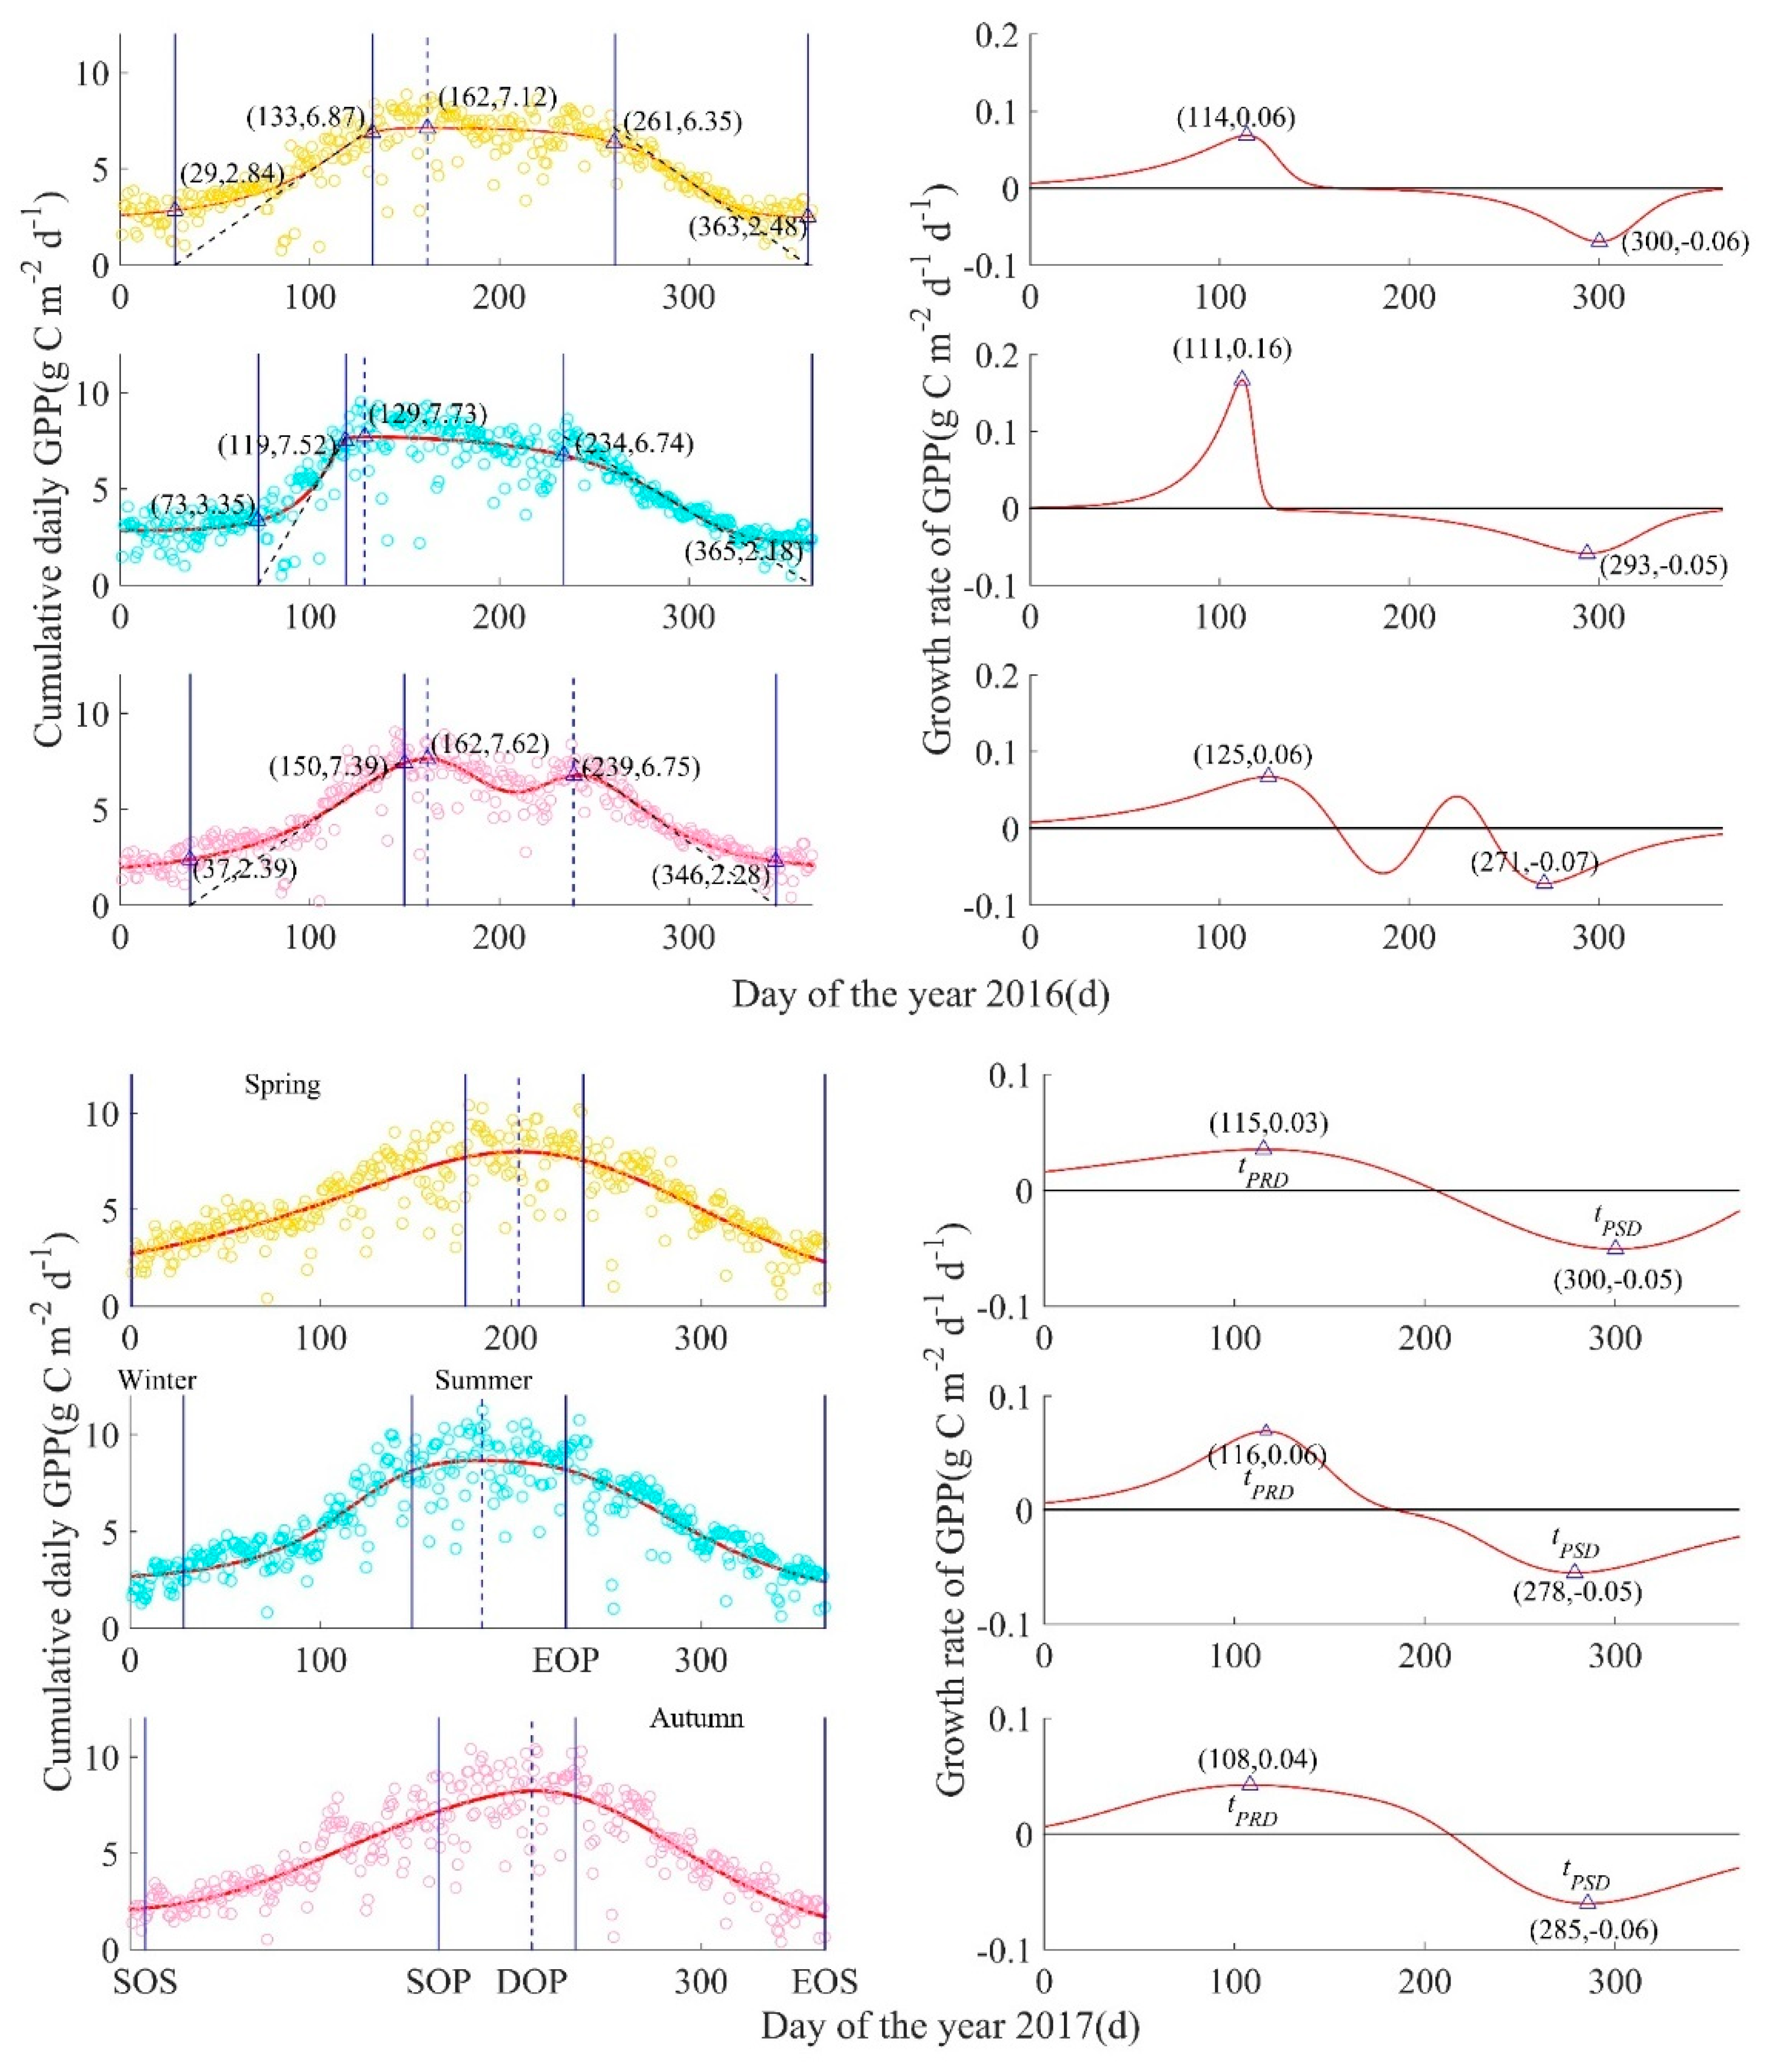
3.1. Application of Phenology Model for the Three EC Sites
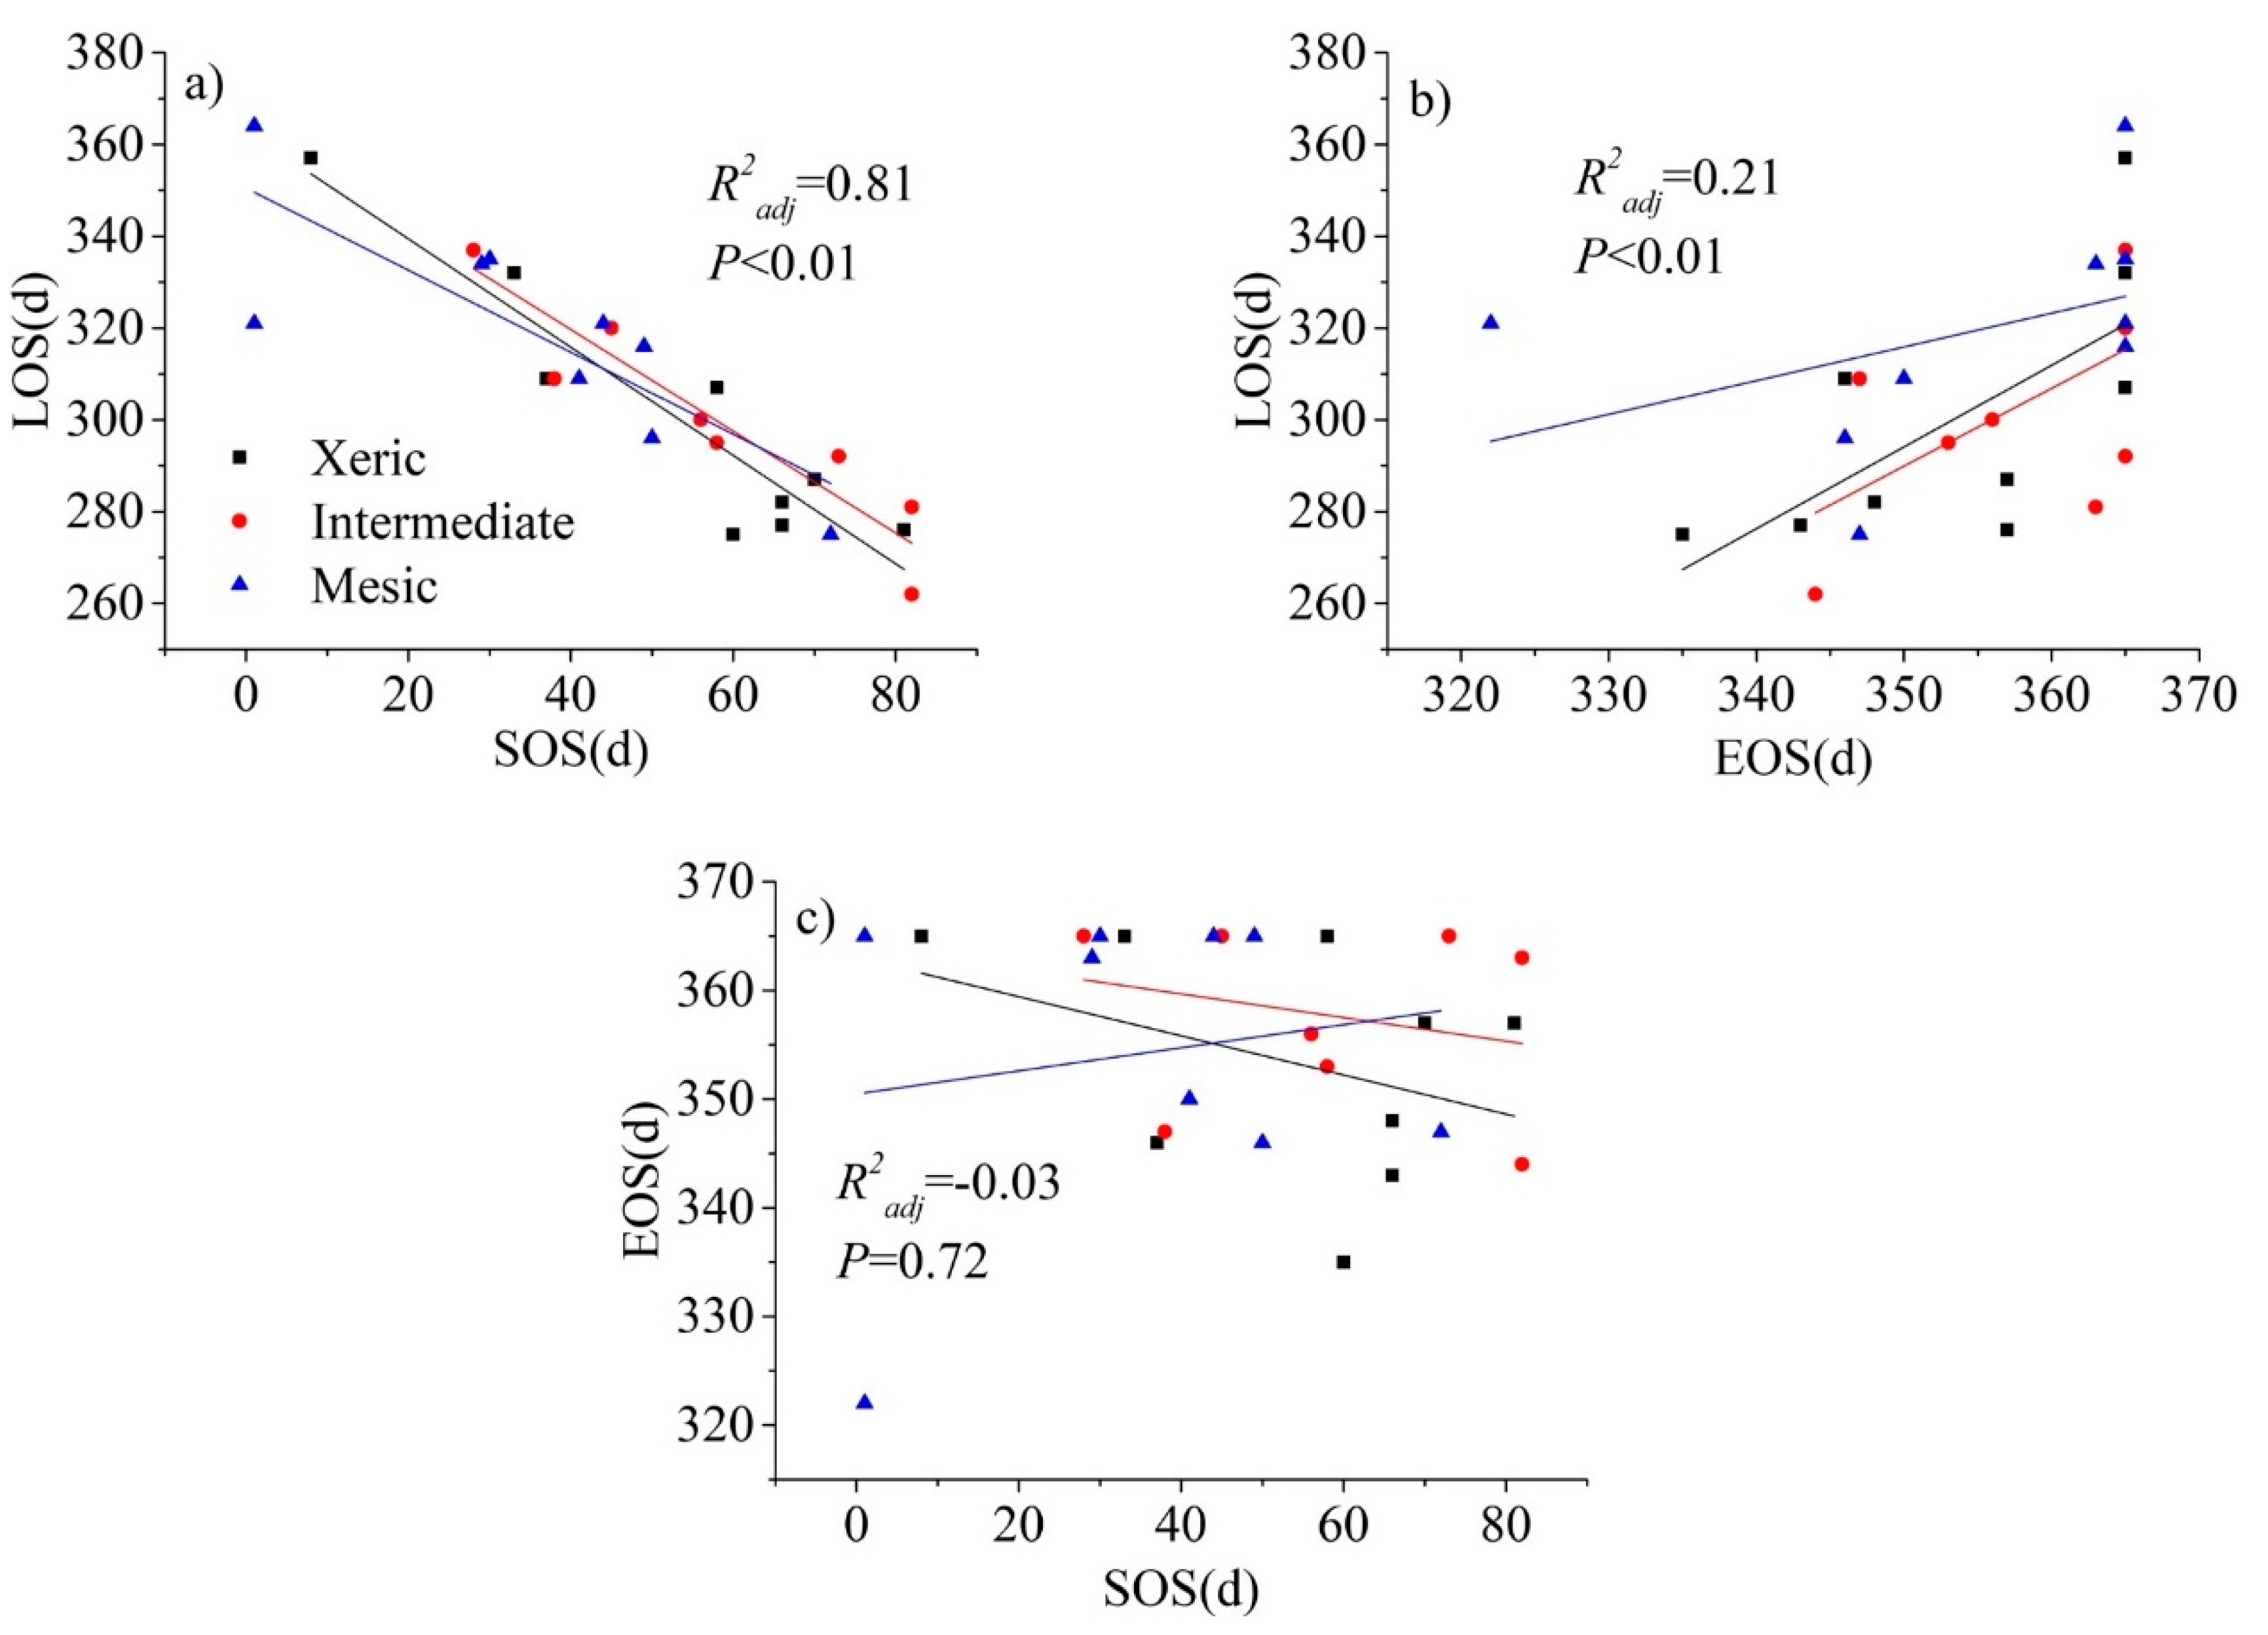
3.2. Ecosystem-Scale Phenological Characteristics
3.3. Response of Ecosystem-Scale Phenological Processes to Forest Management
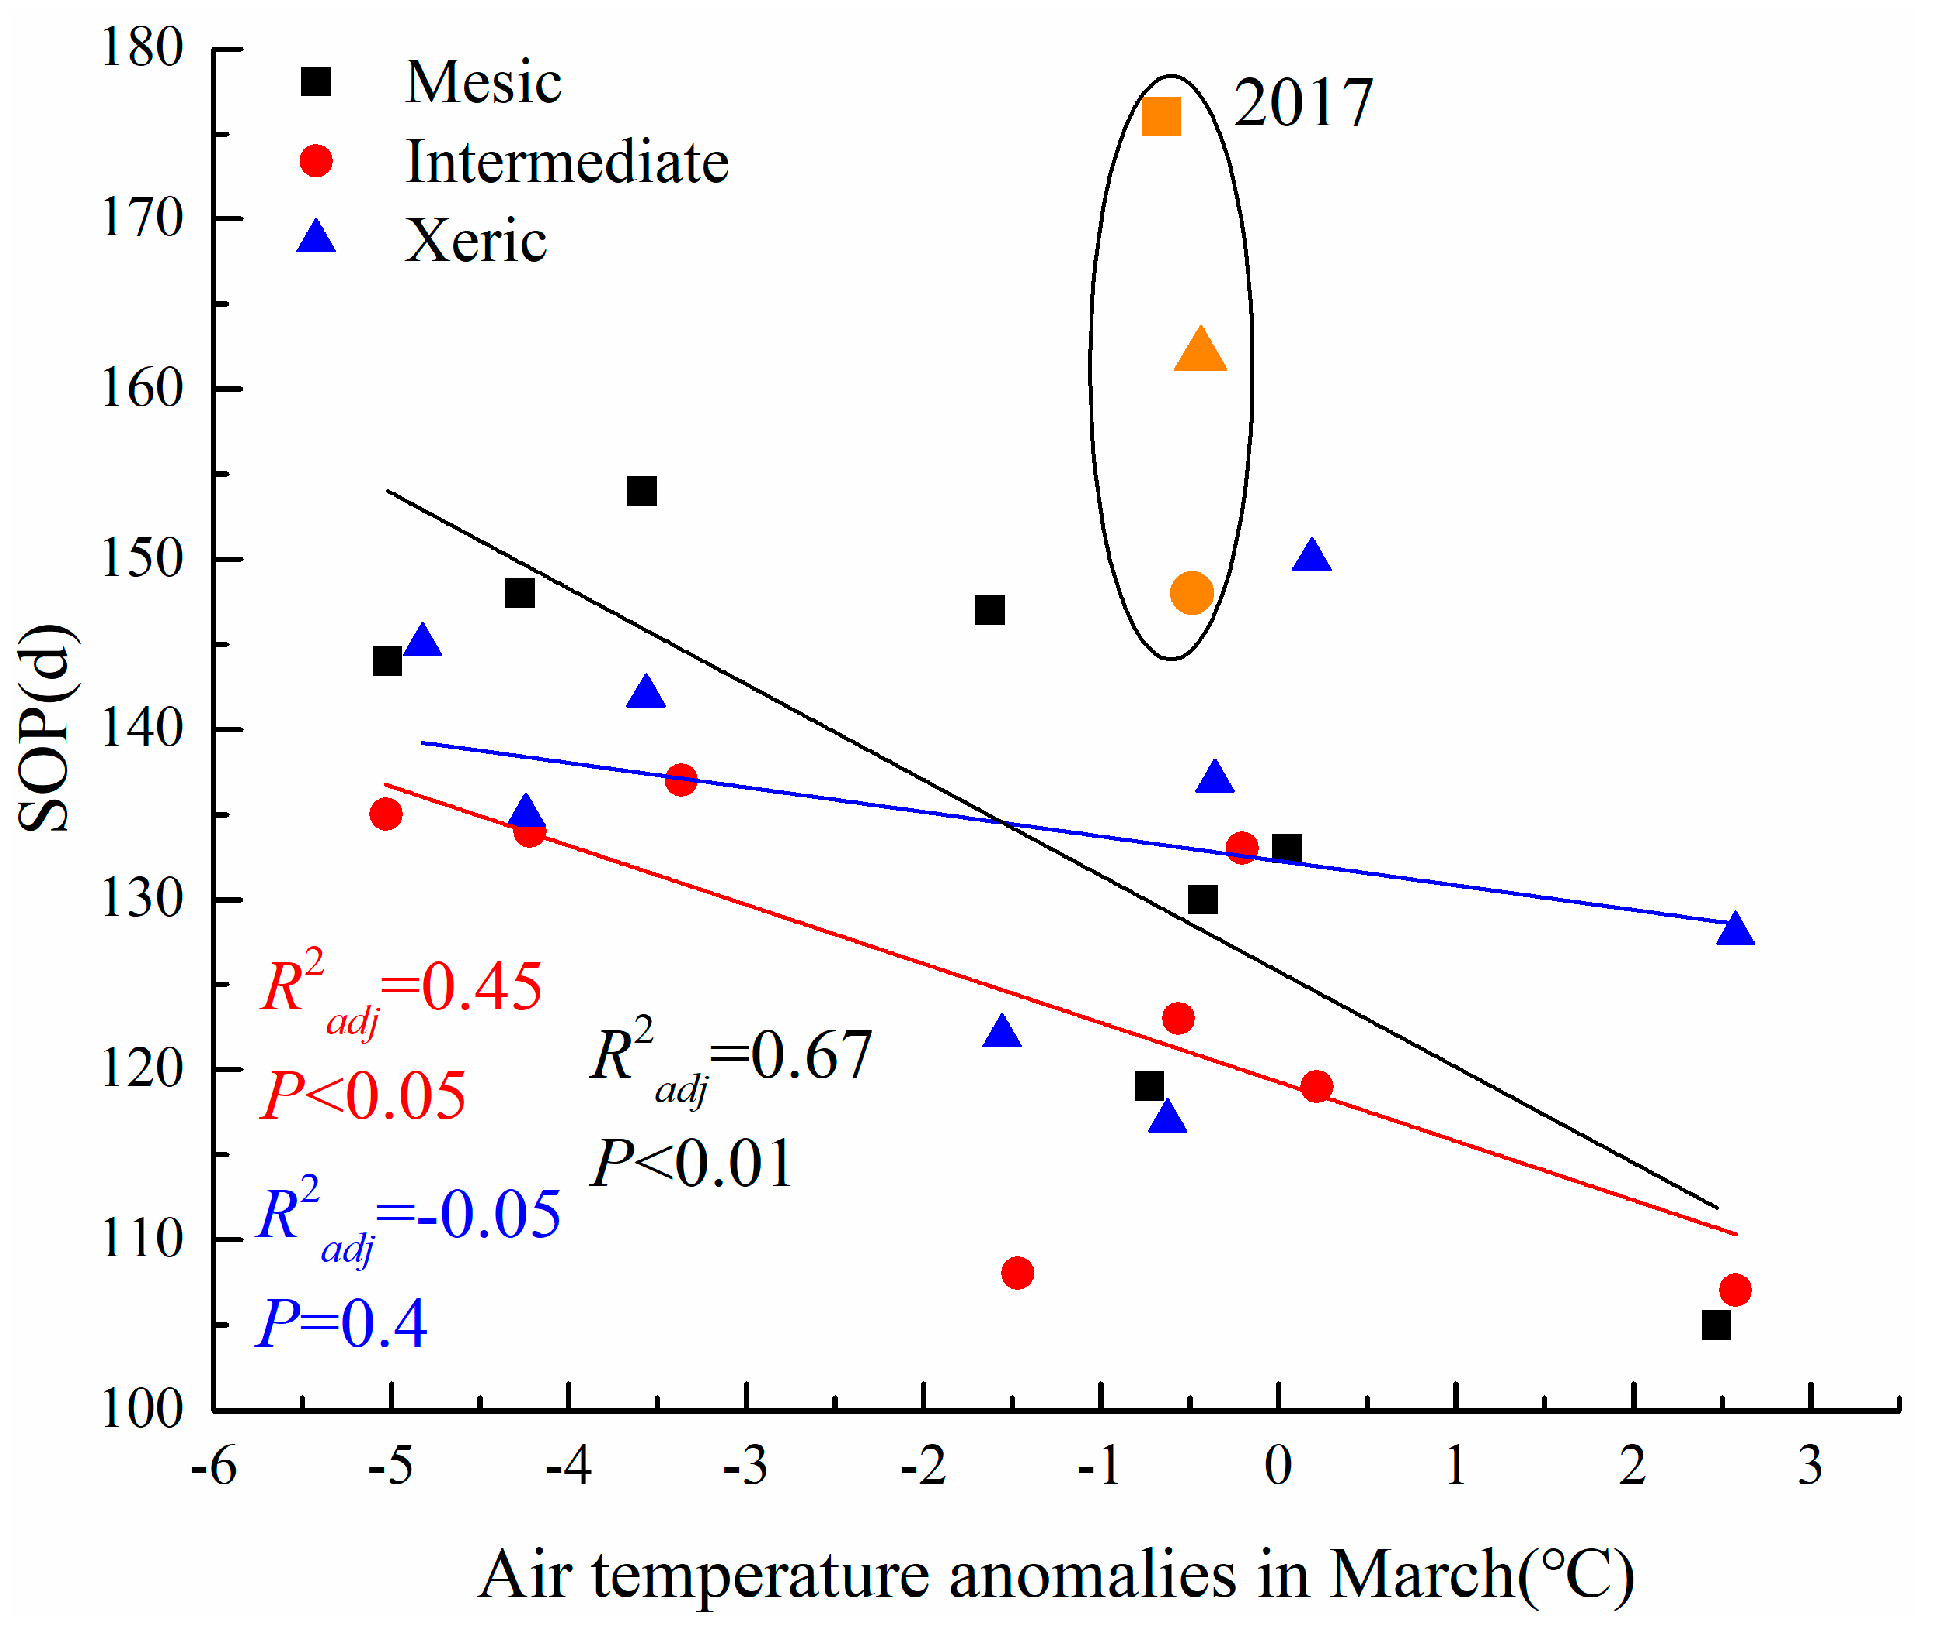
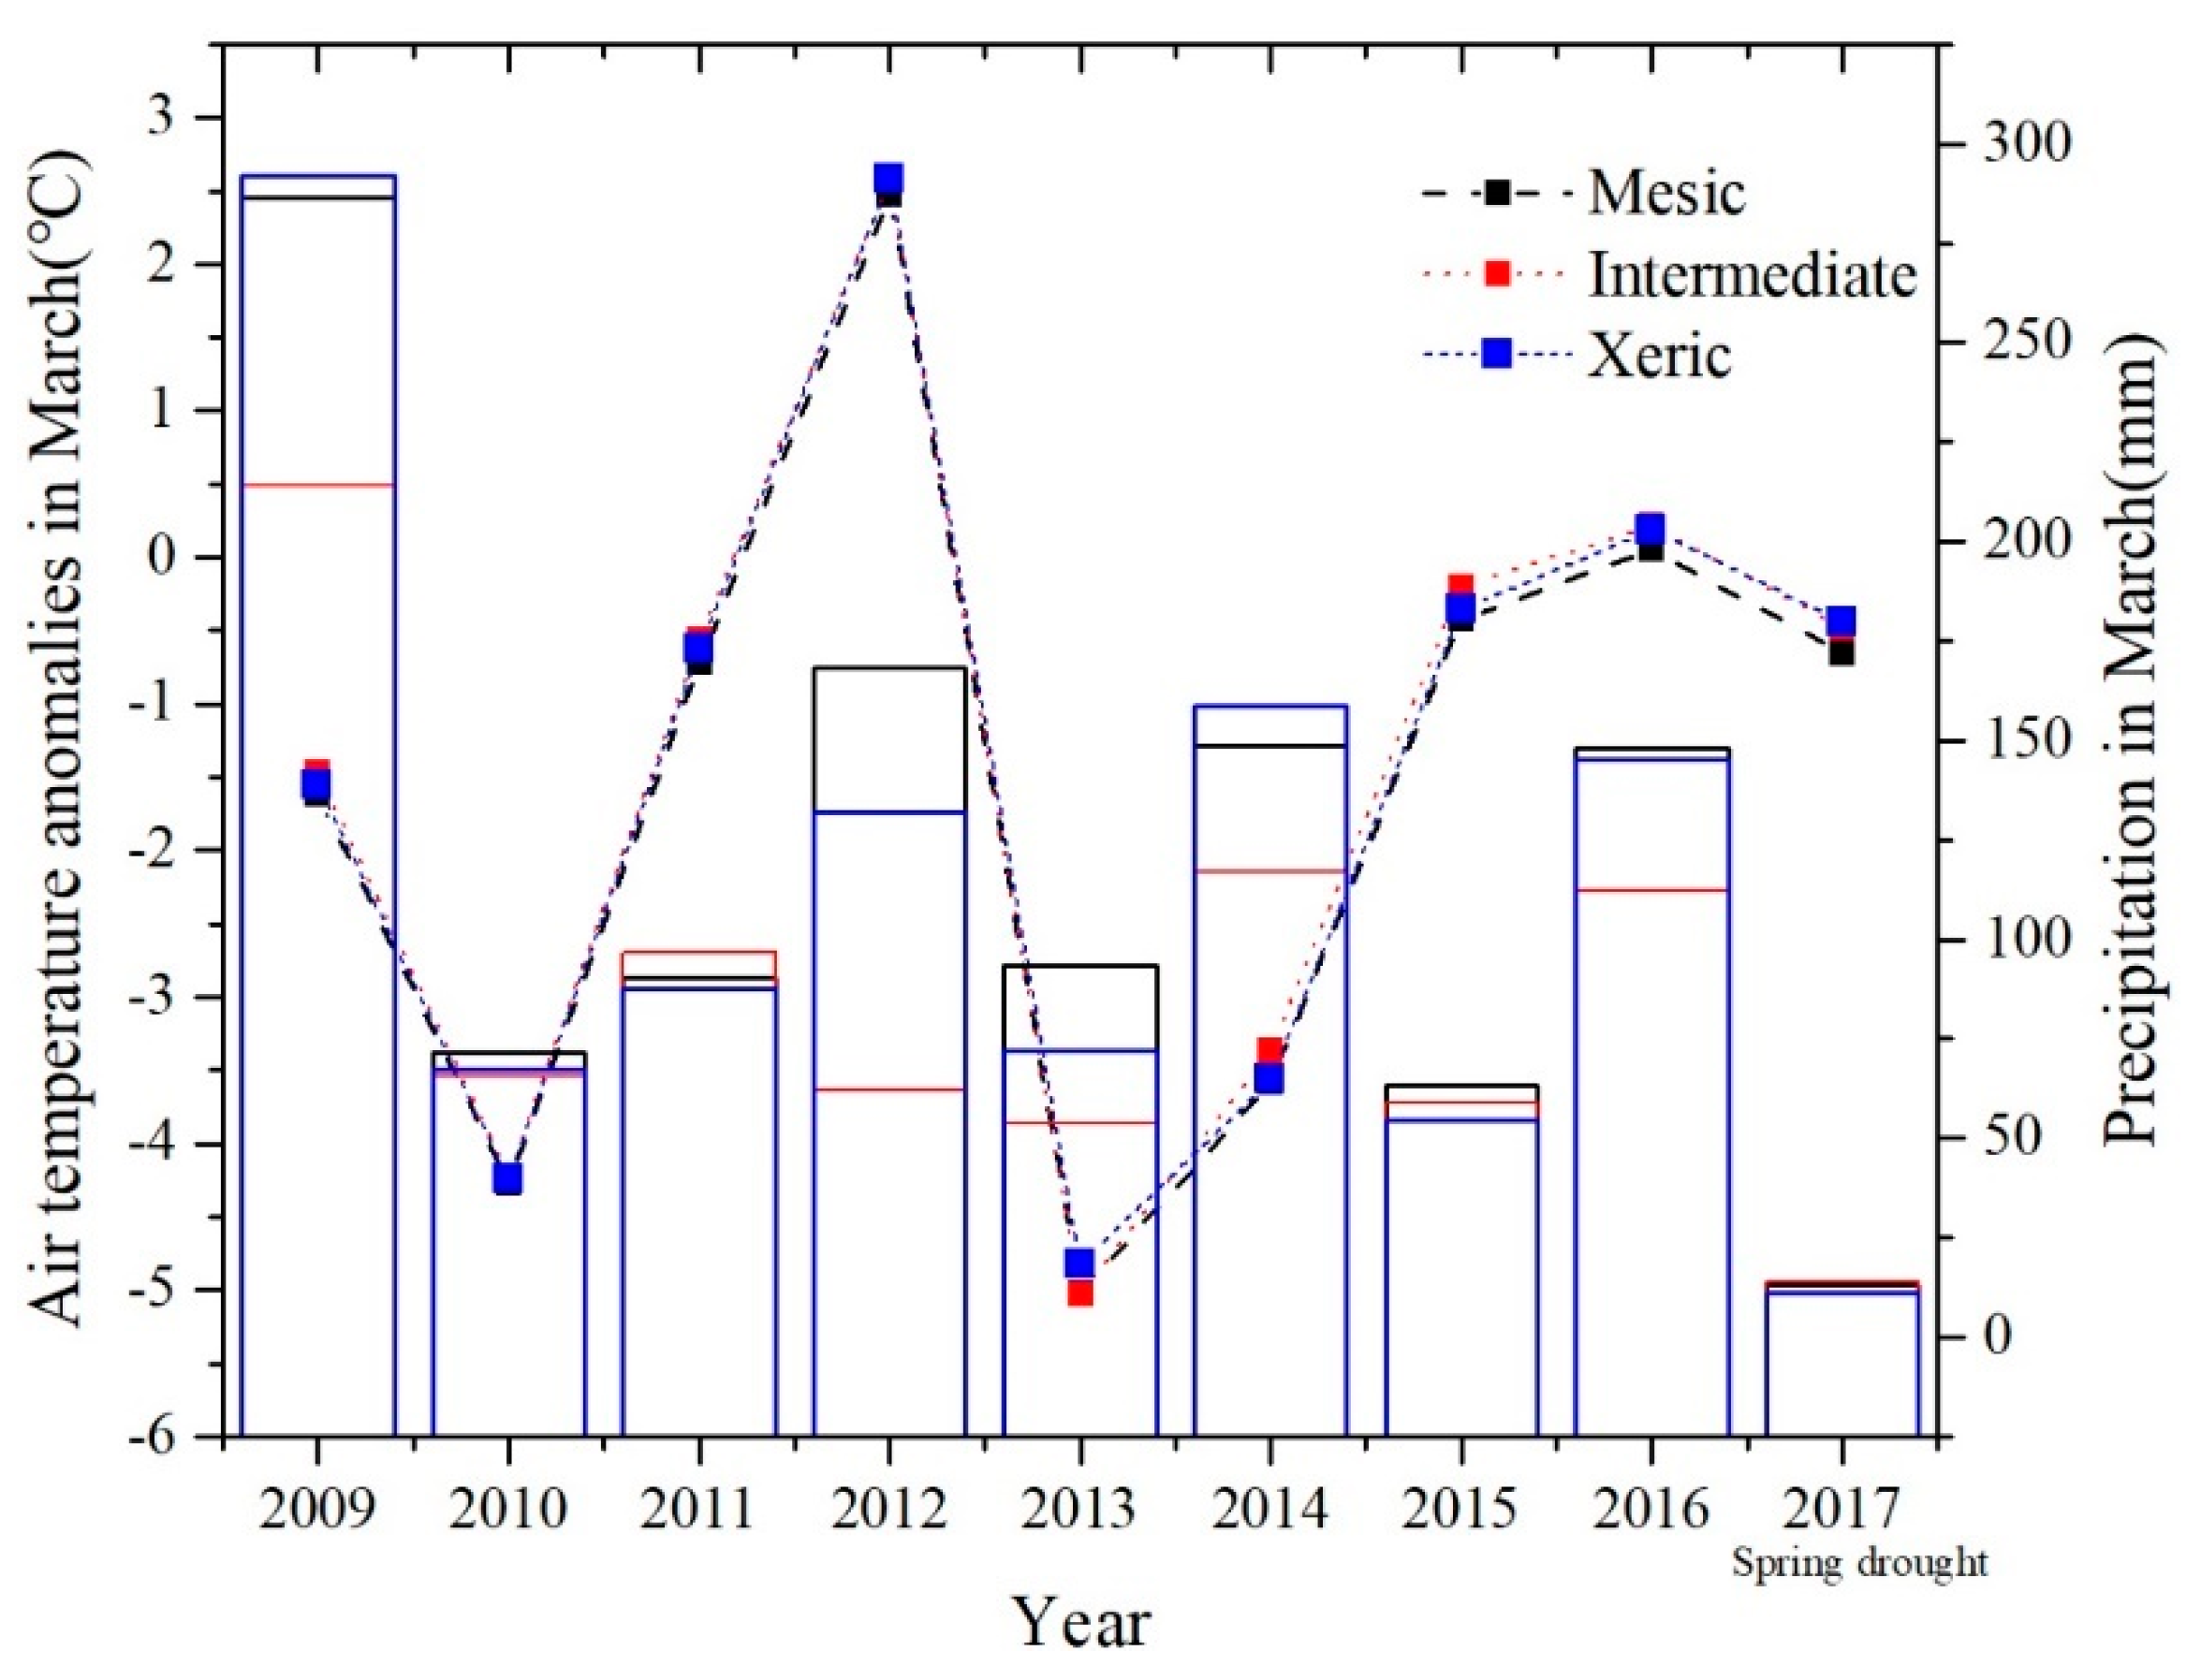
3.4. Inter-Annual Climate Control Factors for Ecosystem-Scale Phenological Processes
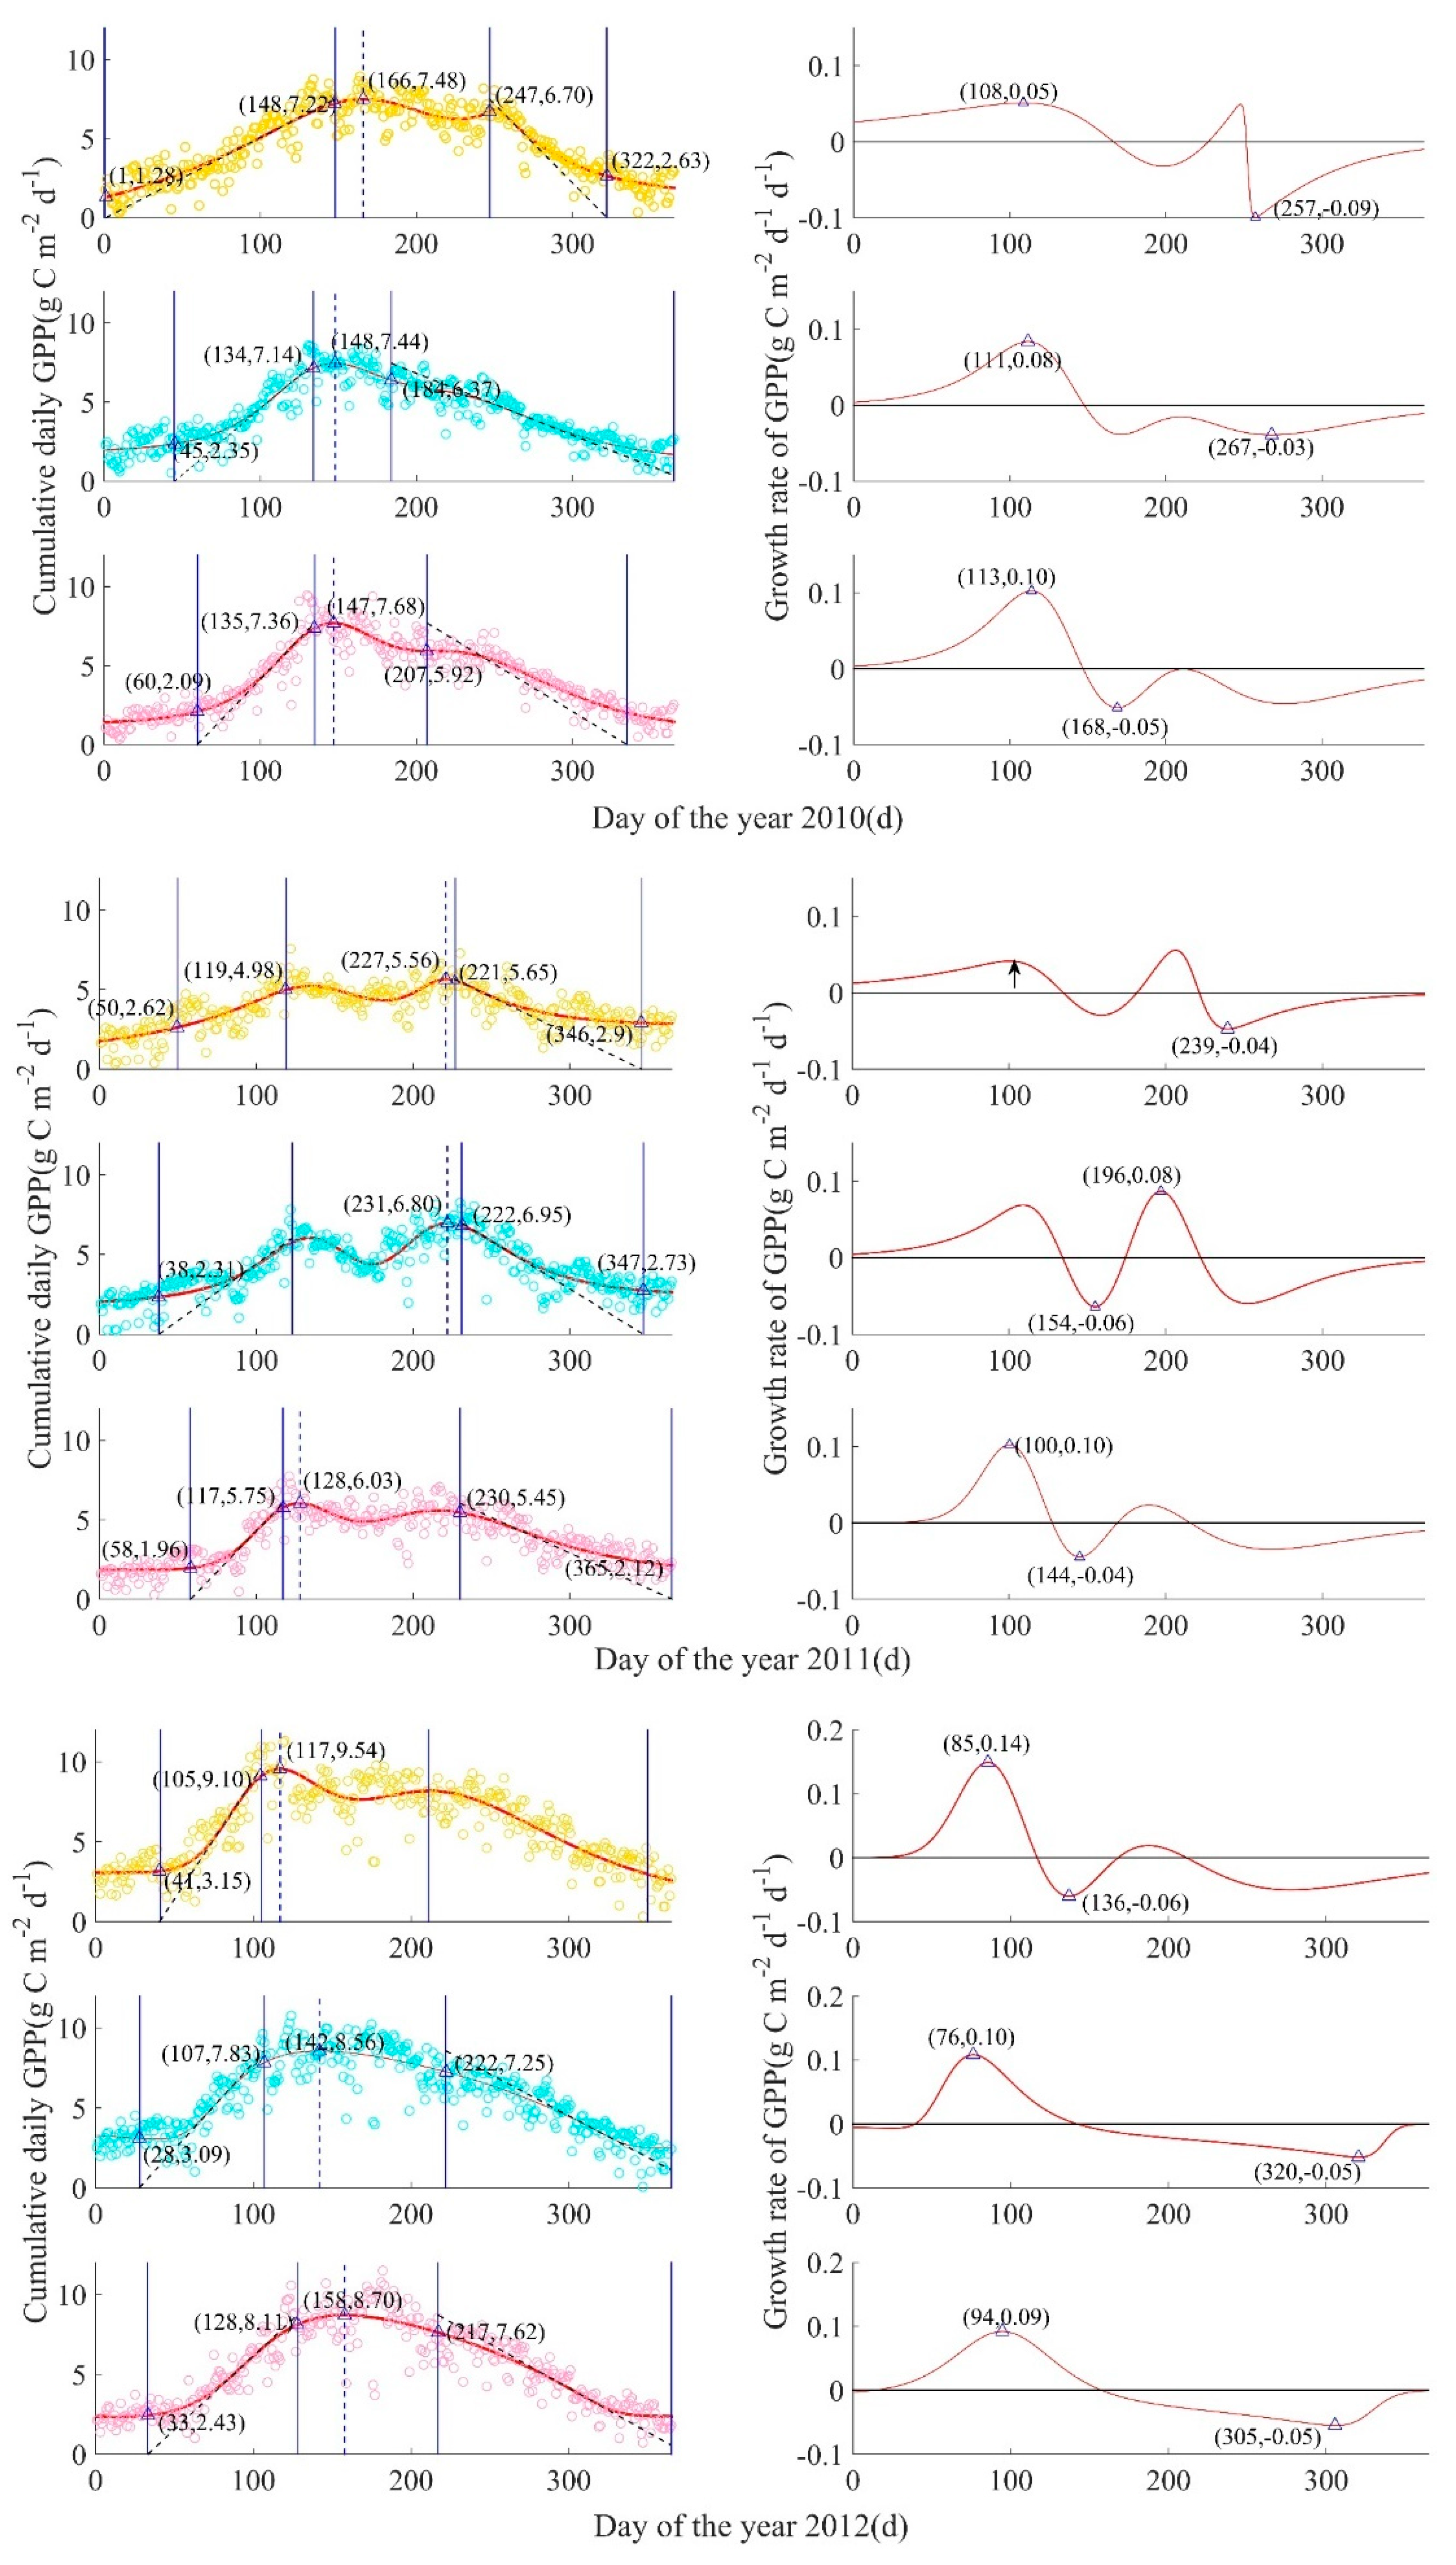
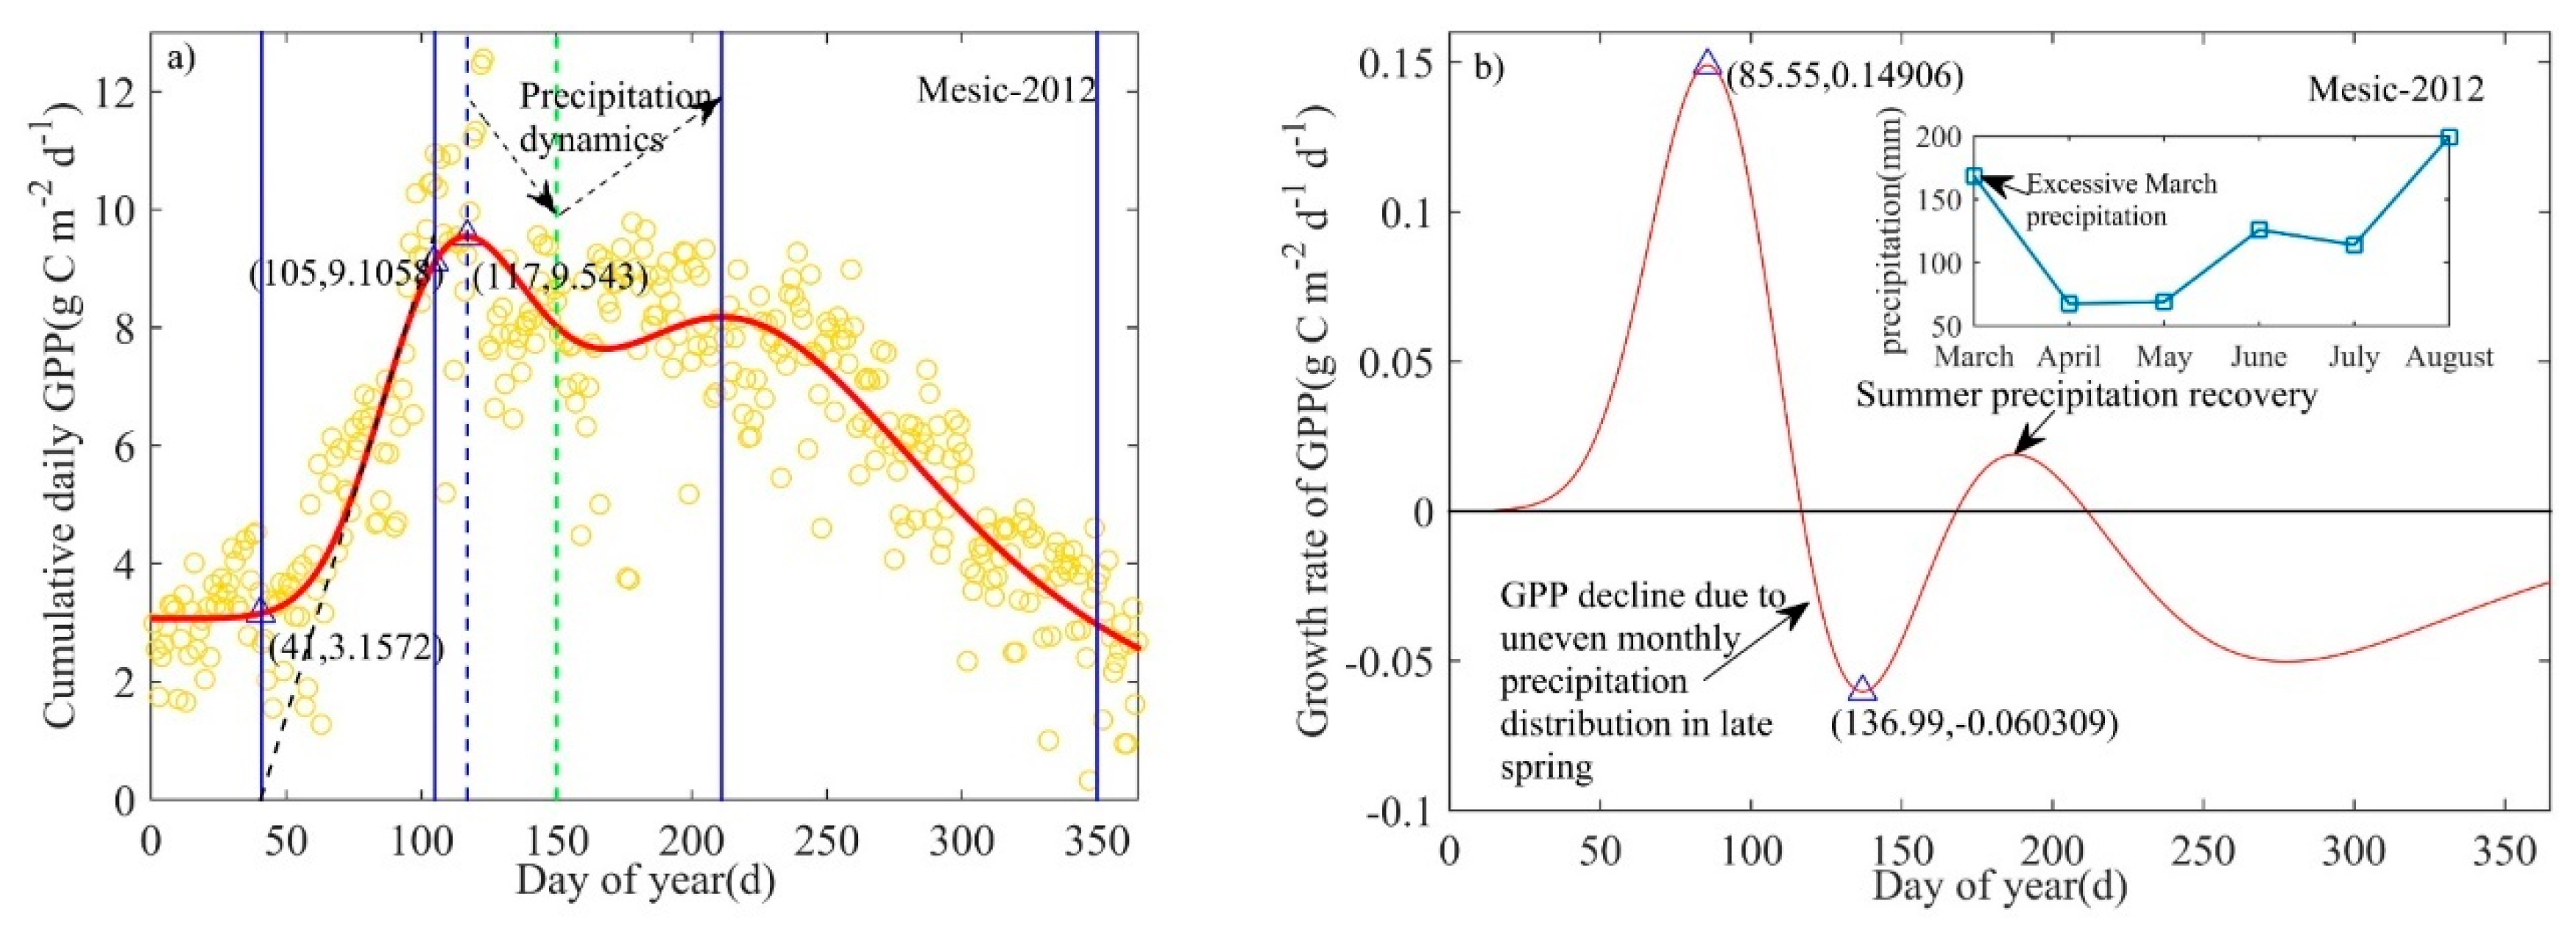
3.5. Response of Ecosystem-Scale Phenological Processes to Weather Disturbances
4. Discussion
4.1. Impact of Climate Change on the Phenological Process under Short-Term Weather Events
4.2. Effects of Soil Water Availability Gradients on Length of Growing Season at the Site-Level
4.3. Impact of Prescribed Fire on Ecosystem-Scale Phenology in Early Spring
4.4. Adaptability of Plant Community Photosynthesis to Spring Precipitation
4.5. Response of Ecosystem-Scale Summer Phenology
4.6. Management Implications
4.7. Limitations and Challenges
5. Conclusions
Author Contributions
Funding
Institutional Review Board Statement
Informed Consent Statement
Data Availability Statement
Acknowledgments
Conflicts of Interest
Appendix A

Appendix B


| SOS(d) | EOS(d) | LOS(d) | |||||||
|---|---|---|---|---|---|---|---|---|---|
| Year | Mesic | Inter. | Xeric | Mesic | Inter. | Xeric | Mesic | Inter. | Xeric |
| 2009 | 44 | 82 | 81 | 365 | 363 | 357 | 321 | 281 | 276 |
| 2010 | 1 | 45 | 60 | 322 | 365 | 335 | 321 | 320 | 275 |
| 2011 | 50 | 38 | 58 | 346 | 347 | 365 | 296 | 309 | 307 |
| 2012 | 41 | 28 | 33 | 350 | 365 | 365 | 309 | 337 | 332 |
| 2013 | 49 | 56 | 66 | 365 | 356 | 348 | 316 | 300 | 282 |
| 2014 | 30 | 58 | 66 | 365 | 353 | 343 | 335 | 295 | 277 |
| 2015 | 72 | 82 | 70 | 347 | 344 | 357 | 275 | 262 | 287 |
| 2016 | 29 | 73 | 37 | 363 | 365 | 346 | 334 | 292 | 309 |
| 2017 | 1 | 28 | 8 | 365 | 365 | 365 | 364 | 337 | 357 |
| AVG of F | 43 | 57 | 56 | 357 | 355 | 358 | 314 | 297 | 301 |
| AVG of NF | 25 | 51 | 49 | 350 | 362 | 347 | 324 | 311 | 298 |
| Effect | Estimate | F Statistic | NumDF | DenDF | p-Value | Partial η2 | |
|---|---|---|---|---|---|---|---|
| Intercept | Pillai’s Trace | 0.999 | 12,472.2 | 2 | 23 | <0.001 | 0.999 |
| Wilks’ Lambda | 0.001 | 12,472.2 | 2 | 23 | <0.001 | 0.999 | |
| Hotelling’s Trace | 1084.5 | 12,472.2 | 2 | 23 | <0.001 | 0.999 | |
| Roy’s Largest Root | 1084.5 | 12,472.2 | 2 | 23 | <0.001 | 0.999 | |
| Site | Pillai’s Trace | 0.186 | 1.229 | 4 | 48 | 0.311 | 0.093 |
| Wilks’ Lambda | 0.818 | 1.212 | 4 | 46 | 0.319 | 0.095 | |
| Hotelling’s Trace | 0.217 | 1.193 | 4 | 44 | 0.327 | 0.098 | |
| Roy’s Largest Root | 0.190 | 2.286 | 2 | 24 | 0.123 | 0.160 |
| Effect | Estimate | F Statistic | NumDF | DenDF | p-Value | Partial η2 | |
|---|---|---|---|---|---|---|---|
| Intercept | Pillai’s Trace | 0.999 | 6620.6 | 4 | 18 | <0.001 | 0.999 |
| Wilks’ Lambda | 0.001 | 6620.6 | 4 | 18 | <0.001 | 0.999 | |
| Hotelling’s Trace | 1471.2 | 6620.6 | 4 | 18 | <0.001 | 0.999 | |
| Roy’s Largest Root | 1471.2 | 6620.6 | 4 | 18 | <0.001 | 0.999 | |
| Site | Pillai’s Trace | 0.353 | 1.017 | 8 | 38 | 0.44 | 0.176 |
| Wilks’ Lambda | 0.676 | 0.975 | 8 | 36 | 0.47 | 0.178 | |
| Hotelling’s Trace | 0.438 | 0.931 | 8 | 34 | 0.50 | 0.180 | |
| Roy’s Largest Root | 0.297 | 1.412 | 4 | 19 | 0.26 | 0.229 | |
| Fire | Pillai’s Trace | 0.132 | 0.683 | 4 | 18 | 0.61 | 0.132 |
| Wilks’ Lambda | 0.868 | 0.683 | 4 | 18 | 0.61 | 0.132 | |
| Hotelling’s Trace | 0.152 | 0.683 | 4 | 18 | 0.61 | 0.132 | |
| Roy’s Largest Root | 0.152 | 0.683 | 4 | 18 | 0.61 | 0.132 | |
| Site x Fire | Pillai’s Trace | 0.334 | 0.951 | 8 | 38 | 0.48 | 0.167 |
| Wilks’ Lambda | 0.678 | 0.969 | 8 | 36 | 0.47 | 0.176 | |
| Hotelling’s Trace | 0.456 | 0.969 | 8 | 34 | 0.47 | 0.186 | |
| Roy’s Largest Root | 0.413 | 1.961 | 4 | 19 | 0.14 | 0.292 |
Appendix C

Appendix D

Appendix E
| Site | Year | SOD (GPP) | ROD (GPP) | POR (GPP) | LORS | LOF | LOR | Fading Rate | Recovery Rate |
|---|---|---|---|---|---|---|---|---|---|
| Mesic | 2010 | 167 (7.48) | 227 (6.22) | 252 (6.87) | 85 | 60 | 25 | −0.021 | 0.025 |
| 2011 | 135 (5.22) | 182 (4.32) | 221 (5.65) | 86 | 47 | 39 | −0.019 | 0.034 | |
| 2014 | 169 (8.55) | NC | NC | NC | NC | NC | NC | NC | |
| 2015 | 138 (8.00) | 184 (5.63) | 210 (5.86) | 72 | 46 | 26 | −0.051 | 0.008 | |
| Inter- | 2010 | 148 (7.44) | NC | NC | NC | NC | NC | NC | NC |
| mediate | 2011 | 134 (6.03) | 174 (4.38) | 222 (6.95) | 88 | 40 | 48 | −0.041 | 0.053 |
| 2014 | 149 (7.38) | NC | NC | NC | NC | NC | NC | NC | |
| 2015 | 142 (10.35) | 183 (7.23) | 211 (7.75) | 69 | 41 | 28 | −0.076 | 0.018 | |
| Xeric | 2010 | 147 (7.68) | NC | NC | NC | NC | NC | NC | NC |
| 2011 | 128 (6.04) | 173 (4.90) | 216 (5.58) | 88 | 45 | 43 | −0.025 | 0.015 | |
| 2014 | 162 (9.30) | NC | NC | NC | NC | NC | NC | NC | |
| 2015 | 147 (7.71) | 188 (6.28) | 214 (6.54) | 67 | 41 | 26 | −0.034 | 0.01 | |
| 2016 | 162 (7.62) | 209 (5.89) | 241 (6.76) | 79 | 47 | 32 | −0.036 | 0.027 |
Appendix F

References
- Mitchard, E.T. The tropical forest carbon cycle and climate change. Nature 2018, 559, 527–534. [Google Scholar] [CrossRef] [PubMed]
- Gong, Y.; Zhang, Y. Characteristics of CO2 flux over a temperate mixed forest ecosystem and its response to air temperature. J. Northeast. For. Univ. 2020, 48, 40–44. [Google Scholar] [CrossRef]
- Pita, G.; Gielen, B.; Zona, D.; Rodrigues, A.; Rambal, S.; Janssens, I.A.; Ceulemans, R. Carbon and water vapor fluxes over four forests in two contrasting climatic zones. Agric. For. Meteorol. 2013, 180, 211–224. [Google Scholar] [CrossRef]
- Gong, Y.; Zhao, M.; Yao, X.; Guo, Z.J.; He, Y.; Zhang, L.P.; Lin, W.P. Study on carbon flux characteristics of the underlying surface of urban ecosystem—a case study of Shanghai Fengxian University City. Resour. Environ. Yangtze Basin 2017, 26, 91–99. [Google Scholar] [CrossRef]
- Yao, Y.; Piao, S.; Wang, T. Future biomass carbon sequestration capacity of Chinese forests. Sci. Bull. 2018, 63, 1108–1117. [Google Scholar] [CrossRef]
- Qiu, Z.; Feng, Z.; Song, Y.; Li, M.; Zhang, P. Carbon sequestration potential of forest vegetation in China from 2003 to 2050: Predicting forest vegetation growth based on climate and the environment. J. Clean. Prod. 2020, 252, 119715. [Google Scholar] [CrossRef]
- Hayhoe, K.; Wake, C.P.; Huntington, T.G.; Luo, L.; Schwartz, M.D.; Sheffield, J.; Wood, E.; Anderson, B.; Bradbury, J.; DeGaetano, A.; et al. Past and future changes in climate and hydrological indicators in the US Northeast. Clim. Dyn. 2007, 28, 381–407. [Google Scholar] [CrossRef]
- Richardson, A.D.; Keenan, T.F.; Migliavacca, M.; Ryu, Y.; Sonnentag, O.; Toomey, M. Climate change, phenology, and phenological control of vegetation feedbacks to the climate system. Agric. For. Meteorol. 2013, 169, 156–173. [Google Scholar] [CrossRef]
- Pastor-Guzman, J.; Dash, J.; Atkinson, P.M. Remote sensing of mangrove forest phenology and its environmental drivers. Remote Sens. Environ. 2018, 205, 71–84. [Google Scholar] [CrossRef]
- Li, H.; Wang, C.; Zhang, L.; Li, X.; Zang, S. Satellite monitoring of boreal forest phenology and its climatic responses in Eurasia. Int. J. Remote Sens. 2017, 38, 5446–5463. [Google Scholar] [CrossRef]
- Xu, X.; Du, H.; Fan, W.; Hu, J.; Mao, F.; Dong, H. Long-term trend in vegetation gross primary production, phenology and their relationships inferred from the FLUXNET data. J. Environ. Manag. 2019, 246, 605–616. [Google Scholar] [CrossRef] [PubMed]
- Tao, F.; Yokozawa, M.; Xu, Y.; Hayashi, Y.; Zhang, Z. Climate changes and trends in phenology and yields of field crops in China, 1981–2000. Agric. For. Meteorol. 2006, 138, 82–92. [Google Scholar] [CrossRef]
- Gonsamo, A.; Chen, J.M.; D’Odorico, P. Deriving land surface phenology indicators from CO2 eddy covariance measurements. Ecol. Indic. 2013, 29, 203–207. [Google Scholar] [CrossRef]
- Rodriguez-Galiano, V.; Dash, J.; Atkinson, P.M. Intercomparison of satellite sensor land surface phenology and ground phenology in Europe. Geophys. Res. Lett. 2015, 42, 2253–2260. [Google Scholar] [CrossRef]
- Zhao, J.; Zhang, Y.-P.; Tan, Z.; Song, Q.-H.; Liang, N.; Yu, L.; Zhao, J. Using digital cameras for comparative phenological monitoring in an evergreen broad-leaved forest and a seasonal rain forest. Ecol. Inform. 2012, 10, 65–72. [Google Scholar] [CrossRef]
- Li, M.; Wu, Z.F.; Du, H.B.; Zong, S.W.; Meng, X.J.; Zhang, L.Z. Growing-season trends determined from SPOT NDVI in Changbai Mountains, China, 1999–2008. Sci. Geogr. Sin. 2011, 31, 1242–1248. [Google Scholar]
- Gong, Y.; Ji, X.; Hua, Y.; Zhang, Y.; Li, N. Research progress of CO2 flux in forest ecosystem based on eddy covariance technique: A review. J. Zhejiang A F Univ. 2020, 37, 593–604. [Google Scholar] [CrossRef]
- Chandola, V.; Hui, D.; Gu, L.; Bhaduri, B.; Vatsavai, R.R. Using Time Series Segmentation for Deriving Vegetation Phenology Indices from MODIS NDVI Data. In Proceedings of the 2010 IEEE International Conference on Data Mining Workshops, Sydney, Australia, 13 December 2010; pp. 202–208. [Google Scholar]
- Gonsamo, A.; Chen, J.M.; Price, D.T.; Kurz, W.A.; Wu, C. Land surface phenology from optical satellite measurement and CO2 eddy covariance technique. J. Geophys. Res. Space Phys. 2012, 117, 03032. [Google Scholar] [CrossRef]
- Gonsamo, A.; Croft, H.; Chen, J.M.; Wu, C.; Froelich, N.; Staebler, R.M. Radiation contributed more than temperature to increased decadal autumn and annual carbon uptake of two eastern North America mature forests. Agric. For. Meteorol. 2015, 201, 8–16. [Google Scholar] [CrossRef]
- Qiu, J.H.; Chen, H.B.; Wang, J.C.; Lu, D.R. A prospect on future atmospheric remote sensing. Chin. J. Atmos. Sci. 2005, 29, 131–136. [Google Scholar]
- Loarie, S.R.; Joppa, L.N.; Pimm, S.L. Satellites miss environmental priorities. Trends Ecol. Evol. 2007, 22, 630–632. [Google Scholar] [CrossRef] [PubMed]
- Zhang, Z.M.; Xu, Q.; Wang, B.; Sun, H.; Geng, Y.P.; Tian, J. Applications of unmanned aerial vehicles remote sensing technology in landscape ecology. Acta Ecol. Sin. 2017, 37, 4029–4036. [Google Scholar]
- Zhang, X.; Friedl, M.A.; Schaaf, C.B.; Strahler, A.H.; Hodges, J.C.F.; Gao, F.; Reed, B.C.; Huete, A. Monitoring vegetation phenology using MODIS. Remote Sens. Environ. 2003, 84, 471–475. [Google Scholar] [CrossRef]
- Jin, J.; Zhan, W.; Wang, Y.; Gu, B.; Wang, W.; Jiang, H.; Lu, X.; Zhang, X. Water use efficiency in response to interannual variations in flux-based photosynthetic onset in temperate deciduous broadleaf forests. Ecol. Indic. 2017, 79, 122–127. [Google Scholar] [CrossRef]
- Gu, L.; Post, W.M.; Baldocchi, D.D.; Black, T.; Suyker, A.E.; Verma, S.B.; Vesala, T.; Wofsy, S.C. Characterizing the Seasonal Dynamics of Plant Community Photosynthesis Across a Range of Vegetation Types. In Phenology of Ecosystem Processes; Springer: New York, NY, USA, 2009; pp. 35–58. [Google Scholar]
- Zhou, Y.K. Comparative study of vegetation phenology extraction methods based on digital images. Prog. Geogr. 2018, 37, 1031–1044. [Google Scholar]
- Gong, Y.; Guo, Z.J.; Zhang, K.D.; Xu, L.; Wei, Y.Y.; Zhao, M. Impact of vegetation on CO2 flux of a subtropical urban ecosystem. Acta Ecol. Sin. 2019, 39, 530–541. [Google Scholar]
- Niu, S.; Fu, Y.; Gu, L.; Luo, Y. Temperature Sensitivity of Canopy Photosynthesis Phenology in Northern Ecosystems. In Phenology: An Integrative Environmental Science; Springer: Dordrecht, The Netherlands, 2013; pp. 503–519. [Google Scholar] [CrossRef]
- Gong, Y.; Zhang, Y. Impact of air temperature on the phenological process of a temperate deciduous broad-leaved forest ecosystem based on phenology model. J. Fujian Agric. For. Univ. Nat. Sci. 2020, 49, 621–630. [Google Scholar] [CrossRef]
- Sardans, J.; Penuelas, J. Plant-soil interactions in Mediterranean forest and shrublands: Impacts of climatic change. Plant. Soil 2013, 365, 1–33. [Google Scholar] [CrossRef]
- Keenan, T.F.; Gray, J.M.N.T.; Friedl, M.A.; Toomey, M.; Bohrer, G.; Hollinger, D.Y.; Munger, J.W.; O’Keefe, J.; Schmid, H.P.; Wing, I.S.; et al. Net carbon uptake has increased through warming-induced changes in temperate forest phenology. Nat. Clim. Chang. 2014, 4, 598–604. [Google Scholar] [CrossRef]
- Maneke-Fiegenbaum, F.; Klemm, O.; Lai, Y.; Hung, C.-Y.; Yu, J.-C. Carbon Exchange between the Atmosphere and a Subtropical Evergreen Mountain Forest in Taiwan. Adv. Meteorol. 2018, 2018, 1–12. [Google Scholar] [CrossRef]
- Wang, J.; Zhang, X. Investigation of wildfire impacts on land surface phenology from MODIS time series in the western US forests. ISPRS J. Photogramm. Remote Sens. 2020, 159, 281–295. [Google Scholar] [CrossRef]
- Mitchell, R.J.; Liu, Y.; O’Brien, J.J.; Elliott, K.J.; Starr, G.; Miniat, C.F.; Hiers, J.K. Future climate and fire interactions in the southeastern region of the United States. For. Ecol. Manag. 2014, 327, 316–326. [Google Scholar] [CrossRef]
- Starr, G.; Staudhammer, C.L.; Loescher, H.W.; Mitchell, R.; Whelan, A.; Hiers, J.K.; O’Brien, J.J. Time series analysis of forest carbon dynamics: Recovery of Pinus palustris physiology following a prescribed fire. New For. 2014, 46, 63–90. [Google Scholar] [CrossRef]
- Wiesner, S.; Stoy, P.C.; Staudhammer, C.L.; Starr, G. Using Metabolic Energy Density Metrics to Understand Differences in Ecosystem Function During Drought. J. Geophys. Res. Biogeosci. 2020, 125, e2019jg005335. [Google Scholar] [CrossRef]
- Wiesner, S.; Staudhammer, C.L.; Loescher, H.W.; Baron-Lopez, A.; Boring, L.R.; Mitchell, R.J.; Starr, G. Interactions Among Abiotic Drivers, Disturbance and Gross Ecosystem Carbon Exchange on Soil Respiration from Subtropical Pine Savannas. Ecosystems 2018, 21, 1639–1658. [Google Scholar] [CrossRef]
- Goebel, P.C.; Palik, B.J.; Kirkman, L.K.; West, L. Field Guide: Landscape Ecosystem Types of Ichauway; Joseph, W., Ed.; Report Number 97–1; Jones Ecological Research Center at Ichauway: Newton, GA, USA, 1997. [Google Scholar]
- Wiesner, S.; Staudhammer, C.L.; Javaheri, C.L.; Hiers, J.K.; Boring, L.R.; Mitchell, R.J.; Starr, G. The role of understory phenology and productivity in the carbon dynamics of longleaf pine savannas. Ecosphere 2019, 10, e02675. [Google Scholar] [CrossRef]
- USGS National Boundary Dataset (NBD) Downloadable Data Collection. Available online: https://catalog.data.gov/dataset/usgs-national-boundary-dataset-nbd-downloadable-data-collectionbc141 (accessed on 15 June 2020).
- Starr, G.; Staudhammer, C.L.; Wiesner, S.; Kunwor, S.; Loescher, H.W.; Baron, A.F.; Whelan, A.; Mitchell, R.J.; Boring, L. Carbon Dynamics of Pinus palustris Ecosystems Following Drought. Forests 2016, 7, 98. [Google Scholar] [CrossRef]
- Lloyd, J.; Taylor, J.A. On the Temperature Dependence of Soil Respiration. Funct. Ecol. 1994, 8, 315. [Google Scholar] [CrossRef]
- Whelan, A.; Mitchell, R.; Staudhammer, C.; Starr, G. Cyclic Occurrence of Fire and Its Role in Carbon Dynamics along an Edaphic Moisture Gradient in Longleaf Pine Ecosystems. PLoS ONE 2013, 8, e54045. [Google Scholar] [CrossRef]
- Whelan, A.; Starr, G.; Staudhammer, C.L.; Loescher, H.W.; Mitchell, R.J. Effects of drought and prescribed fire on energy exchange in longleaf pine ecosystems. Ecosphere 2015, 6, art128. [Google Scholar] [CrossRef]
- Liu, F.; Wang, X.; Wang, C.; Zhang, Q. Environmental and biotic controls on the interannual variations in CO2 fluxes of a continental monsoon temperate forest. Agric. For. Meteorol. 2021, 296, 108232. [Google Scholar] [CrossRef]
- NOAA Location Station List & Summarized Data Inventory. Available online: https://www.ncdc.noaa.gov/cdo-web/datasets/GHCND/locations/FIPS:13/detail#stationlist (accessed on 10 July 2020).
- Liu, Y.; Wu, C.; Sonnentag, O.; Desai, A.R.; Wang, J. Using the red chromatic coordinate to characterize the phenology of forest canopy photosynthesis. Agric. For. Meteorol. 2020, 285, 107910. [Google Scholar] [CrossRef]
- Huang, Y.; Gerber, S.; Huang, T.; Lichstein, J.W. Evaluating the drought response of CMIP5 models using global gross primary productivity, leaf area, precipitation, and soil moisture data. Glob. Biogeochem. Cycles 2016, 30, 1827–1846. [Google Scholar] [CrossRef]
- Li, X.; Chen, J.; Guo, W. A review of the influence factors of plant phenology under different climate types. J. Earth Environ. 2018, 9, 16–27. [Google Scholar]
- Jiao, K.W.; Gao, J.B.; Wu, S.H.; Hou, W. Research progress on the response processes of vegetation activity to climate change. Acta Ecol. Sin. 2018, 38, 2229–2238. [Google Scholar]
- Dragoni, D.; Rahman, A.F. Trends in fall phenology across the deciduous forests of the Eastern USA. Agric. For. Meteorol. 2012, 157, 96–105. [Google Scholar] [CrossRef]
- Zlatev, Z.; Lidon, F.C. An overview on drought induced changes in plant growth, water relationsand photosynthesis. Emir. J. Food Agric. 2012, 24, 57–72. [Google Scholar]
- Jarosz, N.; Brunet, Y.; Lamaud, E.; Irvine, M.; Bonnefond, J.-M.; Loustau, D. Carbon dioxide and energy flux partitioning between the understorey and the overstorey of a maritime pine forest during a year with reduced soil water availability. Agric. For. Meteorol. 2008, 148, 1508–1523. [Google Scholar] [CrossRef]
- Maselli, F.; Papale, D.; Puletti, N.; Chirici, G.; Corona, P. Combining remote sensing and ancillary data to monitor the gross productivity of water-limited forest ecosystems. Remote Sens. Environ. 2009, 113, 657–667. [Google Scholar] [CrossRef]
- Renninger, H.J.; Clark, K.L.; Skowronski, N.S.; Schäfer, K.V.R. Effects of a prescribed fire on water use and photosynthetic capacity of pitch pines. Trees 2013, 27, 1115–1127. [Google Scholar] [CrossRef]
- Oechel, W.C.; Hastings, S.J. The Effects of Fire on Photosynthesis in Chaparral Resprouts. In Mediterranean-Type Ecosystems; Springer: Berlin/Heidelberg, Germany, 1983; pp. 274–285. [Google Scholar] [CrossRef]
- Christensen, N.L.; Muller, C.H. Effects of Fire on Factors Controlling Plant Growth in Adenostoma Chaparral. Ecol. Monogr. 1975, 45, 29–55. [Google Scholar] [CrossRef]
- Certini, G. Effects of fire on properties of forest soils: A review. Oecologia 2005, 143, 1–10. [Google Scholar] [CrossRef] [PubMed]
- Emmerich, W.E.; Verdugo, C.L. Precipitation thresholds for CO2 uptake in grass and shrub plant communities on Walnut Gulch Experimental Watershed. Water Resour. Res. 2008, 44, W05S16. [Google Scholar] [CrossRef]
- Hao, Y.; Kang, X.; Cui, X.; Ding, K.; Wang, Y.; Zhou, X. Verification of a threshold concept of ecologically effective precipitation pulse: From plant individuals to ecosystem. Ecol. Inform. 2012, 12, 23–30. [Google Scholar] [CrossRef]
- Powell, T.L.; Gholz, H.L.; Clark, K.L.; Starr, G.; Cropper, W.P., Jr.; Martin, T.A. Carbon exchange of a mature, naturally regenerated pine forest in north Florida. Glob. Chang. Biol. 2008, 14, 2523–2538. [Google Scholar] [CrossRef]
- Niu, X.; Sun, P.; Liu, X.; Luan, J.; Liu, S. Net ecosystem carbon dioxide exchange in an oak (Quercus aliena) forest at transitional zone from subtropics to warm temperate, China. Acta Ecol. Sin. 2020, 40, 5980–5991. [Google Scholar]
- Dold, C.; Büyükcangaz, H.; Rondinelli, W.; Prueger, J.; Sauer, T.; Hatfield, J. Long-term carbon uptake of agro-ecosystems in the Midwest. Agric. For. Meteorol. 2017, 232, 128–140. [Google Scholar] [CrossRef]


| Mesic | Intermediate | Xeric | |
|---|---|---|---|
| DBH (cm) | 25.9 | 42.5 | 22.5 |
| Water holding capacity | 40.3 | 27.6 | 18.5 |
| LAI (m2/m2) | 2.34 | - | 1.87 |
| NDVI | 0.7 | 0.7 | 0.65 |
| EVI | 0.37 | 0.35 | 0.34 |
| Year/Site | Mesic | Intermediate | Xeric |
|---|---|---|---|
| 2009 * | Normal | Normal | Normal |
| 2010 | AR (Water stress) | AR (Water stress) | AR (Water stress) |
| 2011 * | AR (Water stress) | AR (Water stress) | AR (Water stress) |
| 2012 | AR (Uneven spring precipitation) | Normal | Normal |
| 2013 * | Normal | Normal | Normal |
| 2014 | AR (Flood) | AR (Flood) | AR (Flood) |
| 2015 * | AR (Water stress) | AR (Water stress) | AR (Water stress) |
| 2016 | Normal | Normal | AR (Water stress) |
| 2017 * | Normal | Normal | Normal |
| Fire Year | Non-Fire Year | ||||||
|---|---|---|---|---|---|---|---|
| Time Scale | Climate Variable | SOS | EOS | LOS | SOS | EOS | LOS |
| Annual | Ta anomaly | −0.33 | 0.05 | 0.25 | 0.06 | 0.35 | 0.04 |
| Precipitation anomaly | 0.31 | 0.11 | −0.23 | −0.11 | −0.30 | 0.04 | |
| PAR anomaly | −0.30 | 0.05 | 0.28 | −0.05 | −0.34 | −0.13 | |
| March | PAR | −0.62 * | 0.36 | 0.59 * | −0.29 | −0.17 | 0.13 |
| Ta | 0.09 | −0.21 | −0.15 | −0.07 | 0.51 ** | 0.28 | |
| Precipitation | 0.39 | −0.13 | −0.35 | 0.10 | −0.17 | −0.08 | |
| Early spring | PAR | −0.38 | 0.3 | 0.4 | −0.11 | −0.34 | −0.08 |
| Ta | −0.50 * | 0.56 ** | 0.57 ** | −0.10 | 0.53 ** | 0.32 | |
| Precipitation | 0.06 | 0.21 | 0.02 | −0.17 | −0.47 | −0.01 | |
| Mesic | Xeric | Intermediate | ||||||||
|---|---|---|---|---|---|---|---|---|---|---|
| Time Scale | Climate Variables | SOS | EOS | LOS | SOS | EOS | LOS | SOS | EOS | LOS |
| Annual | Ta anomaly | 0.01 | −0.04 | −0.02 | −0.70 * | 0.69 ** | 0.90 ** | −0.15 | 0.25 | 0.08 |
| Pptn anomaly | 0.14 | 0.64 ** | 0.14 | 0.55 ** | −0.33 | −0.28 | 0.76 ** | −0.34 | −0.71 * | |
| PAR anomaly | −0.42 | −0.37 | 0.32 | −0.49 | 0.00 | 0.02 | −0.19 | −0.07 | 0.19 | |
| March | PAR | −0.63 * | −0.19 | 0.40 | −0.46 | 0.22 | 0.20 | −0.57 * | 0.34 | 0.63 ** |
| Ta | 0.03 | −0.19 | −0.17 | −0.49 | 0.54 ** | 0.75 ** | −0.12 | 0.22 | 0.04 | |
| Pptn | 0.10 | 0.33 | 0.03 | 0.32 | −0.21 | −0.30 | 0.50 | −0.10 | −0.46 | |
| Early spring | PAR | −0.59 * | −0.13 | 0.50 ** | −0.41 | 0.30 | 0.03 | −0.17 | 0.13 | 0.22 |
| Ta | −0.17 | 0.44 | 0.22 | −0.46 | 0.69 ** | 0.68 ** | −0.35 | 0.51 ** | 0.33 | |
| Pptn | −0.04 | 0.44 | 0.26 | 0.44 | −0.52 * | −0.57 * | 0.31 | −0.16 | −0.28 | |
| Late autumn | PAR | −0.50 | −0.28 | 0.41 | −0.20 | −0.41 | −0.32 | −0.21 | 0.17 | 0.26 |
| Ta | −0.15 | −0.24 | 0.06 | −0.10 | −0.04 | 0.20 | 0.32 | 0.19 | −0.31 | |
| Pptn | 0.48 | 0.14 | −0.23 | 0.87 ** | −0.28 | −0.65 * | 0.50 | −0.74 * | −0.59 * | |
Publisher’s Note: MDPI stays neutral with regard to jurisdictional claims in published maps and institutional affiliations. |
© 2021 by the authors. Licensee MDPI, Basel, Switzerland. This article is an open access article distributed under the terms and conditions of the Creative Commons Attribution (CC BY) license (http://creativecommons.org/licenses/by/4.0/).
Share and Cite
Gong, Y.; Staudhammer, C.L.; Wiesner, S.; Starr, G.; Zhang, Y. Characterizing Growing Season Length of Subtropical Coniferous Forests with a Phenological Model. Forests 2021, 12, 95. https://doi.org/10.3390/f12010095
Gong Y, Staudhammer CL, Wiesner S, Starr G, Zhang Y. Characterizing Growing Season Length of Subtropical Coniferous Forests with a Phenological Model. Forests. 2021; 12(1):95. https://doi.org/10.3390/f12010095
Chicago/Turabian StyleGong, Yuan, Christina L. Staudhammer, Susanne Wiesner, Gregory Starr, and Yinlong Zhang. 2021. "Characterizing Growing Season Length of Subtropical Coniferous Forests with a Phenological Model" Forests 12, no. 1: 95. https://doi.org/10.3390/f12010095
APA StyleGong, Y., Staudhammer, C. L., Wiesner, S., Starr, G., & Zhang, Y. (2021). Characterizing Growing Season Length of Subtropical Coniferous Forests with a Phenological Model. Forests, 12(1), 95. https://doi.org/10.3390/f12010095