1. Introduction
Japan is largely dependent on oil, coal, natural gas (LNG), and other fossil fuels that are imported from overseas. Japan’s self-sufficiency ratio was 11.8% lower than that of other OECD (Organization for Economic Co-operation and Development) countries in 2018 [
1]. In 2010, before the Great East Japan Earthquake, nuclear power provided 25.1% of the power supply. In 2014, all 54 nuclear reactors stopped, and fossil fuels made up for the shutdown of nuclear power plants. The rate of fossil fuels to power supply increased from 65.4% in 2010 to 87.5% in 2014. Electricity power rates were increased several times after the earthquake because of growing fossil fuel thermal power generation, as well as the increasing crude oil prices and oil-linked gas prices with geopolitical risks. Compared with 2010 before the earthquake, electric power rates in 2014 showed a large increase of around 25% for homes and around 38% for industries. To increase the energy self-sufficiency ratio and stabilize electricity power rates, the government of Japan is working to create a mix of power sources that are resistant to changes in international oil prices, promote the full liberalization of the electricity retail market, and expand the cost efficient introduction of renewable energy.
To create a mix of power sources, nuclear power generation was restarted once safety was ensured with new regulatory requirements that prioritize safety. Of the 54 nuclear reactors, 9 reactors are in operation, 12 reactors are under assessment for new regulatory requirements, 9 reactors have not applied for assessment, and 24 reactors are to be decommissioned. Nuclear power represented 6.2% of power supply in 2018. Owing to the introduction of the feed-in tariff (FIT) scheme in 2012, the installed capacity of renewable energy systems is growing rapidly. The rate of renewable energy to power supply increased from 2.2% in 2010 to 9.2% in 2018. In energy security, the rates of nuclear and renewable energy to energy supply projects are expected to increase to 20–22% and 22–24%, respectively, in 2030. In the FIT scheme, the purchase costs have reached JPY 3.1 trillion (EUR 1 = JPY 126 as of 12 August 2020), and the cost of the surcharge to ordinary households based on the average model (260 kWh/month) has risen to JPY 754/month. In order to maximize the use of renewable energy while also reducing the burden on people, the long-term price targets for the FIT system were set with a “top runners’ approach”. Moreover, a competitive bidding system was introduced and technology development was accelerated for reducing costs.
The amount of electricity generated by renewable energy, especially solar and wind power generation, varies significantly depending on the weather and season. In addition to fluctuations, the electric power infrastructures for solar power plants and wind turbines have been damaged by typhoons and torrential rains. In June 2020, the “Energy Supply Resilience Law” was enacted, which includes amendments to the FIT scheme. It is expected to come into effect in April 2022, except for those that require urgent institutional treatment to prepare for natural disasters. Compared to solar and wind, biomass is a stable energy source with sustainable feedstock. In the composition of power sources, the percentage of biomass projects doubled from 2.1% in 2017 to 3.7–4.6% in 2030, whereas the percentages of solar and wind projects increased from 5.2% and 0.6% to 7.0% and 1.7%, respectively, in Japan. Among various biomass resources, woody biomass has attracted particular attention owing to its abundant resources. Furthermore, forest bioenergy and advanced bioproducts are expected to contribute to revitalizing forest product industries and local economies in regions where forestry and the forest industry are the major sources of income.
Japan’s forests account for two-thirds of national land area and cover approximately 25 million hectares. Total growing stock has reached approximately 4.9 billion m
3 [
2]. Extraordinary efforts have been made to recover forests devastated during World War II and the subsequent restoration age. Approximately 10 million hectares have planted forests, and more than half of these planted forests are over 46 years old, fully ready for harvest. However, forestry operations in Japan are not very profitable because of low productivity, particularly because of the structural characteristics of small-scale forest ownership. The government of Japan investigated a number of forestry households only having more than 1 ha of forests, and 74% of forestry households had less than 5 ha [
2]. There are numerous other forestry households having less than 1 ha of forests that have not been investigated. The small-scale harvesting equipment system has been and continues to grow in use in forestry operations in some regions in the world [
3]. Yu et al. [
4] tested a boom-type feller-buncher, a small grapple skidder, and a chipper as a small-scale system for biomass harvesting in the USA. Spinelli et al. [
5] tested the use of two modern commercial miniature scale models of mini-yarders that can be obtained at a much lower cost compared to a full-size tower yarder. Laitila et al. [
6] studied the economic performances of alternative chipper choices for small-scale chipping.
In Japan, mini forwarders are commonly used for forwarding operations by small-scale private forest owners and logging companies [
7]. Furthermore, light trucks with a loading capacity of 350 kg are also commonly used for commuting to forests and transporting small-sized logs [
8]. To improve the productivity of forestry operations, a mechanized operation system that merges small forests into aggregated forestry operations utilizing large forestry machinery has been introduced in the last two decades in order to function more efficiently [
9,
10]. In Europe, most forest holdings span less than 10 ha [
11]. Landowners’ associations for joint forest management constitute a tool for effective landscape-level management and more efficient forestry due to economies of scale [
9], and they provide stronger wood market positioning to participating landowners [
12]. These reasons mobilize some forest owners into collective action [
11]. Finley et al. [
13] found that nearly half of private forest owners in a USA municipality would agree to some form of cross-boundary cooperation.
To promote sustainable timber and forest biomass utilization, technically feasible and economically viable availability should be estimated considering forest regeneration. Yamamoto et al. [
14] estimated the annual availability of forest biomass resources as supply potential from profitable forests where expected revenues surpassed all costs, from planting to final harvest, in Tochigi Prefecture, Japan. However, timber and forest biomass resources were traded beyond prefectures. In order to consider inter-prefectural trade, Battuvshin et al. [
15] estimated annual availability including three prefectures, namely, Fukushima, Ibaraki, and Gunma, in addition to Tochigi. Fukushima belongs to the Tohoku region, whereas Ibaraki, Tochigi, and Gunma belong to the Kanto region in Japan. However, Yamamoto et al. [
14] and Battuvshin et al. [
15] did not consider aggregation. The present study estimated the supply potential and availability of forest biomass resources of cedar, cypress, pine, and larch for woody biomass power generation in Aomori, Iwate, Miyagi, Akita, and Yamagata prefectures north of Fukushima in the Tohoku region, while considering aggregation.
2. Materials and Methods
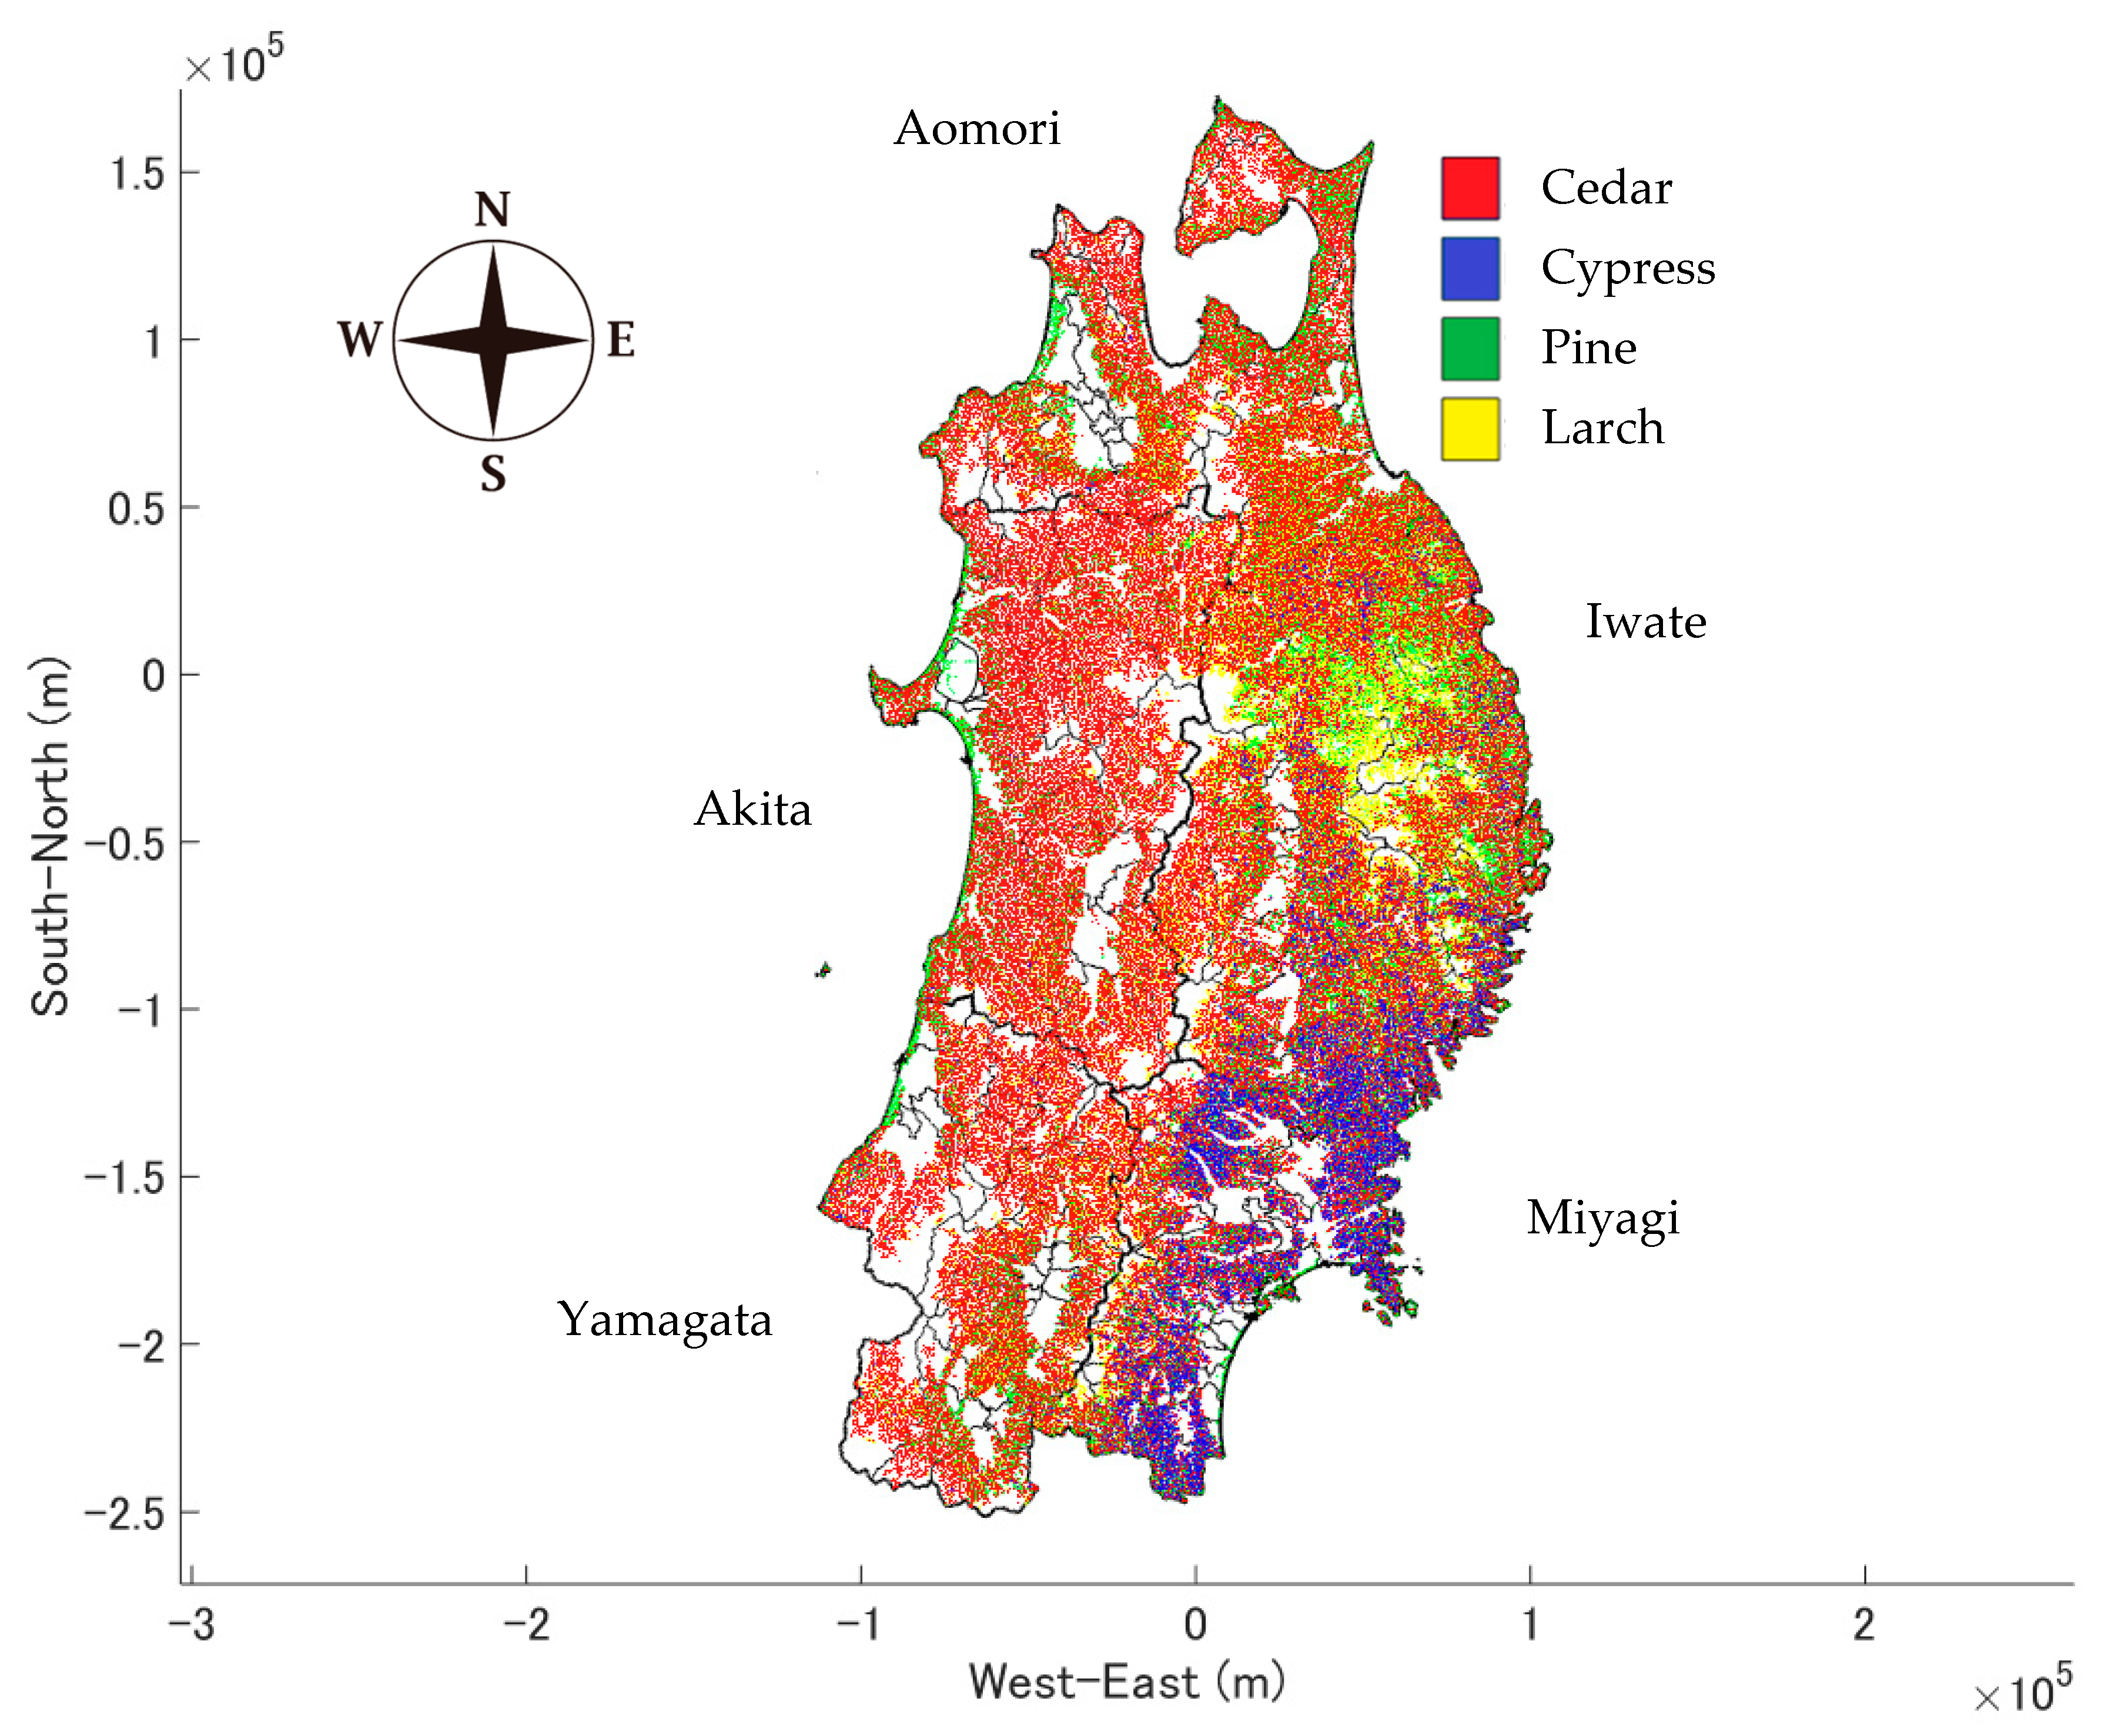
The Ou Mountains, of which the highest is the Iwate mountain, 2038 m above sea level, are lined from north to south in the center of the Tohoku region. Therefore, the Tohoku region has very different climatic characteristics on the west side and the east side. Especially in winter, the difference is remarkable, with many cloudy, snowy or rainy days on the west side and many sunny days on the east side. The average temperature ranges between 10.2 and 12.4 degrees Celsius whereas annual precipitation ranges between 1163 and 1686 mm. The forest areas (percentage of the total area) of Aomori, Iwate, Miyagi, Akita, and Yamagata are 632,805 ha (66%), 1,171,446 ha (77%), 417,086 ha (57%), 839,247 ha (72%), and 669,272 ha (72%), respectively. The forests to be analyzed were plantations of cedar, cypress, pine, and larch. The plantation areas (percentage of the forest area) are 286,032 ha (45%), 533,466 ha (46%), 205,975 ha (49%), 409,523 ha (49%), and 196,444 ha (29%), respectively (
Table 1,
Figure 1). Cedar ranged between 38% in Iwate and 92% in Akita, approximately two-thirds of the plantation areas. In Iwate, pine was the most predominant, at 38%, and larch occupied 23%. In Miyagi, cypress occupied 4% and less than 1% in other prefectures. In a previous study [
14,
15], forestry operations were assumed to be conducted in a unit of subcompartments, which are typical operation units in Japan. In addition to a unit of subcompartments, the present study made aggregated forests while merging subcompartments in the same watersheds [
16], and availability from aggregated forests was also estimated. The number of subcompartments, 2,320,562, was reduced to the number of aggregated forests (60,954), whereas the average area of subcompartments, 0.70 ha, was increased to the average area of aggregated forests (26.79 ha) (
Table 1). Approximately 30 ha was normally aggregated, and forestry operations were conducted on aggregated forests [
9]. Miyagi was the most populated prefecture in the Tohoku region, and the forests of Miyagi were fragmented. Therefore, the average area of aggregated forests was the smallest in Miyagi, whereas it was the largest in Aomori because of the countryside.
In this study, we used forest registration data (tree species and site index) and GIS data (information on roads and subcompartment layers) from the prefecture for private and communal forests, GIS data (subcompartment layers, including tree species), from the Forestry Agency of Japan for national forests, as well as 10 m grid digital elevation models (DEMs) from the Geographical Survey Institute. In the present study, GIS data were handled with MATLAB. Full technical details on the data analysis methods can be found in earlier papers [
14,
15].
Forest resources in each stand were predicted using the system yield table, Local Yield Table Construction System (LYCS3.3) [
17], with the site index ranging from 1 to 3, representing high, medium, or low productivity in private and communal forests. However, information on the site index for private and communal forests of Aomori as well as for national forests was not obtained. Therefore, productivity was designated as a medium for the Aomori and national forests. Furthermore, Iwate, Miyagi, Akita, and Yamagata classified the site index using a scale of 1–5, 0–15, 1–9, and 1–6, respectively. Therefore, these numbers are assigned to corresponding categories of low and high productivity. The supply potential of timber and forest biomass resources was estimated using the cutting ages and rates (
Table 2) based on the forest management plans obtained from the prefectures, as well as the rates of timber (75%) and forest biomass (15%), according to stem volumes over barks without branches. The remaining 10% included stems left in the forests and barks removed in the sawmills and factories. Then, revenues were estimated using log prices and rates, which were set based on the Forestry Agency of Japan [
18]. Timber consisted of logs for saw, plywood, and chips. The average log prices were used as revenues from timber (
Table 3). The classification of logs for saw, plywood, and chips was different site by site, but, for example, saw logs are 3–4 m long with the top-end diameter exceeding 10 cm, lamina logs (not plywood) are 2 m long with the top-end diameter exceeding 16 cm, and chip logs are 2 m long with the top-end diameter exceeding 6 cm [
19]. Log prices of forest biomass resources were set to the same price as chip logs, because there were no statistical data, and forest biomass resources are currently similar to chip logs, such as small-diameter or defect stem logs, rather than logging residues in Japan.
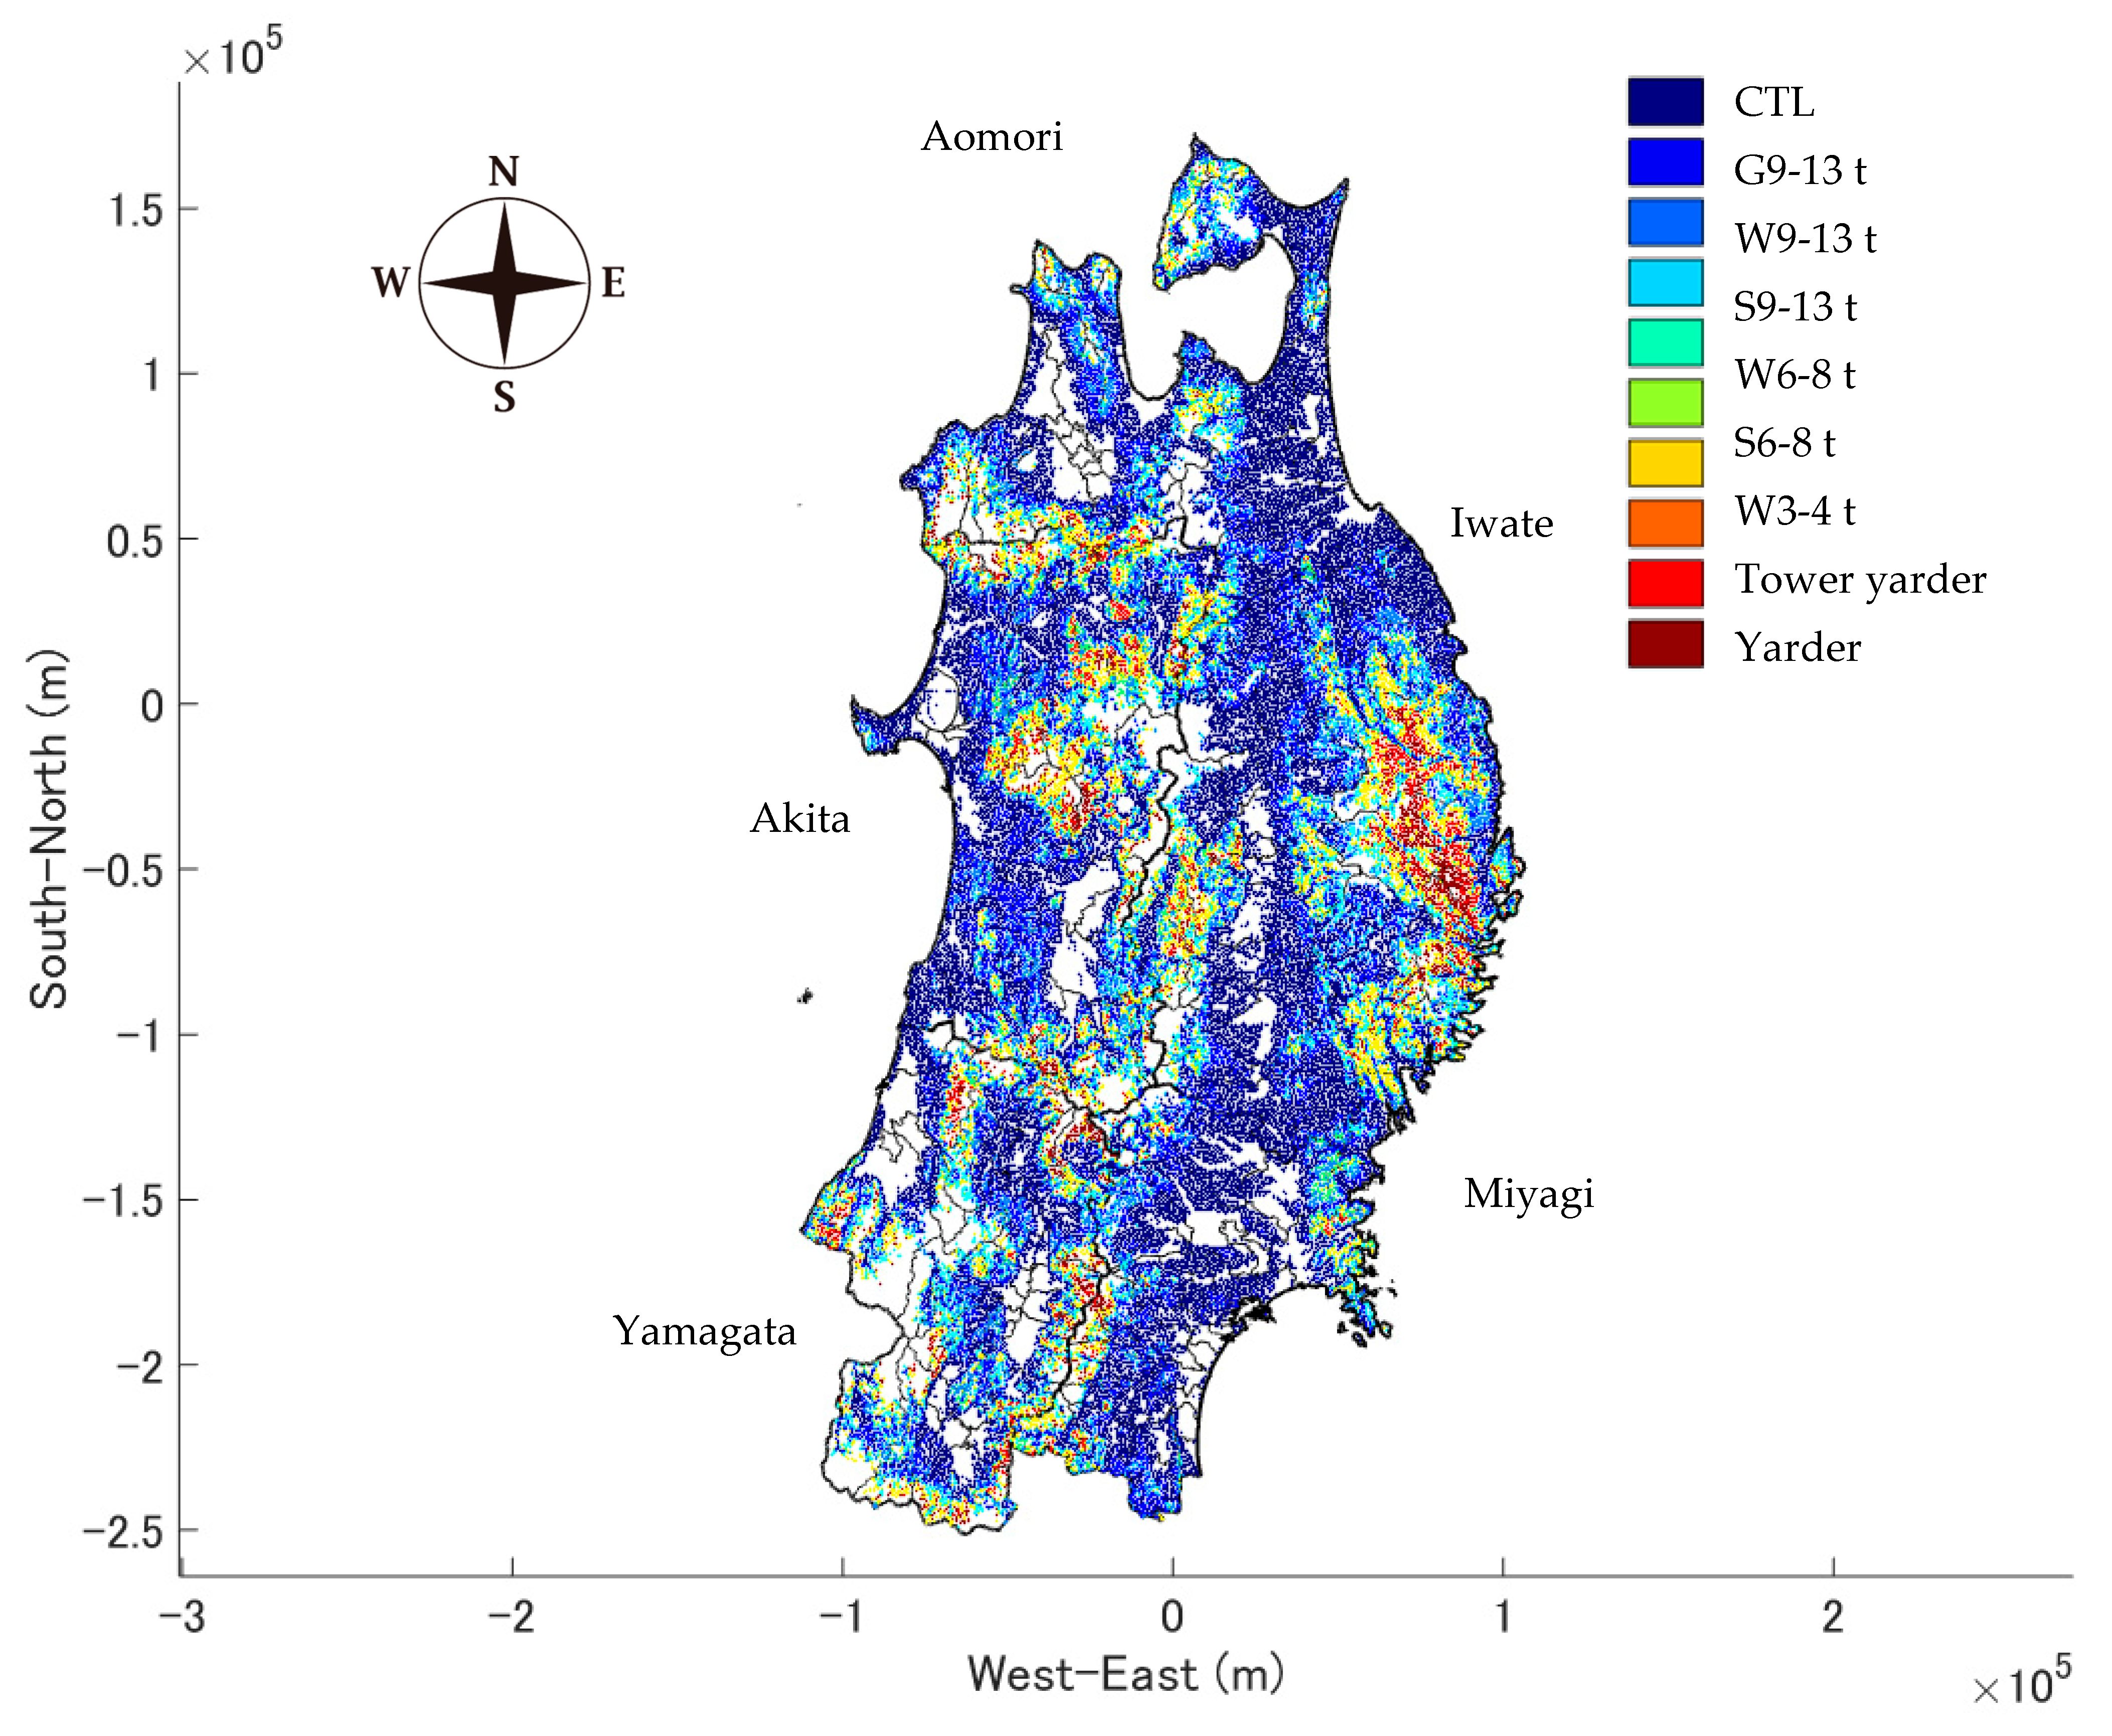
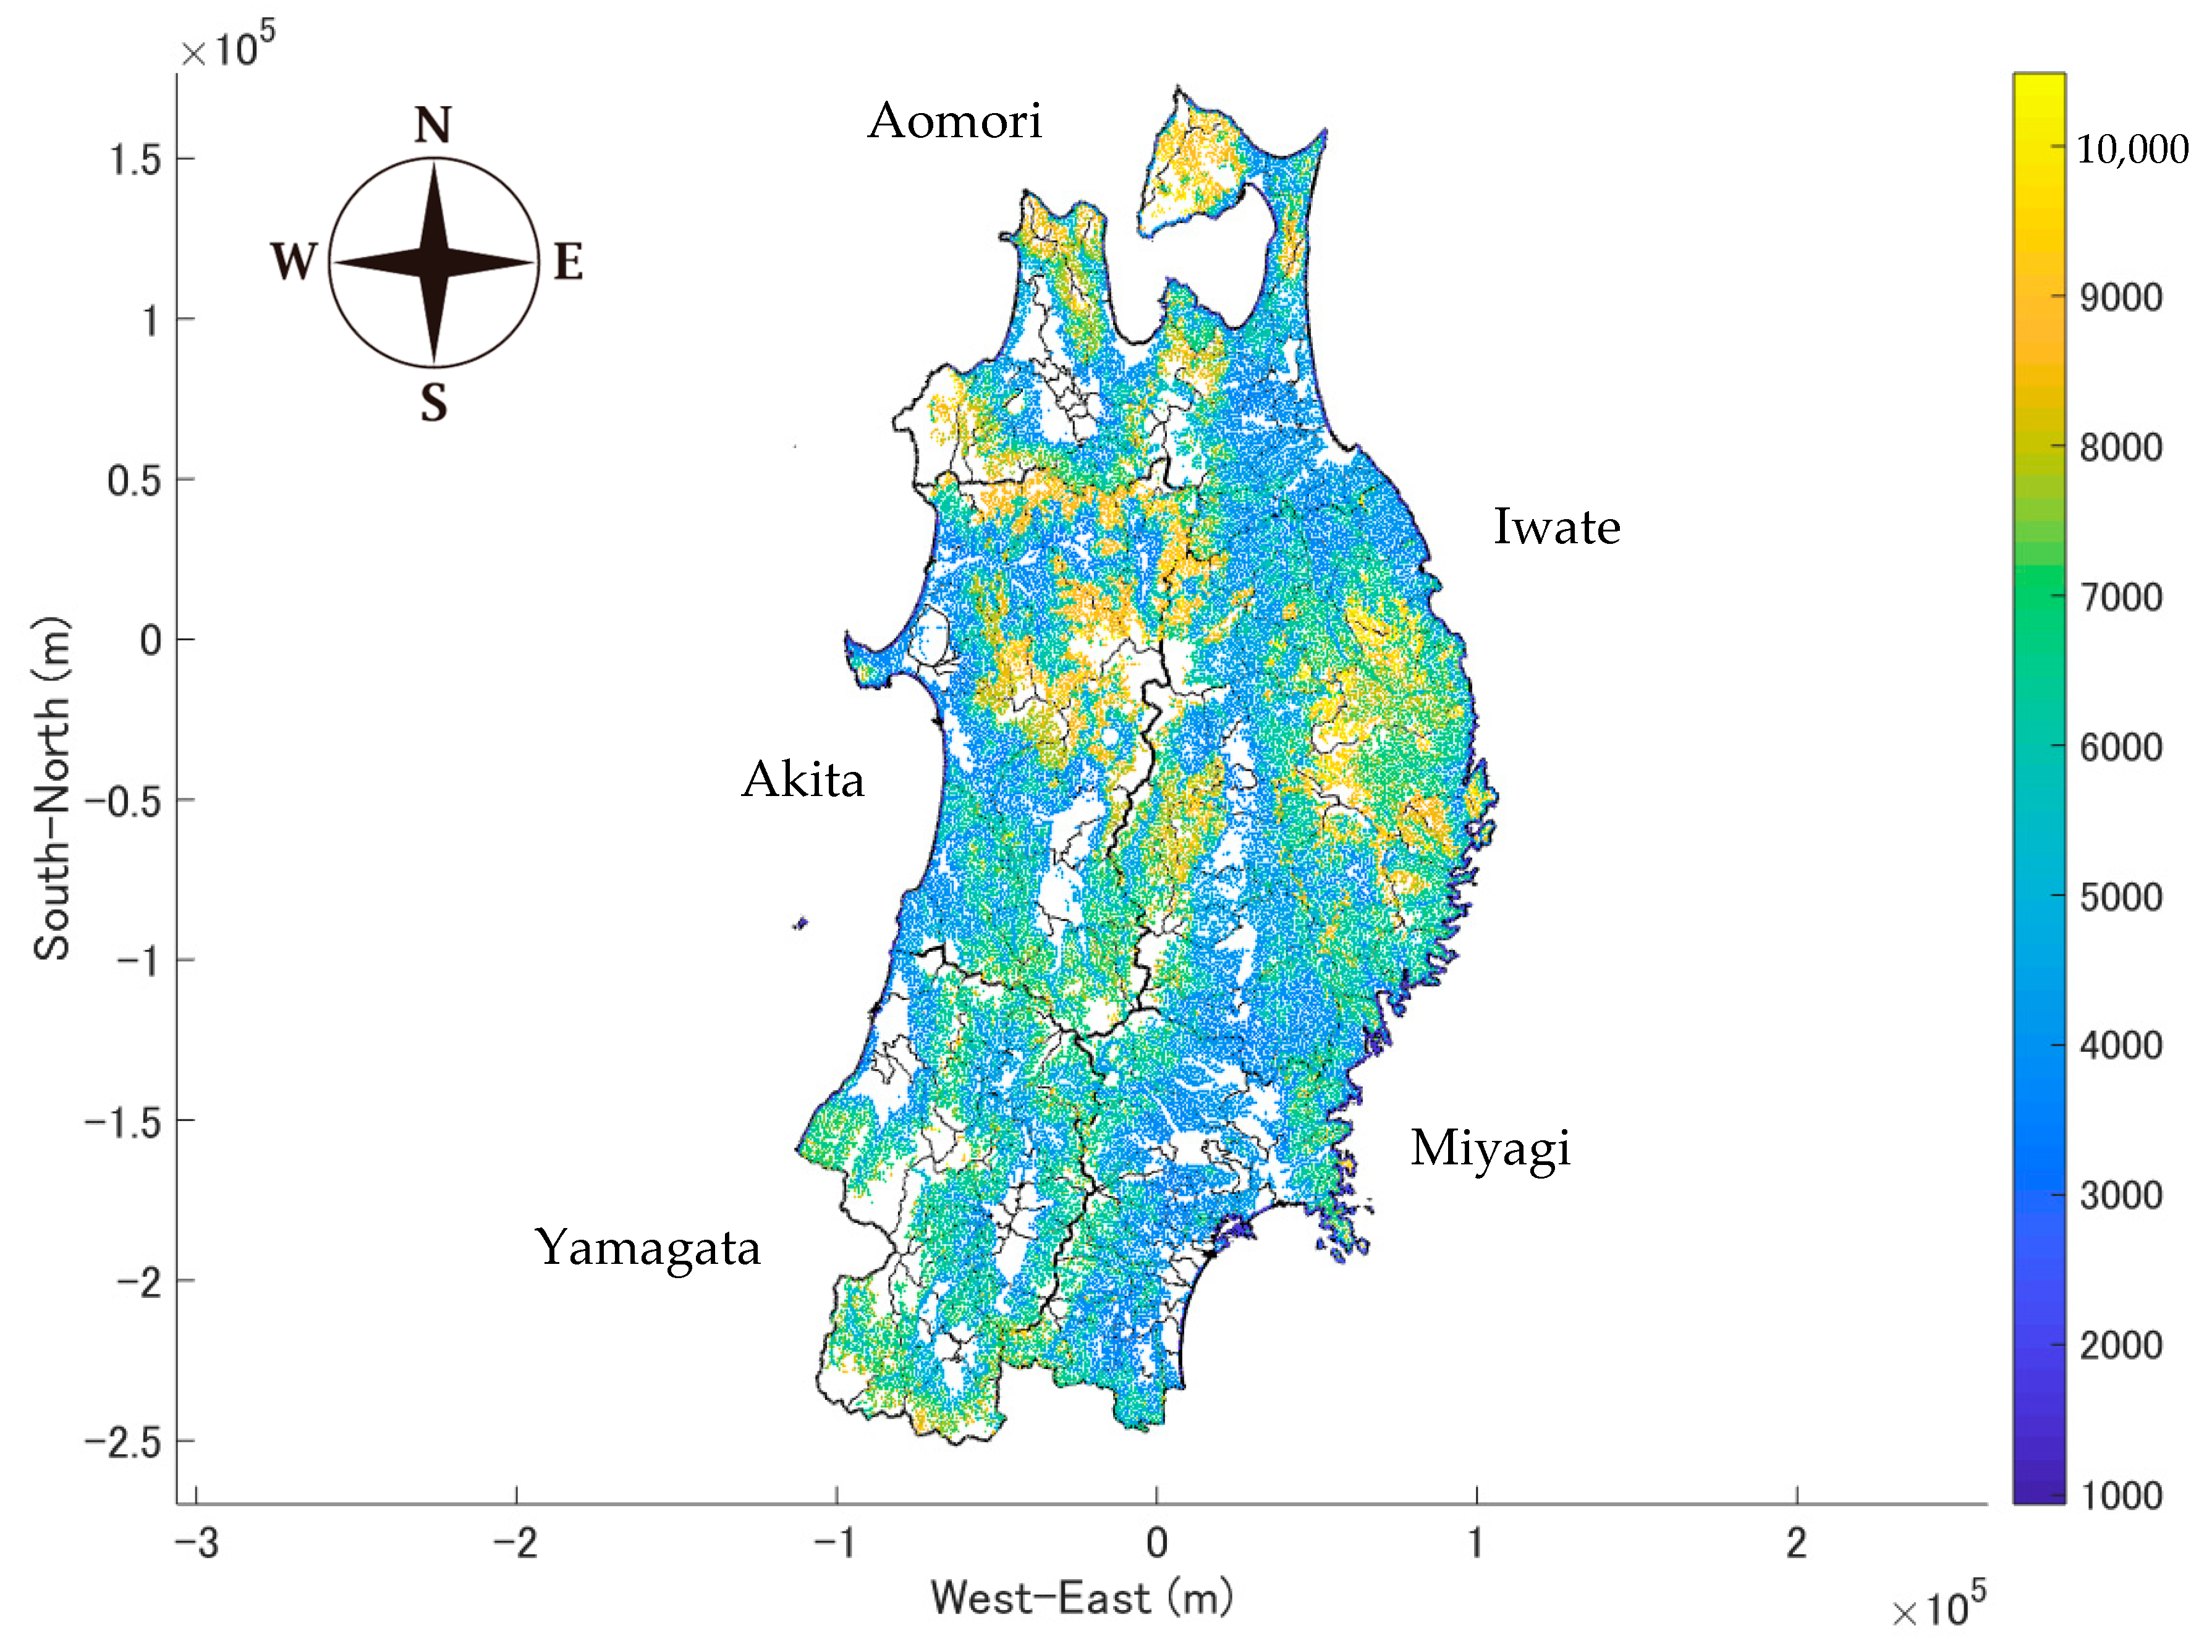
Costs of commercial thinning and final harvesting were estimated after setting the forest operation systems and machine sizes according to the topographical conditions, such as slope angles and height differences within 500 m (
Figure 2 and
Figure 3) [
20]. The forest operation systems included CTL (cut-to-length), G9-13t, W9-13t, S9-13t, W6-8t, S6-8t, W3-4t, tower yarder, and yarder (
Table 4 and
Table 5). The harvesting costs in the stands were the sums of the operation costs, such as felling, bunching/winching/yarding, processing, and forwarding, as well as construction of the strip-road network [
21,
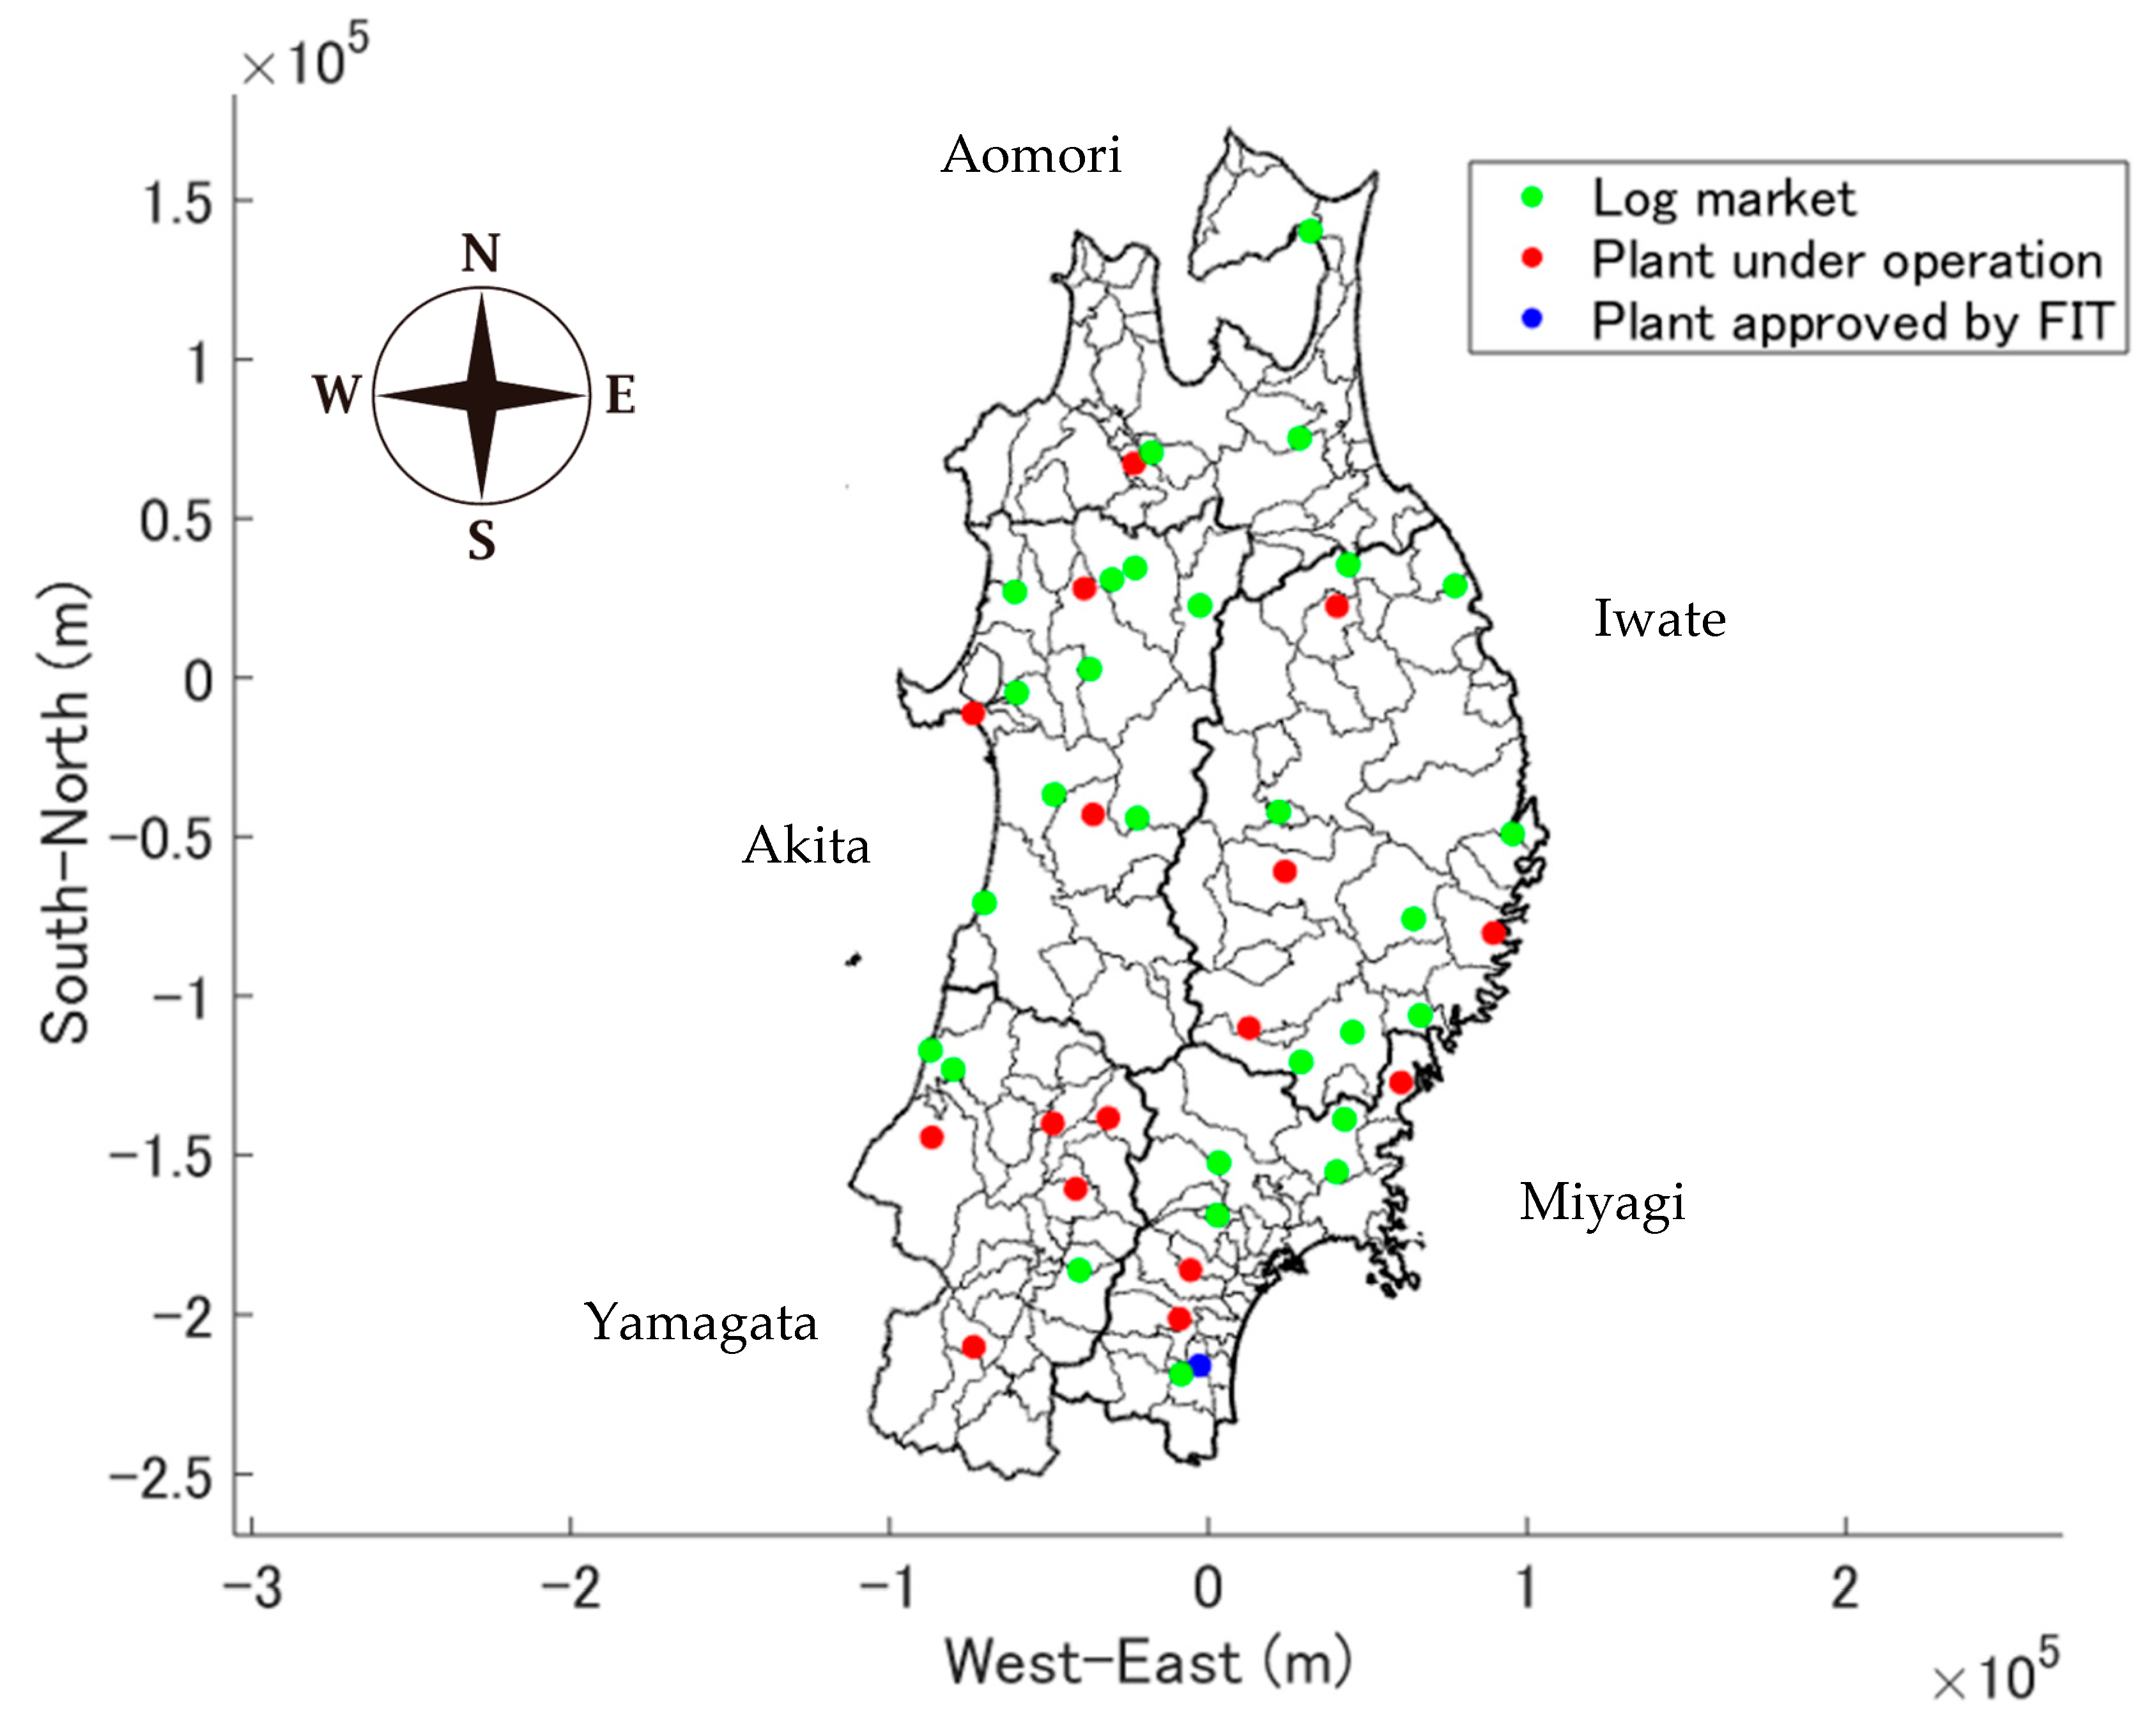
22]. In addition, transportation costs from forests to log markets for timber and woody biomass power generation plants for forest biomass resources were estimated [
23] (
Figure 4).
Regeneration costs, including site preparation, planting, weeding, pruning, and precommercial thinning (
Table 6), were estimated according to the forest management plans obtained from the prefectures. Specifically, Akita and Yamagata experienced heavy snow; thus, additional silvicultural costs for cedar were incurred for snow damage recovery. According to the forest management plans obtained from the prefectures, the frequency of weeding for pine in Aomori and Iwate was higher than that in other prefectures, and pruning was conducted for larch in Akita and Yamagata. Thus, regeneration costs were high. Additionally, for regeneration operations, subsidies were received from the government of Japan [
24]. Furthermore, some prefectures allocated additional subsidies to secure regeneration operations through new taxation schemes [
25]. Therefore, subsidies covering 100% of the regeneration costs were examined in this study.
In this study, subsidies for commercial thinning operations and strip-road construction were also examined. Standard unit costs for thinning operations were estimated according to thinning rate, processing methods such as chain saw or mechanized, extraction methods such as ground-based or yarder, and extracted volumes per hectare (
Table 7). Standard unit costs for strip-road construction were estimated using road width and slope angles (
Table 8). The road width for G9-13t, W9-13t, and S9-13t was 3.5 m, whereas that for W6-8t, S6-8t, and W3-4t was 2.5 m. Finally, profitable forests were identified as those with profits more than stumpage prices (
Table 9), and annual availability was estimated as the supply potential from profitable forests divided by rotation ages.
3. Results and Discussions
The supply potential and annual availability of timber were estimated at 11,388,960 m
3/year and 1,631,624 m
3/year, whereas those of forest biomass resources were 2,277,792 m
3/year and 326,325 m
3 (
Table 10). Therefore, the ratio of annual availability to supply potential was 14.3%. The ratio of Miyagi is the highest because of low harvesting costs for ground-based systems such as CTL, G9-13t, and W9-13t (
Figure 5 and
Figure 6). On the other hand, the rates of Akita and Yamagata were low because of low timber prices and high regeneration costs for heavy snow. By applying the subsidy, the rates of annual availability to supply potential increased to 26.8% with the additional regeneration subsidy, 72.5% with the thinning subsidy, and 76.0% with both subsidies (
Table 10). The ratio of Akita was still low because of low timber prices. The demand was estimated at 953,340 m
3/year from 100,000 m
3/year with a generation capacity of 5 MW. The rate of forest biomass availability to demand was 34.2%. The rates also increased to 64.1% with the additional regeneration subsidy, 173.3% with the thinning subsidy, and 181.5% with both subsidies. Thus, the estimated availability of both subsidies met the demand sufficiently in this region.
This study also modeled trades between prefectures in the Tohoku region (
Table 11 and
Table 12). Details on trades between prefectures, for example, the transportation of logs from forest to plywood factories directly instead of log markets, were different. There were some relatively large plywood factories and woody biomass power generation plants located in the Tohoku region, and the North Japan wood material distribution cooperative coordinated the trades of direct transportation [
26]. Therefore, in future studies, the estimation should be modified according to the real situation. Since the actual timber production of the five prefectures was 4,667,000 m
3/year in 2018 (
Table 11), the estimated annual availability of timber with the thinning subsidy, 8,258,304 m
3/year, was almost double the actual timber production. The estimated annual availability of forest biomass resources with the thinning subsidy, 1,651,845 m
3/year, was also almost double the actual usage in 2018, 889,601 m
3/year (
Table 12). This was because subsidies were applied to all stands in the estimations, although the subsidy budget was limited. For example, the Forestry Agency of Japan [
27] subsidized only 7–8% of the total private and communal forests assuming 60 years as rotation periods, and the frequency of reforestation, weeding, and precommercial and commercial thinning was one, five, two, and three times during rotation periods, respectively (
Table 13). Therefore, estimations should be conducted while determining subsidized forest stands to satisfy the required annual wood yield with minimum governmental expenses [
28].
In fact, a thinning subsidy was provided for operational site areas larger than 5 ha in Japan. Therefore, estimations were conducted with a thinning subsidy provided for only subcompartments and aggregated forests larger than 5 ha in this section. As a result, the rates of annual availability to demands with a thinning subsidy decreased from 173.3% of all subcompartments (
Table 10) to 91.4% of subcompartments larger than 5 ha (
Table 14). However, the rates increased to 190.3% of aggregated forests larger than 5 ha. Furthermore, the annual availability from aggregated forests met demands in all prefectures (
Table 14), whereas the annual availability from subcompartments did not meet demands in Yamagata, even when applying both thinning and additional regeneration subsidies (
Table 10). The annual availability from aggregated forests was 1,811,594 m
3/year, which was 79.5% of supply potential, 2,277,747 m
3/year on all prefectures. Aruga et al. [
16] reported that almost all aggregated forests were estimated as profitable. The rates of annual availability to supply potential were different from site to site, but subsidies and aggregation would play an important role in increasing the annual availability of timber and forest biomass resources in Japan.
The present study estimated the annual availability of forest biomass resources from aggregated forests in the same watersheds, although previous studies [
2,
3] did not consider this. Since forest owners’ cooperatives usually coordinate the aggregation of neighboring subcompartments in the same watersheds [
9,
10], this would be a reasonable assumption in Japan. However, the estimations were only modified to apply thinning subsidy to subcompartments and aggregated forests larger than 5 ha, but the study did not consider more efficient forestry operations or stronger wood market positioning [
11]. In fact, CTL consisting of harvester and forwarder (
Table 4), which is the most productive and low-cost harvesting system in some regions of the world [
29,
30], has been introduced in aggregated forests in Tohoku regions, whereas it has not been introduced in other regions of Japan except the Hokkaido region. Furthermore, the North Japan wood material distribution cooperative coordinated direct trades with higher prices between forest owners and relatively larger plywood factories or woody biomass power generation plants, due to economics of scale [
26]. Therefore, future studies should examine cost reduction and wood price increase for aggregation. Moreover, the present study investigated aggregated forests while merging subcompartments in the same watersheds [
16]. On the other hand, Yoshimoto [
31] examined aggregated forests to use the existing exact optimization techniques for spatially constrained harvests in scheduling problem-area restrictions. The present study only estimated supply potential and availability during the rotation period, but it did not solve the spatially constrained harvest scheduling problem. Future studies should also examine the framework of the maximum flow problems to aggregate forest units into feasible clusters, which meet the maximum opening size requirements.
4. Conclusions
This study estimated the technically feasible and economically viable availability of forest regeneration for five prefectures, namely, Aomori, Iwate, Miyagi, Akita, and Yamagata. This study modeled trades between prefectures in the Tohoku region. Furthermore, this study estimated the harvesting costs after setting the forest operation systems and machine sizes according to the topographical conditions. The estimated annual availability as a unit of subcompartments with thinning and additional regeneration subsidies met the demands sufficiently in this region, whereas availability as a unit of aggregated forests with a thinning subsidy met the demands of all the analyzed prefectures. The government of Japan implemented the “Experimental Projects of Forest and Forestry Revitalization Plan”, which includes aggregating small forests, establishing forest road networks, and promoting mechanization in order to conduct forestry operations efficiently on a large scale and reduce costs [
32]. In Europe and USA, landowners’ associations for joint forest management also constitute a tool for effective landscape-level management and more efficient forestry due to economies of scale, and they provide stronger wood market positioning to participating landowners. Thus, the aggregation in the same watershed used in this study will help to promote the merging of a large number of small, fragmented, and scattered forest lands in Japan, as well as some regions of the world. The method we developed in the present study with MATLAB could be used to make estimations for the whole of Japan, within a reasonable timeframe. The follow-on study from the present one will estimate availability as a unit of subcompartments and aggregated forests at a national level, considering the trade between prefectures.
Forest biomass resources are expected to increase from 2 million m
3 in 2014 to 8 million m
3 in 2025, based on the forest and forestry basic plan of Japan [
33]. Additionally, timber supply and demand, including forest biomass resources, are also expected to increase from 24 and 76 million m
3 in 2014 to 40 and 79 million m
3 in 2025, respectively. Furthermore, the new scheme of “Forest Management System” was enforced in April 2019 [
2]. In this scheme, municipalities are entrusted with the management of forests which their owners are not able to manage appropriately. Then, the municipalities re-entrust the forests suitable for forestry businesses to forestry practitioners who manage forests sustainably through certain proceedings, whereas the forests not suitable are managed by the municipalities themselves. To make the support of Japan’s forests by all citizens equal, the “Forest Environment Tax” was also created in 2019. Thus, forest biomass resources left in the forest were projected to be increased according to the increased timber supply. The extraction of forest biomass resources would improve the productivity of reforestation due to easy site preparation, and reduce the disaster risks of forest biomass resources due to heavy rains. Therefore, the extraction and utilization of forest biomass resources would promote sustainable forest management with economic and environmental aspects.


