Article

The Influence of Increased Salvage Felling on Forwarding Distance and the Removal—A Case Study from Croatia

1
Faculty of Forestry, University of Zagreb, Svetošimunska Street 25, 10000 Zagreb, Croatia
2
Croatian Forests Ltd., Forest Administration Zagreb, Lazinska Street 41, 10000 Zagreb, Croatia
*
Author to whom correspondence should be addressed.
Forests 2021, 12(1), 7; https://doi.org/10.3390/f12010007
Submission received: 3 December 2020 / Revised: 20 December 2020 / Accepted: 21 December 2020 / Published: 23 December 2020
(This article belongs to the Special Issue Planning, Design, and Maintenance of Forest Road Networks)

Abstract

:
During the seven-year research period, the average annual removal was by 3274 m3 higher than the average annual removal prescribed by the existing management plan (MP). The main reason lies in the high amount of salvage felling volume at 55,238 m3 (38.3%) in both the main and the intermediate felling due to oak dieback. The analysis of forest accessibility took into account the spatial distribution of cutblocks (with ongoing felling operations) and the volume of felled timber for two proposed factors: (1) the position of the cutblock and (2) the position of the removal. Cutblock position factor took into account the spatial position of the felling areas/sites, while removal position factor besides the spatial reference took into account the amount of felled timber (i.e., volume) both concerning forest infrastructure network and forest operations. The analysed relative forest openness by using geo-processing workflows in GIS environment showed four types of opening areas in the studied management unit (MU): single-opened, multiple-opened, unopened and opened areas outside of the management unit. Negative effects of the piece-volume law and low harvesting densities on forest operations are highlighted in this research due to high amount of salvage felling particularly in the intermediate felling by replacing timber volume that should have come from thinnings.

1. Introduction

Forest road networks are managed to provide economic access to forest resources while minimising the environmental impacts [1]. Stampfer et al. [2] pointed out that the efficiency of a particular timber harvesting system is based on the existing network of forest roads. The primary forest transport infrastructure consists of all categories of forest roads, public roads that can be used in forest management and unclassified roads as well [3]. A sufficiently dense and properly distributed network of forest roads is a basic prerequisite for intensive forest management, and therefore proper silviculture and harvesting operations, but also for fire-fighting activities [4]. The location and operation of harvesting machinery, along with the design and construction of access roads, are important problems faced by forestry planners, making up about 55% of total production costs [5]. The model of the lowest cumulative costs of timber extraction and building forest roads dictates that the denser the network of forest roads, the higher the costs of road construction, and the cheaper the transport of wood and vice versa [6]. The optimal density of forest roads is determined by the road distance where the transport costs and costs related to the forest roads are the lowest. However, it should be emphasised that the accessibility of forests is not exclusively focused on timber extraction and long-distance transport of timber, but also other forest management activities.
Given the numerous challenges facing the forestry of the EU, as an area of the highly specialised niche [7], the production of timber assortments in the wood supply chain, is one of the most critical operations during which forestry experts and practitioners must decide how and where the timber will be used. Paluš and Paroblek [8] state that from the technical point of view, an only certain quality of timber can be used for specific purposes (veneer logs, sawlogs, cellulose and pulpwood etc.). In the past decades, climatic extremes (droughts, ice storms and similar) in Croatia had brought major problems in sustainable management and the production of high-quality timber assortments which resulted in differences between the planned and produced assortment structure of processed timber and between planned and realised production revenues. The mentioned differences go to the extent that the silvicultural operations are carried out at the cost-effectiveness limit, that is, they become unprofitable [9]. South East Europe is faced with the highest frequency of drought events in Europe; after the year 2000, significant droughts and heatwaves were observed in 2002, 2003, 2007–2008, 2011 and 2012 [10].
In Croatia felled timber volume from even-aged forests comes from: (1) the main felling which consists of: (1.1) shelterwood system regeneration, (1.2) salvage felling, (1.3) clearcut (due to the land conversion), and (2) the intermediate felling which consists of: (2.1) thinning, (2.2) intermediate salvage felling. Timber felled in shelterwood system regeneration is the volume prescribed by the existing management plan (MP) and consists of: (1) preparatory felling, (2) seedling felling and (3) final felling. Timber volume is mostly gained from thinnings and during main felling i.e., as the MP regulates, but also to a minor extent it can come from salvage felling or from a clearcut because of the land conversion. The removal is determined according to the production possibilities of the stand for each management class, by sub-compartments and tree species, and is developed by groups of assortments at the level of the management unit. The continuity of the removal is planned following the management classes of the main economic tree species. Prka and Krpan [11] state that the quality of the stand is the result of different abiotic and biotic factors, and that the total stand volume cannot serve as the basis for planning of harvesting operations (cutting, timber extraction and transport) nor for calculating the financial inflow. In even-aged forests, felled timber volume comes from: (1) main felling which consists of shelterwood system regeneration as its main part and possible clearcut due to the land conversion, (2) thinning and (3) salvage felling. Timber felled in shelterwood system regeneration is the volume prescribed by the MP and consists of: (1) preparatory felling, (2) seedling felling and (3) final felling. Clearcut due to the land conversion applies to those areas that will be permanently be used for other purposes i.e., areas separated from the forest management area, roads, power line routes, canals, etc. Thinning volume is also prescribed by the MP. Timber volume gained from salvage felling consists of all timber that needed to be felled, but was not prescribed (expected) in the MP together with eventual illegal felling of timber. If such unplanned volume exists then the amount of prescribed (planned) thinning timber volume must be subtracted for the volume of salvage felled timber in each compartment.
The goal of this research is to show how increased salvage felling can affect the planning of the removal prescribed by the management plan. Also, indirectly it affects extraction distance which could be calculated by using factors which consider not only forest infrastructure network, but also the spatial position of the felling areas/sites and the amount of felled timber.

2. Materials and Methods
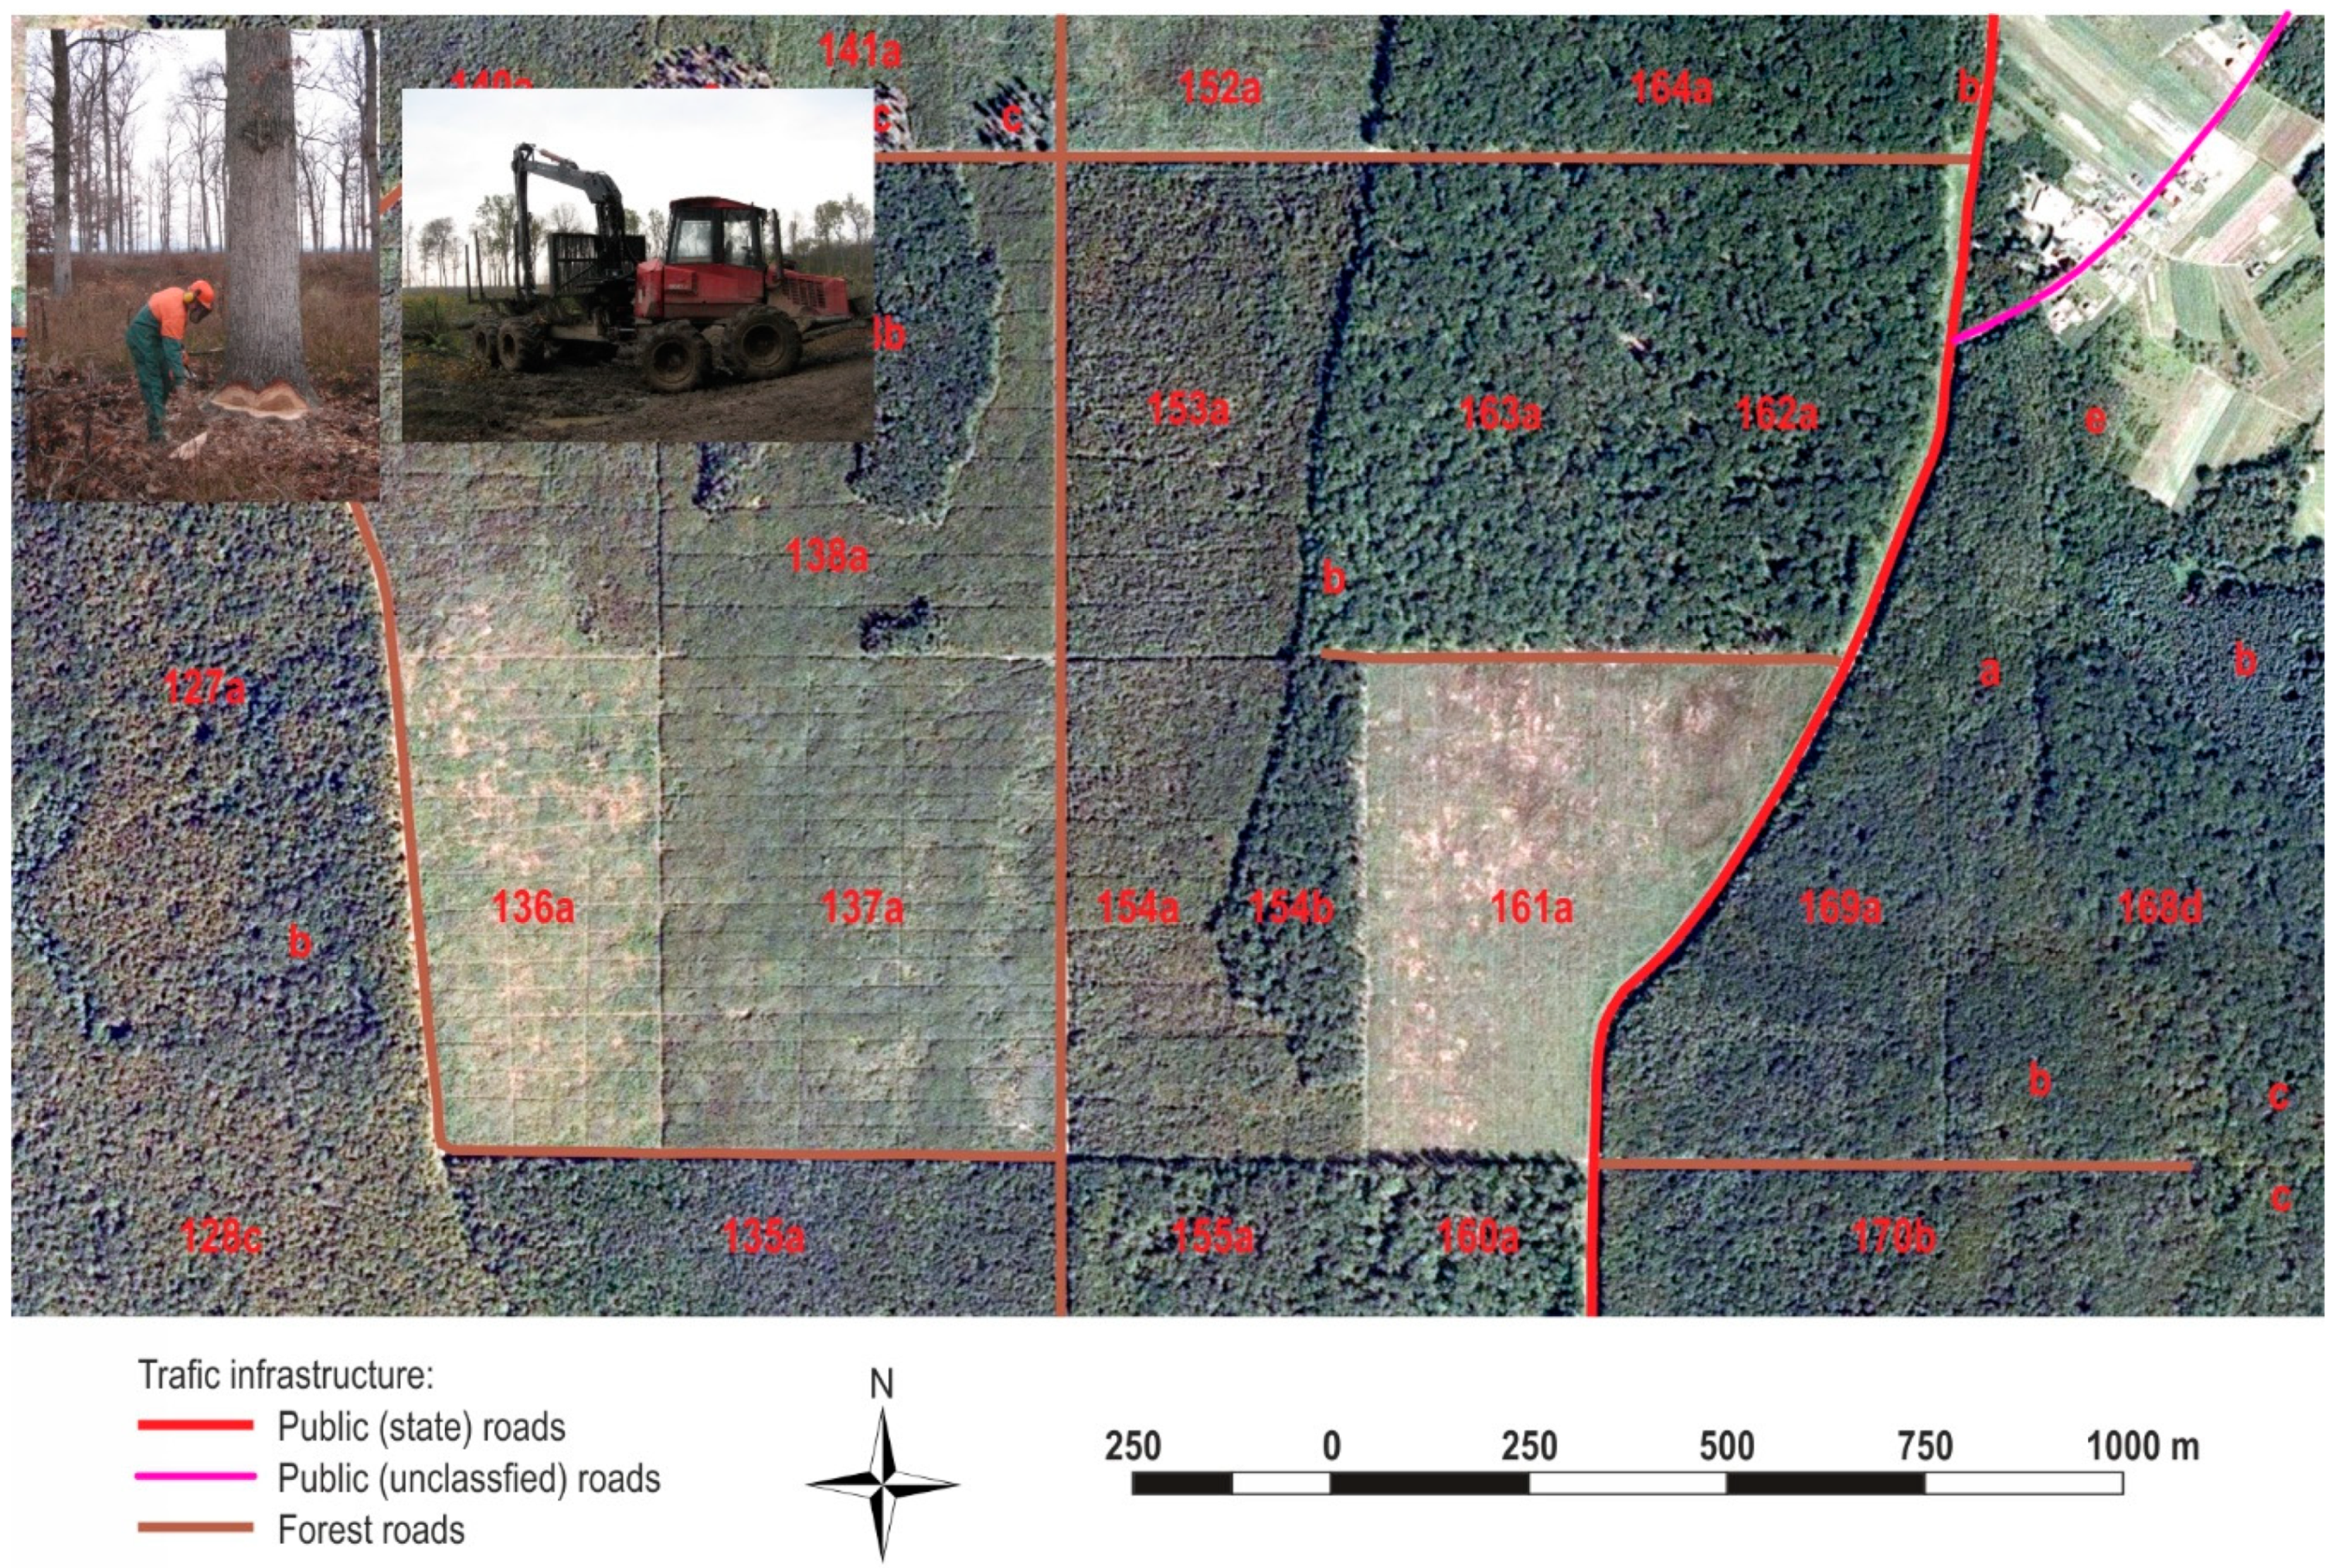
2.1. Study Area

We conducted the research in the management unit (MU) Šiljakovačka Dubrava II, located near the capital Zagreb. The management unit extends from 45°40′ to 45°43′ north latitude and from 13°35′ to 13°39′ east longitude and covers 4238.48 ha, of which 3975.48 ha is under forest cover. In the researched MU prevail even-aged forests of pedunculate oak (Quercus robur L.) and hornbeam (Carpinus betulus L.) and are managed by the shelterwood system. Pedunculate oak is at 73.9% of timber volume, while hornbeam is at 18.7% and the rest of 7.4% are other species. The terrain is flat, slightly undulating with minor depressions. The altitudes of the terrain range from 103 m to 119 m above sea level. Six main watercourses intersect this MU and flow in a northerly direction, only to flow into the Odra and Sava rivers. Forest growing stock in the researched MU is 988,405 m3, and 10-year increment and removal are 256,440 m3 and 173,062 m3 respectively. Pedunculate oak from seeds occupies 88.1% of the MU area and 94.3% of the growing stock, while hornbeam grows from the stump occupying 8.7% of the MU area and 3.9% of the growing stock. The prescribed 10-year removal amounts to 17.5% of the forest growing stock i.e., 67.5% of the average 10-year increment. In the structure of the 10-year removal, the main felling is at 51.2% and thinning is at 48.8%.

2.2. Data

Based on the data of felled timber during seven years in the Forestry Office (FO) Velika Gorica [12] we will analyse the structure of timber volume in space and time. The analysis of the structure of felled timber volume will be classified depending on its origin i.e., type of felling into (1) the main felling which consists of: (1.1) shelterwood system regeneration, (1.2) salvage felling, (1.3) clearcut (due to the land conversion), and (2) the intermediate felling which consists of: (2.1) thinning, (2.2) intermediate salvage felling. Such felling classification is usual in Croatian forestry and is prescribed by management plans for both state or private even-aged forests [13,14].
We will make the calculations of the required parameters of the primary forest infrastructure based on the Forest Administration Office’ (FAO) Zagreb road cadastre. Annual felling operations are not performed on the entire area of the MU, but only in the individual sub-compartments or their parts i.e., cutblocks. Forest accessibility will be analysed through the change of the following parameters, as follows:
  • Road density,
  • Average theoretical forwarding distance (Equation (1)):
    s t = e t = 2500 g c
    where are:
    • gc—road density, m/ha
    • st—theoretical forwarding distance, m
    • e—distance between roads, m
    • L—road length, m
  • Average geometrical forwarding distance (Euclidean distance tool in ArcGIS 10.3),
  • Road network factor (Equation (2)):
    f m = s g ¯ s t = s g ¯ 2500 g c = s g ¯ · g c 2500
The analysis of forest accessibility of the selected MU will take into account the spatial distribution of specific areas of land with defined boundaries, authorised for harvest. i.e., cutblocks and the volume of felled timber regarding two factors: (1) the spatial position of the cutblock and (2) the spatial position of the removal.
Above mentioned factors are based on the road network factor, which represents the deviation of the shape of the forest surface and the layout of the primary forest infrastructure in space, to the ideal theoretical model.
f p o l = s g ¯ s t = i = 1 n s g i n s t
where:
  • fpol—cutblock position factor
  • s ¯ g —average realised geometrical forwarding distance, m
  • st—theoretical forwarding distance, m
  • sgi—shortest distance from the regular point network to primary forest infrastructure, m
  • n—number of points in the regular network within the sub-compartments with felling operations
The cutblock position factor takes into account the spatial position of the sub-compartments in which timber is authorised for harvesting within one calendar year. The factor is calculated as the ratio of the average realised geometric forwarding distance and the theoretical forwarding distance (Equation (3)). The average realised geometric forwarding distance represents the arithmetic mean of the distances from individual points of the regular network, which fall into the area of the sub-compartments (cutblocks) with felling operations to the nearest primary forest road.
The removal position factor takes into account the spatial position and timber volume of the sub-compartments in which timber is authorised for harvesting within one calendar year, and is calculated as the ratio of the weighted realised average geometrical forwarding distance and the theoretical forwarding distance (Equation (4)). The weighted realised average geometrical forwarding distance represents the weighted arithmetic mean of the average geometric forwarding distances of individual sub-compartments. The average geometric forwarding distance of an individual sub-compartments represents the arithmetic mean of geometric distances from individual points of a regular network that fall into the space of an individual sub-compartment to the nearest primary forest road.
f r e m = s ¯ g w s t = i = 1 n s ¯ g i 0 · V i i = 1 n V i s t
where:
  • frem—removal position factor
  • s ¯ g w —weighted realised geometrical forwarding distance, m
  • st—theoretical forwarding distance, m
  • s ¯ g i 0 —weighted arithmetic mean of the average geometric forwarding distances of individual—sub-compartments, m
  • Vi—felled timber volume in specific sub-compartment, m3
  • n—number of sub-compartments with felling operations
We will present the analysis of forest accessibility of the selected MU in the period of seven years with regard to: (1) changes in the length of primary forest infrastructure (due to the construction of new roads), and (2) reduction of forest area (due to the land conversion because of the highway construction). We will analyse traffic infrastructure network with regard to: (1) does it affect forest accessibility; (2) do roads give access to the forest from one-side (3) do roads give access to the forest from both sides.
Relative forest openness will show the quantity and quality of traffic infrastructure network and will be calculated by using geo-processing workflows in GIS environment. Relative openness model will provide four different area classes in study area depending on buffer placement (inside/outside researched management unit) and overlap occurrence: (1) single opened forest areas, (2) multiple opened forest areas, (3) unopened forest areas and (4) opened area outside of the researched MU. Buffer width will be 240 m which is in accordance with average targeted timber extraction distance in low-land forests [15].

3. Results

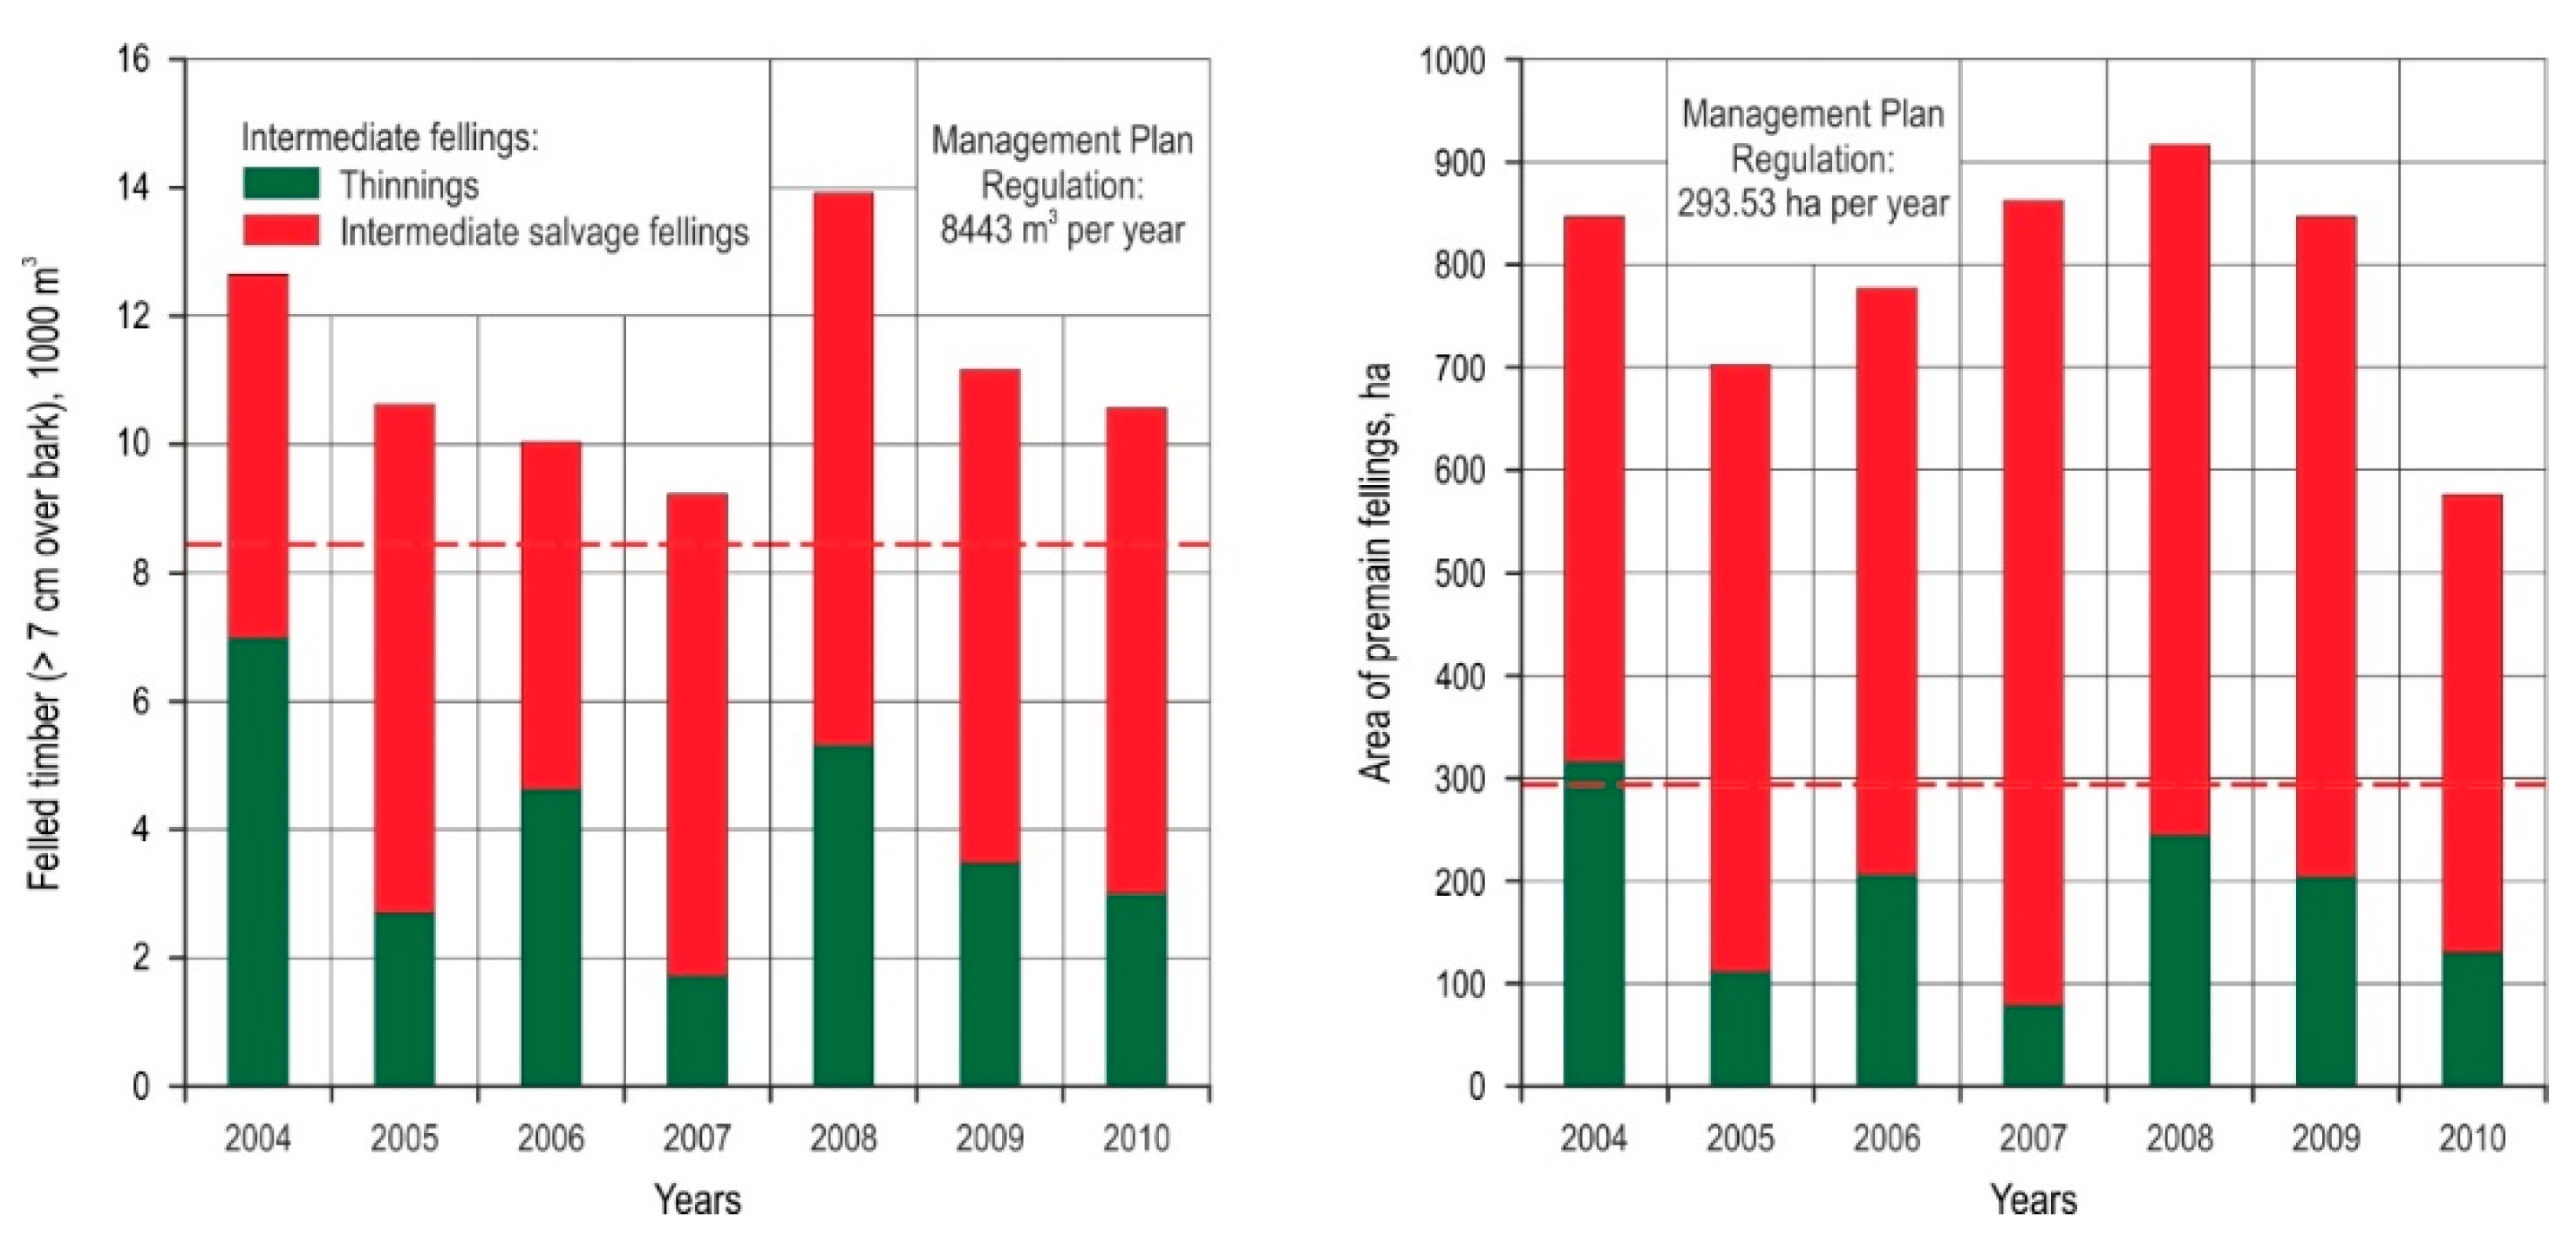
3.1. Analysis of Timber Volume

In the researched MU the authorised harvesting volume i.e., prescribed removal for ten year period is 173,062 m3, consisting of 88,629 m3 (51.2%) timber volume cut in the main felling (Figure 1) on the area of 264.63 ha and of 84,433 m3 (48.8%) timber volume cut in the intermediate felling on the area of 2935.28 ha. The MP therefore prescribes the average annual removal at 17,306 m3 consisting of felled timber in the main felling with 8863 m3 and 8443 m3 felled timber in the intermediate felling. In the seven-year period, which is the length of this research, the total amount of felled timber was 144,058 m3, which is 83.2% of the prescribed 10-year removal with 65,890 m3 (45.7%) felled in the main felling and 78,168 m3 (54.3%) was felled in the intermediate felling. Total annual removal ranged from 15,210 m3 to 25,607 m3 with average annual value at 20,580 m3.
Average annual removal was higher by 3274 m3 than the average annual removal prescribed by the MP. The main reason lies in the high amount of salvage felling volume at 55,238 m3 (38.3%) in both the main and the intermediate felling, but also in the clearcut due to 28.17 ha of land conversion (timber volume of 6776 m3) because of the highway construction. The prescribed removal by the MP states that the felled timber volume should be on the area of 3199.63 ha, consisting of 264.63 ha (8.3%) for the main felling operations and 2935.28 ha (91.7%) for the intermediate felling operations (which is expected timber volume from thinnigs). The main felling volume therefore, should be realised on 26.46 ha, whilst the removal from the intermediate felling should be achieved on 293.53 ha of the MU.
In the seven-year period, the removal was gained on 6238.35 ha, which is double than the prescribed by the MP (195%) or 145% with regard to the total area of the MU (4238.48 ha). Average annual removal area was 891.19 ha, ranging from 606 ha to 992 ha in the seven-year research period. If we compare the average annual removal area prescribed by the MP (319.19 ha) with the achieved one after the main and intermediate fellings, a difference of 571.92 ha is evident.
The volume from intermediate salvage fellings varied in the seven-year period from 62.7% to 90.8% of the total felled timber volume (Figure 2) and was different from the prescribed area size stated in the MP. The MP stated that thinnings should be done on 293.53 ha in each year, but the average area of the intermediate felling (thinnings + intermediate salvage felling) was actually on the 789.89 ha annually, which is 2.7 times higher than the prescribed amount (Figure 2).

3.2. Analysis of the Forest Accessibility

The researched MU has a primary forest road network of parallel forest roads with equal distances (Figure 3). Trees are felled motor-manually with a chainsaw, while the timber is transported to the forest road by a forwarder (Figure 3).
From 49.19 km of total public roads in 2004, only 37.7% of them gave access to the researched MU. The total length of forest roads was 38.922 km. At the end of the research period in 2010, the total length of public roads was 49.78 km, but only 37.3% gave access to the researched MU. The total length of forest roads affecting road density in 2010 was 42.215 km.
Road density in 2004 was 13.16 m/ha with 73.9% forest roads and 26.1% were public roads. In the ideal theoretical model, the distance between roads was 759.9 m and average forwarding distance 190 m. Six years later, road density was 14.08 m/ha with 75.5% share of forest roads and 24.5% share of public roads. In the ideal theoretical model, the distance between roads was 710.2 m and an average forwarding distance 177.6 m. The resulting deviations in the average forwarding distances are a consequence of not using GIS in the preparation of the MP, but it is determined by improvised methods (Figure 4).
In the 2004 average geometrical forwarding distance (based on 400,008 regular points) was 270.8 ± 210.3 m. In 2010 average geometrical forwarding distance (based on 397,401 points) was 257.8 ± 198.2 m. The road network factor was calculated as a ratio of the average geometrical and the theoretical forwarding distance for the years of research (Figure 5) and ranged from 1.42 to 1.45.

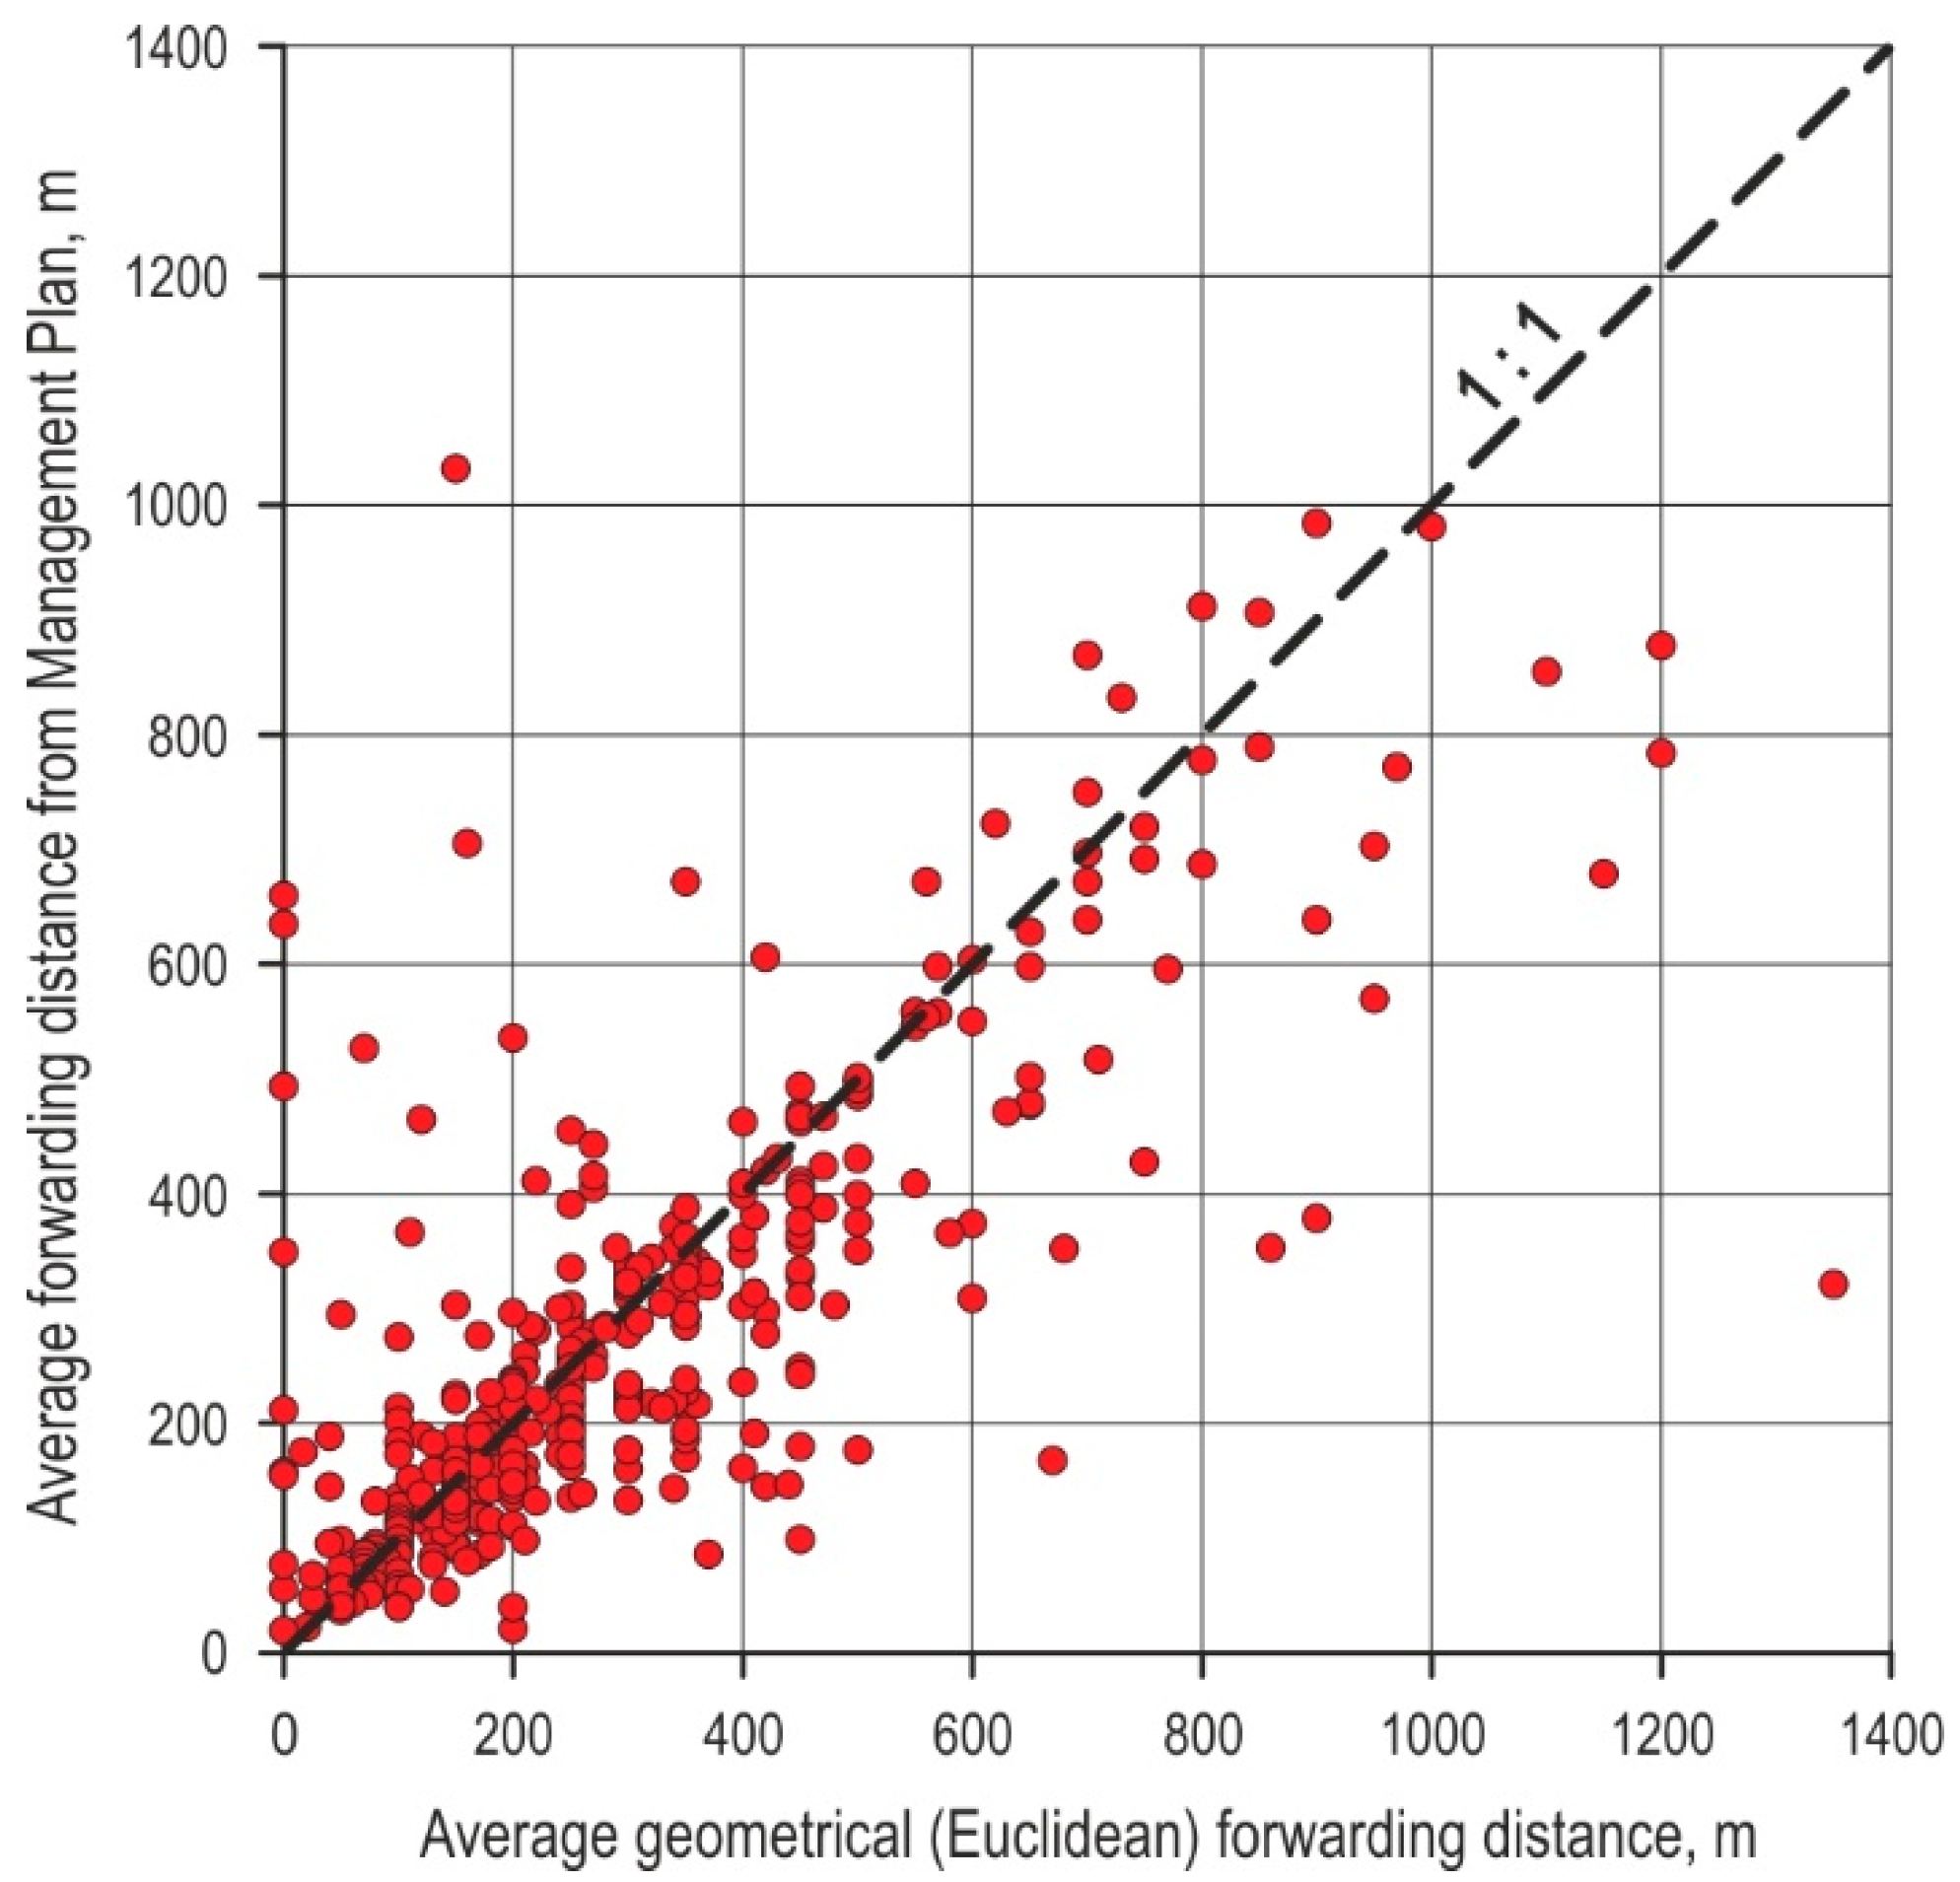
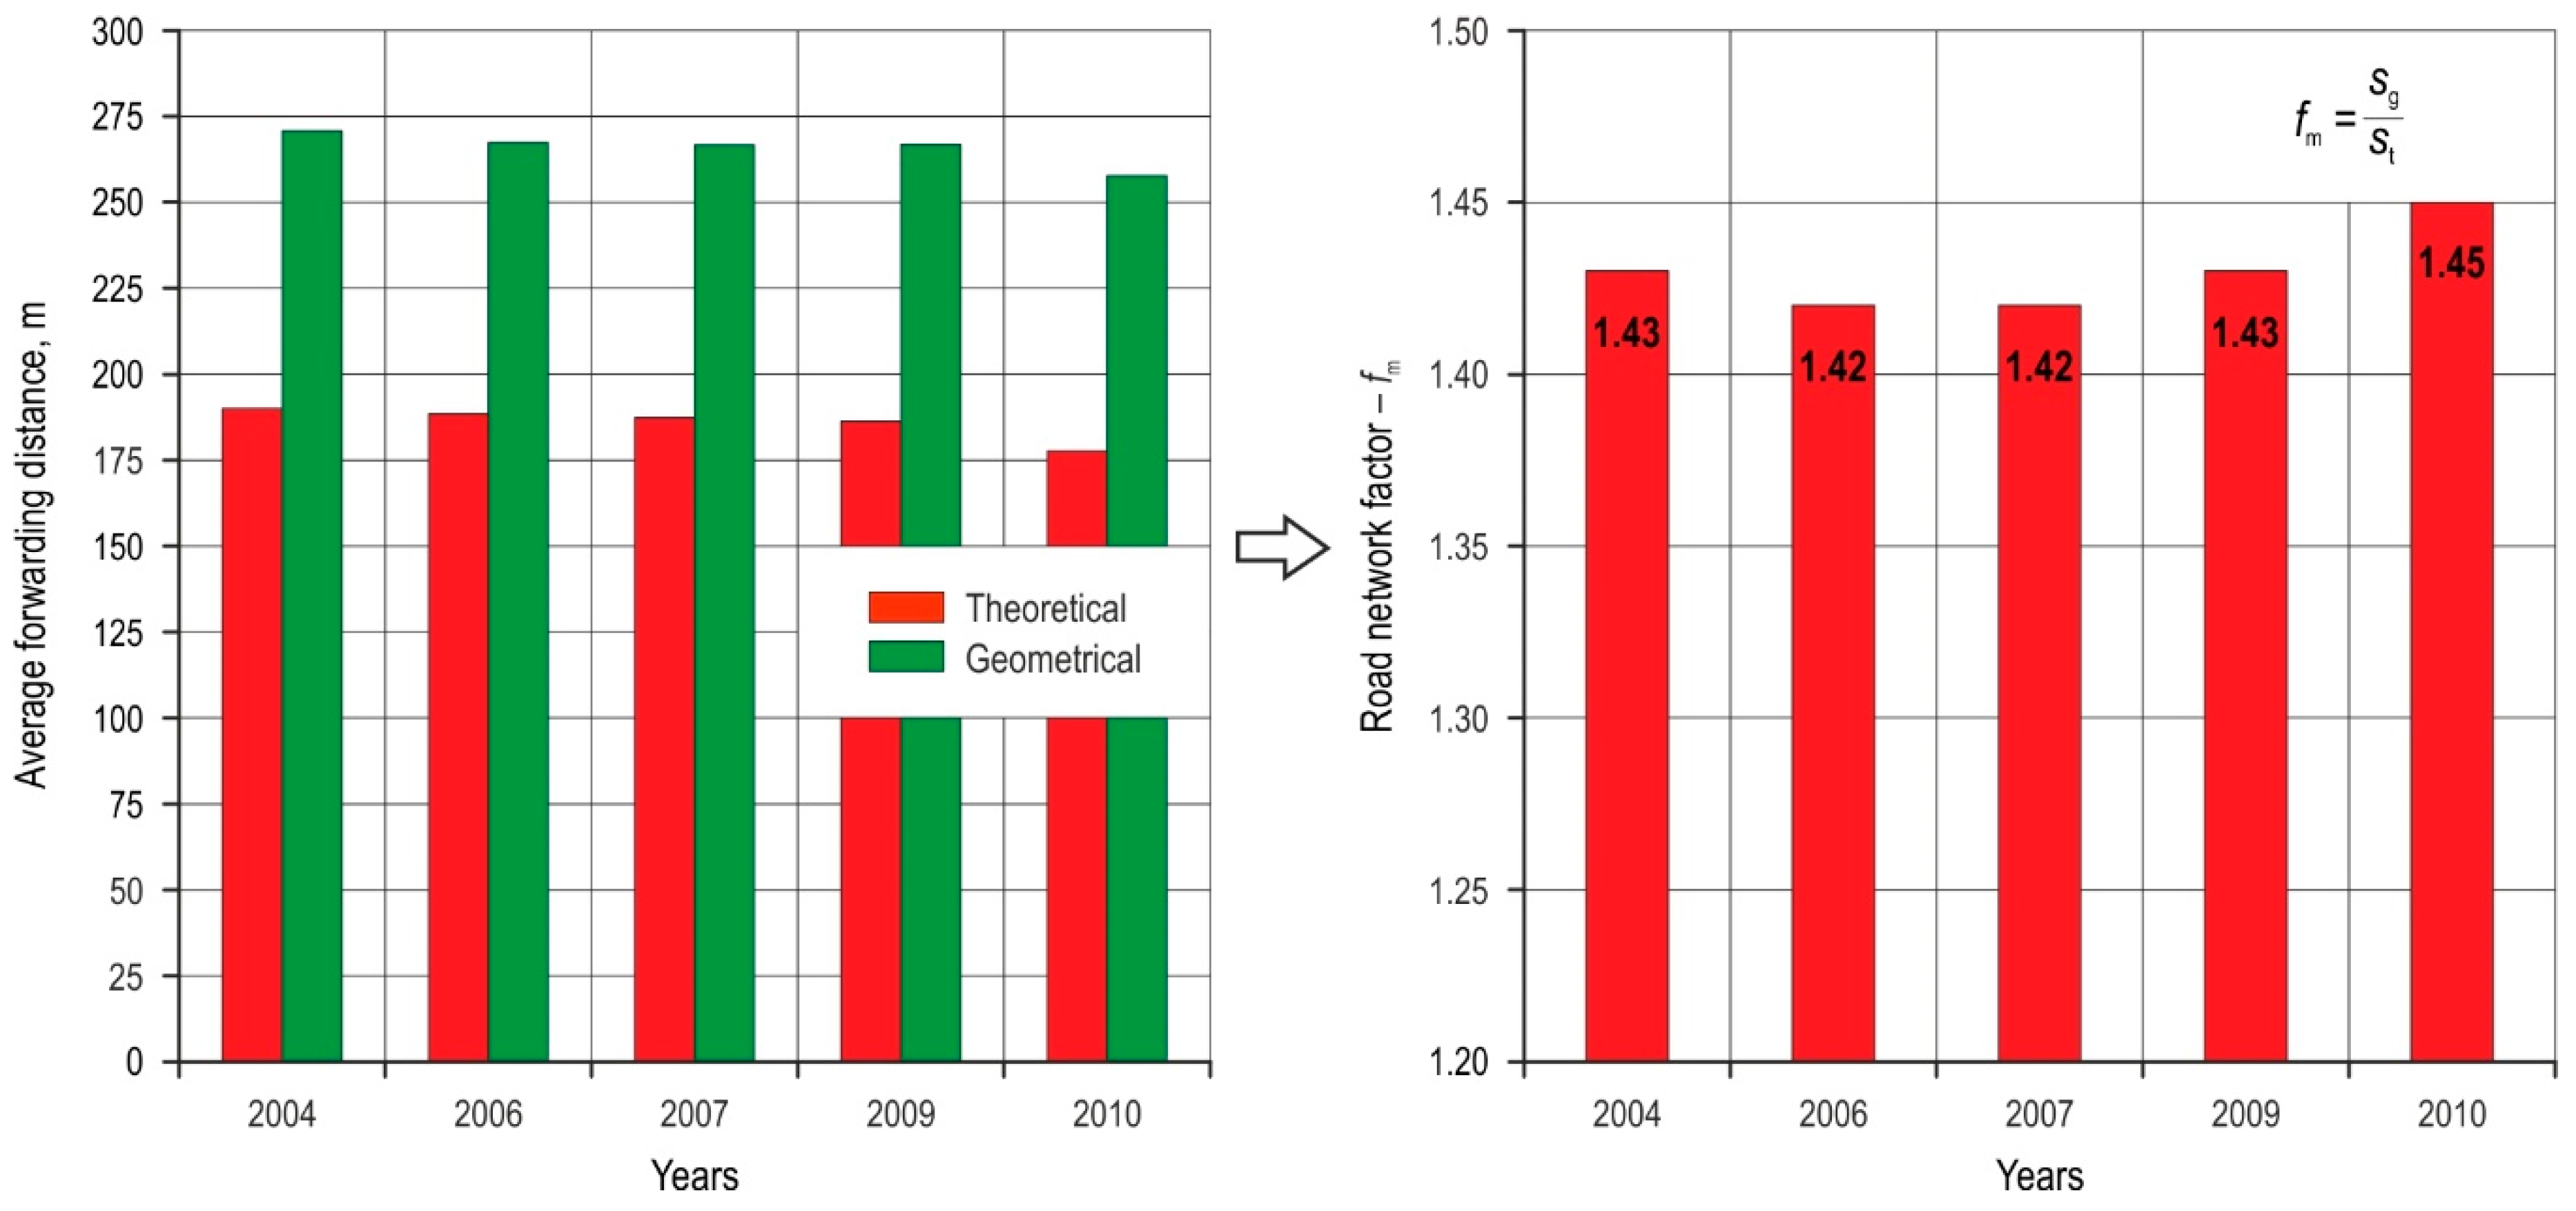
3.3. Analysis of the Average Forwarding Distances in Space and Time and Relative Forest Openness

In the researched period felled timber volume varied throughout the MU and was not achieved in all of the compartments and sub-compartments equally. We performed an analysis based on the Euclidean distances of regular point network from the felling areas to the primary road infrastructure network. We also analysed the structure of felled timber volume in space and time with concerning average geometrical forwarding distances of each sub-compartment (with felling operations) and their weighted arithmetic mean values, also including the volume of felled timber in those sub-compartments (Figure 6). This way the analysis of the MU’ accessibility with regard to the volume of felled timber was possible.
The analysis showed deviations of the average realised geometric forwarding distance based on a regular network of 10 m × 10 m points [12] and average values of geometric forwarding distances of individual sub-compartments. This is due to the smaller number of data (the value of average forwarding distance is expressed by one number) and because of differences in their variability (Figure 6).
We found discrepancies between the average realised geometric forwarding distances (based on a regular network of points) and weighted realised geometrical forwarding distance (Figure 7), which by years were as follows: 24.5 m (2004), 27.6 m (2005), 25.9 m (2006), −22 m (2007), −1.1 m (2008), −101 m (2009) and 10.7 m (2010).
The double analysis of the variance of forest accessibility factors, for the studied seven-year period (2004–2010), did not indicate statistically significant differences between road network factor, cutblock position factor and removal position factors. Certainly, their value ranges should not be forgotten, as their limits are 95% of the confidence interval (Figure 8 and Table 1).
In 2004 relative forest openness (Table 2) was 84.28%, but with inadequate shape of the infrastructure network which resulted in high amount of multiple opened forest areas 41.15%, single opened forest areas 43.13%, unopened forest areas 15.72% and opened area outside of this MU 46.70%. The reason of such high amount of areas opened outside of researched MU is because of many segments of public and forest roads that pass on the borderline of the researched MU. The occurrence of 41.15% multiple opened forest areas is mostly due to many unplanned road constructions in the past. Relative forest openness higher than 85% is excellent according to the Bylaw on measure implementation M04 Investments in physical assets, by-measure 4.3 Grant for investments in development, modernization and customization of agriculture and forestry, operation type 4.3.3 Investments in forest infrastructure from the Program of Rural Development in Republic of Croatia in period from 2014 to 2020 [16] which states that relative forest openness between 75–85% is very good and everything above is excellent.

4. Discussion

In most sub-compartments, the prescribed removal was fully realised through salvage felling, and in some sub-compartments, the volume of the removal was higher than the prescribed by the MP. As a result, the implementation of management regulations was realised (volume), but not for the prescribed area, which will lead to increased competition among trees and eventually dieback of weaker individuals.
Forest management is based on two paradigms: (1) perpetuity of the forest stand based on the equilibrium between standing volume and increment and removal and (2) constrained optimisation of commodities (marketable or not). The latter, output-oriented, paradigm, has favoured simplifications of forest ecosystem structure and composition [17]. In this research, the differences between the areas on which the removal was realised and the areas on which the removal was prescribed are a consequence of salvage felling in both main felling and intermediate felling operations in sub-compartments where appropriate and expected thinning operations could revitalise broad-leafed forests if the cost balance of the management is positive [18]. Salvage fellings in the seven-year period were realized in the area of 4588.77 ha, which is 74% of the total area of all realised felling operations (6238.35 ha). Of this area, 350.08 ha (7.6%) refers to the main felling, and 4238.69 ha (92.4%) to the intermediate felling operations.
In the seven-year period from 2004 to 2010, 65,890 m3 of timber volume was felled in the main felling operations, with an annual average of 9413 m3, which is 550 m3/year more than the prescribed average annual removal (8863 m3). By 2010, 73.4% of the prescribed 10-year timber volume (88,629 m3) had been felled. In the structure of realised main felling the shelterwood system regeneration participated with 54,249 m3 (82.3%) of timber volume, salvage felling with 4865 m3 (7.4%) of timber volume, and clearcut due to the land conversion with 6776 m3 (10.3%) of timber volume.
In the summer of 2005, which was an extremely dry year, dieback of trees occurred in almost all compartments in which the operations of the main felling were expected and prescribed. That year, 1818 m3 of timber volume from salvage felling was gained in 13 compartments, which is 37.4% of the total realised volume from the salvage felling in the monitored seven-year period. The total area (223.15 ha) on which the main felling was realised in 2005, 149.98 ha (67.2%) led to salvage felling. During 2006 in the sub-compartment 181a there was a mass drying of pedunculate oak because of the pathogenic fungus Armillaria mellea Vahl. Ex Fr. Armillaria root disease is a contributing factor to oak decline [19] which resulted in 1505 m3 of timber volume cut in salvage felling of 1882 m3 felled timber in that year. In 2006, 38.7% of the total salvage felling was realised in the seven-year period. During 2005 and 2006, a total amount of 3700 m3 of dead trees was cut, which is 76% of the total realised salvage felled timber volume gained during main felling operations.
Based on the MP, the prescribed volume of intermediate felling from 2004 to 2010 amounts to 84,433 m3, which is the intensity of 9.4% of the total thinning fund, i.e., 35.1% of the ten-year increment. Prescribed removal in thinnings in sub-compartments of the II age-class (area of 536.45 ha) was 11,751 m3 (22 m3/ha) and is obliged to be executed by the area while the specified prescribed timber volume serves only as an orientation. In the period from 2004 to 2010, a total of 78,168 m3 of timber volume from intermediate felling was gained, which is 92.6% of the prescribed removal (88,433 m3) from the intermediate felling. The total annual removal in intermediate felling ranged from 9219 m3 (2007) to 13,921 m3 (2008) with an average annual value of 11,167 m3. The realised average annual removal in the seven-year period was 2724 m3 higher than the average annual removal prescribed by the MP. In the seven-year period from the total amount of felled timber volume from intermediate felling (78,168 m³), 64.4% was generated through intermediate sanitary felling during July and August of the years of research and 35.6% was felled in thinnings.
During 2008 and 2009, due to the construction of the section of the highway, there was a permanent land conversion of one forest part. An area of 20.48 ha was excluded from the FO Velika Gorica and the clearcut of the stand led to 6776 m3 increase in the main felling volume. Figure 1 shows that the share of the timber volume from the clearcut in 2008 was 50.5% of the total main felling volume, and in 2009 17.6% of the main felling volume. This is just one of the situations how road network can negatively affect the forest stand by reducing the habitat available, by affecting movement patterns, and by extending the edge conditions into the forest [20].
In the seven-year monitoring period there was the increase in road density from 13.16 m/ha to 14.08 m/ha i.e., the reduction of the distance between roads from 759.9 m to 710.2 m, and the average theoretical forwarding distance from 190 m to 177.6 m (Figure 5). This happened as the result of the construction of multiple forest roads in 2006, 2007 and 2010, as well as the reduction of the MU’s area due to the construction of the highway. Meeting management and environmental goals are often complex because of the many aspects involved in forest road management, including the natural environment and socio-economic context in which the road network is located [21].
The value of the forest road network factor related to the lowland forest is higher compared to previous publications from the literature [6]. The reasons for the higher values are: (1) irregularity of the shape of the MU (4238.48 ha) with a circumference of 89.248 km, which is 3.43 times larger than the circumference of a square of the same area (26.04 km), and (2) the irregularity of the existing network of primary forest infrastructure with a length of 59,101 km, of which forest roads participate with 68.6% and public roads with 31.4%.
Even though forest roads play a dual role in providing both access to the forest and transportation mobility and, together with extraction routes normally form a relatively even network in the forest [22] the values of geometric forwarding distances varied. As this is an area of lowland forests with level slope class and very even roughness class, the significance of geometrical extraction distances on both MU and compartment level would is great [23]. However geometric forwarding distance was under the influence of the size of the felling areas and their spatial distribution and position to the primary forest road network.
The reasons for the deviation of the realised average geometric forwarding distances and the weighted realised forwarding distance (Figure 7) was because: (1) the structure of felling areas by different types of felling, (2) the structure of felled timber by different types of felling, (3) the spatial distribution of felling areas by different types of felling to the primary forest road network. For two years in which the most significant deviations of accessibility factors were recorded, it can be concluded that in addition to the spatial position of felling areas to forest infrastructure, the structure of different types of felling expressed by the volume of felled timber and felling areas size showed their effect. The calculated weighted arithmetic mean forwarding distance by years of research (Figure 6), allows the analysis of the MU’s accessibility with respect to the quantities (volume) of felled timber in space and time.
Relative openness as a quality parameter is still used in grading forest openness but with variations in buffer width [24]. Several examples of accessibility evaluation have been developed in other studies, considering different distances in relation to the type of machines and techniques applied [25]. GIS technology could be used to analyse the topographic, ecological and morphological characteristics of the study area and the application of precision forest harvesting may contribute significantly to the enhancement of efficient cut-to-length technology, i.e., a harvesting system in which trees are delimbed and bucked into assortments prior to subsequent transport to the landing site [26] as in this study area. Unfortunately, in Croatia GIS is infrequently used in planning harvesting operations and is not in use when calculating average extraction distances (either forwarding or skidding) in compartments and sub-compartments. The occurrence of diebacks beyond the shelterwood regeneration, but within the regeneration period of stands of the last age-class represents a special problem in rational forest management. A large amount of tree dieback brings unfavourable effects of low felling densities and planning of time-space distribution of felling areas. Future management and development of oak forests due to oak dieback and decreasing stand structure quality and their spatial heterogeneity depend on actual age-class structure, intensity and spatial-temporal dynamics of forest regeneration [14]. The most probable reasons for such a large share of salvage felled timber are: (1) unfavourable climatic conditions (dry summers) where climate change affects forest ecosystems and timber production [17], (2) falling groundwater levels due to the construction of Sava—Odra canal where river regulation disrupts flood patterns of lowland forests [27] and increases stress to ecosystems [28], (3) low removal values in past MP’s, and (4) non-execution of the prescribed regular fellings due to their replacement with salvage fellings. The planning and execution of timber harvesting should be sustainable with emphasis of so-called 5-E standards: economic, environmental, energy-efficient, ergonomic and esthetical [29]. Development of region-specific, practically relevant performance criteria are highly desirable that meet local needs and maintain flexibility to evolve and be capable of incorporating ever-changing work environments and challenges [30].

5. Conclusions

Negative effects of the piece-volume law and low harvesting densities on forest operations are highlighted in this research due to high amount of salvage felling particularly in the intermediate felling by replacing timber volume that should have come from thinnings. The negative effect on the performance of harvesting operation and planning due to the lower value of felled timber also, should not be ignored.
Various variants of the average forwarding distance (theoretical, average geometric, average realised geometric, weighted arithmetic mean) can show forest accessibility to a certain extent depending on other terrain characteristics such as ground roughness and obstacles, which here was not the case. However, for planning harvesting operations in space and time cutblock position factor and removal position factor give much more information to forestry experts. Cutblock position factor takes into account the spatial position of the felling areas/sites, while removal position factor besides the spatial reference takes into account the amount of felled timber (i.e., volume). The analysed relative forest openness by using geo-processing workflows in GIS environment showed four types of opening areas in the studied management unit: single-opened, multiple-opened, unopened and opened areas outside MU. The model can be used in other situations and forest areas only with minimal changes in buffer width adopted to local conditions and harvesting systems i.e., skidder winch length, forest skyline lateral rope length etc. while determining the quality of designed primary infrastructure network, but also when including secondary infrastructure network for more detailed information. The use of GIS and computer software should be encouraged for use in practical forestry. Unfortunately, in Croatia improvised methods for calculating average extraction distances are still often in use.
In the future, a multi-entry system for assessing the quality of primary forest openness by relief areas should be developed, which would be based on some other quality parameters of forest accessibility (e.g., road network factor or the road structure accessible forest areas) in addition to other parameters such as road density, average forwarding/extraction distance and relative forest openness. The building of new forest roads is complex and expensive; however, in the changing climatic conditions with high amount of oak dieback it is clear that optimal planning, road alignment and design are mandatory to face challenges of the upcoming change.

Author Contributions

Conceptualization and Writing—Original Draft Preparation, A.Đ.; Methodology, Validation T.P. (Tomislav Poršinsky); Resources and Supervision T.P. (Tibor Pentek); Writing—Review & Editing, I.P. Software Z.B. All authors have read and agreed to the published version of the manuscript.

Funding

This research received no external funding.

Data Availability Statement

The data presented in this study are available on request from the corresponding author. The data are not publicly available because it is data gained from the state owned company Croatian Forests Ltd. for which a request is necessary.

Conflicts of Interest

The authors declare no conflict of interest.

References

  1. Dodson, E.M. 2021: Challenges in Forest Road Maintenance in North America. Croat. J. For. Eng. 2021, 42. In press. [Google Scholar]
  2. Stampfer, K.; Pentek, T.; Đuka, A. Timber Harvesting in Europe—Trends. In Proceedings of the Current Position and Perspectives of Forestry and Wood Technology in the 21st Century, Zagreb, Croatia, 18–19 October 2018; p. 1. [Google Scholar]
  3. Papa, I.; Pentek, T.; Lepoglavec, K.; Nevečerel, H.; Poršinsky, T.; Tomašić, Ž. Methodology of Development of Detailed Primary Forest Traffic Infrastructure Register as the Basis for Forest road Maintenance Planning and Optimization. Šumarski List 2015, 139, 311–328. [Google Scholar]
  4. Laschi, A.; Foderi, C.; Fabiano, F.; Neri, F.; Cambi, M.; Mariotti, B.; Marchi, E. Forest road planning, construction and maintenance to improve forest fire fighting: A review. Croat. J. For. Eng. 2019, 40, 207–219. [Google Scholar]
  5. Epstein, R.; Weintraub, A.; Sapunar, P.; Nieto, E.; Sessions, J.B.; Sessions, J.; Bustamante, F.; Musante, H. A combinatorial heuristic approach for solving real-size machinery location and road design problems in forestry planning. Oper. Res. 2006, 54, 1017–1027. [Google Scholar] [CrossRef]
  6. Dietz, P.; Knigge, W.; Löffler, H. Walderschließung; Verlag Paul Parey: Hamburg/Berlin, Germany, 1984; pp. 1–426. [Google Scholar]
  7. Landekić, M.; Martinić, I.; Bakarić, M.; Pentek, T.; Poršinsky, T.; Šporčić, M. Current State and Improvement Potential of Forestry Workers Training in Croatia. Croat. J. For. Eng. 2018, 39, 51–60. [Google Scholar]
  8. Paluš, H.; Parobek, J. Changing patterns of roundwood deliveries in Slovakia. Markets for Wood and Wooden Products. In Markets for Wood and Wooden Products; Jelačić, D., Ed.; WoodEMA: Vinkovci, Croatia, 2013; pp. 77–91. [Google Scholar]
  9. Paladinić, E.; Štimac, D.; Marjanović, H.; Balenović, I.; Ostrogović, M.Z. Production Aspect of Silver Fir (Abies alba Mill.) Dieback on Example of a Few Beech-Fir Stands. Šumarski List 2011, 135, 248–263. [Google Scholar]
  10. EEA. Climate change, impacts and vulnerability in Europe 2012—An indicator-based report. In EEA Report No 12/2012; European Environment Agency: Copenhagen, Denmark, 2012; pp. 1–300. [Google Scholar]
  11. Prka, M.; Krpan, A.P. The Problem of Establishing the Assortment Structure of Even-Aged Beech Stands. Šumarski List 2007, 131, 219–235. [Google Scholar]
  12. Bumber, Z. Application of GIS in Analyzing Forest Openness of MU Šiljakovačka dubrava II through Removal Structure over Space and Time. Master’s Thesis, Forestry Faculty of Zagreb University, Zagreb, Croatia, 2011. [Google Scholar]
  13. Mederski, P.S.; Borz, S.A.; Đuka, A.; Lazdiņš, A. Challenges in Forestry and Forest Engineering—Case Studies from Four Countries in East Europe. Croat. J. For. Eng. 2021, 42. In Press. [Google Scholar]
  14. Čavlović, J.; Teslak, K.; Beljan, K. The Effects of Different Stand Regeneration Planning on Management and Pedunculate Oak Forest Development—A Small Size Management Class Case Study. Šumarski List 2014, 138, 123–134. [Google Scholar]
  15. Pentek, T. The Computer Models for Forest Roads Network Optimization with Regard to the Dominant Influential Factors. Ph.D. Thesis, Forestry Faculty of Zagreb University, Zagreb, Croatia, 2002. [Google Scholar]
  16. Bylaw on Measure Implementation M04 “Investments in Physical Assets”, By-Measure 4.3 “Grant for Investments in Development, Modernization and Customization of Agriculture and Forestry”, Operation Type 4.3.3 “Investments in Forest Infrastructure” from the Program of Rural Development in Republic of Croatia in Period from 2014 to 2020 (OG 106/15, 65/17, 77/17). Available online: https://narodne-novine.nn.hr/ (accessed on 15 November 2020).
  17. Ciancio, O.; Corona, P.; Iovino, F.; Menguzzato, G.; Scotti, R. Forest Management on a Natural Basis. J. Sustain. For. 1999, 9, 59–72. [Google Scholar] [CrossRef]
  18. Suzuki, Y.; Yoshimura, T. Assessment of Broad-Leaved Forest Stand Management: Stock Densities, Thinning Costs and Profits over a 60-Year Rotation Period. Croat. J. For. Eng. 2019, 40, 365–375. [Google Scholar] [CrossRef]
  19. Bruhn, J.N.; Wetteroff, J.J.; Mihail, J.D.; Kabrick, J.M.; Pickens, J.B. Distribution of Armillaria species in upland Ozark Mountain forests with respect to site, overstory species composition and oak decline. For. Pathol. 2000, 30, 43–60. [Google Scholar] [CrossRef]
  20. Picchio, R.; Tavankar, F.; Venanzi, R.; Monaco, A.L.; Nikooy, M. Study of Forest Road Effect on Tree Community and Stand Structure in Three Italian and Iranian Temperate Forests. Croat. J. For. Eng. 2018, 39, 57–70. [Google Scholar]
  21. Pellegrini, M.; Grigolato, S.; Cavalli, R. Spatial MultiCriteria Decision Process to Define Maintenance Priorities of Forest Road Network: An Application in the Italian Alpine Region. Croat. J. For. Eng. 2013, 34, 31–42. [Google Scholar]
  22. Grigolato, S.; Pellegrini, M.; Cavalli, R. Temporal analysis of the traffic loads on forest road networks. iForest Biogeosci. For. 2013, 6, 255–261. [Google Scholar] [CrossRef] [Green Version]
  23. Duka, A.; Grigolato, S.; Papa, I.; Pentek, T.; Poršinsky, T. Assessment of timber extraction distance and skid road network in steep karst terrain. iForest Biogeosci. For. 2017, 10, 886. [Google Scholar] [CrossRef] [Green Version]
  24. Hayati, E.; Majnounian, B.; Abdi, E. Qualitative evaluation and optimization of forest road network to minimize total costs and environmental impacts. iForest Biogeosci. For. 2017, 5, 121–125. [Google Scholar] [CrossRef] [Green Version]
  25. Picchio, R.; Pignatti, G.; Marchi, E.; Latterini, F.; Benanchi, M.; Foderi, C.; Venanzi, R.; Verani, S. The application of two approaches using GIS technology implementation in forest road network planning in an Italian mountain setting. Forests 2018, 9, 277. [Google Scholar] [CrossRef] [Green Version]
  26. Picchio, R.; Latterini, F.; Mederski, P.S.; Tocci, D.; Venanzi, R.; Stefanoni, W.; Pari, L. Applications of GIS-Based Software to Improve the Sustainability of a Forwarding Operation in Central Italy. Sustainability 2020, 12, 5716. [Google Scholar] [CrossRef]
  27. Mikac, S.; Žmegač, A.; Trlin, D.; Paulić, V.; Oršanić, M.; Anić, I. Drought-induced shift in tree response to climate in floodplain forests of Southeastern Europe. Sci. Rep. 2018, 8, 16495. [Google Scholar] [CrossRef]
  28. Skiadaresis, G.; Schwarz, J.A.; Bauhus, J. Groundwater Extraction in Floodplain Forests Reduces Radial Growth and Increases Summer Drought Sensitivity of Pedunculate Oak Trees (Quercus robur L.). Front. For. Glob. Chang. 2019, 2, 5. [Google Scholar] [CrossRef] [Green Version]
  29. Đuka, A.; Poršinsky, T.; Pentek, T.; Pandur, Z.; Vusić, D.; Papa, I. Mobility Range of a Cable Skidder for Timber Extraction on Sloped Terrain. Forests 2018, 9, 526. [Google Scholar] [CrossRef] [Green Version]
  30. Marchi, E.; Chung, W.; Visser, R.; Abbas, D.; Nordfjell, T.; Mederski, P.S.; McEwan, A.; Brink, M.; Laschi, A. Sustainable Forest Operations (SFO): A new paradigm in a changing world and climate. Sci. Total Environ. 2018, 634, 1385–1397. [Google Scholar] [CrossRef] [PubMed] [Green Version]
Figure 1. Felled timber in the main felling operations in the seven-year period: volume and area.
Forests 12 00007 g001
Figure 2. Felled timber in the intermediate felling operations in the seven-year period: volume and area.
Forests 12 00007 g002
Figure 3. Shape of the forest road network in the researched MU and harvesting system in use.
Forests 12 00007 g003
Figure 4. Comparison of average forwarding distances.
Forests 12 00007 g004
Figure 5. Average theoretical and geometrical forwarding distances and road network factors.
Forests 12 00007 g005
Figure 6. The analysis of average geometrical forwarding distances and weighted arithmetic mean in the seven-year period.
Forests 12 00007 g006
Figure 7. Various average forwarding distances.
Forests 12 00007 g007
Figure 8. Forest accessibility factors.
Forests 12 00007 g008
Table 1. Statistical analysis of forest accessibility factors.
SampleSumMeanVariance
200434.3952631.4650880.005414
200533.6152631.2050880.041983
200634.4185681.4728560.00711
200734.5244531.5081510.008854
200834.3844531.4614840.001028
200934.6926361.5642120.085884
201034.2915771.4305260.001232
Road network factor710.002211.4288870.000117
Cutblock position factor710.071.4385710.018748
Removal position factor710.251.4642860.069562
ANOVA
SourceSum of SquaresDegree of FreedomMean SquareFPF crit
Line0.2322360.0387051.5568720.2417742.99612
Column0.00468520.0023430.0942340.9107373.885294
Error0.298328120.024861
Total0.53524420
Table 2. Relative forest openness (ha).
Opened AreaUnopened Forest
Area (ha)
Total Forest
Area (ha)
Relative Openness (%)
YearInside MU
Single OpenedMultiple Opened
20041828.011744.30666.174238.4884.28
20061859.211745.56633.714238.4885.05
20081849.241755.53633.714238.4885.05
20091837.211745.42632.184214.8185.00
20101814.661811.58584.074210.3186.13
Publisher’s Note: MDPI stays neutral with regard to jurisdictional claims in published maps and institutional affiliations.

