Article

Ownership Patterns Drive Multi-Scale Forest Structure Patterns across a Forested Region in Southern Coastal Oregon, USA

1
School of Environmental and Forest Sciences, University of Washington, Seattle, WA 98195, USA
2
The Nature Conservancy, Portland, OR 97374, USA
*
Author to whom correspondence should be addressed.
Forests 2021, 12(1), 47; https://doi.org/10.3390/f12010047
Submission received: 15 November 2020 / Revised: 22 December 2020 / Accepted: 23 December 2020 / Published: 31 December 2020
(This article belongs to the Special Issue Forest Structure and Sustainable Resource Management)

Abstract

:
Research Highlights: We used airborne lidar to assess the multi-scalar patterns of forest structure across a large (471,000 hectare), multi-owner landscape of the Oregon Coast Range, USA. The results of this study can be used in the development and evaluation of conservation strategies focused on forest management. Background and Objectives: Human management practices reflect policy and economic decisions and shape forest structure through direct management and modification of disturbance regimes. Previous studies have found that land ownership affects forest cover, patch dynamics, structure, and ecosystem function and services. However, prior assessments of forest structure across landscapes and ownerships have been limited by a lack of high-fidelity forest structure measurements across a large spatial extent. We addressed three research questions: (1) What distinct classes of forest structure exist across our study area? (2) How does the distribution and pattern of forest structure vary among types of owners at scales of patches, ownership types, and subregion, and is this independent of property size? and (3) What implications do the fine and sub-regional scale patterns have for landscape configuration goals under recent updates to the Northwest Forest Plan? Materials and Methods: We examined forest structure patterns by identifying six statistically distinct classes of forest structure and then examining their distribution across and within ownership types. We used these structure classes to examine their area within each ownership class, mean patch size, and intermixing at multiple scales. Results and Conclusion: We found that the six different forest structure classes in the study area can be interpreted as two assemblages: production-style forests, principally on private lands, and structurally complex forests, principally on public lands. We found that land ownership objectives resulted in distinct landscape patterns of forest structure as measured by mean structure class patch size and intermixing of different structure class patches. Finally, we found that forest structure differed between public and private lands but differed comparatively little among ownership types within those two broad categories.

1. Introduction

Globally, the physical structure of forests results from their environmental setting, history of disturbances, and human management practices [1,2,3,4,5,6]. Forest structure—the horizontal and vertical arrangement of biomass [7]—affects the ecosystem services and functions that forests provide, such as net primary productivity; the accumulation, distribution, and melting of snowfall; water quality and quantity, and microclimate; as well as providing important resources to forest-dependent communities [8,9,10,11]. Forest structure also controls the amount and configuration of carbon stored in a tree and forest [12]. Forest structure also plays a critical role in habitat quality across functional groups, in terms of food availability as well as protection from predation and the elements [13,14]. Perhaps most importantly, forest structure is quantifiable and can be manipulated, allowing it to be the focus of forest policy and management actions [12].
Human management impacts the types and patterns of forest structure through direct management (e.g., harvest), modification of disturbance regimes (e.g., wildfire suppression), and increasingly, climate change [15,16,17,18,19,20]. In many societies, management goals and practices are organized by different classes of owners [21]. Owner objectives vary and can include financial investment [22], sustainable community resources [23], wildlife conservation [24], lifestyle enhancement [25], land investment [26], and more. The management practices that support these objectives vary by silvicultural treatment type and intensity, rotation time, management of fire, and through other practices. Objectives and practices can be constrained and/or dictated by social goals, policy, and market forces [27]. The resulting combination of landowner objectives, management practices, and the constraints placed upon them creates a spatial pattern of forest structure dependent on anthropogenic decision-making and actions.
The effects of forest ownership on forest conditions have received attention in recent years, in part due to emerging new forest owner types, ownership fragmentation, and questions related to sustainable yield of forest products [28]. The effects of forest ownership on ecological patterns have been explored using multiple approaches. For example, forest management, land cover, and land use are all critical components of ownership and have been used as lenses to examine ownership effects on forest cover, patch dynamics, structure, and ecosystem function and services [29,30,31,32,33,34,35,36,37,38,39,40,41,42,43]. This body of work concluded that forest structure, function, and services differ between private and public (e.g., federal and state) ownerships at broad scales regionally, nationally, and internationally. This is typically because public lands have less intense land use regimes as compared to production focused private lands [44] (although this is not always the case; see [45,46]) and were found to host more biodiversity [45].
In the western U.S., private landowner objectives and management reflect owners’ individual goals, market forces, and reflect forest management policies implemented at the state and local levels. On federal lands (public), objectives and management often reflect policies set at the national and regional levels, though these are also influenced by other factors such as social license from stakeholders and economic market forces. Furthermore, different ownership classes have different typical property sizes, so forest structure could result as a function of property size independent of property types. In tandem, these forces can result in a difference of forest processes and ecosystem services and their segmentation across the region. For example, research conducted in western Oregon on the effects of multi-ownership mosaics on forest structure and ecosystem services [32,34,47,48,49,50,51] has added two key findings. First, structurally simplified younger and structurally more complex older forest are segregated based on private versus public lands [52]. Second, landscape conditions across ownership boundaries diverge over time due to varying intensities of land use regimes and due to the aforementioned segregation of age classes [53].
The forests of southwest coastal region of Oregon, USA, present an opportunity to further elucidate the relationship between forest structure, ownership, and policy. In this region, the Northwest Forest Plan (NWFP) is a series of federal policies begun in 1994 that, while focused on federally owned land, sets conservation goals that generally can be related to the retention or development of specific forest structures [54]. Forest structure in this region can be clearly connected to ecological and conservation goals due to regional conservation policy’s (the Northwest Forest Plan) focus on forest structure as a metric [55]. In addition, ownership can act as a proxy for management and landowner objectives because there has been little turnover between ownership types for several decades, so management practices at a given location generally have not changed substantially due to changes in land ownership [51]. Therefore, the availability of spatially explicit ownership data as a proxy for management and landowner objectives affords the opportunity to relate conservation goals to management and landowner objectives.
A key limitation of most previous studies of ownerships and their effects on forests was the low fidelity of their data for forest structure (but see [56]). Most of these previous studies relied upon modeling or passive optical remote sensing that do not capture forest structure adequately at fine scales. Many of these previous studies’ forest classes were broad and, while associated with ranges of actual forest structure, were not based on actual measurements of forest structure (e.g., [29,30,31,32,35,37,38,41]).
In this study, we leveraged a combination of datasets in a forested region along the coast of southern Oregon, USA: spatially explicit ownership data as a proxy for landowner objectives and management; high fidelity measurements of fine-scale forest structure; and forest structure directly linked to conservation values through regional conservation policy [54] (the Northwest Forest Plan [NWFP]). We expand upon prior research in this region by using a 471,000-hectare airborne lidar acquisition and landscape metrics to quantify the landscape pattern of forest structure within ownerships at multiple scales (forest patches, ownership type, and subregion). To better understand the impact of ownership patterns, objectives, and management practices on patterns of forest structure across this region, we addressed these questions:
  • What distinct classes of forest structure exist across our study area?
  • How does the distribution and pattern of forest structure vary among types of owners at scales of patches, ownership types, and subregion, and is this independent of property size?
  • What implications do the fine and sub-regional scale patterns have for landscape configuration goals under recent updates to the Northwest Forest Plan?

2. Materials and Methods

2.1. Study Area

The study area is a 471,116-hectare region in south-central Coast Range of Oregon, USA, defined by the boundaries of a 2008–2009 lidar acquisition. The forests of the Oregon Coast Range are some of the most productive in the world [57] and as a result are both economically and ecologically important. The forests are dominated by Douglas-fir (Pseudotsuga menziesii), Sitka Spruce (Picea stichensis), and Western Hemlock (Tsuga heterophylla) [58]. The climate is mesic temperate, receives approximately 1780–2500 mm of precipitation per year, and has a mean annual temperature of 11.4 Celsius [58]. Elevations range from sea level to 600 m.
This region has a high-severity, infrequent fire regime, with a mean fire return interval of approximately 200 years [59]. The most recent large fires in this area occurred in 1902 and burned approximately 31% of the study area (Figure 1), although it was preceded by another large fire in 1868 [54,60] (burn perimeter unknown). Additionally, the Oxbow fire burned approximately 14,600 hectares of the northeastern portion of the study area (Figure 1) [61]. Other natural disturbance events, such as windthrow and pathogens, occur more frequently and at smaller scales [32,47].
Biophysical gradients have little influence on forest structure across the Oregon Coast Range, including our study area [34,50,62]. Disturbance, predominantly timber harvest, had a strong influence on forest structure across the landscape [34,50,62]. This relationship is likely due to the near-instantaneous structural changes that result from disturbance, compared to structural changes from the slow process of tree growth and densification driven by biophysical factors [50]. In exploratory modeling (not reported), we found that biophysical predictors such as precipitation, mean January temperature, and vapor pressure deficit, had low predictive power compared to land ownership. This result was expected; the study area has high precipitation much of the year (approx. 1800 mm; [63]), so typical drivers of topographic variation in forest structure that are precipitation-dependent, such as elevation, aspect, slope, and slope position, have limited influence. Additionally, the mean January temperature range (approx. 3–10 C; [63]) stays above freezing throughout the study area meaning that growth can continue throughout the year. For these reasons, we did not further consider biophysical factors in this study.

2.2. Identification of Ownerships

Spatially explicit forest ownership data were aggregated into broad ownership types by The Nature Conservancy (TNC) of Oregon. Input data were sourced from the 4th quarter 2017 CoreLogic ParcelPoint tax lot database, federal corporate datasets, and other datasets assembled by TNC. We are unable to share this dataset because of its proprietary nature. Before conducting statistical analyses, we excluded from analysis the properties for ownership classes that cumulatively had less than 10,000 hectares of land in our study area, which left 13 ownership types for analysis (Table 1). We excluded ownership classes with less than 10,000 hectares in our study area because they would represent less than 0.5% of the landscape. The ownership types that had less than 10,000 hectares of land in our study area were Non-Profit, Tribal, Local Government, National Park Service, and U.S. Forest Service Oregon and California Railroad lands (O&C). U.S. Forest Service O&C lands differ from Bureau of Land Management O&C lands, which were included in this study.
Complicated histories of land tenure dominate the American west, including our study area. First, private and public ownership is often divided by elevation. This bifurcation is the result of the federal government ceding more productive lands to private interests and retaining the land that was more difficult to utilize (because of its higher elevation and topographic complexity) in the early 1900s [64]. However, in our study area, there are instances of intentional public and private intermixing. These are the result of 19th century land grants to support the building of railroads in parts of the American west: here, the Oregon and California railroad lands (O&C) and Coos Bay Wagon Road railroad lands (CBWR). These land grants ceded every other square mile (259 ha) of federal land to railroad companies, resulting in a “checkerboard” pattern of public and private ownership [65].
Timber production typically is the primary goal on private lands and the dominant harvest method is clearcutting with replanting of commercially valuable tree species, commonly Douglas-fir. A little less than half of the forested area is privately owned and managed for timber harvest. While timber production is the primary goal, there is a wide decision space of other goals that can include land investment, estate for children, habitat protection, and more (Table 1). On public lands, the regional conservation plan, the Northwest Forest Plan (NWFP), is a series of federal policies begun in 1994 that governs forests, endangered species, and timber production on federal lands in the range of the northern spotted owl, which includes most forests west of the Cascade Crest in the Pacific Northwest [54]. This plan was enacted to meet the requirements of the Endangered Species Act as well as regulations resulting from the 1976 National Forest Management Act [55]. Despite certain allowances for timber harvest in the area governed by the NWFP (e.g., railroad and multiple-use lands), harvest has almost entirely stopped on federal lands since the early 1990s [66]. The one state property in our study area (Elliott State Forest) has been managed both for ecological values as well as timber production, in contrast to other Oregon State Forests which are typically managed for intense timber production [67]. Both public and private forests are important to local communities for their income and employment opportunities and are important regionally because they store a disproportionately high amount of carbon [57] and provide critical habitat for the endangered Northern Spotted Owl and Marbled Murrelet [54,68].
Table 1. Ownership types used in analysis. Landowner objectives are from [69] and Derek Churchill (Washington Department of Natural Resources; personal communication, 3 December 2019). Ownership types are grouped by the ownership groups identified through hierarchical classification (Section 2.5 and Section 3.2). Rotation length is the average number of years between harvests [70].
GroupOwnership TypeDescriptionSummary of Landowner ObjectivesRotation Length
Private non-industrialPrivate
Private Very Small
Private Small
Private Medium
20.23 hectares (<50 acres)
20.23–40.47 hectares (50–100 acres)
40.47–202.34 hectares (100–500 acres)
202.34–2023.43 hectares (500–5000 acres)
Harvest income; land investment; part of residence; estate for children35–70
Private- IndustrialTimber Investment Management Organization (TIMO)
Real Estate Investment Trust (REIT)
Integrated
Procure, manage, and sell timberland assets on behalf of institutions or investors
Own cash producing real estate and distribute rents to investors, in addition to other requirements they must fulfill
May own both timber land and milling infrastructure
Maximizing rate of return on investment; focus on net present value35–60
FamilyLarge forestland owners that are closely held or family ownedDiverse objectives, including but not limited to harvest income, wildlife habitat protection, land investment, and estate for children35–60
Mixed Objective GovernmentStateLand owned by the state of Oregon. In this area, only Elliott State ForestStand diversity and heterogeneity; sustainable-yield timber production80+
Bureau of Land ManagementLand managed by the Bureau of Land Management that was formerly not a part of railroad landsManaged under the Northwest Forest Plan. Maintenance of late-successional and old growth species habitat and ecosystems, and native biological diversity; sustainable yield timber production on a small amount of designated lands. 80+
NWFP Objective Government U.S. Forest Service
Bureau of Land Management O&C
Bureau of Land Management CBWR
Land managed by the U.S. Forest Service
Land managed by the BLM that is part of the former Oregon and California railroad land grant
Land managed by the BLM that is part of the former Coos Bay wagon road land grants
Managed under the Northwest Forest Plan. Maintenance of late-successional and old growth species habitat and ecosystems, and native biological diversity; sustainable-yield timber production on a small amount of designated lands. 80+

2.3. Airborne Lidar Data

The study area is a portion of the Oregon, USA, South Coast lidar acquisition, collected from predominantly in summer 2008, with small areas flown in October 2008 and April 2009, by Watershed Sciences, Inc. (now Quantum Spatial, Inc.) for the United States Bureau of Land Management. Our study omitted a portion of the acquisition (15% of the original acquisition) that is of a substantially different forest type (Oregon Coastal Tanoak) to eliminate the potential of confounding effects of different forest types. The study area covers portions of Coos, Curry, and Douglas counties. Data were acquired using a Leica ALS50 Phase II sensor at a nominal flight altitude of 900 m, with an average of 8.1 pulses/m2 and up to four returns per pulse recorded. We used the vendor-supplied, lidar-derived 1 m digital terrain model. We processed the lidar data using the USDA Forest Service’s Fusion software package [71].

2.4. Forest Structure Analysis and Classification

We measured forest structure using four metrics derived from the lidar data at a 30 m resolution: 95th percentile of return height ≥2 m (P95, a surrogate for dominant tree height), 25th percentile of return height ≥2 m (P25, a surrogate for height to live crown), rumple (canopy surface rugosity, a measure of canopy complexity), and canopy cover (percent of points above 2 m/all points). P95, P25, and canopy cover were calculated from all returns of the lidar data above 2 m while rumple was calculated from a 1 m resolution canopy surface model. Return heights were normalized to height above ground using the vendor-supplied ground models.
We focused on a small number of vegetation metrics that characterize vegetation height, cover, vertical distribution, and canopy roughness. We chose these metrics through a combination of Kolmogorov–Smirnov (K-S) tests, niche overlap tests (see [72] for use in ecology), and previous literature [73,74]. These metrics have been consistently found to predict many attributes of structure in Pacific Northwest conifer forests [73,75,76,77].
We identified forest structure classes, which use the combination of the four selected lidar metrics to rank forests by structural complexity. The classification process can identify forest structure stages from stand initiation to complex forests [75,78,79,80,81]. To remove correlation between lidar metrics, we centered and scaled our data and then performed a principal components analysis (PCA) [82]. To identify structure classes, we first performed principal component decomposition on the entire scaled and centered dataset. Then we sampled 30,000 random points across the study area and performed a hierarchical clustering using the Ward.D2 method [83] in R’s hclust function [84]. We then cut the resulting dendrogram into 6 classes to select the most parsimonious grouping of classes that retained the most original information using visual assessment of the scree plot [85]. Using the unique distribution of metric values in each class, we can assign a descriptive “structure” name associated with each class. We then imputed the structure classes across the entire landscape using a random forest model [86,87], using the PC axes as the explanatory variables and the derived structure classes as the response.
To aid in interpretation and analyses dependent on the structure classes, we used stand age estimates from the LEMMA GNN project (Landscape Ecology Modeling, Mapping and Analysis Gradient Nearest Neighbor project) post-hoc as an interpretive aid for the structure classes [88]. These data are derived from 2012 Landsat Thematic Mapper data and field plot data and are believed to be generally accurate at the scale of a small watershed [88]. Although there is a mismatch in fidelity between our lidar metrics and GNN estimated stand ages, because GNN is Landsat derived, GNN data have been used with lidar before [89,90,91,92].

2.5. Quantifying Landscape Pattern and Effect of Ownership

To quantify landscape pattern of forest structure, we chose three landscape metrics, calculated in the R package landscapemetrics [93]: percent area of each structure class, area-weighted mean patch size (mean patch size), and interspersion and juxtaposition index (IJI; structural heterogeneity). We chose these metrics because they represent different aspects of structural pattern that a manager might manage for (abundance, patch size, and patch interspersion), particularly in light of patch size and interspersion as ecological goals in a 2018 synthesis of NWFP ecological goals [54]. These three metrics were calculated on the six forest structure classes within the thirteen ownership types.
We chose to calculate area-weighted mean patch size (Equation (1)) instead of arithmetic mean patch size because a weighted mean places more importance on larger patches [94]. This is ecologically relevant because this metric represents, for example, the probability an individual organism would randomly occur in a patch of a given structure class [95].
A M =   n = 1 m j = 1 n [ x i j ( a i j i = 1 m j = 1 n a i j ) ]
Equation (1): Area-weighted mean patch size, where m is number of classes present in the landscape and aij and xij are equal to the area of patch ij [94].
IJI (Equation (2)) is a unitless index that measures the distribution in terms of interspersion and juxtaposition of patch types across a landscape [95]. IJI measures patch adjacencies and therefore the intermixing of patch types. We use IJI as a measure of structural heterogeneity across ownership types, where IJI is computed within ownership types across structure classes. Lower index values are more homogeneous (less complex interspersion), and higher index values are more heterogeneous (more complex interspersion).
IJI = i = 1 m k = i + 1 m [ ( e i k E ) ln ( e i k E ) ] ln ( 0.5 [ m ( m 1 ) ] ) ( 100 )
Equation (2): Interspersion and Juxtaposition Index (IJI), where m is number of classes present in the landscape, eik is equal to total length of edge between classes i and k, and E is equal to the total length of edge in landscape [94].
We conducted a hierarchical clustering analysis using percent area of each forest structure class in an ownership to determine groups of ownerships that had similar structural composition. We then used principal component analysis (PCA) and its resulting ordination to visualize the relationship between ownership types, their groups, and forest structure classes.
Metrics of landscape configuration can be tightly constrained by landscape extent and the proportion occupied by each class of interest [95,96]. For example, it is more likely that a private industrial owner would have larger property size than a private non-industrial owner. In this study, this means that property size and structure class proportion can constrain values of mean patch size and IJI. This requires us to separate the effects of property size, structure class proportion, and ownership types upon forest structure. To accomplish this, we separated these three variables into independent predictor terms in twelve linear regressions, where mean patch size or IJI for each structure class was the response variable (1 model per mean patch size and IJI multiplied by 6 structure classes equals 12 models). We used a simple linear regression formula, ~ x + a + b + c , where y   is either mean patch size or IJI. We used the thirteen ownership types as the predictor, categorical variable of interest,   a . To control for the effects of property size and structure class proportion on the response variable, we included numeric terms for property size, b , and proportion of structure class, c , in the modeled structure class of interest. All statistical analyses were performed in the R statistical package [84].
Our modeling tested whether values of mean patch size and IJI varied as a function of ownership type while accounting for property size and proportion of structure class area. When we state that values for mean patch size and IJI are higher or lower than expected, we mean that higher or lower than expected given the property size and structure class proportion. Similarly, a significant effect on mean patch size and structural heterogeneity means that the term in the model (ownership type, property size, or structure class proportion) influenced the response variable with a confidence of p < 0.05. p- and r2 values of the entire models themselves are not relevant to this analysis since we are interested in the relative influence of each predictor variable.

3. Results

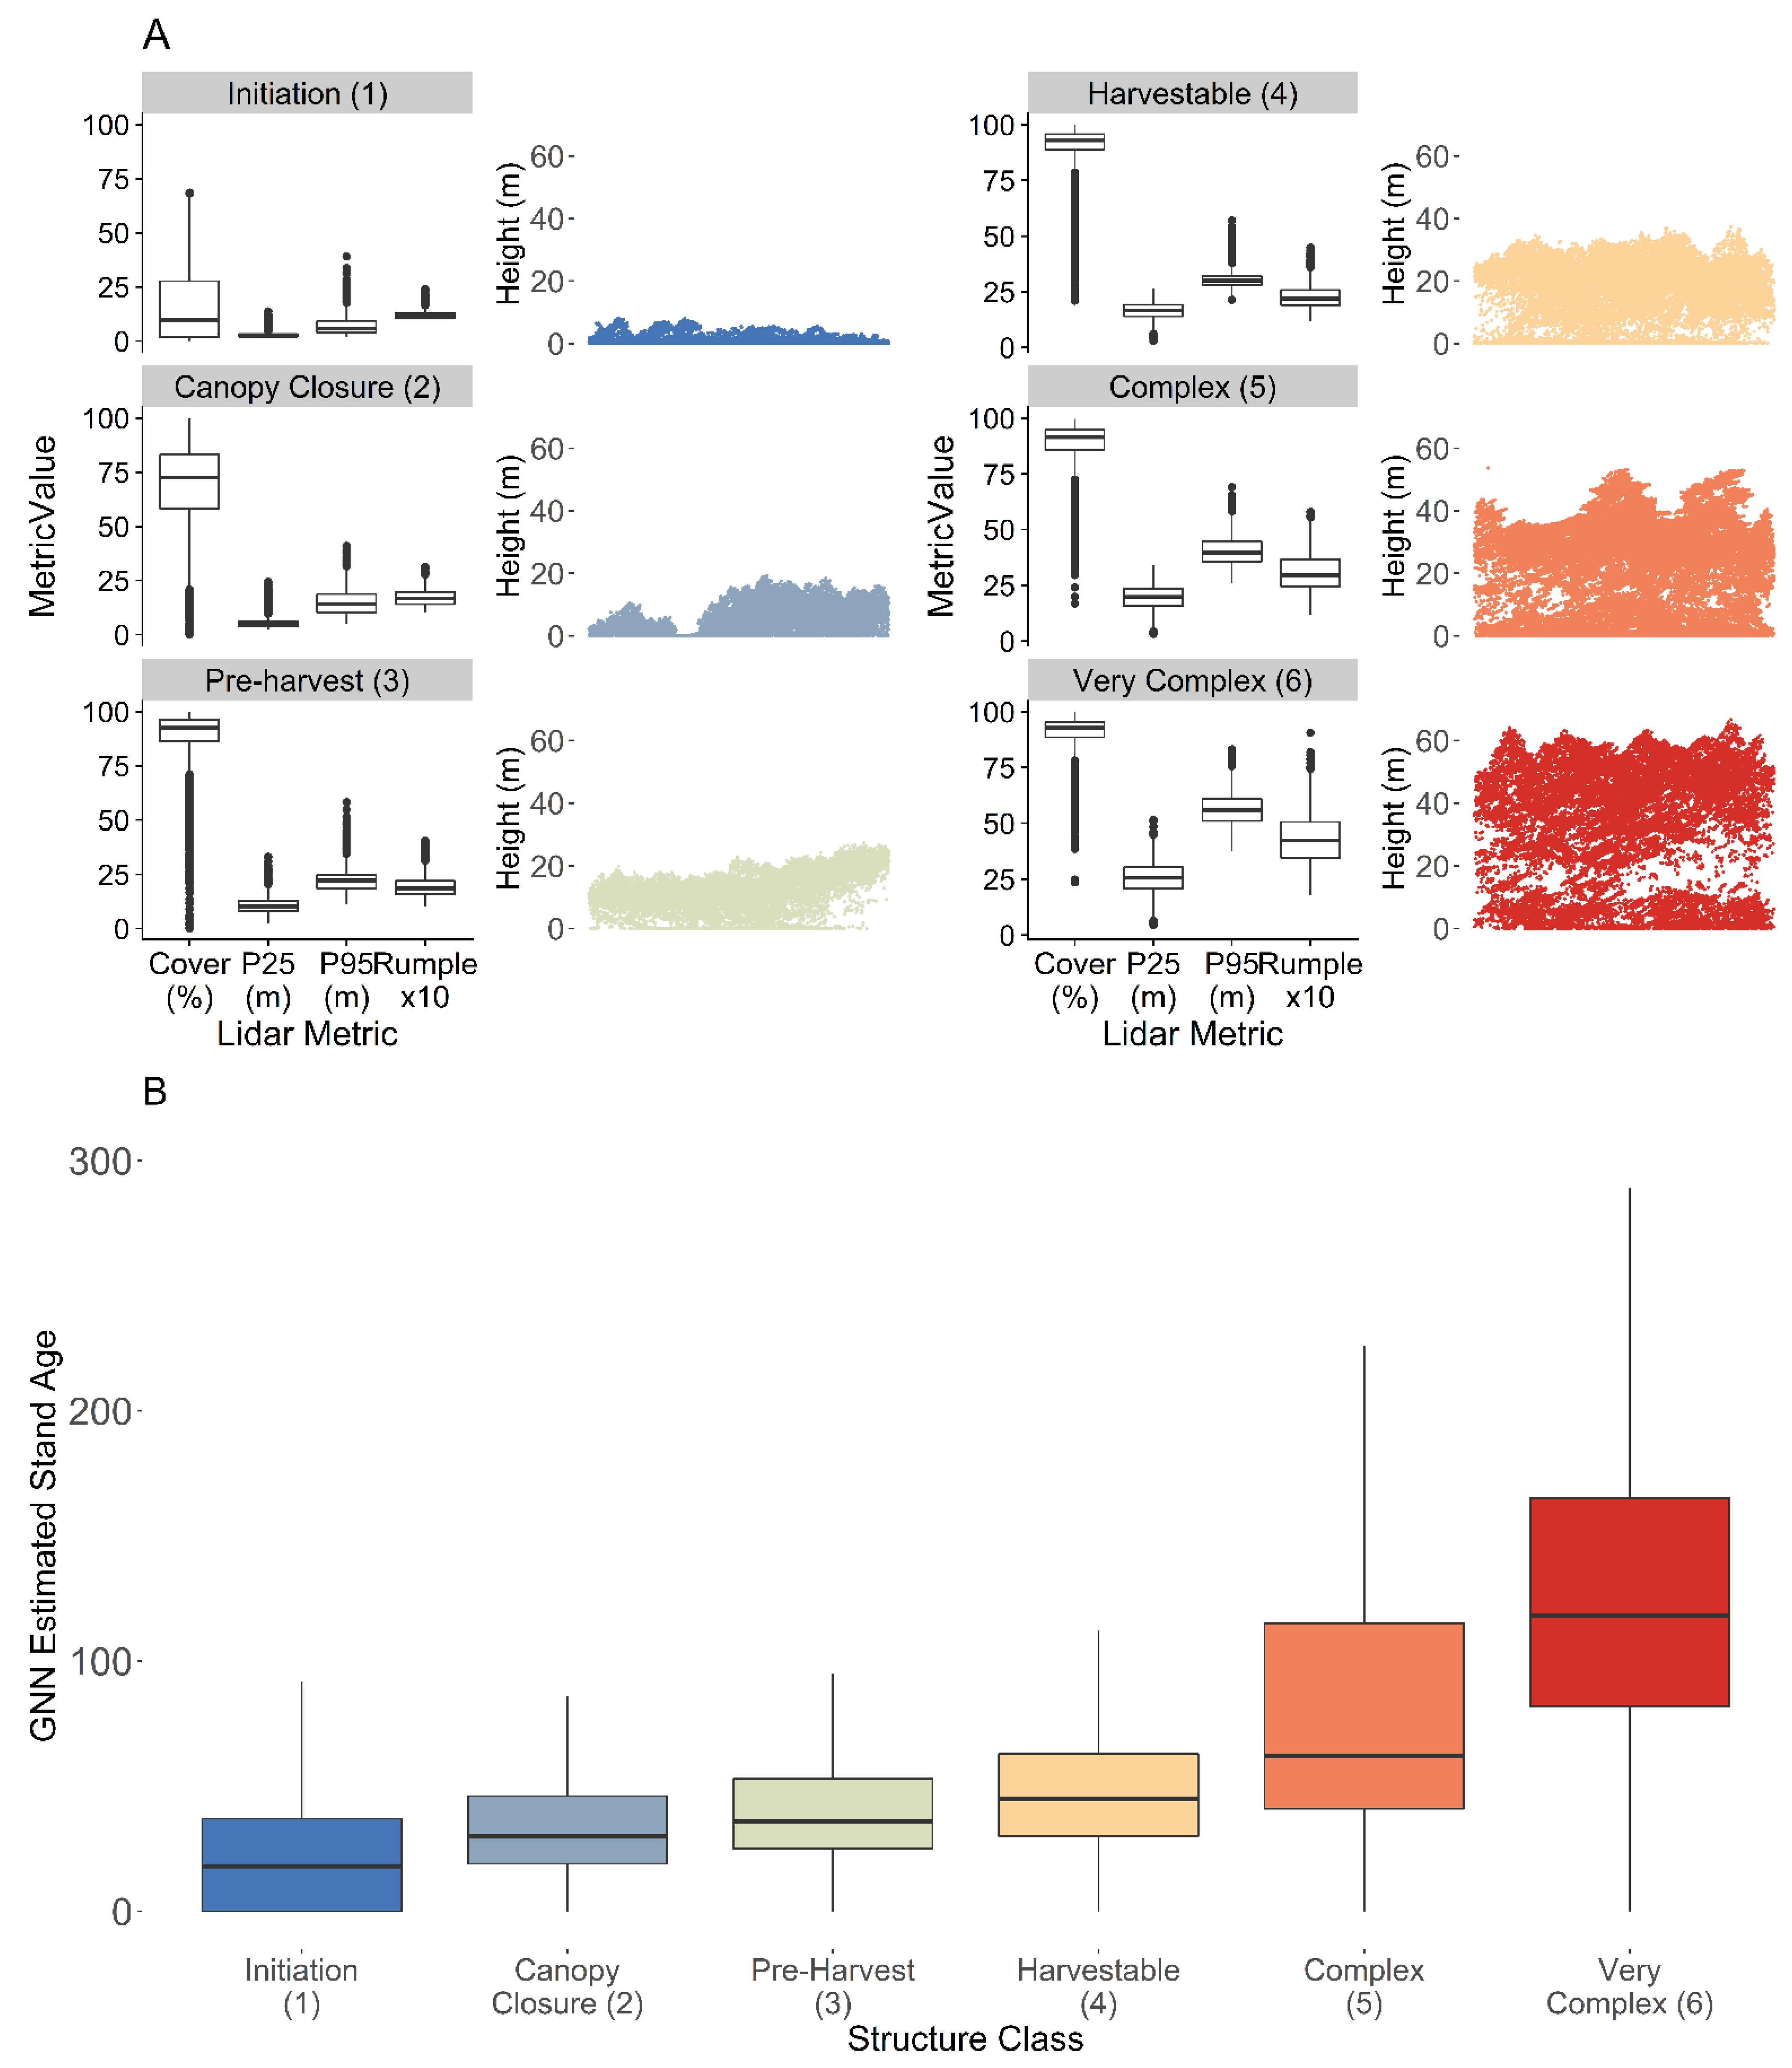
3.1. Forest Structure Classes

We identified six classes of forest structure from the classification method (Figure 2) that span a conceptual spectrum from structurally simple to structurally complex. Median values and interquartile ranges for three of the four input lidar metrics—P95, P25, and rumple—increased approximately linearly from the structurally simple to structurally complex classes, while canopy cover reached its maximum in the Pre-Harvest structure class (3). Based on the PCA values used in the classification, dominant tree height (P95) and height to live crown (P25) were most correlated with PCA axis 1, which drove 71.65% of the variation in the classification, while rumple and canopy cover were most correlated with PCA axis 2, which drove 17.15% of the variation in the classification.
We assigned names to the forest structure classes based on their structural similarities to a priori forest developmental stages. For forest structure classes 1 through 4, names were based on probabilistic stand development stages because these classes exhibit structural development expected in managed plantations [97]. The Initiation and Canopy Closure forest structure classes (1 and 2) grouped closely together in the PCA (Figure 3); the main difference between these two classes is the fourfold increase in canopy cover between them, hence the name Canopy Closure for class 2. The other four classes are all post-canopy closure and all exhibit increasing dominant tree height (P95), structural complexity (rumple), and height to live crown (P25). Using Landsat-derived maps of stand clearing disturbances [98], we examined stand clearing disturbances in the years before and after the lidar data were collected. From this, we determined that harvest typically occurs in the Harvestable class (4), hence the names Harvestable and for class 3, Pre-Harvest. For forest structure Classes 5 and 6, names were based on ranges of structural complexity that arise from structural development post-natural regeneration [12].
GNN stand age estimates [88] also corroborated these names, as they align with known rotation times of this area (Figure 2). Initiation through Harvestable classes (1–4) had an estimated mean age of ≤41 years while the Complex and Very Complex classes had an estimated mean age of 104 years. The Complex and Very Complex classes also had the highest ranges of values of the Northern Spotted Owl habitat suitability index [68].
The Pre-Harvest class was closer to the Initiation and Canopy Closure classes on the PCA ordination while the Harvestable class was closer to the Complex class (Class 5). However, both were distinct from the other classes and each other in the PCA. The Complex and Very Complex classes (Classes 5 and 6) also grouped together in the PCA on the opposite side of the ordination from the other structure classes.

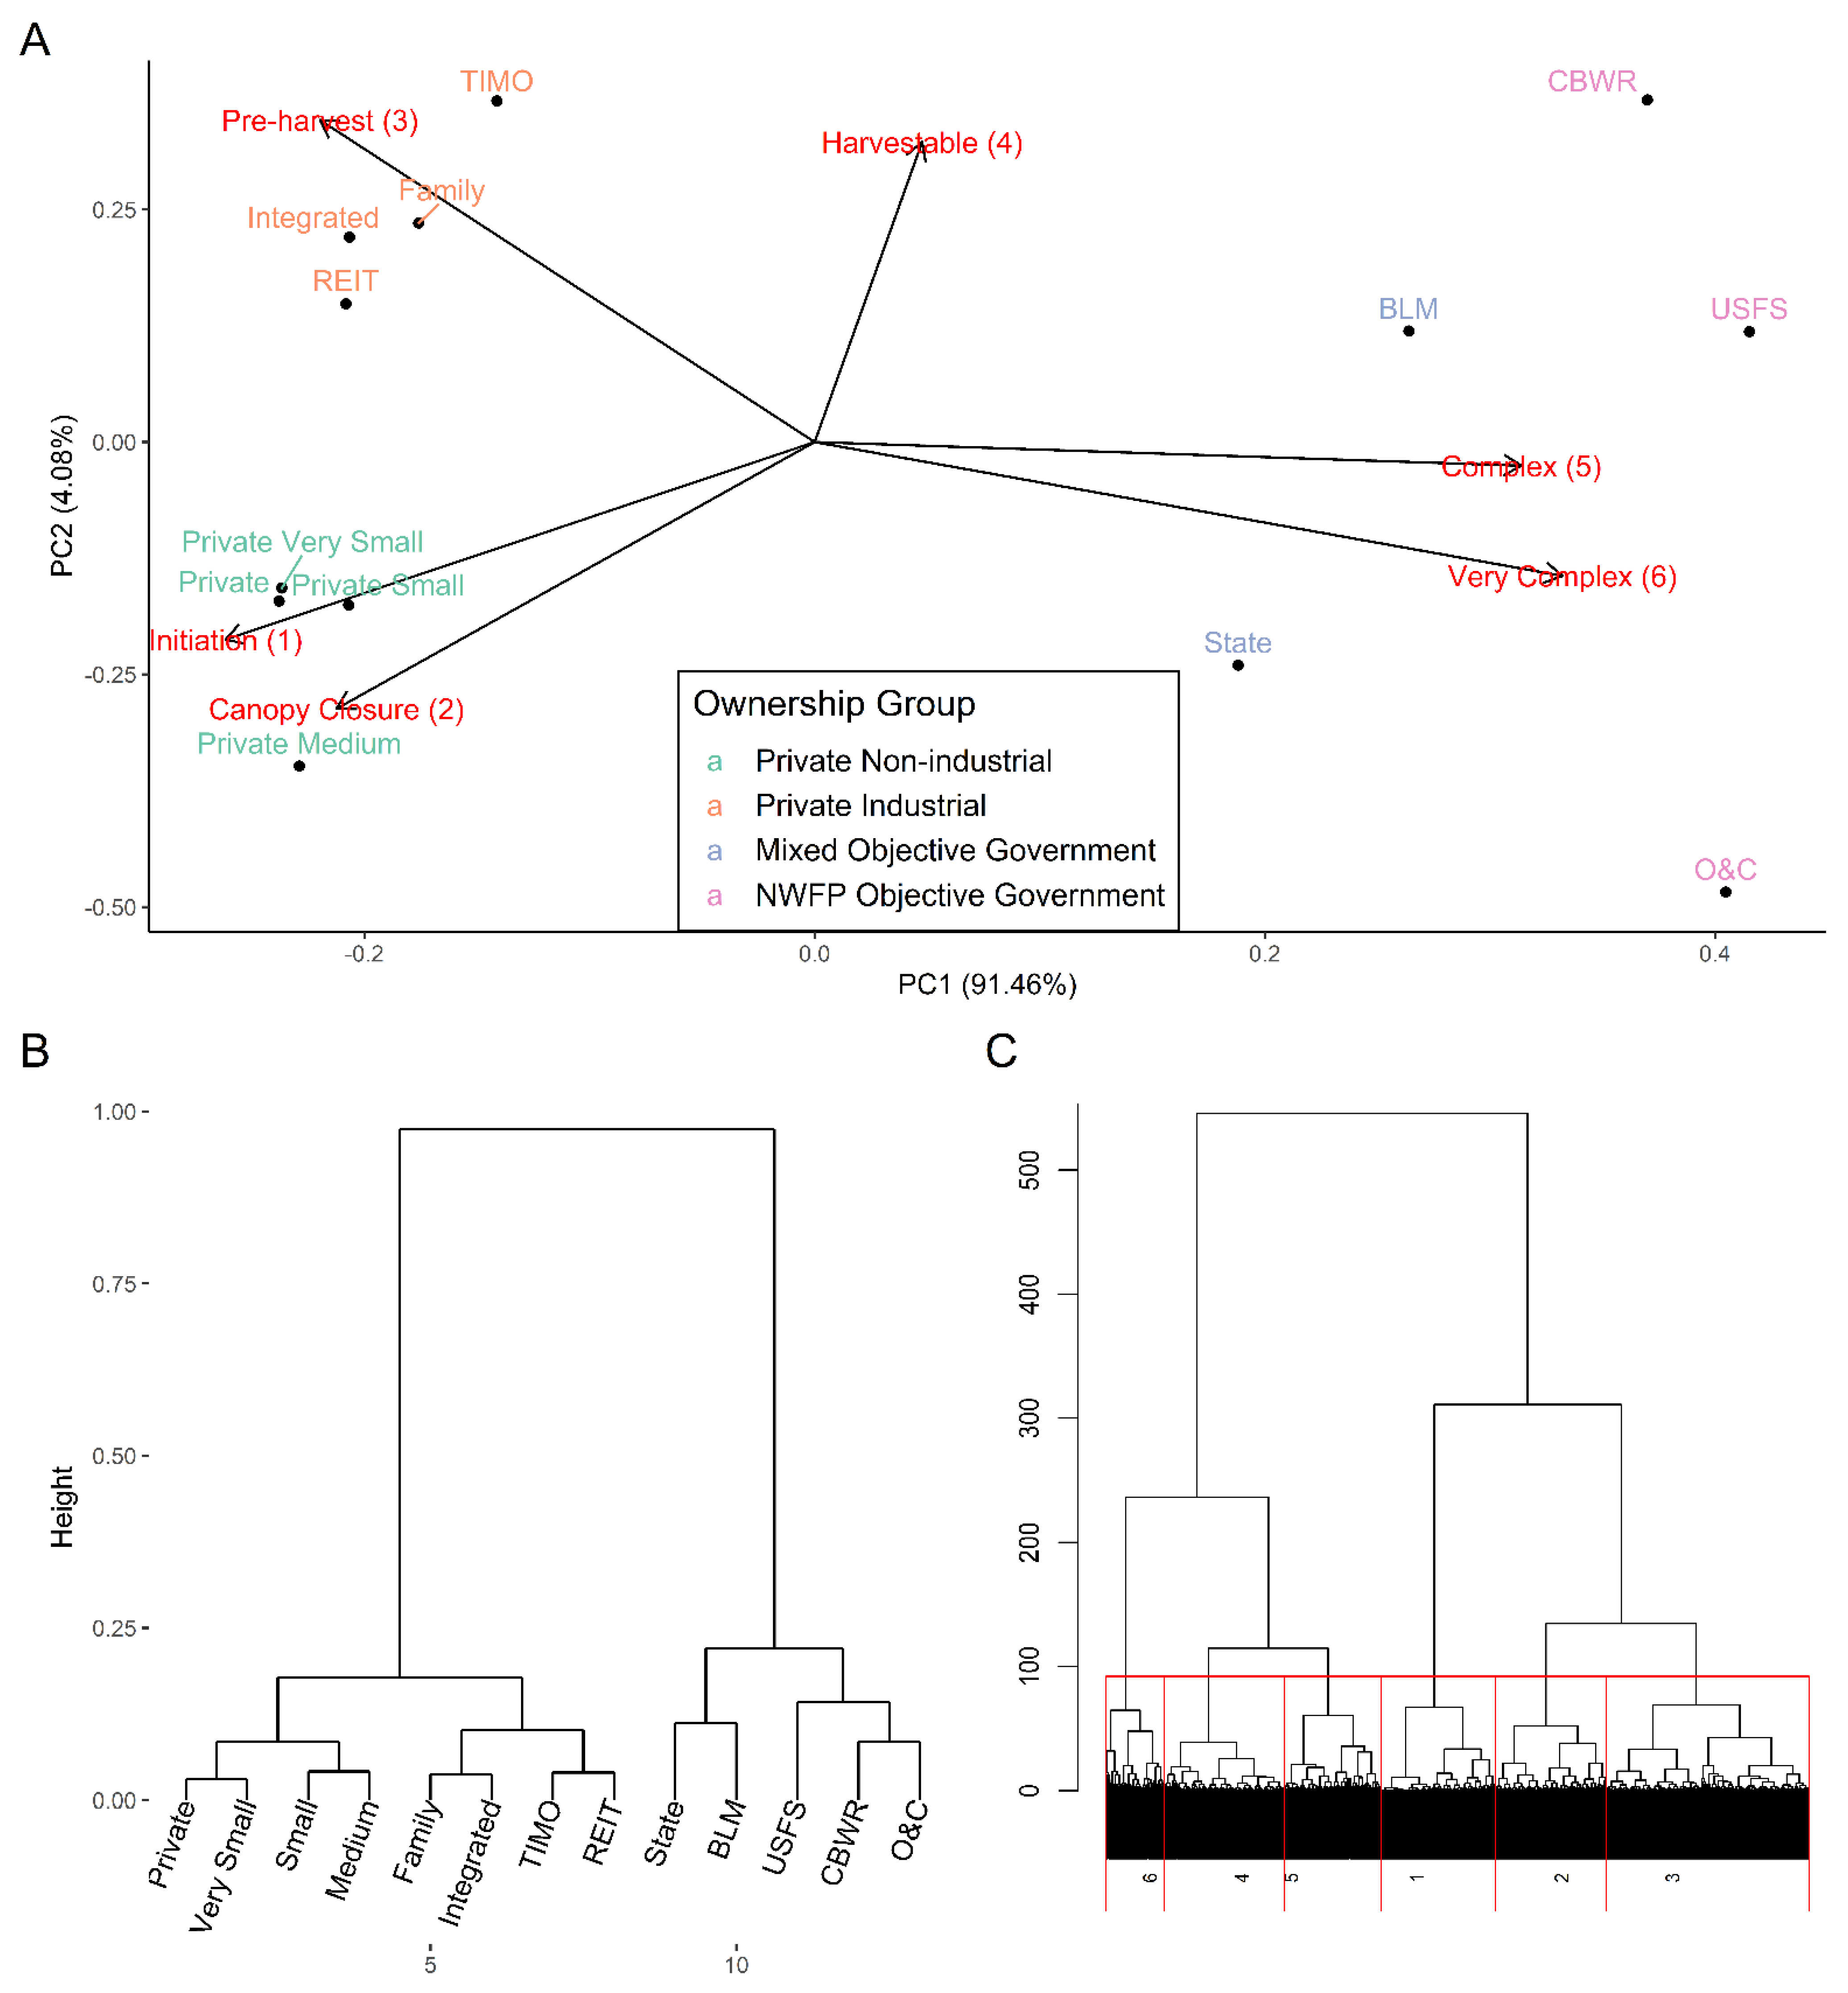
3.2. Ownership Clustering Created Four Structurally Similar Groups of Ownerships

The hierarchical classification, based on the percentage of area in each structure class, of the 13 ownership types resulted in four groups of ownerships: two private and two public. The private non-industrial group consisted of properties classified as Private, Very Small, Small, and Medium and was distinguished by a larger proportion of area in the Stand Initiation (Class 1) and Canopy Closure (Class 2) structure classes (Figure 4). The private industrial group consisted of properties classified as Family, TIMO, REIT, and Integrated and was distinguished by proportionally more area in the Pre-Harvest (Class 3) and Harvestable structure classes (Class 4) (Figure 4). The two private groups differed from all public ownership types due to the small proportion of their properties in the Complex and Very Complex (Classes 5 and 6) structure classes.
Among the public ownership types, the mixed objective government group consisted of Bureau of Land Management and Oregon State properties and was distinguished from other public ownership types because it has a higher proportion of Initiation, Canopy Closure, Pre-Harvest, and Harvestable classes (Classes 1 through 4). The NWFP objective government group consisted of the remaining other public ownership types, USFS, O&C, and CBWR, and had a higher proportion of Complex and Very Complex classes (5–6) than the mixed objective group (Figure 4).
We interpret PC axis 1 as a spectrum of structural complexity which represents the dominant split (91.46% of variance) between ownership types, based on the relative amounts Stand Initiation through Harvestable (Classes 1 through 4) and Complex and Very Complex (Classes 5 and 6) structure classes (Figure 3). The second axis (4.08% of variance) separates ownerships based on their differences in the proportion of Stand Initiation through Harvestable structure classes (Classes 1 through 4) (Figure 3).

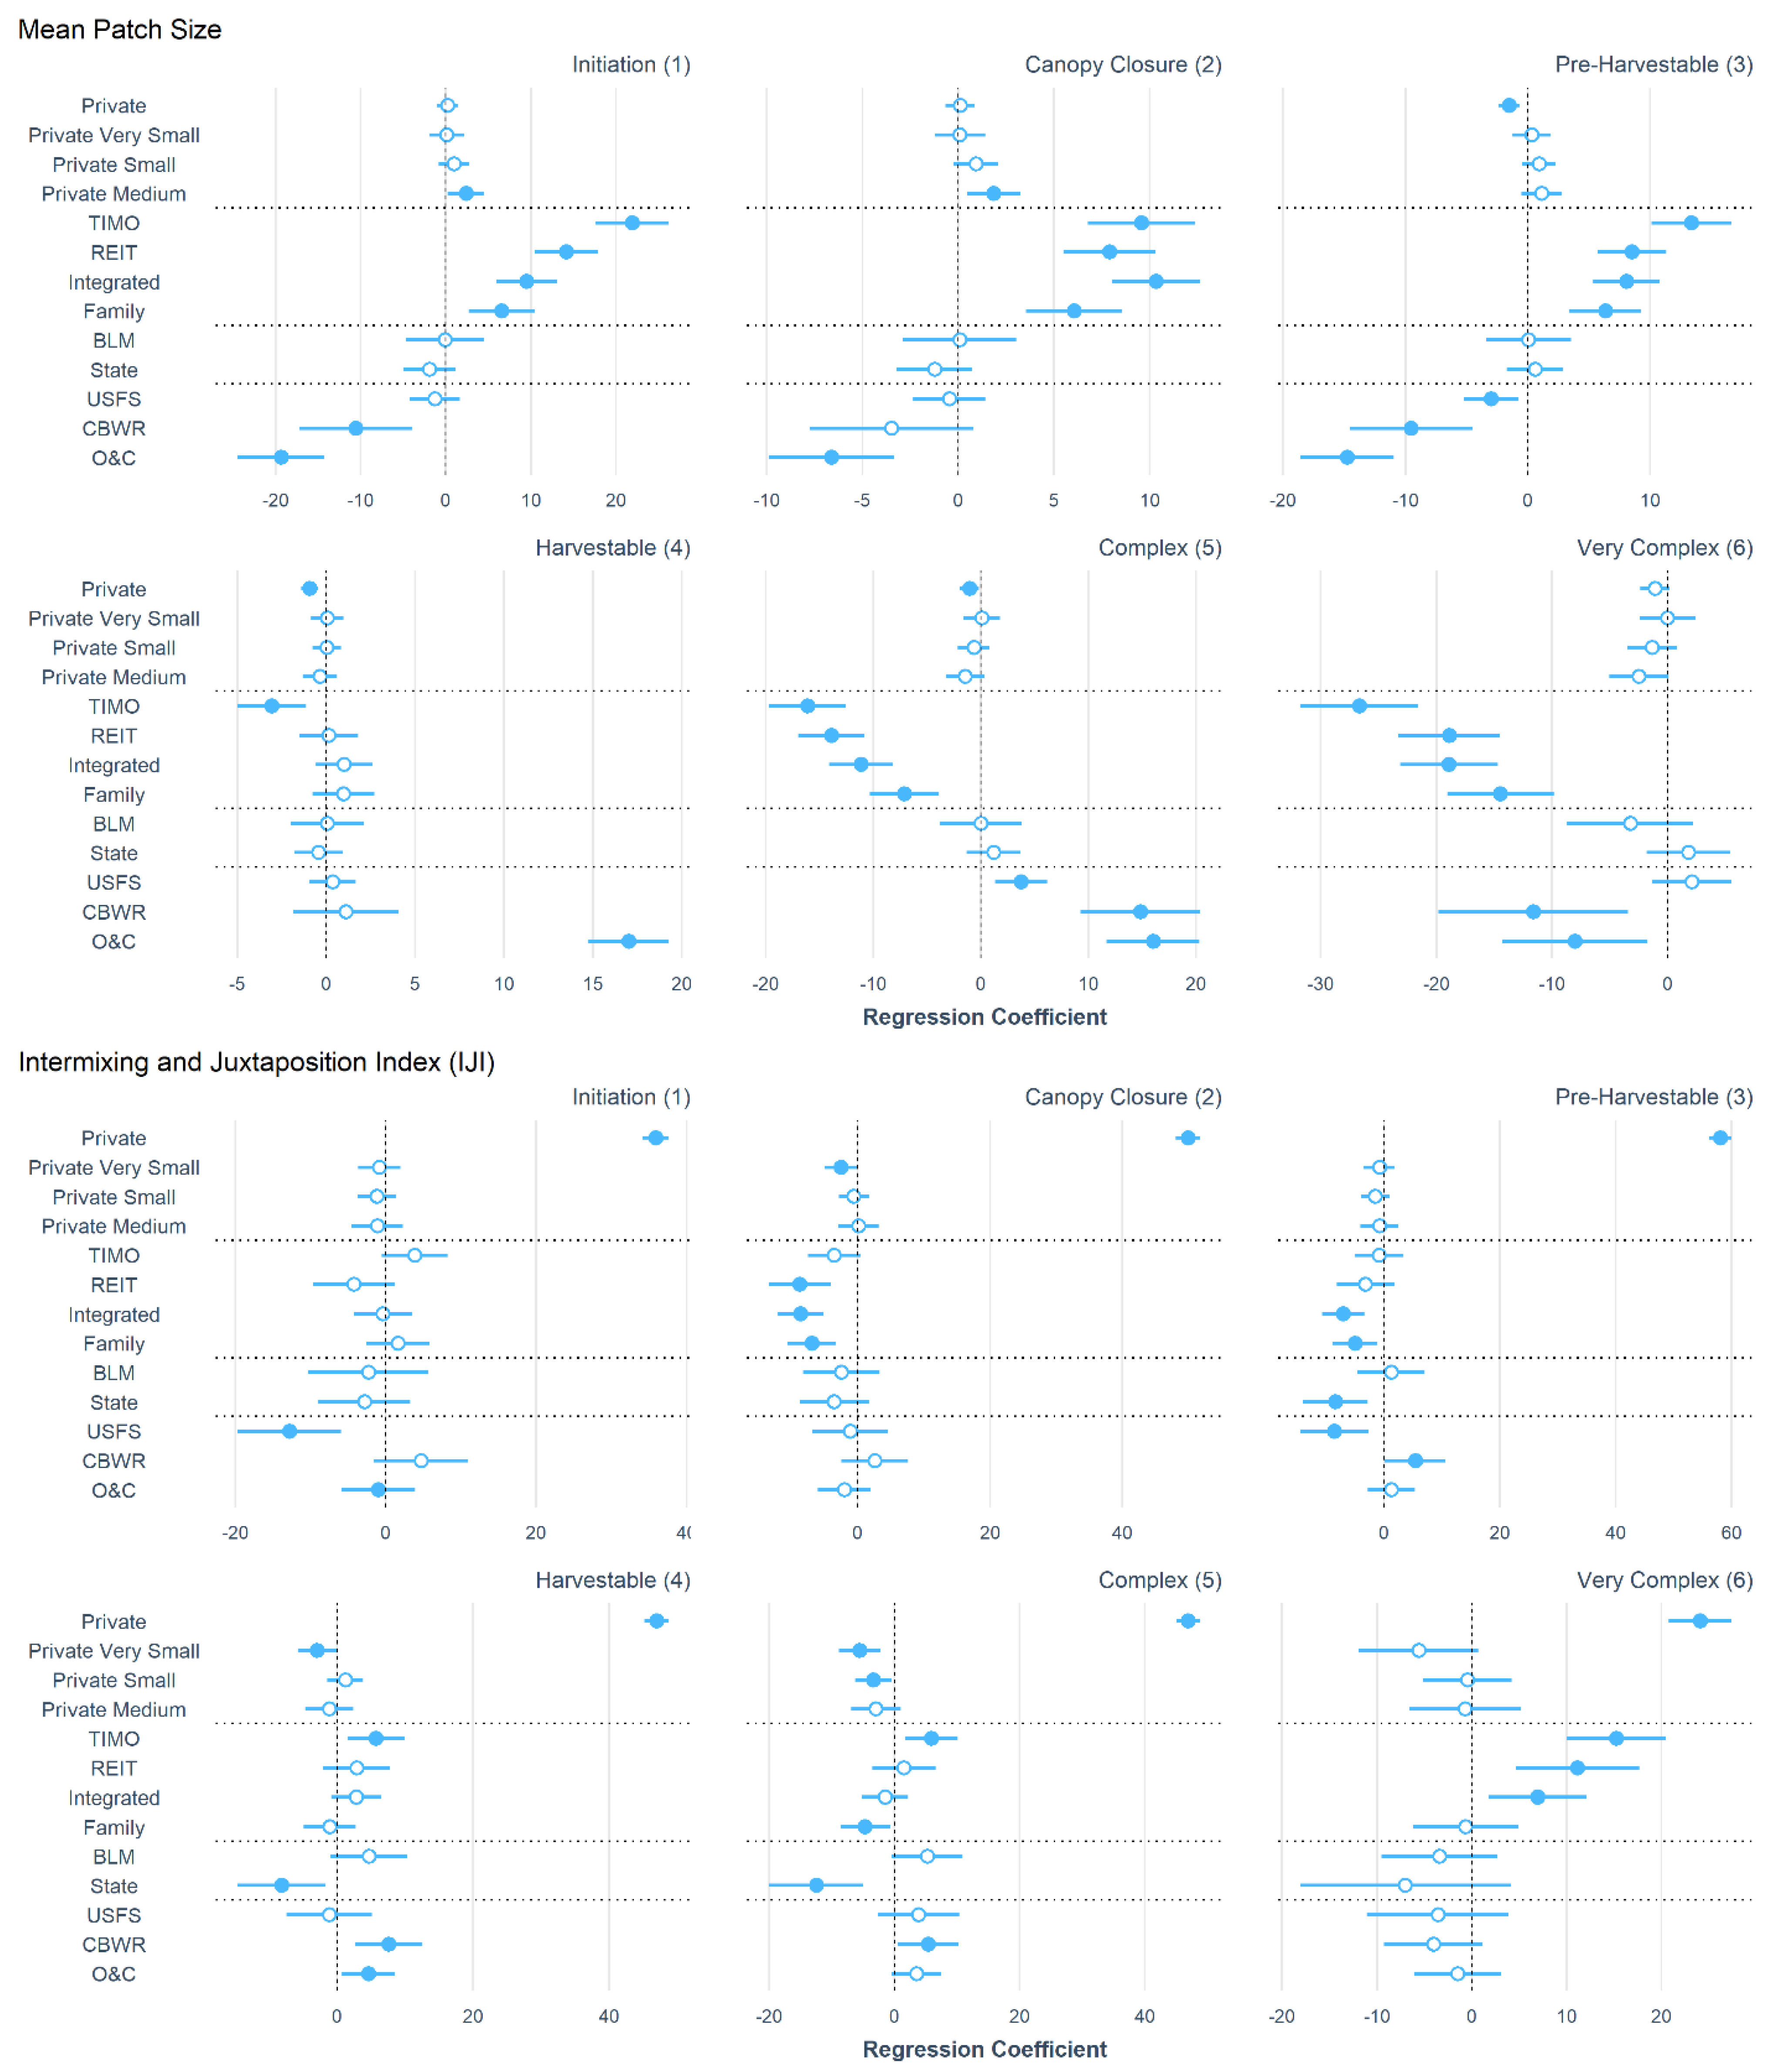
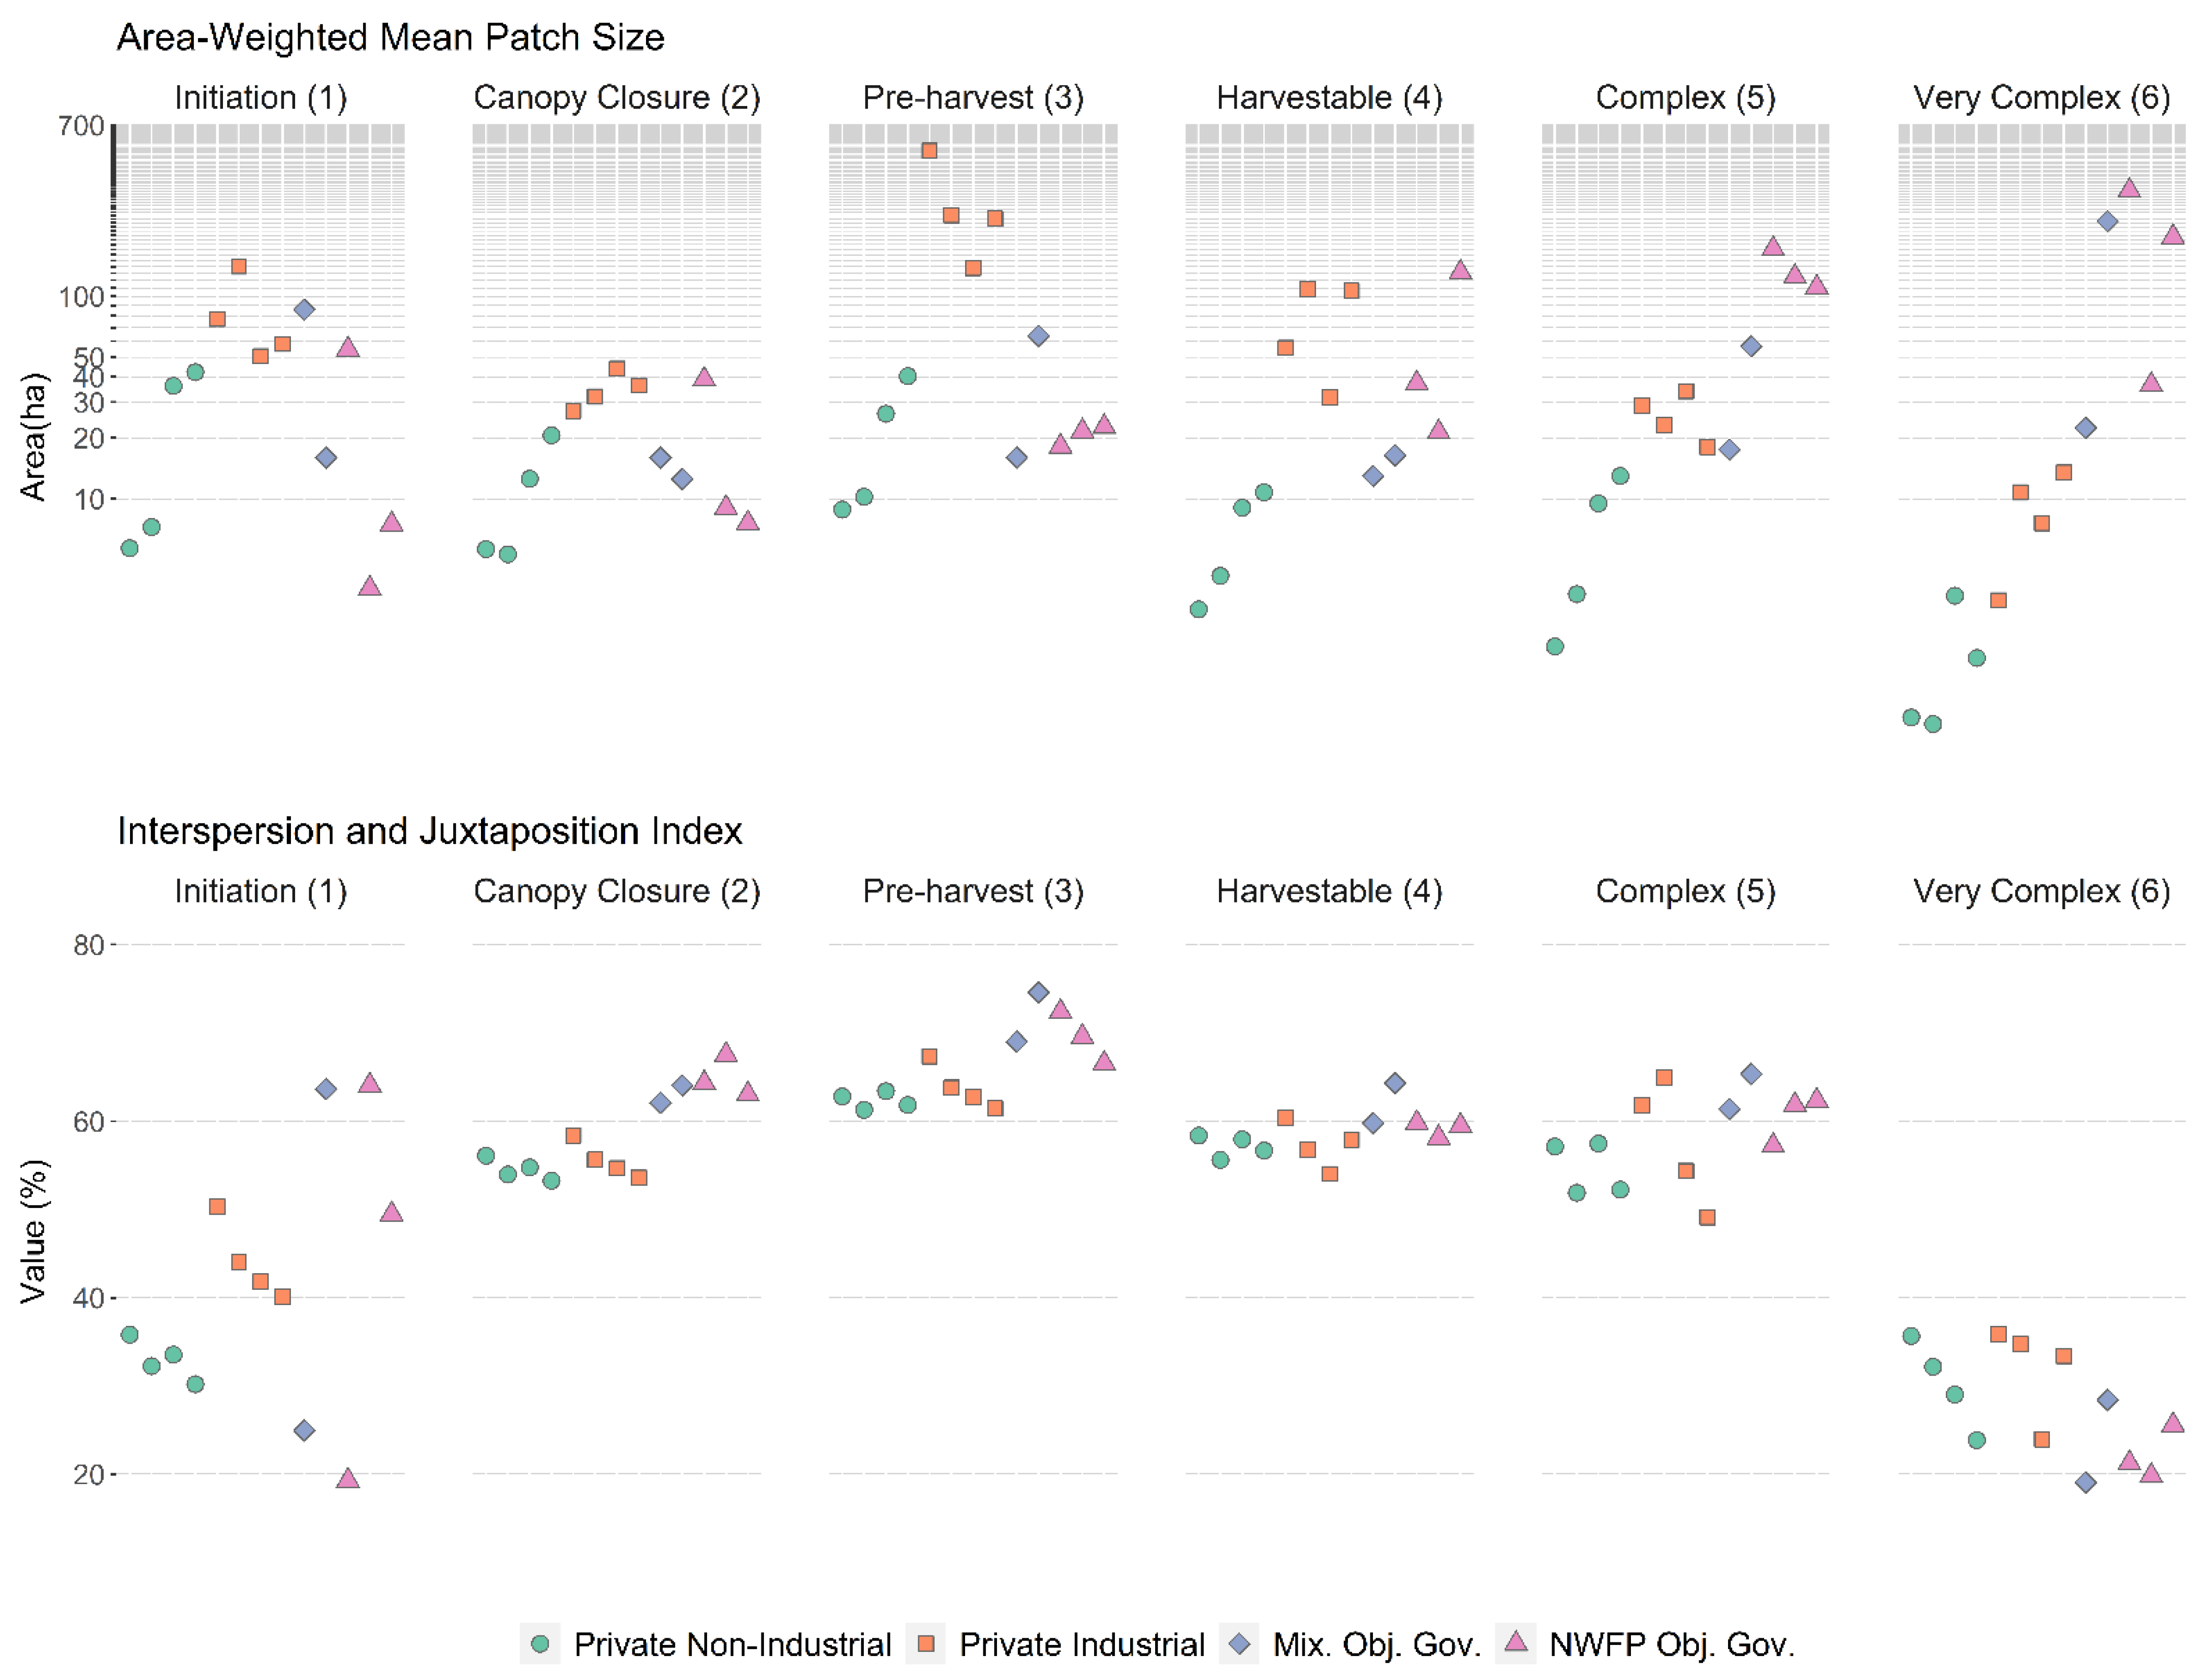
3.3. Landscape Structure Metrics Significantly Differ among Ownerships

For models of mean patch size, property size was statistically significant in all six structure classes while structure class proportion was significant in five structure classes. Property size had a strong linear relationship with mean patch size by structure class (Figure 5 and Figure 6) while structure class proportion did not. For models of structural heterogeneity, structure class proportion differed in all six structure classes while property size differed only in the Initiation class (1). Neither property size nor structure class proportion had strong linear relationships with structural heterogeneity.
Ownership type was related to mean patch size and structural heterogeneity (Interspersion and Juxtaposition Index [IJI]), after accounting for effects of property size or structure class proportion on these configuration metrics. Of the Initiation (1), Canopy Closure (2), and Pre-Harvest (3) structure classes, the private industrial ownership group had larger than expected mean patch sizes while the NWFP Objective Government ownership group had smaller than expected mean patch sizes (Figure 5). For the Complex and Very Complex (Classes 5 and 6), private industrial ownership types had smaller than expected mean patch sizes while the NWFP objective government ownership group had larger than expected mean patch sizes (Figure 5). The mixed objective government ownership group and private non-industrial ownership group did not show a strong relationship with mean patch size (Figure 5).
For structural heterogeneity (IJI) in Canopy Closure and Pre-Harvest structure classes (Classes 2 and 3), only private non-industrial ownerships significantly differed (Figure 5). In the Harvestable, Complex, and Very Complex structure classes (Classes 4 through 6), patch-scale structural heterogeneity varied by private industrial and both public ownership groups. Structural heterogeneity was greater than expected (given the proportion of the ownership within the modeled structure class) for all the aforementioned ownerships. Family ownership had a significant effect on patch-scale structural heterogeneity and was higher than expected in all structure classes.

4. Discussion

In this study, we combined spatially explicit ownership maps tied to management goals with high-fidelity airborne lidar measurements of forest structure across a forested region. Our approach allowed us to develop four key insights. First, we identified and described two distinct assemblages of the six different structure classes. These two assemblages are of forest structures that are more structurally simple (Classes 1–4) and forest structures that are more structurally complex (Classes 5 and 6), which we refer to as production-style forests and structurally complex forests, respectively. These assemblages are defined by their structural characteristics but are also divided by ownership, likely as a result of ownerships’ objectives and management practices that create these two assemblages. Second, our study reveals the strong connection between different classes of ownerships (representing their land objectives and management practices) and forest structure patterns. We found these correlations in the proportion of forest structure classes, mean patch size, and intermixing of patch types within properties. Third, we found distinct differences in forest structure between public and private lands but found comparatively smaller difference in forest structure within public and private lands between ownership types. Fourth, we found that ownership has different effects on forest structure pattern at multiple scales, due to different management practices within properties and the additive effect of differing landowners and practices at a sub-regional scale.
Through the use of high-fidelity airborne lidar, our study builds upon the field plot-based studies (e.g., [31,41,56]) and Landsat scene-based studies (e.g., [30,34,47,49]) that similarly found differences in patch size and intermixing between ownership types due to contrasting management philosophies. Our results support documented differences in forest structure between public and private land (e.g., [29,30,31,41,42,43,44,56]), particularly in western Oregon [32,34,37,49]. Finally, our results are supported by previous studies that found harvest practices create different patterns of forest structure at multiple scales [35,40,46] and expands upon this work by examining landowner objectives and ownership structure.

4.1. Two Distinct Assemblages of Forest Structure Classes

We identified six different forest structure classes in the study area that were predominately found in two assemblages: production-style forests and structurally complex forests. The production-style forests consist of the first four structure classes, which are predominantly found on private lands. These likely represent a sequence of stand development from planting after harvest (Initiation, class 1) to stands commercially viable for harvest (Harvestable, Class 4). The structurally complex forests consist of the final two structure classes (Complex and Very Complex, Classes 5 and 6) and have structures typically found in older stands [73,75] (e.g., greater than 100 to 300 years). We view these as two distinct assemblages because their proportion of area within properties is based on ownership (Figure 3 and Figure 4). These two assemblages differ particularly in their dominant tree heights (P95 of lidar return heights) and the structural complexity of their canopies (rumple). Except for the Initiation and Canopy Closure structure classes (Classes 1 and 2), the structure classes have similar ranges of values for canopy cover.
We found strong associations between the production-style forests and private ownership groups and between the structurally complex classes and public ownership groups. Based on the proportion of structure classes in different ownerships, public and private ownerships fall into two distinct groups (Figure 3). Within each public and private sub-grouping came a further split, into the four total ownership groups. The ownership groups separate by their relative proportions of forest structure classes predominately representing production forests (Classes 1 through 4) and complex forests (Classes 5 and 6), respectively (PCA axis 1), which represents 94% of the variation between ownership types and groups (Figure 3). Similarly, the production-style and structurally complex forest structure classes separated along this axis. These results are supported by past work that found similar differences in forest patterns between public and private ownership types (e.g., [29,30,31,32,34,36,37,38,41,42,43,44,56]).
We found that estimated forest ages from the GNN stand age estimates [88] are consistent with our interpretation of the structure classes we identified. We recognize that while different forest structures can broadly be associated with ranges of stand ages, actual ages for a characteristic forest structure can vary as forests follow different development paths (e.g., [75,99,100,101]). However, in our study area, GNN estimated stand age increased with our ordinal ranking of structure classes, which were ordered based on increasing dominant tree height, a strong correlate of stand age.
For the production structure classes (1 to 4), the GNN ages are consistent with typical ages for the development stages we identified them with (Initiation, Canopy Closure, Pre-Harvest, and Harvestable) [97]. On the other hand, the Very Complex class only had an estimated mean age of 134 years, younger than we would expect for such structurally complex forests. If accurate, it is possible that this could imply that forests in our study area can develop high structural complexity in a relatively short period of time. While we do not have field stand age data in the Coast Range, the high structural complexity values in less than 134 years as estimated from GNN are comparable to structural complexity values in 250–300-year old forests in the Washington Cascades where field stand age data was available [75]. However, that study also showed that stands greater than 80 years old can have considerable structural complexity and have comparable structural complexity to stands 200 to 300 years old. In our study area, the very complex forest structure patches may have been initiated after the high-severity fires of 1966, 1902, or the earlier 1868 fire. Accelerated development of complex forest structures could be due to high productivity in this region [102] or from precocious complex structure generated by natural disturbances [100]. If the younger mean age for these more complex stands in our study area are supported by future research, then this suggests that a strategy on private lands to leave stands to develop complexity naturally, which could increase habitat connectivity in a matter of decades to a century. Alternatively, these patches could be the result of efforts by managers under the NWFP to create structural complexity faster than it develops naturally, with the aim of creating suitable habitat for spotted owls and marbled murrelets (see Section 4.2.1). Again, if future research bears out the younger mean age for complex stands, then this suggests a contrary strategy of active management to create structural complexity.

4.2. Land Ownership Objectives Manifested in Landscape Pattern of Forest Structure

Land ownership objectives, influenced by policy and economic forces, in our study area, fall into three broad categories: objectives for public lands (i.e., USFS, BLM, and Elliott State Forest) as outlined under the Northwest Forest Plan, maximizing net present value of timber stock for private industrial lands (i.e., TIMOs, REITs, Integrated, and Family lands), and a combination of timber harvest and land investment for private non-industrial lands (i.e., non-industrial owners from 20–2000 hectares) (Table 1). We expected the proportion of complex forest structure (Classes 5 and 6), mean patch size, and intermixing to increase from low values on private industrial lands, medium values on private non-industrial lands, and high values on public lands. We expected these results because these ownerships are also on a spectrum of objectives from intense timber production to ecological forest management. Our results support these expectations for private industrial and public lands, but not for private non-industrial lands.

4.2.1. Ecological Forest Management Evident on Public Lands

Within public lands, a unique forest structure pattern emerges for each which is the result of two landscape goals for forest structure under the Northwest Forest Plan [54]. First, the plan calls for contiguous blocks of high-quality habitat with characteristics similar to our Complex and Very complex structure classes (Classes 5 and 6). The large proportion of area in these two classes (Figure 4) and the large patch size for these two classes (Figure 5 and Figure 6) show that government lands are partially achieving this goal. However, the NWFP also calls for structural heterogeneity across landscapes and for this criterion, public lands do less well. The Very Complex structure class (6), for example, shows little intermixing with other classes (Figure 5 and Figure 6), and an examination of adjacency tables (data not shown) shows that it is most commonly adjacent to patches of the Complex structure class (5). On the other hand, the less structurally complex classes (1–4) are moderately intermixed. These patterns suggest that public properties may tend toward bifurcation with large areas of more structurally complex forests (Classes 5 and 6) and other areas with intermixed less structurally complex forests (Classes 1 to 4), similar to results found in [103]. While there are subtle differences in forest structure between the groups of public ownership types (mixed objective and NWFP objective), these patterns generally hold true across both groups.

4.2.2. Forest Structure Did Not Reflect Expected Land Objective Differences between Private Industrial and Private Non-Industrial Lands

Private ownership in our study area includes a range of owners with different stated management objectives (Table 1). These range from non-industrial private properties from <20 ha to 2000 ha in size, to large industrial properties often owned by well-financed entities. We expected non-industrial forest owners to have diverse objectives that can include habitat protection, leaving estates for heirs, and land investment, along with generating revenue from harvests. We had expected that properties belonging to the smaller non-industrial property owners would include a larger proportion of more structurally complex forests compared to industrial private properties where there is a known strong focus on financial return. Within large owners, family ownerships which are closely held and not publicly traded are not subject to the same investor demands for shorter term financial performance as TIMO, REITS, and Integrated owners. We expected that this could result in greater proportions of structurally complex forests (Classes 5–6) on family ownerships. Instead, we found that the forest structure of smaller private ownership types was similar to that of the private-industrial ownership types, based on mean values for proportion of ownership area in the Complex and Very Complex forest structure classes (5 and 6) and mean patch size. Furthermore, our hierarchical clustering of ownership types found that the proportion of structure classes for family owners were very similar to other large private industrial owners (Figure 3 and Figure 4). While it is likely that examining each ownership individually would find exceptions to these broader trends, our results suggest that these smaller landowners have a similar focus on maximizing revenue as owners of private industrial properties. We discuss the implications of this finding for conservation in Section 4.4.

4.3. Landowner Objectives and Management Practices Create Different Scales of Forest Structure Pattern

In our study, we examined forest structure at the scales of individual patches, patches within individual properties analyzed across all properties of the same ownership type, and patterns of forest structure across ownership types. This allows us to look at the effects of manager objectives on forest structures at different scales. Differing patterns of homogeneity and heterogeneity in forest structure have been found at multiple scales in the boreal forests of Canada [40] and in the American Upper Midwest [29,35] due to variability in harvest practices.
At the broadest scale (cross-ownership types), homogeneity of forest structure is imposed by historic land allocation decisions made by the US Federal Government. Forest structure in this landscape is largely bifurcated by private versus public ownership that also divides by elevation, aside from the instances of intentional intermixing from the railroad lands (see Section 2.2 for further explanation). The contiguous blocks of Complex and Very Complex structure classes (5 and 6) and lack of intermixing between structurally complex and structurally simple patches (see Section 4.2.1) demonstrate structural homogeneity at a patch scale. This is likely the result of a lack of management in structurally complex patches and presence of management in structurally simple patches, due to the relative ease of accessibility of those forests.
The forest structure pattern that emerges on private lands is the result of even-aged silvicultural management. Private owners primarily have a range of structures from Initiation (Class 1) to Harvestable (Class 4) that are moderately intermixed as a result of clearcutting and resulting differently aged stands. There are few structurally complex forest structures (our class 5 and 6) on private lands, and a visual inspection of their patterns suggest they often may be riparian buffers excluded from harvests. Across and even within ownerships, these fine scale management choices result in a sub-regional mosaic of structurally similar forest patches that differ only in time since harvest (e.g., different age cohorts of even aged stands). Since private ownership types are aggregated (Figure 1), a homogeneity of similar repeating patterns of forest structure across a large proportion of the landscape is likely created.

4.4. Conservation Applications

Because forest structure is tightly linked to conservation values, such as carbon storage and habitat, the results of this study can be used to inform conservation strategies for policymakers and managers, especially considering the importance of species habitat in the Northwest Forest Plan [55]. Here, we discuss applications of this study to monitoring and implementation of regional management and conservation policy.

4.4.1. NWFP Goal Assessment

This analysis shows that federal lands governed under the NWFP are successfully conserving large patches of contiguous structurally complex forest. As discussed earlier, these patches could include structurally complex forest that developed relatively quickly [102]. Regardless of their age though, these forests are likely to continue to develop greater structural complexity in the years to come. These results support trends found approximately ten to twenty years after the implementation of the NWFP, which stated that the rate of old growth decline had slowed and development of structurally more complex forests had increased [54,104,105] However, structural complexity that can be measured by airborne lidar is only one of multiple components of old growth and late successional forest. Other components that characterize old-growth forest, for instance snags with natural cavities and tree crowns with broken tops [106], are not readily measurable by lidar, so we are unable to make statements about the presence of these other key structural attributes in our study area. Based on observations of structural complexity for the wider region [12], these other characteristics often develop at forest ages greater than those estimated for our study area
In 2016 (i.e., after the acquisition of the lidar data and focus of this study), BLM lands in western Oregon, including those in our study area, implemented a new resource management plan (RMP) that supersedes the NWFP [107]. This RMP allows more sustained-yield timber harvest than the previous, NWFP-compliant RMP and will implement regeneration harvesting and even-aged silvicultural practices on allocated BLM land in the study area. Additionally, it allows for narrower riparian corridors and larger forest gap creation from harvest. While these actions were implemented well after the scope of analysis for this study, future research should consider these actions and their effects on structural complexity and heterogeneity for this region.

4.4.2. Conservation Easements

Conservation easements are agreements between a landowner and a land trust or government agency where the landowner retains ownership of the land but transfers development and/or management rights to the grantee, typically for tax relief [108]. In our study area, we found that there was a substantial geographic bifurcation of public and private lands, with the vast majority of structurally complex forests on public land [54,68]. This bifurcation points to a need for a conservation focus on private lands interspersed with public lands, given the lack of feasibility in accomplishing conservation goals only on public land [109]. For example, easements on private lands of higher habitat value that widen the connecting corners of private and public lands in the checkerboard would increase landscape connectivity, a basis for biological diversity and an important consideration as species ranges may shift due to climate change [110]. Conservation easements on these lands could specifically focus on management practices to develop contiguous high-quality complex habitat from the private lands to the adjacent public lands. However, outside of a mixed ownership context, easements may contribute relatively little to regional conservation planning as an easement on private land surrounded by other private land may simply create an island of complex habitat in otherwise simplified forests.

4.4.3. Implications for the Oregon Forest Practices Act

The Oregon Forest Practices Act is a series of state-level policies that establish forest practices on private land and is implemented by the Oregon Board of Forestry [111]. Two components of this act are a harvest limit of approximately 49 hectares (120 acres) and a limit on harvests of “adjacent areas in the same ownership until new trees on the original harvest site are at least four feet tall or are four years-old” [111]. However, our results show that mean patch size created by private industrial lands in the Pre-Harvest structure class (3) had a substantially larger mean patch size (138 hectares) than the desired 49-hectare patch size. This is likely because waiting only four years or until the new trees are four feet tall before an adjacent harvest takes place is not long enough for patches to develop into meaningfully different structure or class cohorts. Increasing the diversity of landscape patterns may require either decreasing harvest size limits or increasing the number of years to wait before a neighboring patch can be harvested. Considering these changes is especially important as more than 75% of future timber harvest in our study area is expected to come from private industrial lands for whom the Oregon Forest Practice Act is designed to manage [112].

5. Conclusions

We found that land ownership, objectives, and management create multiple assemblages of forest structure and that these assemblages vary in their homogeneity at different scales. Management of private lands creates homogenous forest structure at a fine-scale and creates heterogeneity at a sub-regional scale, but only through the difference in age cohorts of the homogenous fine scale forest structure. Management of public lands creates more complex forest structure compared to private lands, but differences in pattern within public and private lands were not evident. Our results emphasize the need for high fidelity data to examine complex multi-ownership landscapes and enable coordinated planning of harvests and conservation actions across ownership boundaries. This study provides an update to previous research in western Oregon that focused on the relationship between land ownership and forest conditions. Our work has direct application to forest management and policy in the Pacific Northwest and provides a framework of analysis across a range of ownership categories and ecosystems. While our study is from a discrete period in time, the forests present at that time are the cumulative result of decisions and actions stretching back decades. Examining each of these decisions and actions is beyond the scope of this study, and future research should investigate those we were unable to address. Future work could focus on the structurally complex forest structure classes to expand our understanding of structural complexity and management practices that create it.

Author Contributions

Conceptualization, V.G., R.H. and V.K.; data curation, V.G. and B.K.; formal analysis, V.G. and B.K.; funding acquisition, V.G., R.H. and V.K.; investigation, V.G., B.K., R.H. and V.K.; methodology, V.G. and V.K.; project administration, V.G. and V.K.; resources, B.K., R.H. and V.K.; software, V.G.; supervision, R.H. and V.K.; validation, V.G.; visualization, V.G.; writing—original draft, V.G.; writing—review and editing, V.G., B.K., R.H. and V.K. All authors have read and agreed to the published version of the manuscript.

Funding

This study was funded by the McIntire-Stennis Cooperative Forestry Research Program [grant nos. NI18MSCFRXXXG050 & NI19MSCFRXXXG035/project accession no. 1016932] from the USDA National Institute of Food and Agriculture.

Institutional Review Board Statement

Not applicable.

Informed Consent Statement

Not applicable.

Data Availability Statement

Not applicable.

Acknowledgments

We are grateful to Brian Harvey and L. Monika Moskal for their advice and guidance in development and execution of this study. We are also grateful to C. Alina Cansler, Andrew Hudak, David Bell, Matthew Gregory, and Garrett Meigs for their advice in project development and analysis. The authors would like to thank Jonathan Kane and Bryce Bartl-Geller for their technical and statistical help in execution of this study.

Conflicts of Interest

The authors declare no conflict of interest. The funders had no role in the design of the study; in the collection, analyses, or interpretation of data; in the writing of the manuscript; or in the decision to publish the results.

References

  1. Ryan, K.C. Dynamic interactions between forest structure and fire behavior in boreal ecosystems. Silva Fenn. 2002, 36, 13–39. [Google Scholar] [CrossRef] [Green Version]
  2. Sanders, R.A. Some determinants of urban forest structure. Urban Ecol. 1984, 8, 13–27. [Google Scholar] [CrossRef]
  3. Parrotta, J.; Francis, J.K.; Knowles, O.H. Harvesting intensity affects forest structure and composition in an upland Amazonian forest. For. Ecol. Manag. 2002, 169, 243–255. [Google Scholar] [CrossRef]
  4. Wang, X.; Fang, J.; Tang, Z.; Zhu, B. Climatic control of primary forest structure and DBH–height allometry in Northeast China. For. Ecol. Manag. 2006, 234, 264–274. [Google Scholar] [CrossRef]
  5. Kulakowski, D.; Bebi, P.; Rixen, C. The interacting effects of land use change, climate change and suppression of natural disturbances on landscape forest structure in the Swiss Alps. Oikos 2010, 120, 216–225. [Google Scholar] [CrossRef]
  6. Quesada, C.A.; Phillips, O.L.; Schwarz, M.; Czimczik, C.I.; Baker, T.R.; Patiño, S.; Fyllas, N.M.; Hodnett, M.G.; Herrera, R.; Almeida, S.; et al. Basin-wide variations in Amazon forest structure and function are mediated by both soils and climate. Biogeosciences 2012, 9, 2203–2246. [Google Scholar] [CrossRef] [Green Version]
  7. McElhinny, C.; Gibbons, P.; Brack, C.; Bauhus, J. Forest and woodland stand structural complexity: Its definition and measurement. For. Ecol. Manag. 2005, 218, 1–24. [Google Scholar] [CrossRef]
  8. Tateno, R.; Hishi, T.; Takeda, H. Above- and belowground biomass and net primary production in a cool-temperate deciduous forest in relation to topographical changes in soil nitrogen. For. Ecol. Manag. 2004, 193, 297–306. [Google Scholar] [CrossRef]
  9. Yeo-Chang, Y. Use of forest resources, traditional forest-related knowledge and livelihood of forest dependent communities: Cases in South Korea. For. Ecol. Manag. 2009, 257, 2027–2034. [Google Scholar] [CrossRef]
  10. Tetzlaff, D.; Soulsby, C.; Buttle, J.; Capell, R.; Carey, S.K.; Laudon, H.; McDonnell, J.J.; McGuire, K.J.; Seibert, J.; Shanley, J. Catchments on the cusp? Structural and functional change in northern ecohydrology. Hydrol. Process. 2013, 27, 766–774. [Google Scholar] [CrossRef]
  11. Caldwell, P.V.; Miniat, C.F.; Elliott, K.J.; Swank, W.T.; Brantley, S.T.; Laseter, S.H. Declining water yield from forested mountain watersheds in response to climate change and forest mesophication. Glob. Chang. Biol. 2016, 22, 2997–3012. [Google Scholar] [CrossRef] [PubMed]
  12. Franklin, J.F.; Spies, T.A.; Van Pelt, R.; Carey, A.B.; Thornburgh, D.A.; Berg, D.R.; Lindenmayer, D.B.; Harmon, M.E.; Keeton, W.S.; Shaw, D.C.; et al. Disturbances and structural development of natural forest ecosystems with silvicultural implications, using Douglas-fir forests as an example. For. Ecol. Manag. 2002, 155, 399–423. [Google Scholar] [CrossRef]
  13. Schwab, F.E.; Pitt, M.D. Moose selection of canopy cover types related to operative temperature, forage, and snow depth. Can. J. Zool. 1991, 69, 3071–3077. [Google Scholar] [CrossRef]
  14. Coops, N.; Tompaski, P.; Nijland, W.; Rickbeil, G.J.M.; Nielsen, S.E.; Bater, C.W.; Stadt, J.J. A forest structure habitat index based on airborne laser scanning data. Ecol. Indic. 2016, 67, 346–357. [Google Scholar] [CrossRef]
  15. Nepstad, D.C.; Verssimo, A.; Alencar, A.; Nobre, C.; Lima, E.; Lefebvre, P.A.; Schlesinger, P.; Potter, C.; Moutinho, P.; Mendoza, E.; et al. Large-scale impoverishment of Amazonian forests by logging and fire. Nat. Cell Biol. 1999, 398, 505–508. [Google Scholar] [CrossRef]
  16. Bengtsson, J.; Nilsson, S.G.; Franc, A.; Menozzi, P. Biodiversity, disturbances, ecosystem function and management of European forests. For. Ecol. Manag. 2000, 132, 39–50. [Google Scholar] [CrossRef]
  17. Backer, D.M.; Jensen, S.E.; McPherson, G.R. Impacts of Fire-Suppression Activities on Natural Communities. Conserv. Biol. 2004, 18, 937–946. [Google Scholar] [CrossRef]
  18. Boisvenue, C.; Running, S.W. Impacts of climate change on natural forest productivity—Evidence since the middle of the 20th century. Glob. Chang. Biol. 2006, 12, 862–882. [Google Scholar] [CrossRef]
  19. Allen, C.D.; Macalady, A.K.; Chenchouni, H.; Bachelet, D.; McDowell, N.; Vennetier, M.; Kitzberger, T.; Rigling, A.; Breshears, D.D.; Hogg, E.H.; et al. A global overview of drought and heat-induced tree mortality reveals emerging climate change risks for forests. For. Ecol. Manag. 2010, 259, 660–684. [Google Scholar] [CrossRef] [Green Version]
  20. Brotons, L.; Aquilué, N.; De Cáceres, M.; Fortin, M.-J.; Fall, A. How Fire History, Fire Suppression Practices and Climate Change Affect Wildfire Regimes in Mediterranean Landscapes. PLoS ONE 2013, 8, e62392. [Google Scholar] [CrossRef] [Green Version]
  21. Sorice, M.G.; Kreuter, U.P.; Wilcox, B.P.; Fox, W.E. Changing landowners, changing ecosystem? Land-ownership motivations as drivers of land management practices. J. Environ. Manag. 2014, 133, 144–152. [Google Scholar] [CrossRef] [PubMed]
  22. Cubbage, F.W.; Mac Donagh, P.; Júnior, J.S.; Rubilar, R.; Donoso, P.J.; Ferreira, A.; Hoeflich, V.; Olmos, V.M.; Ferreira, G.; Balmelli, G.; et al. Timber investment returns for selected plantations and native forests in South America and the Southern United States. New For. 2006, 33, 237–255. [Google Scholar] [CrossRef]
  23. Adhikari, B.; Williams, F.; Lovett, J.C. Local benefits from community forests in the middle hills of Nepal. For. Policy Econ. 2007, 9, 464–478. [Google Scholar] [CrossRef]
  24. Götmark, F. Habitat management alternatives for conservation forests in the temperate zone: Review, synthesis, and implications. For. Ecol. Manag. 2013, 306, 292–307. [Google Scholar] [CrossRef]
  25. Erickson, D.L.; Ryan, R.L.; De Young, R. Woodlots in the rural landscape: Landowner motivations and management attitudes in a Michigan (USA) case study. Landsc. Urban Plan. 2002, 58, 101–112. [Google Scholar] [CrossRef] [Green Version]
  26. Kendra, A.; Hull, R.B. Motivations and behaviors of new forest owners in Virginia. For. Sci. 2005, 51, 142–154. [Google Scholar] [CrossRef]
  27. Lindhjem, H.; Mitani, Y. Forest owners’ willingness to accept compensation for voluntary conservation: A contingent valuation approach. J. For. Econ. 2012, 18, 290–302. [Google Scholar] [CrossRef]
  28. Weiss, G.; Lawrence, A.; Lidestav, G.; Feliciano, D.; Hujala, T.; Sarvašová, Z.; Dobšinská, Z.; Živojinović, I. Research trends: Forest ownership in multiple perspectives. For. Policy Econ. 2019, 99, 1–8. [Google Scholar] [CrossRef] [Green Version]
  29. Mladenoff, D.J.; White, M.A.; Pastor, J.; Crow, T.R. Comparing Spatial Pattern in Unaltered Old-Growth and Disturbed Forest Landscapes. Ecol. Appl. 1993, 3, 294–306. [Google Scholar] [CrossRef]
  30. Turner, M.G.; Wear, D.N.; Flamm, R.O. Land Ownership and Land-Cover Change in the Southern Appalachian Highlands and the Olympic Peninsula. Ecol. Appl. 1996, 6, 1150–1172. [Google Scholar] [CrossRef] [Green Version]
  31. Crow, T.R.; Host, G.E.; Mladenoff, D.J. Ownership and ecosystem as sources of spatial heterogeneity in a forested landscape, Wisconsin, USA. Landsc. Ecol. 1999, 14, 449–463. [Google Scholar] [CrossRef]
  32. Cohen, W.B.; Spies, T.A.; Alig, R.J.; Oetter, D.R.; Maiersperger, T.K.; Fiorella, M. Characterizing 23 Years (1972–1995) of Stand Replacement Disturbance in Western Oregon Forests with Landsat Imagery. Ecosystems 2002, 5, 122–137. [Google Scholar] [CrossRef]
  33. Nagendra, H.; Pareeth, S.; Sharma, B.; Schweik, C.M.; Adhikari, K.R. Forest fragmentation and regrowth in an institutional mosaic of community, government and private ownership in Nepal. Landsc. Ecol. 2007, 23, 41–54. [Google Scholar] [CrossRef]
  34. Ohmann, J.L.; Gregory, M.J.; Spies, T.A. Influence of environment, disturbance, and ownership on forest vegetation of coastal oregon. Ecol. Appl. 2007, 17, 18–33. [Google Scholar] [CrossRef]
  35. Schulte, L.A.; Mladenoff, D.J.; Crow, T.R.; Merrick, L.C.; Cleland, D.T. Homogenization of northern U.S. Great Lakes forests due to land use. Landsc. Ecol. 2007, 22, 1089–1103. [Google Scholar] [CrossRef] [Green Version]
  36. Hudiburg, T.W.; Law, B.E.; Turner, D.P.; Campbell, J.; Donato, D.; Duane, M. Carbon dynamics of Oregon and Northern California forests and potential land-based carbon storage. Ecol. Appl. 2009, 19, 163–180. [Google Scholar] [CrossRef]
  37. Kennedy, R.E.; Yang, Z.; Cohen, W.B.; Pfaff, E.; Braaten, J.; Nelson, P. Spatial and temporal patterns of forest disturbance and regrowth within the area of the Northwest Forest Plan. Remote Sens. Environ. 2012, 122, 117–133. [Google Scholar] [CrossRef]
  38. Pachavo, G.; Murwira, A. Land-use and land tenure explain spatial and temporal patterns in terrestrial net primary productivity (NPP) in Southern Africa. Geocarto Int. 2013, 29, 671–687. [Google Scholar] [CrossRef]
  39. Hightower, J.N.; Butterfield, A.C.; Weishampel, J.F. Quantifying Ancient Maya Land Use Legacy Effects on Contemporary Rainforest Canopy Structure. Remote Sens. 2014, 6, 10716–10732. [Google Scholar] [CrossRef]
  40. Boucher, D.; De Grandpré, L.; Kneeshaw, D.; St-Onge, B.; Ruel, J.-C.; Waldron, K.; Lussier, J.-M. Effects of 80 years of forest management on landscape structure and pattern in the eastern Canadian boreal forest. Landsc. Ecol. 2015, 30, 1913–1929. [Google Scholar] [CrossRef]
  41. Rendenieks, Z.; Nikodemus, O.; Brūmelis, G.; Nikodemus, O. The implications of stand composition, age and spatial patterns of forest regions with different ownership type for management optimisation in northern Latvia. For. Ecol. Manag. 2015, 335, 216–224. [Google Scholar] [CrossRef]
  42. Easterday, K.; McIntyre, P.J.; Kelly, M. Land ownership and 20th century changes to forest structure in California. For. Ecol. Manag. 2018, 422, 137–146. [Google Scholar] [CrossRef]
  43. Guo, X.; Coops, N.; Tompalski, P.; Nielsen, S.E.; Bater, C.W.; Stadt, J.J. Regional mapping of vegetation structure for biodiversity monitoring using airborne lidar data. Ecol. Inform. 2017, 38, 50–61. [Google Scholar] [CrossRef]
  44. Huntsinger, L.; Buttolph, L.; Hopkinson, P. Ownership and Management Changes on California Hardwood Rangelands: 1985 to 1992. J. Range Manag. 1997, 50, 423. [Google Scholar] [CrossRef]
  45. Schaich, H.; Plieninger, T. Land ownership drives stand structure and carbon storage of deciduous temperate forests. For. Ecol. Manag. 2013, 305, 146–157. [Google Scholar] [CrossRef]
  46. Vogeler, J.C.; Slesak, R.A.; Fekety, P.A.; Falkowski, M.J. Characterizing over Four Decades of Forest Disturbance in Minnesota, USA. Forest 2020, 11, 362. [Google Scholar] [CrossRef] [Green Version]
  47. Spies, T.A.; Ripple, W.J.; Bradshaw, G.A. Dynamics and Pattern of a Managed Coniferous Forest Landscape in Oregon. Ecol. Appl. 1994, 4, 555–568. [Google Scholar] [CrossRef] [Green Version]
  48. Ohmann, J.L.; Spies, T.A. Regional Gradient Analysis and Spatial Pattern of Woody Plant Communities of Oregon Forests. Ecol. Monogr. 1998, 68, 151. [Google Scholar] [CrossRef]
  49. Stanfield, B.J.; Bliss, J.C.; Spies, T.A. Land ownership and landscape structure: A spatial analysis of sixty-six Oregon (USA) Coast Range watersheds. Landsc. Ecol. 2002, 17, 685–697. [Google Scholar] [CrossRef]
  50. Wimberly, M.C.; Ohmann, J.L. A multi-scale assessment of human and environmental constraints on forest land cover change on the Oregon (USA) coast range. Landsc. Ecol. 2004, 19, 631–646. [Google Scholar] [CrossRef]
  51. Kennedy, R.S.H.; Spies, T.A.; Gregory, M.J. Relationships of dead wood patterns with biophysical characteristics and ownership according to scale in Coastal Oregon, USA. Landsc. Ecol. 2008, 23, 55–68. [Google Scholar] [CrossRef]
  52. Nonaka, E.; Spies, T.A. Historical range of variability in landscape structure: A simulation study in Oregon, USA. Ecol. Appl. 2005, 15, 1727–1746. [Google Scholar] [CrossRef] [Green Version]
  53. McAlpine, C.A.; Spies, T.; Norman, P.; Peterson, A. Conserving forest biodiversity across multiple land ownerships: Lessons from the Northwest Forest Plan and the Southeast Queensland regional forests agreement (Australia). Biol. Conserv. 2007, 134, 580–592. [Google Scholar] [CrossRef]
  54. Spies, T.A.; Peter, A.S.; Gravenmier, R.A.; Long, J.W.; Reilly, M.J. Synthesis of science to inform land management within the Northwest Forest Plan area. For. Serv. 2018, 1, 1–370. [Google Scholar]
  55. Thomas, J.W.; Franklin, J.F.; Gordon, J.; Johnson, K.N. The Northwest Forest Plan: Origins, Components, Implementation Experience, and Suggestions for Change. Conserv. Biol. 2006, 20, 277–287. [Google Scholar] [CrossRef]
  56. Dickinson, Y.; Zenner, E.; Miller, D. Examining the effect of diverse management strategies on landscape scale patterns of forest structure in Pennsylvania using novel remote sensing techniques. Can. J. For. Res. 2014, 44, 301–312. [Google Scholar] [CrossRef]
  57. Smithwick, E.A.H.; Harmon, M.E.; Remillard, S.M.; Acker, S.A.; Franklin, J.F. Potential Upper Bounds of Carbon Stores in Forests of the Pacific Northwest. Ecol. Appl. 2002, 12, 1303. [Google Scholar] [CrossRef]
  58. Harris, G.A.; Franklin, J.; Dyrness, C.T. Natural Vegetation of Oregon and Washington. J. Range Manag. 1990, 43, 85. [Google Scholar] [CrossRef]
  59. Rollins, M.G. LANDFIRE: A nationally consistent vegetation, wildland fire, and fuel assessment. Int. J. Wildland Fire 2009, 18, 235–249. [Google Scholar] [CrossRef] [Green Version]
  60. Morris, W.G. Forest Fires in Western Oregon and Western Washington. Or. Hist. Soc. 1934, 35, 313–339. [Google Scholar]
  61. National Interagency Fire Center Interagency Fire Perimeter History—All Years 2020. Available online: https://data-nifc.opendata.arcgis.com/datasets/4454e5d8e8c44b0280258b51bcf24794_0/geoservice?geometry=-124.705%2C43.623%2C-122.619%2C43.970 (accessed on 15 December 2020).
  62. Wimberly, M.C.; Spies, T.A. Influences of environment and disturbance on forest patterns in Coastal Oregon Watersheds. Ecology 2001, 82, 1443–1459. [Google Scholar] [CrossRef]
  63. PRISM Climate Group. 2004. Available online: https://prism.oregonstate.edu/normals/ (accessed on 27 August 2019).
  64. Maestas, J.D.; Knight, R.L.; Gilgert, W.C. Biodiversity and Land-Use Change in the American Mountain West. Geogr. Rev. 2001, 91, 509–524. [Google Scholar] [CrossRef]
  65. Zald, H.S.J.; Dunn, C.J. Severe fire weather and intensive forest management increase fire severity in a multi-ownership landscape. Ecol. Appl. 2018, 28, 1068–1080. [Google Scholar] [CrossRef] [PubMed]
  66. Franklin, J.F.; Johnson, K.N. Lessons in policy implementation from experiences with the Northwest Forest Plan, USA. Biodivers. Conserv. 2014, 23, 3607–3613. [Google Scholar] [CrossRef]
  67. Decker, D. Elliott State Forest Management Plan; Oregon Department of Forestry: Salem, OR, USA, 2011. [Google Scholar]
  68. Hagar, J.; Yost, A.; Haggerty, P.K. Incorporating LiDAR metrics into a structure-based habitat model for a canopy-dwelling species. Remote Sens. Environ. 2020, 236, 111499. [Google Scholar] [CrossRef]
  69. Johnson, R.; Alig, R.; Kline, J.; Moulton, R.; Rickenbach, M. Management of Non-Industrial Private Forest Lands: Survey Results from Western Oregon and Washington Owners; Forest Research Laboratory, Oregon State University: Corvallis, OR, USA, 1999; p. 43. [Google Scholar]
  70. Kaipainen, T.; Liski, J.; Pussinen, A.; Karjalainen, T. Managing carbon sinks by changing rotation length in European forests. Environ. Sci. Policy 2004, 7, 205–219. [Google Scholar] [CrossRef]
  71. McGaughey, R. FUSION; US Department of Agriculture, Forest Service, Pacific Northwest Research Station: Seattle, WA, USA, 2018. [Google Scholar]
  72. North, M.P.; Kane, J.T.; Kane, V.R.; Asner, G.P.; Berigan, W.; Churchill, D.J.; Conway, S.; Gutiérrez, R.; Jeronimo, S.; Keane, J.; et al. Cover of tall trees best predicts California spotted owl habitat. For. Ecol. Manag. 2017, 405, 166–178. [Google Scholar] [CrossRef]
  73. Kane, V.; McGaughey, R.; Bakker, J.; Gersonde, R.; Lutz, J.; Franklin, J. Comparisons between field- and LiDAR-based measure of stand structural complexity. Can. J. For. Res. 2010, 40, 761–773. [Google Scholar] [CrossRef]
  74. Kane, V.R.; Lutz, J.A.; Roberts, S.L.; Smith, D.F.; McGaughey, R.J.; Povak, N.A.; Brooks, M.L. Landscape-scale effects of fire severity on mixed-conifer and red fir forest structure in Yosemite National Park. For. Ecol. Manag. 2013, 287, 17–31. [Google Scholar] [CrossRef]
  75. Kane, V.R.; Bakker, J.D.; McGaughey, R.J.; Lutz, J.A.; Gersonde, R.F.; Franklin, J.F. Examining conifer canopy structural complexity across forest ages and elevations with LiDAR data. Can. J. For. Res. 2010, 40, 774–787. [Google Scholar] [CrossRef]
  76. Ahmed, O.S.; Franklin, S.E.; Wulder, M.A.; White, J.C. Characterizing stand-level forest canopy cover and height using Landsat time series, samples of airborne LiDAR, and the Random Forest algorithm. ISPRS J. Photogramm. Remote Sens. 2015, 101, 89–101. [Google Scholar] [CrossRef]
  77. Matasci, G.; Hermosilla, T.; Wulder, M.A.; White, J.C.; Coops, N.; Hobart, G.W.; Bolton, D.K.; Tompalski, P.; Bater, C.W. Three decades of forest structural dynamics over Canada’s forested ecosystems using Landsat time-series and lidar plots. Remote Sens. Environ. 2018, 216, 697–714. [Google Scholar] [CrossRef]
  78. Smart, L.; Swenson, J.; Christensen, N.; Sexton, J. Three-dimensional characterization of pine forest type and red-cockaded woodpecker habitat by small-footprint, discrete-return lidar. For. Ecol. Manag. 2012, 281, 100–110. [Google Scholar] [CrossRef]
  79. Simonson, W.D.; Allen, H.D.; Coomes, D.A. Applications of airborne lidar for the assessment of animal species diversity. Methods Ecol. Evol. 2014, 5, 719–729. [Google Scholar] [CrossRef]
  80. Listopad, C.M.; Masters, R.E.; Drake, J.B.; Weishampel, J.F.; Branquinho, C. Structural diversity indices based on airborne LiDAR as ecological indicators for managing highly dynamic landscapes. Ecol. Indic. 2015, 57, 268–279. [Google Scholar] [CrossRef]
  81. Moran, C.J.; Rowell, E.M.; Seielstad, C.A. A data-driven framework to identify and compare forest structure classes using LiDAR. Remote Sens. Environ. 2018, 211, 154–166. [Google Scholar] [CrossRef]
  82. Silva, C.; Klauberg, C.; Hudak, A.T.; Vierling, L.A.; Liesenberg, V.; Carvalho, S.P.C.E.; Rodriguez, L.C.E. A principal component approach for predicting the stem volume in Eucalyptus plantations in Brazil using airborne LiDAR data. Forest 2016, 89, 422–433. [Google Scholar] [CrossRef]
  83. Murtagh, F.; Legendre, P. Ward’s Hierarchical Agglomerative Clustering Method: Which Algorithms Implement Ward’s Criterion? J. Classif. 2014, 31, 274–295. [Google Scholar] [CrossRef] [Green Version]
  84. R Core Team. R: A Language and Environment for Statistical Computing; R Foundation for Statistical Computing: Vienna, Austria, 2020. [Google Scholar]
  85. McCune, B.; Grace, J.B. Analysis of Ecological Communities; MjM Software Design: Gleneden Beach, OR, USA, 2002. [Google Scholar]
  86. Breiman, L. Random Forests. Mach. Learn. 2001, 45, 5–32. [Google Scholar] [CrossRef] [Green Version]
  87. Cutler, D.R.; Edwards, T.C., Jr.; Beard, K.H.; Cutler, A.; Hess, K.T.; Gibson, J.; Lawler, J.J. Random Forests for Classification in Ecology. Ecology 2007, 88, 2783–2792. [Google Scholar] [CrossRef]
  88. Ohmann, J.L.; Gregory, M.J. Predictive mapping of forest composition and structure with direct gradient analysis and nearest- neighbor imputation in coastal Oregon, U.S.A. Can. J. For. Res. 2002, 32, 725–741. [Google Scholar] [CrossRef]
  89. Zald, H.S.; Ohmann, J.L.; Roberts, H.M.; Gregory, M.J.; Henderson, E.B.; McGaughey, R.J.; Braaten, J. Influence of lidar, Landsat imagery, disturbance history, plot location accuracy, and plot size on accuracy of imputation maps of forest composition and structure. Remote Sens. Environ. 2014, 143, 26–38. [Google Scholar] [CrossRef]
  90. Bell, D.M.; Gregory, M.J.; Kane, V.; Kane, J.; Kennedy, R.E.; Roberts, H.M.; Yang, Z. Multiscale divergence between Landsat- and lidar-based biomass mapping is related to regional variation in canopy cover and composition. Carbon Balance Manag. 2018, 13, 15. [Google Scholar] [CrossRef] [PubMed] [Green Version]
  91. Kennedy, R.E.; Ohmann, J.; Gregory, M.; Roberts, H.; Yang, Z.; Bell, D.M.; Kane, V.; Hughes, M.J.; Cohen, W.B.; Powell, S.; et al. An empirical, integrated forest biomass monitoring system. Environ. Res. Lett. 2018, 13, 025004. [Google Scholar] [CrossRef]
  92. Kane, V.R.; Bartl-Geller, B.N.; North, M.P.; Kane, J.T.; Lydersen, J.M.; Jeronimo, S.M.; Collins, B.M.; Moskal, L.M. First-entry wildfires can create opening and tree clump patterns characteristic of resilient forests. For. Ecol. Manag. 2019, 454, 117659. [Google Scholar] [CrossRef]
  93. Hesselbarth, M.H.K.; Sciaini, M.; With, K.A.; Wiegand, K.; Nowosad, J. landscapemetrics: An open-source R tool to cal-culate landscape metrics. Ecography 2019, 42, 1648–1657. [Google Scholar] [CrossRef] [Green Version]
  94. McGarigal, K. Fragstats Help. Available online: https://www.umass.edu/landeco/research/fragstats/documents/fragstats.help.4.2.pdf (accessed on 3 June 2019).
  95. Turner, M.G.; Gardner, R.H. Landscape Ecology in Theory and Practice; Springer Science and Business Media LLC: Berlin/Heidelberg, Germany, 2015. [Google Scholar]
  96. Gardner, R.H.; Milne, B.T.; Turnei, M.G.; O’Neill, R.V. Neutral models for the analysis of broad-scale landscape pattern. Landsc. Ecol. 1987, 1, 19–28. [Google Scholar] [CrossRef]
  97. Oliver, C.D.; Larson, B.A. Forest Stand Dynamics, Update Edition; John Wiley & Sons: Hoboken, NJ, USA; Yale School of the Environment: New Haven, CT, USA, 1996. [Google Scholar]
  98. Hansen, M.C.; Potapov, P.V.; Moore, R.; Hancher, M.; Turubanova, S.A.; Tyukavina, A.; Thau, D.; Stehman, S.V.; Goetz, S.J.; Loveland, T.R.; et al. High-resolution global maps of 21st-century forest cover change. Science 2013, 342, 850–853. [Google Scholar] [CrossRef] [Green Version]
  99. Larson, A.J.; Franklin, J.F. Patterns of conifer tree regeneration following an autumn wildfire event in the western Oregon Cascade Range, USA. For. Ecol. Manag. 2005, 218, 25–36. [Google Scholar] [CrossRef]
  100. Donato, D.C.; Campbell, J.L.; Franklin, J.F. Multiple successional pathways and precocity in forest development: Can some forests be born complex? J. Veg. Sci. 2012, 23, 576–584. [Google Scholar] [CrossRef]
  101. Freund, J.A.; Franklin, J.F.; Larson, A.J.; Lutz, J.A. Multi-decadal establishment for single-cohort Douglas-fir forests. Can. J. For. Res. 2014, 44, 1068–1078. [Google Scholar] [CrossRef]
  102. Larson, A.J.; Lutz, J.A.; Gersonde, R.F.; Franklin, J.F.; Hietpas, F.F. Potential site productivity influences the rate of forest structural development. Ecol. Appl. 2008, 18, 899–910. [Google Scholar] [CrossRef] [PubMed]
  103. Johnson, K.N.; Bettinger, P.; Kline, J.D.; Spies, T.A.; Lennette, M.; Lettman, G.; Garber-Yonts, B.; Larsen, T. Simulating forest structure, timber production, and socioeconomic effects in a multi-owner province. Ecol. Appl. 2007, 17, 34–47. [Google Scholar] [CrossRef]
  104. Moeur, M. Northwest Forest Plan, the First 10 Years (1994–2003): Status and Trend of Late-Successional and Old-Growth Forest; U.S. Department of Agriculture Forest Service, Pacific Northwest Research Station: Portland, OR, USA, 2005. [Google Scholar]
  105. Davis, R.J.; Ohmann, J.L.; Kennedy, R.E.; Cohen, W.B.; Gregory, M.J.; Yang, Z.; Roberts, H.M.; Gray, A.N.; Spies, T.A. Northwest Forest Plan—The First 20 Years (1994–2013): Status and Trends of Late-Successional and Old-Growth Forests; USDA Forest Service: Portland, OR, USA, 2015; Volume 911, p. 112. [Google Scholar]
  106. Spies, T.A.; Franklin, J.F. The Structure of Natural Young, Mature, and Old-Growth Douglas-Fir Forests in Oregon and Washington. In Wildlife and Vegetation of Unmanaged Douglas-Fir Forests; USDA Forest Service: Portland, OR, USA, 1991; pp. 91–109. [Google Scholar]
  107. Dunton, R. Northwestern and Coastal Oregon Record of Decision and Approved Resource Management Plan; Bureau of Land Management: Portland, OR, USA, 2016; pp. 1–308. [Google Scholar]
  108. Kamal, S.; Grodzińska-Jurczak, M.; Brown, G.K. Conservation on private land: A review of global strategies with a proposed classification system. J. Environ. Plan. Manag. 2015, 58, 576–597. [Google Scholar] [CrossRef] [Green Version]
  109. Woodley, S.; Bertzky, B.; Crawhall, N.; Dudley, N.; Londono, J.M.; MacKinnon, K.; Redford, K.; Sandwith, T. Meeting Aichi Target 11: What does success look like for protected area systems? Parks 2012, 18, 1–13. [Google Scholar]
  110. Heller, N.E.; Zavaleta, E.S. Biodiversity management in the face of climate change: A review of 22 years of recommendations. Biol. Conserv. 2009, 142, 14–32. [Google Scholar] [CrossRef]
  111. Cloughesy, M.; Woodward, J. Oregon Forest Practice Act Rules Manual. Available online: https://oregonforests.org/sites/default/files/2018-02/OFRI_IllusManual_full.pdf (accessed on 20 November 2019).
  112. Spies, T.A.; Johnson, K.N.; Burnett, K.M.; Ohmann, J.L.; McComb, B.C.; Reeves, G.H.; Bettinger, P.; Kline, J.D.; Garber-Yonts, B. Cumulative ecological and socioeconomic effects of forest policies in coastal Oregon. Ecol. Appl. 2007, 17, 5–17. [Google Scholar] [CrossRef]
Figure 1. Maps of and hectares per ownership groups (Top left, bottom left) and forest structure classes (Top right, bottom right) in the study area. Ownership types are grouped by the ownership groups identified through hierarchical classification (Section 2.5 and Section 3.2). Burn perimeters from the 1902 fires also appear on each map [54].
Forests 12 00047 g001
Figure 2. (A) Distribution of lidar metric values within each forest structure class identified in the study and transects of lidar point clouds representative of each forest structure class. These classes lie on a spectrum of structurally simple to structurally complex, evidenced by the linear increase in P95, P25, and rumple from the Initiation to Very Complex classes. (B) Boxplots of GNN stand age estimates across the six forest structure classes [88]. Stand age estimates generally increase as structural complexity increased from Initiation to Very Complex (Classes 1 through 6) classes.
Forests 12 00047 g002
Figure 3. (A) Ordination of Principal Component Analysis of forest structure classes. Ownership types are overlaid on the ordination to show their relationships with each of the forest structure classes. Ownership types are colored based on their assigned hierarchical clustering group. (B) Dendrogram of ownership types from hierarchical clustering by percent area of structure class. (C) Dendrogram of structure classes (numbers 1–6 in figure) from hierarchical clustering of lidar metrics (P95, P25, canopy cover, rumple).
Forests 12 00047 g003
Figure 4. The percentage of area in each structure class per ownership. The thirteen ownership types are grouped according to the results of the hierarchical clustering of ownership types by percentage of area in each structure class.
Forests 12 00047 g004
Figure 5. Values and influence (coefficient term) of the ownership type variable to model mean patch size and IJI for each structure class, given each property size and the proportion of that structure class within each property. Each subplot (1–6) corresponds to the six forest structure classes. Filled circles indicate mean significance for the ownership terms at p < 0.05; open circles indicate mean significance for the ownership terms at p > 0.05. Lines show the 95% confidence interval of values for the coefficient term. More negative coefficient terms indicate that mean patch size or IJI was smaller, given property size and structure class proportion, while more positive coefficient terms indicate that mean patch size or IJI was larger, given property size and structure class proportion.
Forests 12 00047 g005
Figure 6. Values of mean patch size and interspersion and juxtaposition index for the 13 ownership types. Each point represents the value of one of the thirteen ownership types, but for ease of visualization, symbols and colors denote one of the four ownership groups. Mean patch size is on a log scale but to aid in interpretation the y-axis labels are not transformed.
Forests 12 00047 g006
Publisher’s Note: MDPI stays neutral with regard to jurisdictional claims in published maps and institutional affiliations.

