Abstract
Leaf shape is closely related to economics of leaf support and leaf functions, including light interception, water use, and CO2 uptake, so correct quantification of leaf shape is helpful for studies of leaf structure/function relationships. There are some extant indices for quantifying leaf shape, including the leaf width/length ratio (W/L), leaf shape fractal dimension (FD), leaf dissection index, leaf roundness index, standardized bilateral symmetrical index, etc. W/L ratio is the simplest to calculate, and recent studies have shown the importance of the W/L ratio in explaining the scaling exponent of leaf dry mass vs. leaf surface area and that of leaf surface area vs. leaf length. Nevertheless, whether the W/L ratio could reflect sufficient geometrical information of leaf shape has been not tested. The FD might be the most accurate measure for the complexity of leaf shape because it can characterize the extent of the self-similarity and other planar geometrical features of leaf shape. However, it is unknown how strongly different indices of leaf shape complexity correlate with each other, especially whether W/L ratio and FD are highly correlated. In this study, the leaves of nine Magnoliaceae species (>140 leaves for each species) were chosen for the study. We calculated the FD value for each leaf using the box-counting approach, and measured leaf fresh mass, surface area, perimeter, length, and width. We found that FD is significantly correlated to the W/L ratio and leaf length. However, the correlation between FD and the W/L ratio was far stronger than that between FD and leaf length for each of the nine species. There were no strong correlations between FD and other leaf characteristics, including leaf area, ratio of leaf perimeter to area, fresh mass, ratio of leaf fresh mass to area, and leaf roundness index. Given the strong correlation between FD and W/L, we suggest that the simpler index, W/L ratio, can provide sufficient information of leaf shape for similarly-shaped leaves. Future studies are needed to characterize the relationships among FD and W/L in leaves with strongly varying shape, e.g., in highly dissected leaves.
1. Introduction
Higher plants usually have a hierarchical leaf venation network and broad leaves. Leaf shape can be represented by the ratio of leaf width to length for many higher plants, and it shows a correlation with the geometric characteristics of leaf venation network. Leaf shapes of eudicots exhibit a high degree of complexity, and the shape complexity is associated with leaf venation patterns [1]. Leaf venation architecture is further intimately associated with leaf hydraulics and water supply [2]. Parallel vein patterns with stomata distributed linearly in intercostal areas along the veins are found in Poaceae plants, while hierarchical reticulate venation network with regular or homogenous Poisson random stomatal distribution are found in many eudicots. The hierarchical reticulate venation is considered as an evolutionary “innovation” [3], because it reduces hydraulic transport distance from leaf veins to stomata and water resistance through mesophyll cells [4]. As a result, the hierarchical reticular venation can support wider leaves, and the mesophyll cells may be farther away from the midrib due to the advanced leaf venation network. However, leaf width cannot increase indefinitely, because of the increase in energy losses with increasing the number of hierarchical orders [5]. In leaf evolution, the variation in leaf width is usually smaller than that in leaf length for the limitation of a leaf vein network. Su et al. [6] found that the simplified Gielis equation [7] can describe the leaf shapes of many broad-leaved plants, and leaf width was more accurately predicted than leaf length by that equation, which implies the evolutionary conservatism of leaf width. It is worth noting that leaf area is proportional to the product of leaf length and width [8]. As a result, the mean and variance of the ratio of leaf width to length have significant influences on the photosynthetic capacity of plants, considering that these two factors are directly related to leaf surface area and to the scaling between leaf area and leaf length [8,9]. Lin et al. [10] studied the leaf scaling of 101 species, forms, cultivars, and varieties of bamboo, and found that a larger leaf width/length ratio resulted in a smaller scaling exponent of leaf dry mass vs. leaf surface area. This exponent decreases towards 1, with the leaf width/length ratio increasing. This indicates that wider leaves can reduce or avoid the loss of diminishing returns, which is a phenomenon that the increment of leaf area tends to decrease with leaf dry mass increasing for many broad-leaved plants [11]. In other words, wider leaves may have an economic support structure and investment, which implies that plants with wider leaves can save more energy to invest to other parts of plants.
In mathematics, fractal geometry is an important mathematical branch of measure theory. Geometric fractals are “a rough or fragmented geometric shape that can be split into parts, each of which is (at least approximately) a reduced-size copy of the whole” [12]. A fractal dimension (FD) is a value that can account for how a fractal pattern changes with the scale at which it is measured. It can be also used to measure how a fractal pattern scales differently from the topological space it is embedded in (i.e., the space-filling capacity of a pattern) [13,14]. In the two-dimensional Euclidean space, FD is an important measure for the extent of the self-similarity of a space-filling planar network, which lies in a range of 1 to 2. The box-counting method is a popular approach for calculating the fractal dimension that describes a power relationship between the box size and the number of boxes that includes at least one pixel of the network of interest in an image, and the absolute slope of the straight line (i.e., the linearized power-law relationship) is the estimate of the fractal dimension [15]. For a planar geometric shape, we can define a group of boxes with different sizes (e.g., squares with different side lengths). Let δ denote the size of the box. We can use some boxes with the same size to intersect the image of the geometric shape. Then we can obtain the number of boxes (N) that includes at least a pixel of the geometric shape. There is a power-law relationship between N and δ, i.e.,, where the absolute value of the estimated b is FD of the geometric shape [15]. Some investigators have tried to analyze the hierarchical reticulate leaf venations for several flat broad-leaved plants using the box-counting approach [16,17]. However, the hierarchical reticulate leaf veins are usually so dense that the box-counting approach for calculation of leaf vein fractal dimension can fail because the smallest box inside a leaf, which can ensure a scaling relationship of the number of boxes vs. box size, always includes a vein pixel. In that case, the calculated fractal dimensions provide estimates of leaf shape rather than leaf venation network.
Although leaf shape has been considered as an important factor influencing leaf photosynthetic performance via altering leaf support costs and leaf temperature [10,18,19], in previous studies, FD has been little used to quantify leaf shape, probably because of the difficulties in using the box-counting approach. Instead, the ratio of leaf width to length, leaf roundness index (or leaf dissection index, the square root of the reciprocal of leaf roundness), leaf perimeter to area ratio, and other indices, such as the standardized index for leaf bilateral symmetry, have been used to characterize the complexity of leaf shape [10,20,21,22,23]. However, how FD is associated with these leaf shape indices has not been investigated. In this paper, we studied nine Magnoliaceae species with typical reticulate leaf venation to determine if correlations between leaf indices related to leaf shape and size (including the leaf fresh mass, surface area, perimeter/area ratio, leaf roundness index, leaf length, and leaf width/length ratio) and leaf shape fractal dimension (FD) hold true. We choose to work with these species based on the following two considerations: (i) the important role of leaf width in reticulate leaf venation patterns that has been demonstrated to largely influence the hydraulic resistance of the mesophyll cells on water transport from the midrib to leaf margins [4], and (ii) the similarity in leaf shape among the investigated nine Magnoliaceae plants, simplifying the comparison in leaf shape measures (i.e., the leaf width/length ratio and FD) among different species.
2. Materials and Methods
2.1. Materials
Nine Magnoliaceae species (four Magnolia species plus five Michelia species) with similar-shaped leaves were chosen for the study (Table 1). There is evidence that climatic factors, especially temperature and precipitation, can significantly affect leaf size and leaf shape [24,25,26,27]. To avoid environmental influences on leaf shape indices, we sampled leaves of the nine species growing at two nearby sites of the same city (see Table 1 for species names and collection information of the plants investigated). For each of nine Magnoliaceae species, 147−360 leaves were collected from the middle canopy of 3−10 healthy adult trees. Figure 1 exhibits one leaf example for each species.

Table 1.
Species collection information.
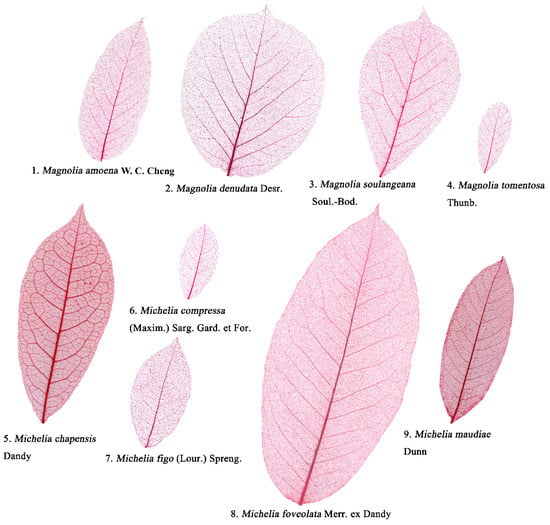
Figure 1.
Examples in chemically-cleared leaves of nine Magnoliaceae species.
2.2. Leaf Fresh Mass Measurements and Leaf Vein Extraction
First, leaf surface was cleaned when needed, and the fresh mass of each leaf was measured using an electronic balance (ME204−02, Mettler Toledo, Greifensee, Switzerland; measurement accuracy 0.0001 g). Second, the leaves were boiled in a 5−10% NaOH solution in a stainless steel pot (ST24P1, Supor, Wuhan, China; diameter: 28 cm; capacity: 1.2 L) until mesophyll could be easily separated from leaf veins. An induction cooker (SDHCB9E88-210, Supor, Hangzhou, China; power: 120 W−2100 W) was used for heating. Third, the softened leaves were placed in fresh water, and a soft brush was used to gently clear out mesophyll, brushing along leaf vein directions from midrib towards the edges. Fourth, the intact leaf venation network without mesophyll was stained by a 5% safranin solution for at least two hours. Fifth, the stained leaf veins were further washed in distilled water and dried by air.
2.3. Image Processing
Leaf vein networks were scanned at 600 dpi on a white background using a scanner (V550, Epson Indonesia, Batam, Indonesia). The original RGB images were transformed to grayscale images with Photoshop (CS2, Adobe, San Jose, United States). We used the statistical software R (version 4.0.2) [28] and the “spatstat” package (version 1.61-0) to extract all pixels of leaf veins.
2.4. Calculations of the Fractal Dimension of Leaf Shape
The box-counting approach uses a group of boxes (squares for simplicity) with different sizes (δ) to divide the leaf vein image into different parts. Let N represent the number of boxes that at least include a pixel of leaf vein. Then using the scaling of ln(N) vs. ln(δ) to calculate the fractal dimension (FD), which assumes a linear relationship between them:
The FD is equal to |b|. We calculated the estimates of two model parameters, their standard errors, 95% confidence intervals, and the coefficient of determination (r2) as the measure of the goodness of fit. Considering that the boxes with a too-small size may lead to a serious deviation of the data of ln N vs. ln(δ) from a straight line, z/δ was set to range from 2 to 20 by increments of 1 (i.e., δ ranged from z/20 to z/2), respectively, where z represents the maximum between the x-coordinate range and the y-coordinate range of leaf vein pixels. Figure 2 shows four examples of different box sizes.
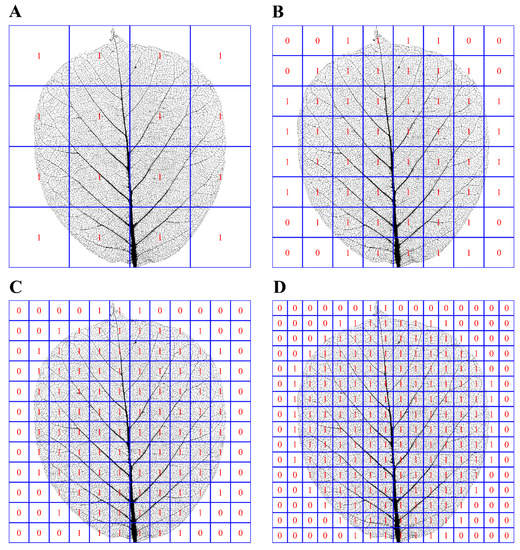
Figure 2.
A leaf shape example of Magnolia denudata Desr. for counting the number of boxes that at least include a leaf vein pixel (which were marked with 1). The x-range of leaf vein pixels is 9.99 cm, and the y-range of leaf vein pixels is 11.42 cm. Let us define the maximum between the two ranges as z, so z = 11.42 cm. Panels (A−D) represent that box size (i.e., the length of the side of the square, represented by δ) = z/4, z/8, z/12, and z/16, respectively. The corresponding numbers of boxes that at least include a leaf vein pixel are 16, 53, 104, and 179, respectively. In actual calculations, δ was set to range from z/20, z/19, z/18, …, to z/2 points to estimate the slope of the linear equation of ln(N) vs. ln(δ). In this range, the linear trends are all apparent for all leaves investigated.
2.5. Measures of Leaf Area, Perimeter, Roundness Index, Length, and Width
We used Photoshop to fill all the pixels within the blade margin, forming a black–white bmp image. Then, we used the developed Matlab procedure and R script [6,29] to extract the leaf margin planar coordinates and to calculate leaf surface area (A), perimeter (P), length (L), and width (W). The leaf roundness index (RI) was calculated as:
2.6. Statistical Analyses
ANOVA with the Tukey’s honestly significant difference (HSD) test [30] with a 0.05 significance level was used to compare the significance of difference between any two groups of the fractal dimensions, or between any two groups of the leaf W/L ratios. The correlation coefficients between FD and other leaf measures related to leaf shape and size (including leaf fresh mass, area, the leaf perimeter/area ratio, the leaf fresh mass/area ratio, leaf roundness index, and leaf length) were calculated to check for statistical relationships among the traits. Correlations were considered significant at p < 0.05. R (version 4.0.2) [28] was used to conduct all statistical analyses and to draw the figures to show the comparison between the actual observations and the theoretical predictions based on linear regressions.
3. Results
The leaves of the nine Magnoliaceae species are characterized by a number of similar features, including elliptical to obovate shape with elongated leaf tip (Figure 1), although the shape variability is larger than for species from other plant groups, such as for different bamboo species [10]. Nevertheless, the leaf shape of the studied Magnoliaceae species is almost bilaterally symmetric with smooth margins and without lobes, different from species with more complex leaves, such as Liriodendron and Liquidambar species or several Acer species. Thus, comparisons of the capacity of leaf width/length (W/L) ratio and leaf fractal dimension (FD) in characterizing leaf shape across the species studied and among individual species should be possible.
For all individual leaves of the nine species, there were strong and significant linear relationships between the logarithm of the box size and the number of boxes that at least include a pixel of leaf lamina (the coefficient of determination, r2, ranged from 0.9838 to 0.9994, and p < 0.05 for all slopes; Table S1 in the online Supplementary Materials). The slopes (i.e., the negative values of the FD values) ranged from −1.90 to −1.48, and the standard errors of the slopes ranged from 0.01 to 0.05 (Table S1; also see Figure 3 for the fitted results for the FD values of the nine individual leaf examples).
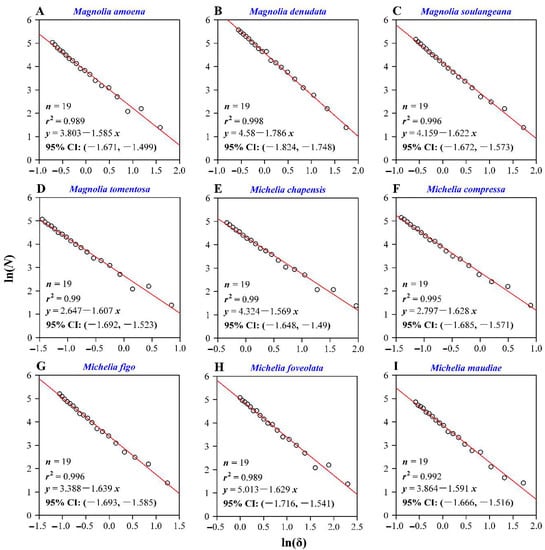
Figure 3.
Calculations of the leaf shape fractal dimension for the nine examples (A−I). Here, δ represents the box size (i.e., the length of a side of a square); N represents the number of boxes, and each box includes at least one leaf vein pixel; n represents the sample size for each species; r2 is the coefficient of determination. The absolute value of the slope represents the leaf shape fractal dimension (FD), and 95% CI represents the 95% confidence intervals of the slope. In our study, there are many replicates of leaves for each species, and for each leaf there was a linear fit to obtain the corresponding FD value (i.e., the absolute value of the slope). Because of the limitation of space, we only exhibited the nine fitted results corresponding to the nine leaf examples shown in Figure 1. Table S1 tabulated the fitted results for the remaining leaves investigated.
There were significant differences in the leaf W/L ratios among the nine Magnoliaceae species (Figure 4A), and similar differences were found for the calculated FD values (Figure 4B). Magnolia denudata had the largest W/L ratio, and also had the largest leaf fractal dimension; M. amoena and Michelia chapensis had the smallest W/L ratios, and also the smallest FD values (Figure 4). We found that, both for each species and for all species combined, there were significant correlations between the W/L ratio and FD (Figure 5; Figure 6). For M. maudiae, the correlation coefficient reached 0.932 (Figure 4I). For the pooled data of the nine species, the correlation coefficient reached 0.893 (Figure 6). These correlations indicated that relative wider leaves had larger FD values.
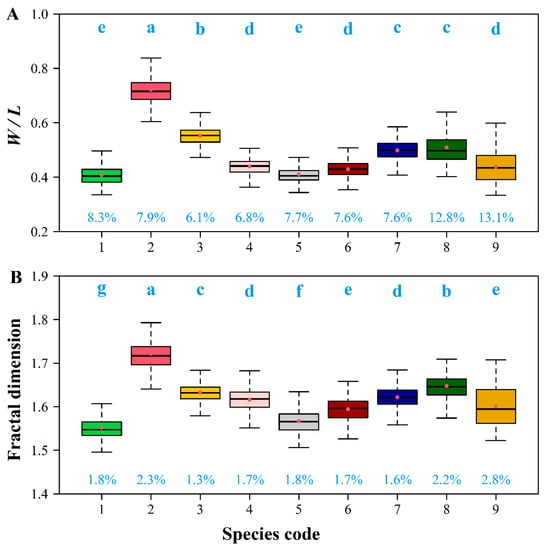
Figure 4.
Boxplots of the ratio of leaf width to length (A, W/L ratio) and leaf shape fractal dimension (B, FD). The same lowercase letters indicate no significant difference in the W/L ratio or FD between any two species; the numbers represents the variation coefficients of the W/L ratio or FD.
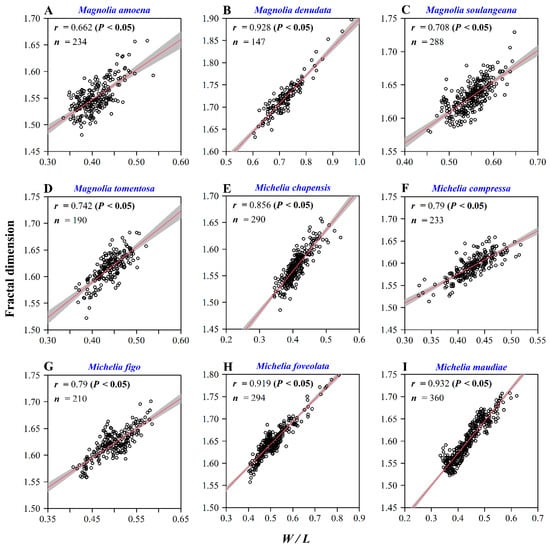
Figure 5.
Correlation analysis for the ratio of leaf width to length and the leaf shape fractal dimension. Here, r is the correlation coefficient, and n represents the sample size. Panels (A−I) represent different Magnoliaceae species.
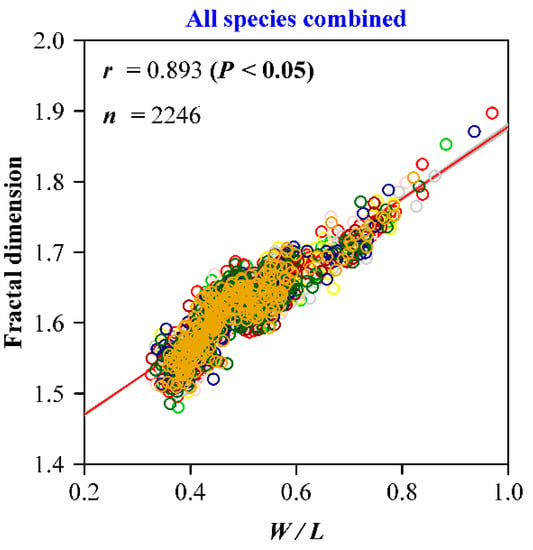
Figure 6.
Correlation analysis for the ratio of leaf width to length and the leaf shape fractal dimension for all species combined. Here, r is the correlation coefficient, and n represents the sample size.
However, except for leaf length, other leaf measures related to leaf shape and size (including leaf fresh mass, area, the perimeter/area ratio, the leaf fresh mass/area ratio) were not correlated, or were weakly correlated, with the leaf fractal dimension (FD) (Table 2). Leaf roundness index was positively correlated with FD in six out of nine species, although most relatively weakly (Table 2). Correspondingly, leaf roundness index was also positively correlated with the W/L ratio in five out of the six species (Table 2). However, the correlation coefficients between FD and leaf roundness index, and between roundness index and the W/L ratio, are both lower than that between FD and the W/L ratio.

Table 2.
The correction coefficients between leaf shape fractal dimension (FD) and each of the following leaf indices and the corresponding p values.
This work confirms that the W/L ratio has an intimate association with the geometrical features and the self-similarity of leaf shape. This can act as an important index for quantifying leaf shape to replace FD that requires a lot of complex calculations.
4. Discussion
4.1. Leaf Shape Fractal Dimension Versus Leaf Margin Fractal Dimension
The fractal dimension (FD) of leaf shape can reflect the complexity and self-similarity of leaf shape, which is apparently a good measure for quantifying leaf shapes of different plants. In our results, leaf length showed a strong negative correlation with FD, and the nine correlation coefficients ranged from −0.55 to −0.22. Eight of nine correlation coefficients between the leaf width/length (W/L) ratio and FD ranged from 0.70 to 0.95, and only one was smaller than 0.7 (r = 0.66; Table 2), indicating that both measures provide a valid measure of leaf shape for similarly-shaped leaves. Although leaf length had a strong scaling relationship with leaf surface area for many broad-leaved plants [8], FD was weakly correlated with leaf surface area. This is similar to the W/L ratio that usually is independent of leaf area. Although leaf dissection index or leaf roundness index [23] can consider leaf perimeter and area in quantifying leaf shape, the self-similarity of leaf shape was only moderately associated with leaf roundness index (Table 2). For instance, the leaves of Quercus crenata Lam. have several round lobes. The leaf dissection index [23] can only reflect a ratio of leaf perimeter (that is affected by the round lobes) to the square root of leaf area, but it cannot measure the self-similarity of lobes in geometric characteristics. However, such a self-similarity exists for the leaves of other plants (e.g., Platanus orientalis L.) besides the plants of Quercus (Fagaceae). Musarella et al. [17] computed the FD values of leaf venation network of seven Quercus species in Southern Italy, and most calculated FD values ranged from 1.35 to 1.95. However, after checking the leaf venation network they showed, they actually calculated the FD values of leaf shape, not the FD values of leaf venation network. The minor veins (>3 orders) were very dense (see Figure 2 in [17]), and it is hard to find a sufficiently small box to exclude any leaf vein pixel in practice. If the box were set to be very small, the box-counting approach would have been invalid to exhibit a linear relationship between the number of boxes and box size on a log–log plot. The range of their calculated FD value also demonstrated this point. Our calculated FD values of leaf shape for nine Magnoliaceae species fell into such a range. Based on the edge coordinates of the leaves of Magnoliaceae plants investigated, for each leaf, we filled the inside of the leaf with white and filled the outside of the leaf with black. Using the box-counting method, we got the FD values which are approximate to those based on the chemically-cleared leaves (i.e., leaf venation network images). The average FD value (=1.61) of the nine Magnoliaceae species in the present study is approximate to that (=1.59) of the seven Quercus species reported in Musarella et al. [17]. Leaf area (A) for most broad-leaved plants is proportional to the product of leaf length (L) and width (W), and the proportionality coefficients usually lie in a range of 1/2 to π/4 [8,9]. Thus, we have . Assume that the length of a side of the window is exactly equal to the leaf length, where the window represents the smallest square (namely a box) that can include the lamina, the fractal dimension of leaf shape is proportional to the lamina area/the window area. Because the proportionality coefficient between A and LW lies in a small range, it might lead to the numerical approximation in leaf shape fractal dimensions between different families of plants.
Camarero et al. [31] studied leaf margin fractal dimensions of 12 Quercus species. In their study, leaf margin was extracted, rather than the whole leaf. Thus, the calculated FD values are fairly small, and ranged from 1.07 to 1.17. However, our work is different from this study. We defined leaf shape as the whole blade profile instead of only leaf margin. Thus, the outside and inside of a leaf can be apparently distinguished. The calculated FD values of leaf margin in [31] may be intimately associated with leaf perimeter. Considering that there were strong scaling relationships between leaf surface area and leaf perimeter [32], their FD values should be also closely related to leaf surface area, which has been demonstrated to be a power-law function of leaf perimeter. Thus, their calculated FD values are dependent on leaf size, and should have a strong correlation with area. Overall, FD of leaf margin cannot provide full 2D geometric information of a leaf. Instead, it only reflects leaf margin (a pure curve) information.
4.2. Is It Possible to Calculate Leaf Vein Fractal Dimension by Setting Several Boxes of Small Sizes?
If a reticulate leaf venation network is very dense, it is difficult to correctly calculate its leaf vein fractal dimension. There is no problem to calculate FD of leaf shape. However, for a reticulate leaf venation network with many areoles with small sizes (Figure 1), FD appears to be unsuitable for describing the geometric features of such a network because fractal characteristics of the main veins (i.e., the first to third order veins) have been largely obscured by dense higher-order veins (i.e., the minor veins). After all, the box-counting method does not consider the thickness of veins of different orders. Figure 7 shows the data of ln(N) vs. ln(δ), where N represents the boxes that include at least one pixel of leaf vein, and δ represents the size of a box. In this figure, z/δ ranges from 20 to 2000 in 20 increments (i.e., δ ranges from z/2000 to z/20), where z represents the maximum between the x-coordinate range and the y-coordinate range of leaf vein pixels. The log-transformed data apparently deviate from a linear assumption when the sizes of boxes are small. Thus, it is unsuitable to use the absolute value of the estimated slope to represent leaf vein FD. However, it is feasible to calculate FD of the main veins (e.g., from the first order to third order leaf veins that form an apparent fractal structure).
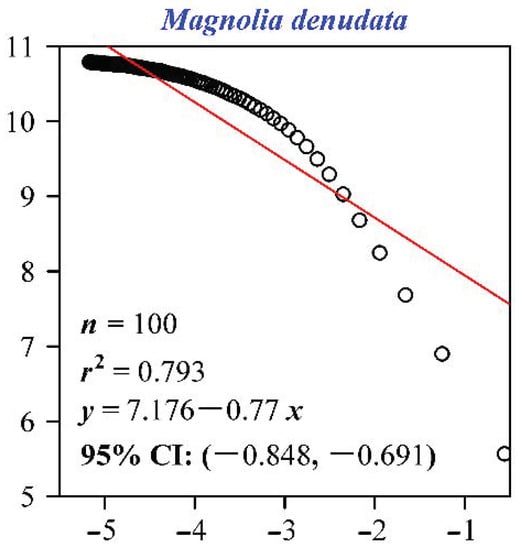
Figure 7.
Sample calculations of the leaf vein fractal dimension. Here, δ represents the box size; N represents the number of boxes, and each box includes at least one leaf vein pixel; n represents the number of box sizes for each leaf; r2 is the coefficient of determination. The absolute value of the slope represents the leaf shape fractal dimension, and 95% CI represents the 95% confidence intervals of the slope. In this example, the length of a side of the candidate box ranges from z/2000 to z/20, where z represents the maximum between the x-coordinate range and the y-coordinate range of leaf vein pixels.
5. Conclusions
We studied the leaf shape fractal dimensions (FD) of nine Magnoliaceae species with typical hierarchical reticulate leaf venation patterns. There were significant positive correlations between FD and the W/L ratio both for each species and all species combined. A larger W/L ratio was associated with a larger FD value. Leaf roundness index exhibited a certain correlation with FD, and the W/L ratio as well. There were weak or nonsignificant correlations between other leaf measures related to leaf shape and size (including the leaf fresh mass, surface area, perimeter/area ratio, leaf fresh mass/area ratio, and leaf roundness index) and FD. Although leaf length was significantly negatively corrected to FD, the correlation coefficient was lower than that between the W/L ratio and FD for each studied species. In addition, it is worth noting that there was no correlation between FD and leaf surface area, which implies that FD can be regarded to be independent from leaf area. Thus, considering that FD can well quantify leaf shape complexity and self-similarity, the strong correlations between FD and W/L ratio support the use of the W/L ratio to quantify and compare similar leaf shapes of different species or different individuals of the same species. Considering that many higher plants have hierarchical reticulate leaf venation patterns, the results of the present study can be potentially extended to other broad-leaved plants. The leaf W/L ratio can be used to approximate FD for reflecting the degrees of leaf shape self-similarity and complexity. It indicates the influence of leaf shape on leaf venation patterns. This study provides a useful tool for quantifying the leaf shape complexity, and implies the importance of leaf width, relative to leaf length, in constraining the geometric characteristics of the reticulate venation system.
Supplementary Materials
The following are available online at https://www.mdpi.com/1999-4907/12/1/41/s1, Table S1: Leaf measures and fitted results for leaf shape fractal dimensions.
Author Contributions
P.S. and J.G. designed this work; K.Y. carried out the experiment; P.S. wrote the initial draft of this manuscript; Ü.N. and J.G. revised the manuscript. All authors have read and agreed to the published version of the manuscript.
Funding
This research received no external funding.
Acknowledgments
We thank Mengdi Liu, Xingjian Liu, Yirong Li, Rolf Turner, Rong Wang and Jianhui Xue for their important help in this work. We also thank two anonymous reviewers for their invaluable comments on the earlier version of this manuscript.
Conflicts of Interest
The authors declare no conflict of interest.
References
- Runions, A.; Tsiantis, M.; Prusinkiewicz, P. A common developmental program can produce diverse leaf shapes. New Phytol. 2017, 216, 401–418. [Google Scholar] [CrossRef] [PubMed]
- Brodribb, T.J.; Feild, T.S.; Sack, L. Viewing leaf structure and evolution from a hydraulic perspective. Funct. Plant Biol. 2010, 37, 488–498. [Google Scholar] [CrossRef]
- Carvalho, M.R.; Losada, J.M.; Niklas, K.J. Phloem networks in leaves. Curr. Opin. Plant Biol. 2018, 43, 29–35. [Google Scholar] [CrossRef] [PubMed]
- Brodribb, T.J.; Feild, T.S.; Jordan, G.J. Leaf maximum photosynthetic rate and venation area linked by hydraulics. Plant Physiol. 2007, 144, 1890–1898. [Google Scholar] [CrossRef] [PubMed]
- West, G.B.; Brown, J.H.; Enquist, B.J. A general model for the origin of allometric scaling laws in biology. Science 1997, 276, 122–126. [Google Scholar] [CrossRef] [PubMed]
- Su, J.; Niklas, K.J.; Huang, W.; Yu, X.; Yang, Y.; Shi, P. Lamina shape does not correlate with lamina surface area: An analysis based on the simplified Gielis equation. Glob. Ecol. Conserv. 2019, 19, e00666. [Google Scholar] [CrossRef]
- Gielis, J. A generic geometric transformation that unifies a wide range of natural and abstract shapes. Am. J. Bot. 2003, 90, 333–338. [Google Scholar] [CrossRef]
- Shi, P.; Liu, M.; Ratkowsky, D.A.; Gielis, J.; Su, J.; Yu, X.; Wang, P.; Zhang, L.; Lin, Z.; Schrader, J. Leaf area-length allometry and its implications in leaf-shape evolution. Trees Struct. Func. 2019, 33, 1073–1085. [Google Scholar] [CrossRef]
- Yu, X.; Shi, P.; Schrader, J.; Niklas, K.J. Nondestructive estimation of leaf area for 15 species of vines with different leaf shapes. Am. J. Bot. 2020, 107, 1481–1490. [Google Scholar] [CrossRef]
- Lin, S.; Niklas, K.J.; Wan, Y.; Hölscher, D.; Hui, C.; Ding, Y.; Shi, P. Leaf shape influences the scaling of leaf dry mass vs. area: A test case using bamboos. Ann. For. Sci. 2020, 77, 11. [Google Scholar] [CrossRef]
- Niklas, K.J.; Cobb, E.D.; Niinemets, Ü.; Reich, P.B.; Sellin, A.; Shipley, B.; Wright, I.J. ‘Diminishing returns’ in the scaling of functional leaf traits across and within species groups. Proc. Natl. Acad. Sci. USA 2007, 104, 8891–8896. [Google Scholar] [CrossRef] [PubMed]
- Mandelbrot, B.B. The Fractal Geometry of Nature; W.H. Freeman: New York, NY, USA, 1982. [Google Scholar]
- Falconer, K. Fractal Geometry: Mathematical Foundations and Applications, 2nd ed.; John Wiley & Sons: New York, NY, USA, 2003. [Google Scholar]
- Sagan, H. Space-Filling Curves; Springer: Berlin/Heidelberg, Germany, 1994. [Google Scholar]
- Vico, P.G.; Kyriacos, S.; Heymans, O.; Louryan, S.; Cartilier, L. Dynamic study of the extraembryonic vascular network of the chick embryo by fractal analysis. J. Theor. Biol. 1998, 195, 525–532. [Google Scholar] [CrossRef] [PubMed]
- de Araujo Mariath, J.E.; dos Santos, R.P.; dos Santos, R.P. Fractal dimension of the leaf vascular system of three Relbunium species (Rubiaceae). Braz. J. Biosci. 2010, 8, 30–33. [Google Scholar]
- Musarella, C.M.; Cano-Ortiz, A.; Piñar Fuentes, J.C.; Navas-Ureña, J.; Pinto Gomes, C.J.; Quinto-Canas, R.; Cano, E.; Spampinato, G. Similarity analysis between species of the genus Quercus L. (Fagaceae) in southern Italy based on the fractal dimension. PhytoKeys 2018, 113, 79–95. [Google Scholar] [CrossRef] [PubMed]
- Niinemets, Ü. Adjustment of foliage structure and function to a canopy light gradient in two co-existing deciduous trees. Variability in leaf inclination angles in relation to petiole morphology. Trees Struct. Funct. 1998, 12, 446–451. [Google Scholar] [CrossRef]
- Niinemets, Ü.; Portsmuth, A.; Tobias, M. Leaf shape and venation pattern alter the support investments within leaf lamina in temperate species, a neglected source of leaf physiological differentiation. Funct. Ecol. 2007, 21, 28–40. [Google Scholar] [CrossRef]
- Kincaid, D.T.; Schneider, R.B. Quantification of leaf shape with a microcomputer and Fourier transform. Can. J. Bot. 1983, 61, 2333–2342. [Google Scholar] [CrossRef]
- Santiago, L.S.; Kim, S.C. Correlated evolution of leaf shape and physiology in the woody Sonchus alliance (Asteraceae: Sonchinae) in Macaronesia. Int. J. Plant Sci. 2009, 170, 83–92. [Google Scholar] [CrossRef]
- Shi, P.; Zheng, X.; Ratkowsky, D.A.; Li, Y.; Wang, P.; Cheng, L. A simple method for measuring the bilateral symmetry of leaves. Symmetry 2018, 10, 118. [Google Scholar] [CrossRef]
- Shi, P.; Niinemets, Ü.; Hui, C.; Niklas, K.J.; Yu, X.; Hölscher, D. Leaf bilateral symmetry and the scaling of the perimeter vs. the surface area in 15 vine species. Forests 2020, 11, 246. [Google Scholar] [CrossRef]
- Royer, D.L.; Wilf, P. Why do toothed leaves correlate with cold climates? Gas exchange at leaf margins provides new insights into a classic paleotemperature proxy. Int. J. Plant Sci. 2006, 167, 11–18. [Google Scholar] [CrossRef]
- Peppe, D.J.; Royer, D.L.; Cariglino, B.; Oliver, S.Y.; Newman, S.; Leight, E.; Enikolopov, G.; Fernandez-Burgos, M.; Herrera, F.; Adams, J.M.; et al. Sensitivity of leaf size and shape to climate: Global patterns and paleoclimatic applications. New Phytol. 2011, 190, 724–739. [Google Scholar] [CrossRef] [PubMed]
- Royer, D.L.; Peppe, D.J.; Wheeler, E.A.; Niinemets, Ü. Roles of temperature and life-history traits in controlling toothed vs. untoothed leaf margins. Am. J. Bot. 2012, 99, 915–922. [Google Scholar] [CrossRef] [PubMed]
- Wright, I.J.; Dong, N.; Maire, V.; Prentice, I.C.; Westoby, M.; Díaz, S.; Gallagher, R.V.; Jacobs, B.F.; Kooyman, R.; Law, E.A.; et al. Global climatic drivers of leaf size. Science 2017, 357, 917–921. [Google Scholar] [CrossRef] [PubMed]
- R Core Team. R: A Language and Environment for Statistical Computing; R Foundation for Statistical Computing: Vienna, Austria, 2020; Available online: https://www.R-project.org/ (accessed on 1 July 2020).
- Shi, P.; Ratkowsky, D.A.; Li, Y.; Zhang, L.; Lin, S.; Gielis, J. General leaf-area geometric formula exists for plants—Evidence from the simplified Gielis equation. Forests 2018, 9, 714. [Google Scholar] [CrossRef]
- Hsu, J.C. Multiple Comparisons: Theory and Methods; Chapman and Hall/CRC: New York, NY, USA, 1996. [Google Scholar]
- Camarero, J.J.; Sisó, S.; Gil-Pelegrín, E. Fractal dimension does not adequately describe the complexity of leaf margin in seedlings of Quercus species. Anales Jard. Bot. Madrid 2003, 60, 63–71. [Google Scholar] [CrossRef]
- Liu, M.; Niklas, K.J.; Niinemets, Ü.; Hölscher, D.; Chen, L.; Shi, P. Comparison of the scaling relationships of leaf biomass versus surface area between spring and summer for two deciduous tree species. Forests 2020, 11, 1010. [Google Scholar] [CrossRef]
Publisher’s Note: MDPI stays neutral with regard to jurisdictional claims in published maps and institutional affiliations. |
© 2020 by the authors. Licensee MDPI, Basel, Switzerland. This article is an open access article distributed under the terms and conditions of the Creative Commons Attribution (CC BY) license (http://creativecommons.org/licenses/by/4.0/).