Abstract
Height is a key trait in the indices applied when selecting genotypes for use in both tree breeding populations and production populations in seed orchards. Thus, measurement of tree height is an important activity in the Swedish Norway spruce breeding program. However, traditional measurement techniques are time-consuming, expensive, and often involve work in bad weather, so automatization of the data acquisition would be beneficial. Possibilities for such automatization have been opened by advances in unmanned aerial vehicle (UAV) technology. Therefore, to test its applicability in breeding programs, images acquired by a consumer-level UAV (DJI Phantom 4 Pro V2.0) system were used to predict the height and breast height diameter of Norway spruce trees in a 12-year-old genetic field trial established with 2.0 × 2.0 m initial spacing. The tree heights were also measured in the field using an ultrasonic system. Three additive regression models with different numbers of predictor variables were used to estimate heights of individual trees. On stand level, the average height estimate derived from UAV data was 2% higher than the field-measured average. The estimation of family means was very accurate, but the genotype-level accuracy, which is crucial for selection in the Norway spruce breeding program, was not high enough. There was just ca. 60% matching of genotypes in groups selected using actual and estimated heights. In addition, heritability values calculated from the predicted values were underestimated and overestimated for height and diameter, respectively, with deviations from measurement-based estimates ranging between −19% and +12%. However, the use of more sophisticated UAV and camera equipment could significantly improve the results and enable automatic individual tree detection.
1. Introduction
Accurate measures of individual trees’ growth and wood quality traits are essential for the robust calculation of the genetic parameters and breeding values required for efficient tree breeding programs. For Norway spruce (Picea abies L. Karst) in Sweden, trees’ diameter and height are the most important traits to measure because the main breeding goal (apart from maintenance or enhancement of general vitality) is to increase volume production. Spring phenology and stem and wood quality traits are also considered, in efforts to ensure that planting materials will be adapted to the anticipated climate during their growth and produce wood with desired properties [1].
A typical genetic trial in the Norway spruce breeding program includes ca. 7000 cloned seedlings from around 50 full-sib families. The trees are planted with 2 × 2 m spacing, then their height and diameter are measured at the ages of 6 and 12 years. Two types of stem damage, double tops and spike knots, are registered during the fieldwork because they significantly impair wood quality. A measuring pole is used for the first measurement of tree height at six years. However, at 12 years, the trees are usually more than 6 m tall, and manual measurements are not cost-effective. Thus, their heights are measured by an ultrasonic system, but it is usually very challenging to identify the treetops in very dense stands. The acquisition of height measurements of all trees at 12 years also requires costly work of pairs of people in difficult conditions, and the accuracy of traditional measurements with measuring poles, clinometers, and laser range finders is not always satisfactory. For example, phenotypic correlations of 0.9462–0.950 and 0.9250–0.9293 were obtained in a study of relations between manually measured tree heights and estimates acquired with a clinometer and laser range finder, respectively [2]. In addition, in a study of tree height measurements obtained with a Vertex III digital hypsometer, a standard error of 0.3 m was obtained for ca. 10 m tall trees, with variations associated (inter alia) with the experience of measurement teams, weather conditions, and working time [3]. Moreover, the absolute measurement error is multiplicative, increasing with the tree height.
From a breeding and selection perspective, accurate measurements of tree heights at the age of 12 years would be highly valuable for the prediction of tested genotypes’ breeding values (BVs), which would be more precise if more phenotypic data about genotypes were available. The current procedure for BV prediction involves the use of a matrix of genetic correlations among observed selection traits. For Norway spruce, the average correlation between diameter and height at 12 years of age is reportedly ca. 0.8 [4]. However, this average is based on a limited number of field experiments, as height at 12 years is not usually measured. Thus, more individual tree height data would be valuable for improving estimates of correlations between traits. Moreover, in addition to assisting breeding and selection, accurate measurement of individual trees’ heights would be helpful for improving predictions of their taper, and hence, predictions of both single trees’ volumes and areal productivity. Taper also influences other traits, such as wind stability and risks of snow breaks. Currently, estimates of taper are based on measurements of 20 sample trees in experiments where both diameter and height are measured. Thus, the scarcity of field measurements of tree-level traits (relative to the abundance of material) is a clear limitation in modeling, prediction, and hence, breeding programs.
In recent years, the use of unmanned aerial vehicles (UAVs) in forestry applications has been growing continuously due to technological advances in avionics and data processing capabilities that have rapidly increased their utility. These advances have rapidly raised UAVs’ potential to meet the increasing requirements for cost-efficient, convenient tools to acquire data needed to support various forestry decisions, especially for small forested areas, such as stands or estates [5].
Nowadays, UAV imaging is used in diverse applications, including (inter alia) area-based inventories [6,7,8,9] and individual tree detection in forests [10,11,12,13,14,15,16] or agroforestry landscapes with widely spaced trees [17], post-harvest inventories [18], pest control [19], monitoring greenhouse gas emissions [20], and phenology inventories [21,22]. However, it has been used much less frequently in genetic field trials of forest trees than in inventories and monitoring of productive forests. A combination of a digital surface model obtained from UAV imagery and a digital terrain model derived from airborne laser scanning (ALS) data have been used to estimate heights of individual Norway spruce trees in genetic field trials in Norway [11,21]. In addition, light detection and ranging (LiDAR) information has been used to estimate genetic parameters for Monterey pine (Pinus radiata) in New Zealand [23], but the authors reached different conclusions concerning the technology’s applicability in breeding programs. The general findings indicated that UAVs are cost-efficient tools for assessing various forest stand attributes, but there is still scope for significant advances as the technology improves.
A potential complication is that the operational use of UAVs in forestry applications is strictly constrained by country-specific regulations. In Sweden, for instance, a special permit is required for out-of-sight flying at over 120 m height above ground [24]. However, there are fewer restrictions for the acquisition of wall-to-wall UAV imagery of genetic trials since they cover much smaller areas than production forests, and can be surveyed from relatively low flying heights, substantially lower than 120 m.
The main objective of this study was to assess the potential for exploiting these advantages of UAV imaging to assess materials used in tree breeding programs, particularly for predicting heights of trees in a 12-year-old Norway spruce genetic field trial. The height predictions were compared with measurements acquired by an ultrasonic system (Haglöf, 2020) on single trees, family, and genotype levels. General genetic parameters, e.g., heritability, derived from the predictions and measurements, were also compared. A novel aspect of the study is that it covered a larger area (2.4 ha, hosting more than 5000 trees) than the cited studies of material in Norway [11,21] and New Zealand [23]. The working hypothesis was that UAV imagery can provide accurate individual tree height predictions that can be applied in the Norway spruce breeding program for estimation of genetic parameters and within-family selection. For this, the UAV-based methodology should yield standard errors comparable to those of traditional field measurements for trees, and predictions for genetic parameters that deviate acceptably from parameters derived using manually measured tree heights.
2. Materials and Methods
2.1. Study Site
The study focused on a 12-year-old field trial of Norway spruce clones, covering 2.4 ha, established in the spring of 2007 at the Tagel forest estate in southern Sweden (57°13′ N, 14°16). The trial included 1428 genotypes from 32 F1 full-sib families originating from controlled crossings between tested plus-tree clones with high breeding value. Each genotype was represented by ca. four ramets randomly distributed over the study area. Thirty mother trees and 22 father trees were used to produce the 32 full-sib families. The intended crossing design was double pair mating, but three parent clones were used as both mother and father, so the mating design was not completely fulfilled. Just after planting, a detailed map showing the exact position of each tree was produced.
2.2. Manual Measurements
The first field measurements were acquired in the fall of 2012, six years after planting, when the height of each tree was measured using a measuring pole and damage was registered. In the fall of 2018, 12 years after establishment, the tree heights were remeasured using a Vertex IV hypsometer (Haglöf, Järfälla, Sweden), which is widely used in inventories of genetic trials. In addition, the breast height diameter of each tree was measured with a caliper, and visible damage was registered.
2.3. UAV Data Acquisition, Image Processing, and Point Cloud Generation
Aerial imagery data were acquired during early spring 2019, before the start of the vegetation period, using a consumer-grade DJI Phantom 4 Pro V2.0 system (DJI Technology Co., Ltd., Nanshan District, Shenzhen, China), following pre-flight planning with DroneDeploy software (DroneDeploy, San Francisco, CA, USA). Images were acquired around noon in normal weather conditions (sunny and not windy) along perpendicular flight paths with 30 m spacing at three heights (30, 50, and 70 m above ground). Before the images were acquired, 15 ground reference points (GCPs) were marked in the terrain with white cross-like signs (0.5 × 0.5 m) and positioned using a Topcon GRS-1 GNSS receiver with an external antenna (Topcon Corporation, Tokyo, Japan) (Figure 1).
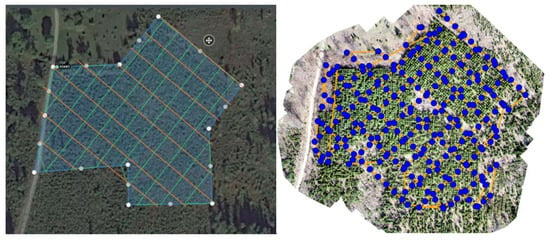
Figure 1.
The trial and the flight route over the trial (green, orange—to the left), orthomosaic created from imagery data acquired at 30 m flying height above ground. The yellow lines represent the flight paths, and the blue dots are the centers of the 251 images used as input (to the right).
The recorded images had low quality because the Joint Photographic Experts Group (JPEG) image compression imposed by the DroneDeploy software seemed to override the DJI system’s image registration controls. Due to the low spectral resolution of the stored images (ca. 3 bits per pixel), the matching algorithm worked poorly in the shadows, introducing artifacts that arguably reduced the quality of the matching process. Exploratory analyses indicated that the use of the images acquired at 30 and 70 m flight heights would respectively result in large amounts of matching errors and too coarse resolution, relative to the tree crowns. It was mainly due to a poor resolution of the photographs. Thus, only imagery acquired at the 50 m flight height was used in further analyses.
The photogrammetric point cloud was normalized relative to the ground using two digital terrain models (DTMs): the country-wide product (with 2 × 2 m spatial resolution) [25,26] derived from the national airborne laser scanning survey (0.5 points m−2) [27,28], and the local DTM obtained from the photogrammetric point cloud. Exploratory analyses indicated that the UAV-generated DTM gave slightly better results. Thus, it was preferred for the point cloud height normalization.
The position of each tree was manually set using the orthophotos derived from the 50 m elevation flights. The normalized point cloud was clipped by circular buffers of 0.5, 1.0, and 1.5 m radii around each approximated tree position. For each buffer radius, several auxiliaries (height percentiles, mean and maximum heights) were extracted from the distributions of the point cloud heights and then averaged. The treetops were detected as the observations corresponding to the average maximum height percentiles in the point cloud within search radii of 0.5, 1, and 1.5 m. Using this approach, 90% of the detected tree heights varied less than 7% from the respective heights measured in the field.
2.4. Model Development
The acquired data were analyzed in two phases. In Phase 1, predictive models for tree heights and diameters were developed using a combination of UAV-generated point cloud data and field measurements. In Phase 2, the genetic parameters required for genotype selection were estimated using field measurements and predictions of trees’ traits.
2.4.1. Models for Predicting Attributes of Individual Trees (Phase 1)
In Phase 1, three nested models of increasing complexity were developed for trees’ height and diameter at the age of 12 years (H12 and D12, respectively), using the following predictors:
- The maximum photogrammetric point cloud height within a tree crown segment, as a proxy for the true tree height (H-flight);
- Field-measured heights at the age of 6 years (H6);
- Breast height diameter measured at the age of 12 years (D12);
- Planimetric coordinates (X and Y, respectively indicating longitudinal and latitudinal positions) in the SWEREF99 TM Swedish reference system to account for possible spatial patterns and spatial autocorrelation;
- The genotype (Genotype ID), which also represents the clone identity in the experiment, was included as a random intercept.
A flexible generalized additive model (GAM) framework, which allows the modeling of nonlinear functional relationships between responses and predictors [29], was applied. Assuming that tree properties will significantly depend on their families, the GAMs were extended to include a hierarchical structure (hierarchical GAMs or HGAMS) by including random intercepts to account for within-genotype variability [25]. The chosen model structure consisted of a “common smoother plus group-level smoothers that have the same wiggliness” (GS-type model) [30]:
where is a dependent variable (measured height or diameter), β0 is the model intercept, zi is the vector of covariates, is the random intercept associated with each genotype and εi~N(0,σ2) is a normally distributed, homoscedastic error term.
The global term is a soap-film smoother [31] for the spatial coordinates (X, Y) that allows smoothing over a finite area with known boundaries. The group-level smoothers are predictors associated with tree heights and diameters. The smooth term for the non-spatial covariates (i.e., those related to tree height and diameter) was specified as a thin plate regression spline [32], which can accommodate higher-dimensional data and is knot-free. The knot number and location results automatically from estimating the optimal thin plate spline smoothing function [33]. For the models, including several covariates, interaction structures were also considered by constructing tensor products from the marginal smooths.
As previously recommended, the model coefficients and smoothing parameters were estimated by restricted maximum likelihood (REML) [29], and candidate models were compared in terms of the Akaike information criterion, AIC [30], accounting for uncertainties in the smoothing parameters and penalization effects [33], as well as residuals and computational time. In addition, cross-validation was applied with K = 30 stratified bootstrap samples selected independently for each group, i.e., by genotype.
To compare the performance of the candidate dynamic equations and select the best model for the height and diameter of a single tree, statistical and graphical analyses were applied.
The following goodness of fit statistics were used to compare model performance:
In these equations, is the measured value of the tree-level attribute—i.e., height or diameter, is the predicted value according to the specific model, and is the general mean of the measured trait.
2.4.2. Models for Predicting Genetic Parameters (Phase 2)
The genetic parameters were predicted using a linear mixed model framework. The responses (Y) were represented by the tree attributes, either measured in the field or predicted from the models developed in Phase 1. The grouping factors were the plot trials and genotypes (), with the genotypes G randomly spread across the trial plots P. In a first step, genetic variance and covariance components were estimated with the following mixed model:
where is a general mean,
is a fixed effect of plot, is a random effect of genotype, and is an error.
Subsequently, for each trait , the broad-sense heritability was calculated as:
where is a genetic variance and is an error variance.
Phenotypic and genetic correlations (type A) between pairs of traits observed or estimated at the same or different age were calculated as:
here, are the estimated phenotypic or genetic variances for traits x and y or the same trait variances at two different ages, respectively, and is the estimated phenotypic or genetic covariance between traits x and y or between the same trait measured or estimated at different ages. Genetic parameters were calculated with AsremL software [34].
2.5. Genotype Selection
In the Norway spruce breeding program, the best growing genotype within each family is usually selected for future breeding. To assess the potential utility of the models developed in Phase 1 for selecting these genotypes, the arithmetic means of manually measured traits (H, D) and values obtained from the models were calculated for each genotype. The best genotype within each family, according to average values, was selected. The correspondence of groups selected by a compared pair of models was expressed as the percentage of matching genotypes.
Heritabilities and genetic correlations were compared using the following formula:
where is a genetic correlation between traits x and y, H is a height, H2 is a broad-sense heritability, and under scripts model and measurement refers to modeled or measured values of the analyzed trait.
3. Results
3.1. Performance of the Predictive Models (Phase 1)
The precision of the models for estimating heights at the age of 12 years (designated HM1–HM3) increased with increases in their complexity, which successively increased from HM1 to HM3. HM3, which had the best goodness of fit statistics, included tree position (X, Y), height at the age of 6 years (H6), diameter at the age of 12 years (D12), and maximum photogrammetric height obtained from an analysis of the flight photographs (Table 1). Increases in complexity provided similar improvement in goodness-of-fit statistics for the models predicting diameter at the age of 12 years, and the best model, D3, included the same set of the variables as the best model for height (Table 1). The K = 30 cross-validation confirmed these enhancements of modeling performance (Table 1). Phenotypic correlations among heights of observed trees taller than 3 m and their estimated heights ranged between 0.84 and 0.93 (Figure 2). The relationships were slightly weaker for the diameter model (Figure 3), but model DM3 with the same set of explanatory variables as the HM3 model had the same correlation value, i.e., 0.93 (Figure 3). Visual assessment of the relationships between modeled and measured heights showed the models provided low precision for extreme values, but HM3 and DM3 seemed to provide significantly better predictions for trees with low heights than the other models for the respective traits (Figure 4 and Figure 5).

Table 1.
Goodness-of-fit statistics for the hierarchical generalized additive (HGAM) models.
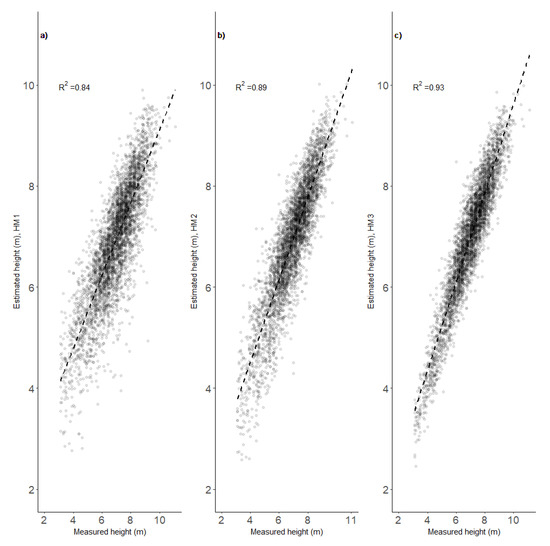
Figure 2.
Linear fits between manual measurements and image-based estimates of height at the age of 12 years provided by three developed models (HM1—(a), HM2—(b) and HM3—(c)).
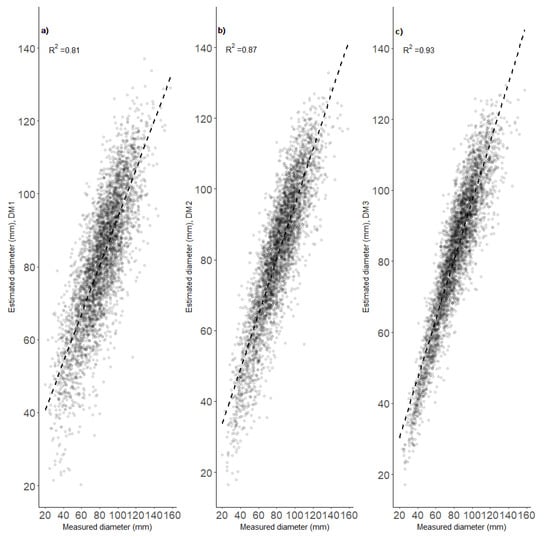
Figure 3.
Linear fits between manual measurements and image-based estimates of diameter at the age of 12 years provided by three developed models (DM1—(a), DM2—(b) and DM3—(c)).
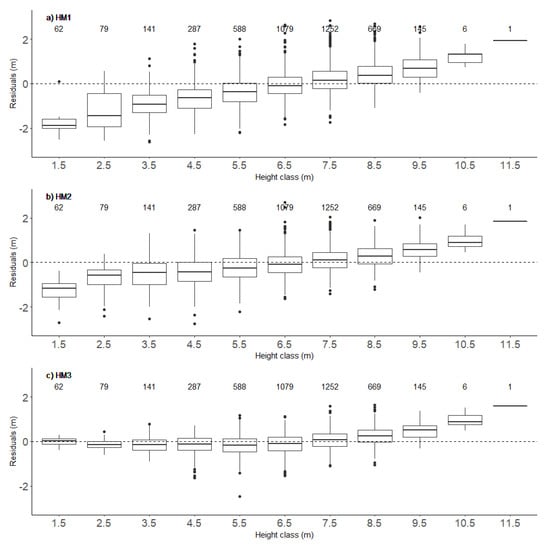
Figure 4.
Box-plots of residuals (measured—estimated heights) for the three height models (HM1—(a), HM2—(b) and HM3—(c)) in 10 dm height classes. Values above the boxes are the numbers of trees in the corresponding height classes.
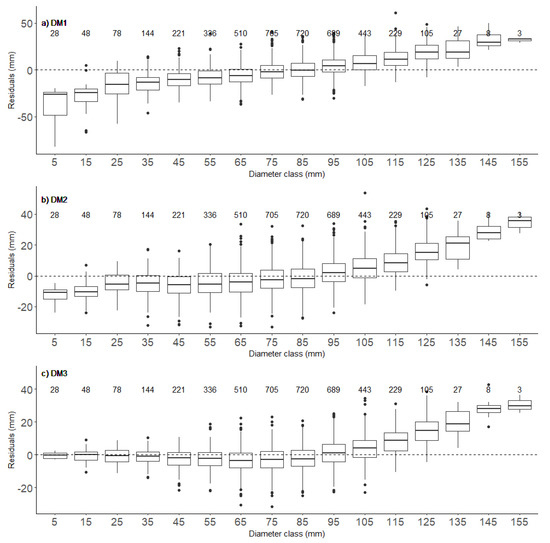
Figure 5.
Box-plots of residuals (measured—estimated diameters) for the three diameter models (DM1—(a), DM2—(b) and DM3—(c)) in 10 dm height classes. Values above the boxplots are numbers of trees in corresponding 10 dm height classes.
3.2. Overall Means and Genetic Parameters
The averages calculated for both traits from manual measurements and model estimations differed slightly. The mean height at 12 years estimated by each of the developed models was the same (6.85 m) and 0.14 m higher than the mean derived from observations (Table 2). Similarly, the models yielded a 1.33 mm higher mean diameter than the measurements. In relative terms, the differences between the predicted and measured means for height and diameter were 2% and 1.6%, respectively. All models provided poor estimates of the minimum and maximum values of both traits (Table 2).

Table 2.
Summary statistics from the field and image-estimated measures in the trial.
Heritabilities calculated from estimated heights and diameters were lower and higher, respectively, than those derived from the measurements, with deviations in values obtained using models HM1–HM3 and DM1–DM3 ranging from 0.02 to 0.0382 and −0.0331 to −0.0191, respectively. The relative deviations were more substantial for height heritability (−18.6% to −7.7%) than for diameter heritability (7.1% to 12.2%)
The correlations were stronger when heights obtained from the HM2 and HM3 models were used, but weaker when heights obtained from the HM1 model were used (Table 3). The DM2 and DM3 models also provided stronger correlations between diameters at these ages than the DM1 model. The use of the phenotypic correlation between the estimated heights and diameters resulted in an overestimation of the genetic correlation between diameter and height measured at six years. Overestimation of genetic correlations was also observed for estimated diameters and heights at 12 years. The genetic correlation between measured heights and diameters at this age was 0.6737, while the minimum value for measured height and estimated diameter (by the D1 model) was 0.7291 (Table 3). The genetic correlation between measured diameter at the age of 12 years and estimated heights was also higher than the correlation based on measured values. The genetic correlations between measured height and diameter, and their modeled values, generally exceeded 0.86. Relative differences in genetic correlations between variables derived from measurements and estimates by the HM1–HM3 and DM1–DM3 models are shown in Table 4.

Table 3.
Age–age genetic correlations (below the diagonal) and phenotypic correlations (above the diagonal) between measured and estimated traits.

Table 4.
Relative (%) differences in genetic correlations between indicated variables derived from measurements and estimates by the HM1–HM3 and DM1–DM3 models.
3.3. Family-Level Differences between Measured and Modelled Heights
The relative differences within families between average heights obtained from all measurements and estimates obtained from the models ranged between −0.07% and +4.63% (Figure 6a). Exclusion of trees shorter than 3 m reduced this range to between −1.45% and +1.4% (Figure 6b), and the range was similar when trees shorter than 3 m or taller than 10 m were excluded. There were similar family-level differences in average diameters obtained from measurements and the models.
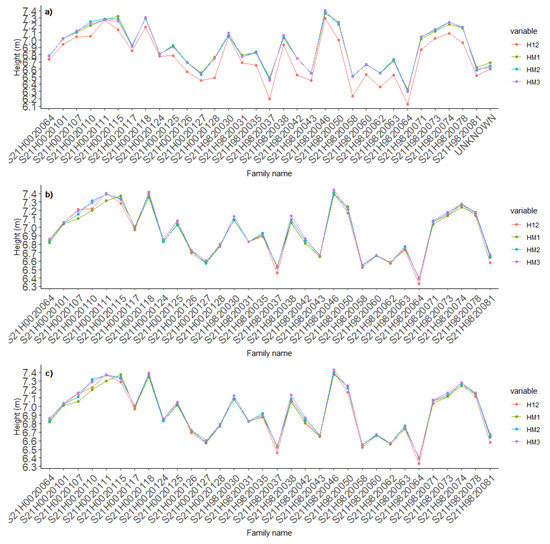
Figure 6.
Average heights at 12 years of representatives of the 32 full-sib families obtained from measurements (red) and the three height models (HM1, HM2, HM3): (a) based on all trees, (b) excluding trees shorter than 3.0 m, (c) excluding trees shorter than 3.0 or taller than 10.0 m.
3.4. Genotype-Level Differences between Measured and Modelled Heights
There were slightly weaker correlations between mean values of traits for genotypes and the estimates obtained using all three models than for the single trees (Figure 7).
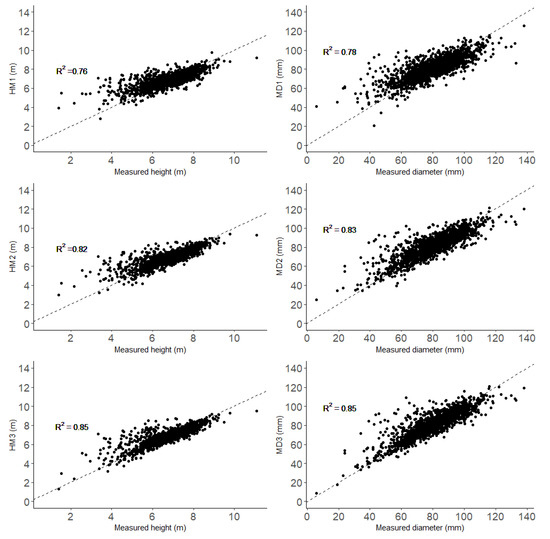
Figure 7.
Genotypic means of height and diameter obtained from measurements (x-axis) and both the HM1–HM3 and DM1–DM3 models (y-axis). The dashed lines are regression lines with intercept = 0 and slope = 1.
The selection of the best genotype in each of the 32 full-sib families based on the measured height at 12 years and estimates obtained from model HM2 or HM3 resulted in groups with ca. 50% matches (Table 5). In this test, small trees shorter than 2 m were excluded to avoid single small trees excessively influencing the means. The matching increased with increases in the number of genotypes selected per family, up to 62% with four selected genotypes. Generally, there was a weaker matching of groups selected using measured and modeled diameters.

Table 5.
Matching (%) between sets of genotypes selected from 32 full-sib families using measured and estimated values obtained using the indicated models (Set 2).
Although just ca. 50% of the genotypes were correctly selected when only the best genotype per family was selected, the effect on the mean of selected genotypes was small (Figure 8). Selection based on the HM1 and HM3 models resulted in ca. 4 and 1.8% lower mean heights of selected genotypes than the use of measurements. Selection within families based on diameter gave the same results regardless of the model (Table 6), and the model selection decreased the mean diameter of selected genotypes by 6%.
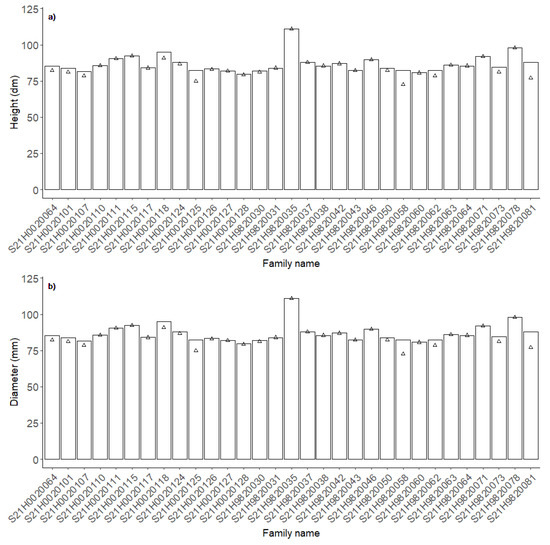
Figure 8.
Average height (a) and diameter (b) of the best genotype within each family selected based on manual measurements (bars) and the HM3 and DM3 models (Δ), respectively.

Table 6.
Mean heights (m) and diameters (mm) at 12 years of genotypes selected using indicated models when just the best genotype per family was selected. H and D are reference values for selection after manual measurement.
4. Discussion
Measurement of phenotypic performance is one the most expensive activities in breeding programs, so reducing its costs would be highly beneficial and free resources for use in other important operations. Estimation of the trees’ heights is a critical element of genetic trials’ assessments, but traditional field measurements of tree heights are rather expensive and not error-free. Thus, alternative, cost-efficient data acquisition methods are required. A strong potential candidate is UAV-based technology, which was tested in this study (for the first time, to our knowledge) for genotype selection in a large-scale genetic field trial.
The linear correlations between the tree heights manually measured using the Vertex laser range finder, and predicted heights ranged between 0.84 and 0.95. The predicted stand height averages were slightly lower (ca. 14 cm, 2%) than the average derived from manual field measurements, similar to differences obtained in a study of an older, even-aged Scots pine (Pinus sylvestris) stand in Germany [35]. The value of the total error for predicted heights also agrees well with values obtained in studies of other species growing in different conditions [14,16,35,36].
In this study, sample trees were not felled to compare their absolute heights with the model predictions. Thus, it is not possible to estimate the true height errors, which restricts the generalization of the results. However, field measurements are also affected by unknown errors, which were ignored when selecting genotypes. For trees taller than 12 m in the even-aged Scots pine (Pinus sylvestris) stand in Germany mentioned above, a linear phenotypic correlation of 0.98 was obtained between tree heights measured with a Vertex instrument and manual measurements of felled trees [30]. The slightly weaker relationship in our study may have been due to the higher tree density, which made it difficult sometimes to detect the treetops, although the work was done by experienced teams. Moreover, the correlation between the tree heights manually measured and derived from UAV data in the German study was ca. 0.97 [35], which is stronger than the relationship we found, but the results indicate a systematic underestimation of the height predictions. The height models we developed also yielded underestimates for trees shorter than 8 m, but heights of taller trees were overestimated, and the overestimation increased with further increases in tree height. Moreover, underestimates of heights yielded by the HM3 model for trees shorter than 8 m were quite small, and arguably due to image saturation in shadowed areas, where tops of small trees are often located. Use of higher radiometric resolution, of at least 8 bits per pixel, could at least considerably reduce, if not completely eliminate, many such errors.
The diameter models generally had lower prediction accuracy than the height models in terms of RMSE (%). Measured and predicted diameters had weaker linear correlation, as expected since no diameter measurements were directly obtained by the remote sensing technology. However, the relative differences between measured and estimated values were smaller for diameter (ca. 1.6%) than for height. The DM2 model would be the most feasible to use in practice as its use only requires positions of trees, early field-measured height (at six years old in this study), and UAV imagery data to predict trees’ diameter at the age of 12 years. However, the selection of the best genotypes within families based on predictions from this model resulted in 6.2% lower diameters than the selection of genotypes based on measured values. A more careful analysis of the costs and benefits is required to assess if such a trade-off can be justified. Moreover, the breeding strategy for Norway spruce in Sweden generally involves the establishment of four experiments for the tested material. Further selection is based on the performance over all four experimental locations. Thus, tests of selection based on heights predicted using data acquired with drones over the whole experimental series are required.
The best predictive height model included five explanatory variables: height at the age of 6 years, diameter at the age of 12 years, planimetric (X,Y) tree positions, and treetop height derived from the UAV-generated point cloud. For the Norway spruce breeding program in Sweden, all this information is available at the time of the final evaluation of genetic trials, except the UAV imagery. Thus, the application of this model would only increase labor costs. The use of the simpler HM1 model, with only the tree position and treetop heights retrieved from UAV data, would decrease the tree height predictions’ accuracy. However, the HM1 model’s performance was not satisfactory. The HM2 model was a slightly better alternative, but both can be improved in the future. The HM2 model includes the tree positions, early measured height, and UAV-based treetop heights. At least for tree heights, the field measurements are still necessary, but the measurement costs are much lower than those of later assessments. The use of better equipment might generate better values of the H-flight for individual trees. These values can be use directly without the fitting of the model, which would be a cost-efficient solution [21].
In the Norway spruce breeding strategy, only the best performing genotype within each family is selected for the future breeding and production populations, i.e., seed orchards. The selection is based on genotypes’ performance in four experiments that include 16 representatives of each tested genotype in total (four per trial). The selection is not based directly on measured phenotypic traits, but the traits are used for prediction of breeding values (BVs), which are calculated from all collected Norway spruce phenotype data and pedigrees. Currently, data on more than 200 field trials have been compiled in the Norway spruce breeding program’s database. The calculation of BVs involves the use of information on phenotypic traits, between-trait correlations, age-to-age correlations, between-site correlations, and pedigrees. The system used for the prediction is complex, and the proper estimation of BVs was beyond the scope of this study. The selection in this study was based directly on the mean genotypic values. Generally, the height predictions were not satisfactory for the selection of the best genotypes, as they provided, at most, 50% matches with the best genotypes based on manual measurements, and the diameter predictions provided even lower matching. A weak correlation between BVs calculated from measurements and UAV-based estimates was found in a previous study, but the precision of the mean estimates in that study was rather low [11]. On the other hand, the selection of the best genotype within each family (forward selection) did not strongly influence the means of selected genotypes. In the genetic trials with Norway spruce in Norway, a forward selection based on UAV measurements has been considered as a most promising alternative for application within the operational breeding program [21]. Nevertheless, selection based on height models was more precise than selection based on diameter models.
Estimates of height and diameter heritability based on the models were, respectively, underestimated and overestimated, relative to estimates based on measurements. The HM3 model resulted in the strongest underestimation (18%) of height heritability. A previous study also found that heritabilities derived from drone measurements were underestimates, and attributed this to misdetection of the trees [11]. In our case, all trees’ positions were manually associated with the images, indicating that the precision of estimations per se might have a more profound effect on heritability estimation. The absolute deviation in the estimation of heritability for diameter was smaller than the corresponding deviation for height. The differences in estimates of heritability may clearly influence conclusions about the effects of genetic factors on the analyzed traits, as over- and underestimates suggest that genetic effects are stronger and weaker than they really are, respectively. A previous analysis of heritability estimates for height and diameter, respectively, derived from 151 and 94 Norway spruce genetic trails in Sweden, found almost complete ranges of values, from 0.1 to 0.9 for height and 0.12 to 0.98 for diameter [4]. The means were 0.36 and 0.39 for height and diameter, respectively. Genetic correlations between measured and estimated values were generally overestimated, except for height at the age of six years and estimated height at the age of 12 years.
A limitation of our study is related to the low radiometric (color depth) resolution of the imagery (ca. 3 bits/pixel), which affected the image matching quality, especially in shaded areas. Consequently, the point cloud heights were affected by errors that produced saturation of the predictive models for tree-level attributes, especially in the range of small trees. Thus, the direct values of H-flight could not be used without increasing measurement error, as in the study in Norway spruce in Norway [21]. In addition, JPEG-compression artifacts in the UAV images restricted the use of treetop detection algorithms for automating the workflow. The selection of the explanatory variables can be questionable if the goal was to develop a general model for height estimation [21]. The development of the general model with a set of explanatory variables requires the analysis of a greater number of experiments and variables combination.
Practical Implications and Future Development
The presented results show that even UAV imagery of low radiometric resolution has potential utility for estimating mean stand heights and diameters of trees in genetic trials for Norway spruce breeding. The predictions of stand and family averages were sufficiently accurate to replace the field-based measurements. The study does not provide definitive proof that UAV technology could be extensively used in breeding programs, but we regard the results as rather promising and expect that the use of higher quality equipment would further improve the genotype selection results. UAV technology is continually improving, and more advanced techniques could potentially deliver even better images. Higher quality images (for instance, at least 8 bits/pixel) stored using uncompressed file formats would allow automatic detection of individual trees and more accurate tree height predictions, especially towards the extremes of the height range, which are most important in forest tree breeding.
At this point, the models developed here cannot be generalized for extensive use in the breeding program. More data should be acquired from different trials and sites to develop predictive models for individual tree height that can be robustly extrapolated. Ideally, all genetic trials in the tested experimental series should be included in further surveys to check between-site correlations for the genotypes and families. This would also reveal the environmental variation within trials that would affect the estimates. However, the small differences between means of genotypes selected using manual measurements and the models indicate that selection of the best genotypes in the Norway spruce breeding program could potentially be based solely on UAV measurements. Thus, the technology could be an efficient alternative for reducing costs of the breeding program and releasing resources for other operational breeding tasks. The specific studies devoted to the cost effectiveness of the method in comparison with traditional inventories need to be done in the future.
Author Contributions
The study was conceptualized by M.L., J.M. and B.K. The methodology of data acquisition and data acquisition was done by L.T.E., J.M., J.L., and A.H. The computation of models and analysis were done by M.L. and L.T.E. All authors contributed to writing and editing of the manuscript. M.L. wrote the original draft. All authors have read and agreed to the published version of the manuscript.
Funding
This research was funded by the Bo Rydins Stiftelse för Vetenskaplig Forskning (F09/17) and Rappe-von Schmiterlövska Stiftelsen.
Conflicts of Interest
The authors declare no conflict of interest.
References
- Rosvall, O. Review of the Swedish Tree Breeding Program; Skogforsk: Uppsala, Sweden, 2011. [Google Scholar]
- Williams, M.S.; Bechtold, W.A.; LaBau, V.J. Five instruments for measuring tree height: An evaluation. South. J. Appl. For. 1994. [Google Scholar] [CrossRef]
- Vasilescu, M.M. Standard error of tree height using vertex III. Bull. Transilv. Univ. Bras. 2013, 6, 75–80. [Google Scholar]
- Berlin, M.; Jansson, G. Genetic Correlations between Growth and Quality Traits; The Forest Research Institute of Sweden: Uppsala, Sweden, 2014; p. 32. [Google Scholar]
- Banu, T.P.; Borlea, G.F.; Banu, C. The use of drones in forestry. J. Environ. Sci. Eng. B 2016. [Google Scholar] [CrossRef]
- Puliti, S.; Gobakken, T.; Ørka, H.O.; Næsset, E. Assessing 3D point clouds from aerial photographs for species-specific forest inventories. Scand. J. For. Res. 2017, 32, 68–79. [Google Scholar] [CrossRef]
- Puliti, S.; Dash, J.P.; Watt, M.S.; Breidenbach, J.; Pearse, G.D. A comparison of UAV laser scanning, photogrammetry and airborne laser scanning for precision inventory of small-forest properties. For. Int. J. For. Res. 2019, 93, 150–162. [Google Scholar] [CrossRef]
- Liang, X.; Wang, Y.; Pyörälä, J.; Lehtomäki, M.; Yu, X.; Kaartinen, H.; Kukko, A.; Honkavaara, E.; Issaoui, A.E.I.; Nevalainen, O.; et al. Forest in situ observations using unmanned aerial vehicle as an alternative of terrestrial measurements. For. Ecosyst. 2019. [CrossRef]
- Moe, K.T.; Owari, T.; Furuya, N.; Hiroshima, T. Comparing Individual Tree Height Information Derived from Field Surveys, LiDAR and UAV-DAP for High-Value Timber Species in Northern Japan. Forests 2020, 11, 223. [Google Scholar] [CrossRef]
- Kattenborn, T.; Sperlich, M.; Bataua, K.; Koch, B. Automatic single tree detection in plantations using UAV-based photogrammetric point clouds. In Proceedings of the International Archives of the Photogrammetry, Remote Sensing and Spatial Information Sciences, ISPRS Technical Commission III Symposium, Zurich, Switzerland, 5–7 September 2014; Volume XL-3. [Google Scholar]
- Steffenrem, A.; Lohne, T.P.; Kvaalen, H.; Solberg, S. Tree height estimation in progeny trials using UAS photogrammetry. In Proceedings of the 2014 IUFRO Forest Tree Breeding Conference, Prague, Czech Republic, 25–29 August 2014. [Google Scholar]
- Zarco-Tejada, P.J.; Diaz-Varela, R.; Angileri, V.; Loudjani, P. Tree height quantification using very high resolution imagery acquired from an unmanned aerial vehicle (UAV) and automatic 3D photo-reconstruction methods. Eur. J. Agron. 2014. [Google Scholar] [CrossRef]
- Lim, Y.S.; La, P.H.; Park, J.S.; Lee, M.H.; Pyeon, M.W.; Kim, J.-I. Calculation of tree height and canopy crown from drone images using segmentation. J. Korean Soc. Surv. Geod. Photogramm. Cartogr. 2015, 33, 605–614. [Google Scholar] [CrossRef]
- Guerra-Hernández, J.; González-Ferreiro, E.; Sarmento, A.; Silva, J.; Nunes, A.; Correia, A.C.; Fontes, L.; Tomé, M.; Díaz-Varela, R. Using high resolution UAV imagery to estimate tree variables in Pinus pinea plantation in Portugal. For. Syst. 2016. [Google Scholar] [CrossRef]
- Mohan, M.; Silva, C.A.; Klauberg, C.; Jat, P.; Catts, G.; Cardil, A.; Hudak, A.T.; Dia, M. Individual tree detection from unmanned aerial vehicle (UAV) derived canopy height model in an open canopy mixed conifer forest. Forests 2017. [Google Scholar] [CrossRef]
- Unger, D.; Hung, I.-K.; Kulhavy, D.; Zhang, Y.; Busch-Petersen, K. Accuracy of unmanned aerial system (drone) height measurements. Int. J. Geospat. Environ. Res. 2018, 5, 6. [Google Scholar]
- Torres-Sánchez, J.; López-Granados, F.; Serrano, N.; Arquero, O.; Peña, J.M. High-throughput 3-D monitoring of agricultural-tree plantations with unmanned aerial vehicle (UAV) technology. PLoS ONE 2015, 10, e0130479. [Google Scholar] [CrossRef] [PubMed]
- Puliti, S.; Talbot, B.; Astrup, R. Tree-stump detection, segmentation, classification, and measurement using unmanned aerial vehicle (UAV) imagery. Forests 2018, 9, 102. [Google Scholar] [CrossRef]
- Morley, C.G.; Broadley, J.; Hartley, R.; Herries, D.; MacMorran, D.; McLean, I.G. The potential of using Unmanned Aerial Vehicles (UAVs) for precision pest control of possums (Trichosurusvulpecula). Rethink. Ecol. 2017, 2. [Google Scholar] [CrossRef]
- Mlambo, R.; Woodhouse, I.H.; Gerard, F.; Anderson, K. Structure from motion (SfM) photogrammetry with drone data: A low cost method for monitoring greenhouse gas emissions from forests in developing countries. Forests 2017, 8, 68. [Google Scholar] [CrossRef]
- Solvin, T.M.; Puliti, S.; Steffenrem, A. Use of UAV photogrammetric data in forest genetic trials: Measuring tree height, growth, and phenology in Norway spruce (Picea abies L. Karts.) Scand. J. For. Res 2020. [Google Scholar] [CrossRef]
- D’Odorico, P.; Besik, A.; Wong, C.Y.S.; Isabel, N.; Ensminger, I. High-throughput drone-based remote sensing reliably tracks phenology in thousands of conifer seedlings. New Phytol. 2020, 226, 1667–1681. [Google Scholar] [CrossRef]
- Pont, D.; Dungey, H.S.; Watt, M.S.; Stovold, G.T.; Morrow, B. Individual tree phenotyping using sUAS LiDAR and RGB sensors. In Proceedings of the Small Unmanned Aerial Systems for Environmental Research, Split, Croatia, 25 May 2018. [Google Scholar]
- Vesvre, R. Nya drönarregler inom hela EU från och med den 1 juli 2020; Agency, S.T., Ed.; Transportstyrelsen Sverige: Stockholm, Sweden, 2020. (In Swedish) [Google Scholar]
- Lantmäteriet. GSD-Elevation Data, Grid2+. Available online: https://www.lantmateriet.se/globalassets/kartor-och-geografisk-information/hojddata/e_grid2_plus.pdf (accessed on 11 June 2020).
- Lantmäteriet. Quality Description of National Elevation Model. Available online: https://www.lantmateriet.se/globalassets/kartor-och-geografisk-information/hojddata/quality_description_dem.pdf (accessed on 11 June 2020).
- Lantmäteriet. LaserdataNH. Available online: https://www.lantmateriet.se/globalassets/kartor-och-geografisk-information/hojddata/lidar_data_nh.pdf (accessed on 11 June 2020).
- Lantmäteriet. Laser data -LaserdataNH. Available online: https://www.lantmateriet.se/globalassets/kartor-och-geografisk-information/hojddata/quality_description_lidar.pdf (accessed on 11 June 2020).
- Wood, S.N. Fast stable restricted maximum likelihood and marginal likelihood estimation of semiparametric generalized linear models. J. R. Stat. Soc. Ser. B 2011, 73, 3–36. [Google Scholar] [CrossRef]
- Pedersen, E.J.; Miller, D.L.; Simpson, G.L.; Ross, N. Hierarchical generalized additive models in ecology: An introduction with mgcv. PeerJ 2019. [Google Scholar] [CrossRef]
- Wood, S.N.; Bravington, M.V.; Hedley, S.L. Soap film smoothing. J. R. Stat. Soc. Ser. B 2008, 70, 931–955. [Google Scholar] [CrossRef]
- Wood, S.N. Thin plate regression splines. J. R. Stat. Soc. Ser. B 2003. [Google Scholar] [CrossRef]
- Wood, S.N.; Pya, N.; Säfken, B. Smoothing parameter and model selection for general smooth models. J. Am. Stat. Assoc. 2016, 111, 1548–1563. [Google Scholar] [CrossRef]
- Gilmour, A.R.; Gogel, B.J.; Cullis, B.R.; Welham, S.; Thompson, R. ASReml User Guide Release 1.0; VSN International: Hemel Hempstead, UK, 2002. [Google Scholar] [CrossRef]
- Krause, S.; Sanders, T.G.M.; Mund, J.P.; Greve, K. UAV-based photogrammetric tree height measurement for intensive forest monitoring. Remote Sens. 2019. [Google Scholar] [CrossRef]
- Birdal, A.C.; Avdan, U.; Türk, T. Estimating tree heights with images from an unmanned aerial vehicle. Geomat. Nat. Hazards Risk 2017. [Google Scholar] [CrossRef]
© 2020 by the authors. Licensee MDPI, Basel, Switzerland. This article is an open access article distributed under the terms and conditions of the Creative Commons Attribution (CC BY) license (http://creativecommons.org/licenses/by/4.0/).