1. Introduction
In forestry, timber production is, in most cases, the primary source of income. As such, cost optimization and creating time standards are crucial for planning and logistics [
1,
2]. Maximum utilization of the machines is necessary for profitable logging operations [
3]. The cut-to-Length (CTL) method is frequently used, and in the Czech Republic, this method is used for approximately 29–38% of the total annual timber production [
2]. In the European perspective, the use of CTL and subsequent use of harvesters and forwarders varies [
4]. Forwarders can also be deployed separately from harvesters to extract timber after motor-manual felling [
5].
As such, there are several studies regarding the productivity of forwarders. Either they are a detailed modelling of the forwarding cycles [
3,
6,
7,
8,
9], or other, less detailed, follow-up studies [
10,
11], all use the volume of the loaded timber. Except for the entirely experimental forwarder cycles, the specific volume of the loaded assortments is unclear, and there are several approaches to deal with this issue in general, such as
Woodpile-like measuring of the load with load area width, assortment length, and the height of the load [
12];
Average log estimation based on the sampling of the load and counting number of the logs in the load [
13,
14,
15];
Mean load calculated from the number of the forwarding cycles and total volume of the extracted timber, or mean log volumes; their count; and their assortment categories [
14,
16].
Each method has its downsides. The woodpile method relies on the conversion coefficient to convert the space volume to the solid wood volume, which often is an issue [
17], not to mention the possible errors in gauge measuring the height. Log sampling influences the work elements; the woodpile method requires a researcher to be present at the roadside landings during the shift, which is highly time consuming [
18]. The mean values of load for larger areas cannot describe specific cycles with enough accuracy, nor can they describe load-specific assortment composition [
19].
Another method is the weight measurement of each load. When the measurements are to be taken on the site and not at the mill, there are two options. One is measuring forwarder axle loads or the load on the crane [
20]. This method, however, depends heavily on proper wood density estimation for the loads, and multi-species loads are an issue.
Modern technologies, such as laser scanning and photogrammetry, have already found their way into forestry. Laser scanning has proved to be somewhat limited to the mill location [
21,
22], and the cost of the deployment of such a technology could be severely much than the use of the photogrammetry [
23]. Recent studies have used ground photogrammetry methods for 3D reconstructions of the whole stand [
24], tree [
25,
26,
27], or stem parts [
28], and for deriving, for example, individual tree height, diameter, and horizontal crown projection. In the timber production operations, an estimation of truckload using the unmanned aerial vehicle (UAV) has been presented [
29]. Several mobile applications for roadside woodpile measuring exist.
In the preparation stage of our time study research, we explored the possibilities of other measuring methods. The primary goals were a minimal interruption to the forwarder operations and results comparable to the most widely used woodpile-like measuring, using level staff for height estimation. Given the fact that timber should be relatively faced against the protective mesh on the forwarder, we opted for cost-effective 2D photogrammetry. Without any Structure from Motion (SfM), or stereoscopic images (as the view is partially obstructed by the forwarder), the data processing was less time consuming and camera requirements were lower.
As such, we present a simple workflow using just 2D photogrammetry information for use in forestry operations and verify its viability.
2. Materials and Methods
For this study, a John Deere 1110D forwarder was used during sanitary felling on the grounds of School Forestry Enterprise administrated by the Czech University of Life Sciences Prague. Forwarded timber was mostly Norwegian spruce (Picea abies L.), with the occurrence of the scots pine (Pinus sylvestris L.).
2.1. Manual Measurements
The protective cover mesh of the load area was measured, as well as the load space profile. Because timber should be placed against the mesh, this served as a reference grid for further corrections and reference of the taken photos. Manual measurements were done at the roadside when forwarder stopped near the woodpile to unload the timber. The height of the load was measured on each side of the load near the mesh using Telefix measuring gauge with horns on both sides to get measured heights without any significant errors due to bad line of sight. This method attempted to suppress possible reader errors, as we observed such errors when using only simple levelling staff.
2.2. Cameras and Images Processing
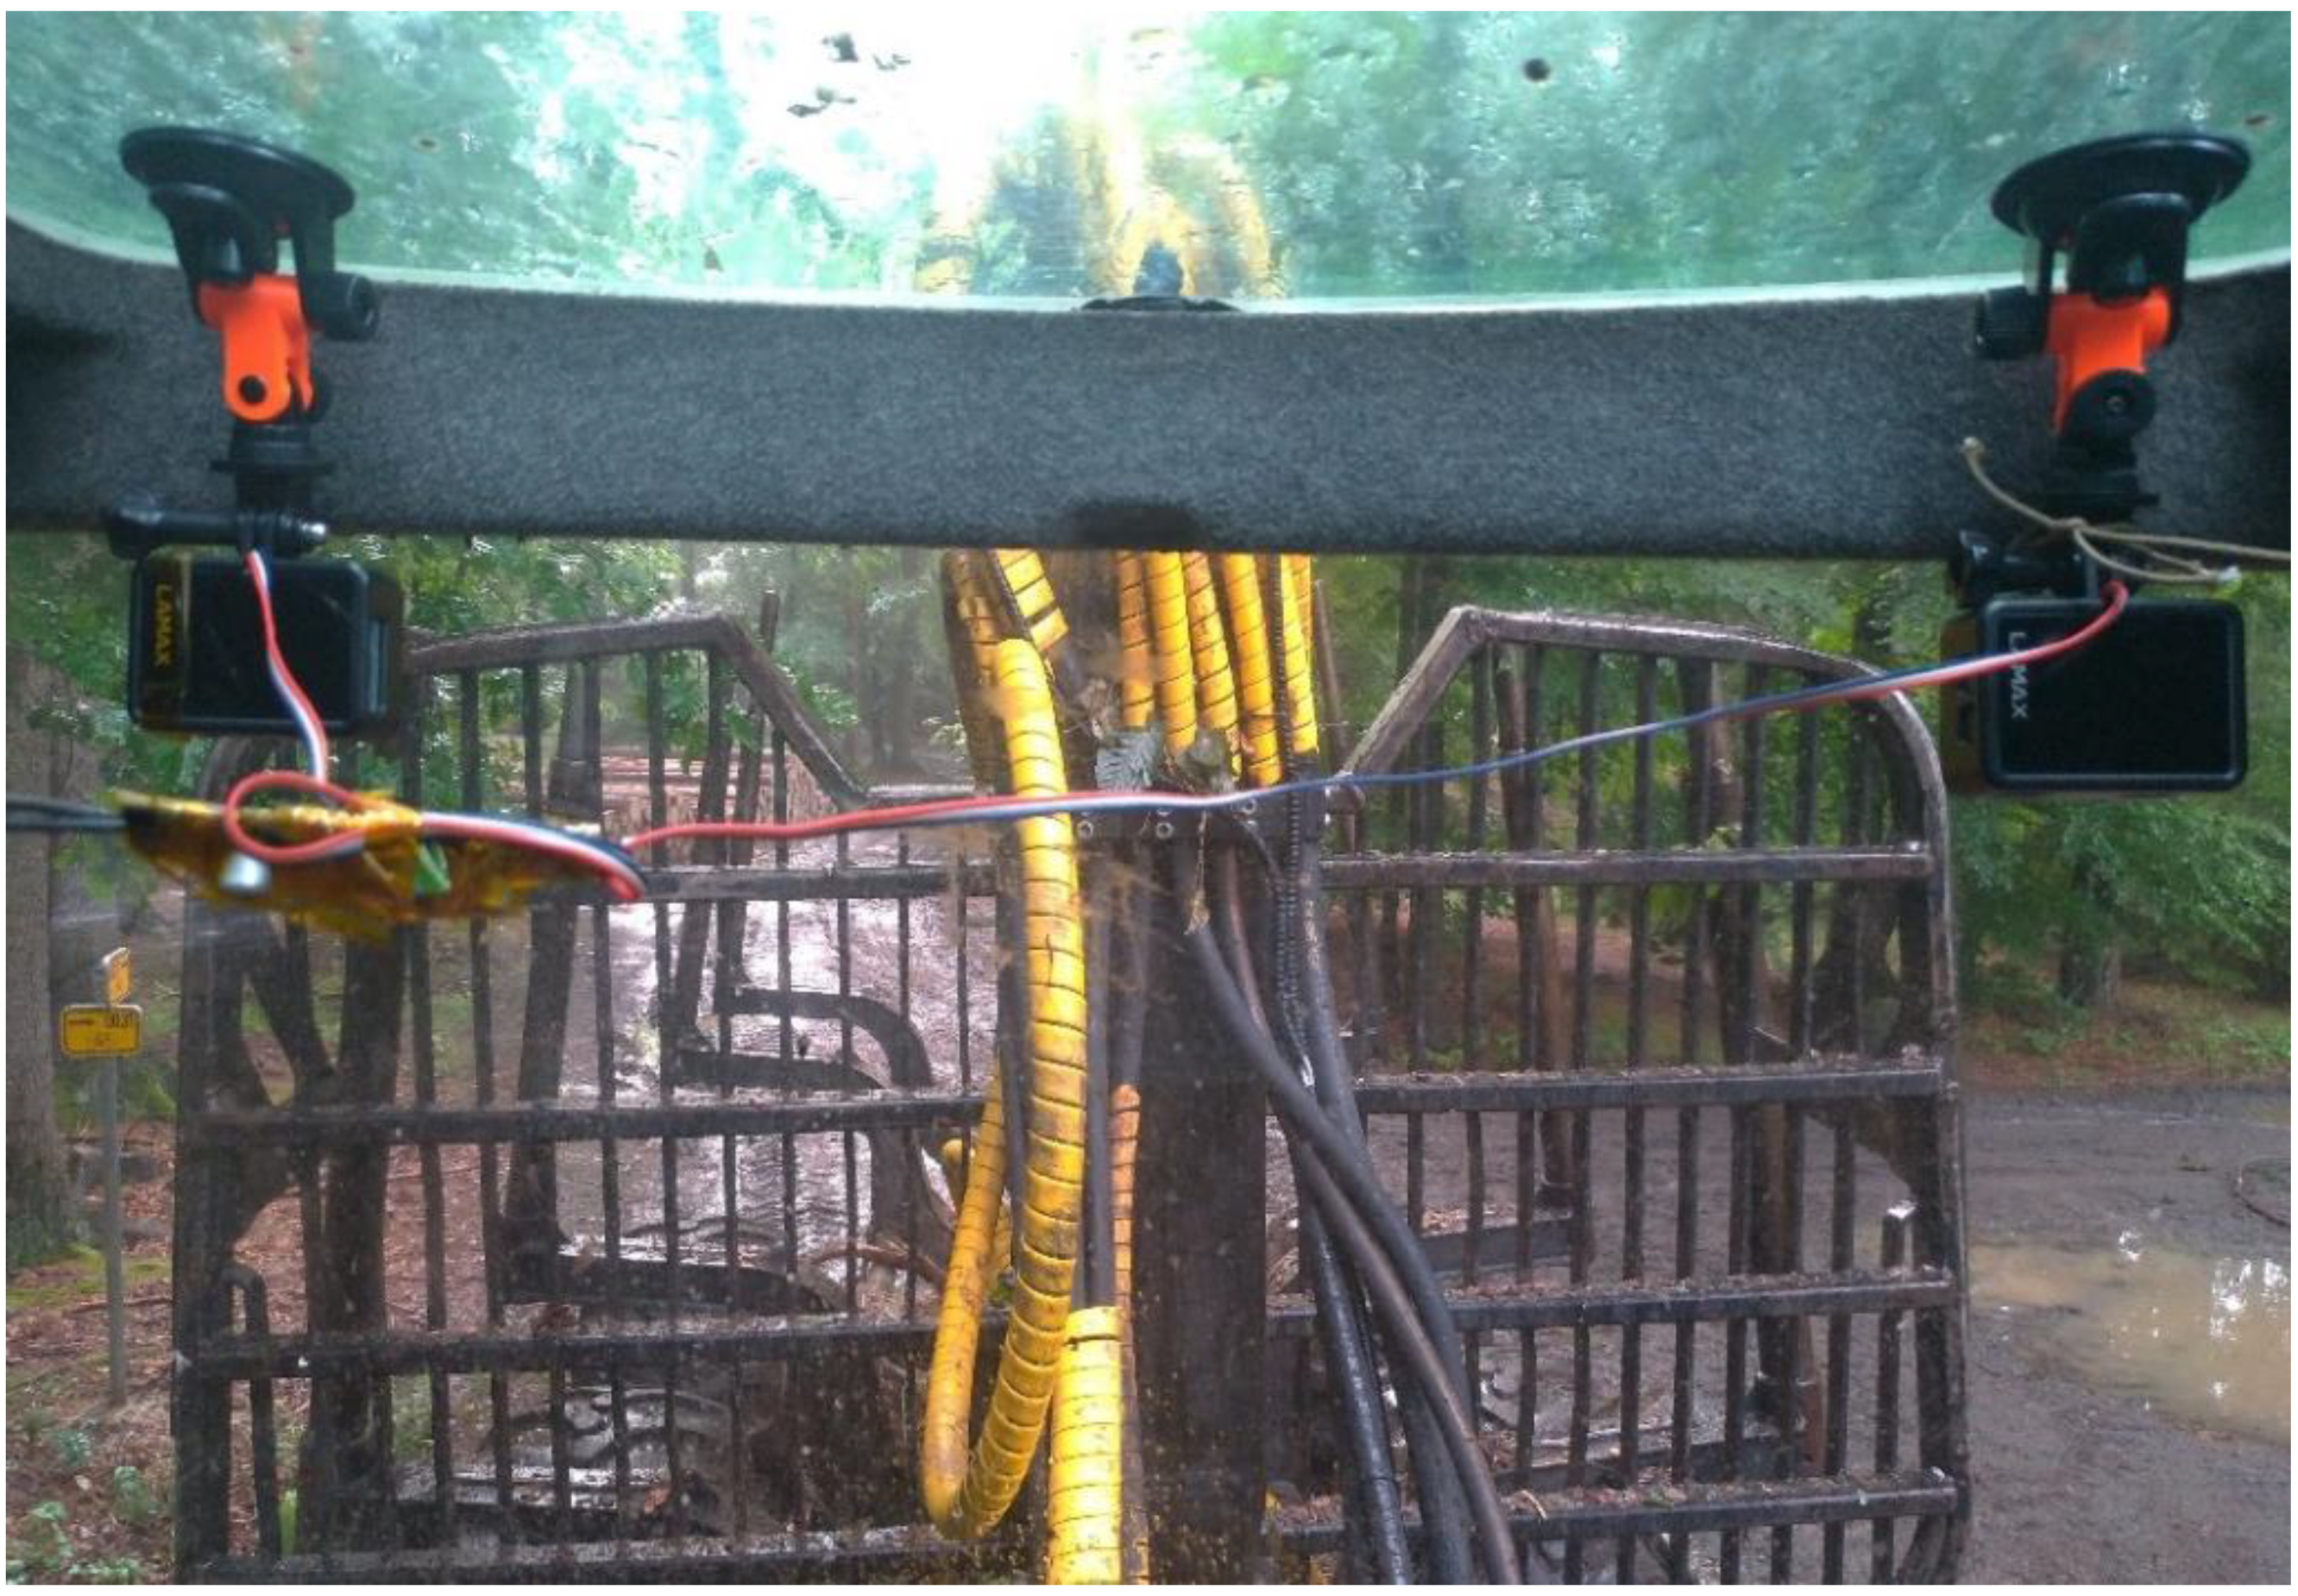
In the forwarder, two LAMAX X10.1 cameras were installed, containing Sony IMX117 sensor with 12 Mega-pixel resolution (4000 × 3000 pixels) and sensor dimensions of 6.2 mm × 4.65 mm (1.55 µm per one pixel). Cameras were set up with time-lapse photo setting set for 3 s. We found out during the design of the experiment that use of time-lapse photos is better than a time-lapse video, as the images are sharper and therefore offer more detail. Image resolution was 0.87 mm per pixel (given the average distance from cameras to the load area being 2 m). Cameras were for this initial stage placed in the cabin, as seen in
Figure 1, and powered directly by the machine power outlet. This proved to be an issue, as any interruption in the problematic 12 V car connector, which is a common problem, caused cameras to shut down. For prolonged recording with better resilience to connector disconnection, the power bank should be incorporated to serve as a buffer power supply. Because we did not use any stereographic methods, the alignment of the cameras was not crucial, and simple suction cup mounts could be used.
Camera images needed to be corrected for the lens distortion. For this purpose, several images of the calibration pattern—22 × 15 checkboard with 16.19 mm squares—were taken. Calibration and undistortion were made in GML Camera Calibration (PTC Inc.). There are many calibration techniques described; this particular method was chosen because of its ease of use for our purpose. For both cameras, re-projection errors were between 2.07 and 1.37 px. Given that the distance from cameras to the load was about 2 m, this resulted in a re-projection error below 2 mm in the plane of the measured load.
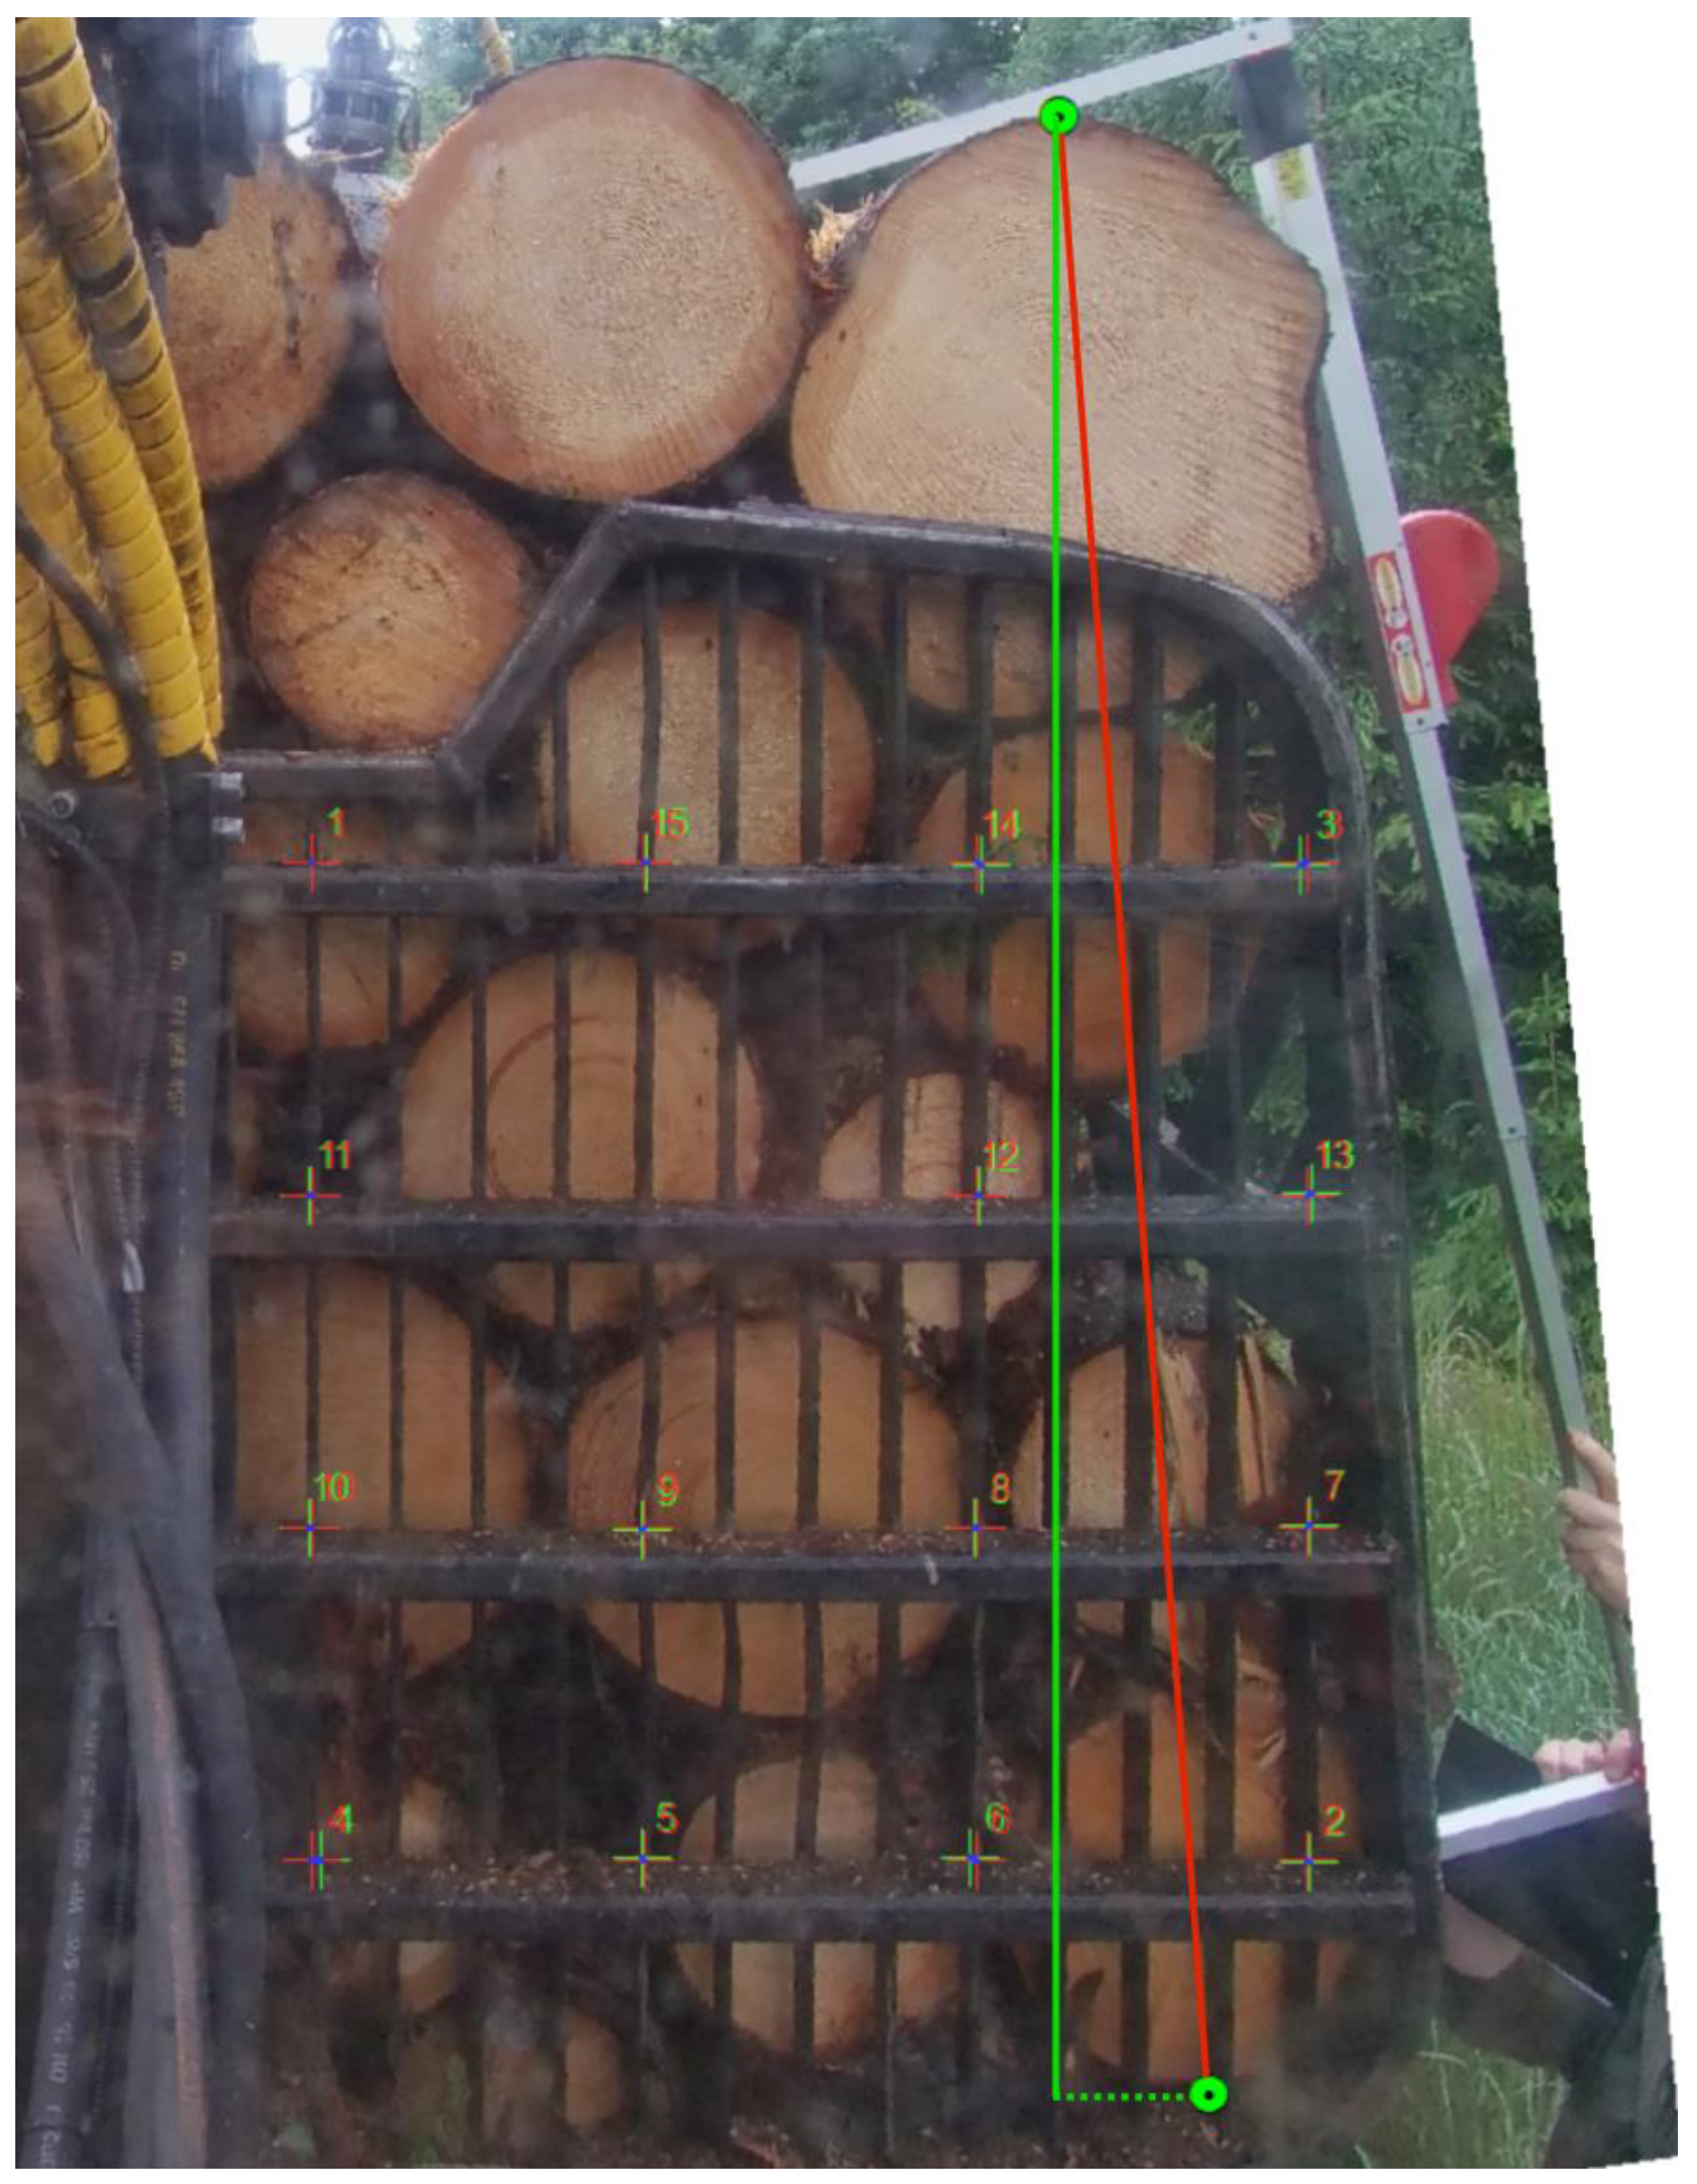
Because the protective mesh had been measured, we therefore could plot the control points in the photos against expected cartesian coordinates to scale the images up and verify successful undistortion of the image in the area of interest represented by load area so it could be used to take the measurements. This procedure was done in ESRI ArcMap (ESRI, Redlands, CA, USA) using georeferencing of the image. 4 × 4 point grid of the protective mesh was used to check for the root mean square error (RMSE) of the rectification process.
Rectification of the photos against the cartesian coordinates is shown in
Figure 2. The 2nd polynomial transformation showed the best results with the lowest RMSE. The RMSE for each observation in absolute RMSE form is presented in
Table 1. Equation (1) presents the calculations of RMSE described by [
30], where n is the number of observations, ŷ is mean error, and y is the error of the current control point.
Mean error was calculated as mean of y values, where the y was calculated as a difference of reference control point (grid distance in the cartesian 2D system of loading place protection mesh) value and estimated (photo derived placement of the control points in loading place protection mesh) value. Except for one instance, the RMSE was below 1 cm. Such values of RMSE meant we could use the images for height estimation.
2.3. Data Processing
Once images were rectified, point shapefile was created, and points were placed on the respective side of the load indicating the top and the bottom of the load. Their X and Y coordinates were calculated in the cartesian coordinate system and exported to be later processed with R language [
31], where straight-line distance and vertical distance between top and bottom points were calculated.
In total, 16 measurements of the loads were taken (eight on each side). Given the nature of the sanitary fellings, with common re-locations, branch collection by the forwarder, and waiting time for the harvester, this was the maximal achievable load count given the timeframe. Certainly, this downside will be addressed in future research, with the second version of the cameras rig testing. Datasets of the reference-gauge measured distance, vertical distance, and straight-line distance were then tested using a paired t-test with 0.95 confidence level. We tested for a difference between vertical and straight-line distance datasets with the null hypothesis of mean difference being equal to 0. The second batch consisted of testing vertical and straight-line distance datasets separately against reference-gauge measured distance with the null hypothesis of mean difference being equal to 0.
3. Results
Table 1 shows measured and calculated distances. Two types of distances were calculated: a vertical distance, which takes into account only difference along the
Y-axis, and a straight-line distance, which represents the gauge measurement more accurately in case the gauge is not perfectly vertical. In several cases, the difference between vertical and straight-line distances was up to 5 cm.
First, the calculated vertical distance and calculated straight-line distance datasets were tested against each other, showing there is a significant difference between them: p-value of 0.0015. This significant difference demonstrates a need for precise vertical measurements for the load volume estimations where vertical distance is needed.
Another paired t-test, where calculated distances were tested against the gauge measured distances, showed a difference in the case of the vertical distance. It was not a significant one (p-value of 0.2406), but given the 95 percent confidence interval of the difference between −4.1727 and 1.0477, it is reasonable to suggest that vertical distance differs from the gauge measurements and is lower. This assumption was tested with the alternative hypothesis that the difference is lower than 0. With p-value 0.1203, this seems to be the case, yet not strongly significant, and it could be just due to a chance.
Comparison of the calculated straight-line distance and the gauge measured distance showed the difference is close to statistically insignificant with a p-value of 0.9354. Such a result can be interpreted as a confirmation that the camera-based measurements are up to gauge measurements of the load.
Additionally, given the substantial differences between the straight-line and vertical distances and strong evidence that straight-line distances are close to the gauge measured distances, we hypothesize that the gauge measurements can be biased and are overestimating the height of the load when the gauge measurements are not perfectly vertical. This possible error could be somewhat mitigated by using a spirit level, but we experienced issues where horns on the Telefix gauge were not long enough to grab on the top of the load due to the tapered sides of the load area. Longer horns would not be practical. In our case, difference up to 5 cm in height can be interpreted, given that assortment length was 5 m, as a possible calculated volume difference of 0.55 m3. Given the conventional conversion factor for the solid wood volume of 0.64, this is equal to the difference of 0.352 m3 u.b.
4. Discussion
Methods used in this study were not cutting-edge. Camera calibration software used together with square checkboard targets was superseded by several other techniques. This one was chosen for the ease of use for researchers who do not specialize in computer vision. Achieved re-projection errors (1.37–2.07 px) were more extensive than in other studies, which were focused on the precision of calibration, for example, 0.2705 px by Poulin-Girard et al. [
32]. However, the study of Mokroš et al. [
28], where two types of lenses on digital cameras were compared (a standard lens and fisheye lens), proposed the usage of fisheye lens with significantly lower error for photogrammetry purposes in forestry measurements.
Nevertheless, given the distance of about two meters from the load face, this error resulted in a possible error of 1.19–1.80 mm, which we considered sufficient for the purpose of load measurement. The one issue we were aware of was the thickness of the mesh, which could have influenced the calculated distances, as the actual load was several millimeters behind, but the improper facing of the logs created more severe distortions. For more precise estimations, the 3D stereoscopic system should be used [
33,
34]. It certainly is a further research goal.
To our best knowledge, current trends in using photogrammetry methods are aimed at using UAVs [
29]. The nowadays main aim of ground photogrammetry is stem reconstruction for forest inventory purposes [
24,
28,
35]. Studies aimed at the use of ground-based solutions for estimations of volume on trucks [
36] or piles [
37] are sparse.
Use of this technique for load measurements has its limitations. Measurements are done only in one place and cannot take into account gaps due to the different assortment lengths nor can measure the second pile of logs.
Advantages are, however, significant. By using a high vantage point and cameras, the possibility of measurement error induced by the researcher is lowered. Properly set up cameras can record the whole shift, without interfering with the work of the forwarder. The data processing time is higher than with traditional gauge measured height of the load, but there is no need for the researcher to be present at the roadside while the forwarder is ready to unload. In our study, the forwarder was using several roadside landings, and taking measurements at all of them proved to be an organizational challenge. Using this method, data can be collected without interference to the work of the forwarder, contrary to the load sampling method. This new approach also offers details on the load assembly, as the time-lapse photos can capture the whole work cycle.
Nevertheless, this study shows a potential for at least the same accuracy as the gauge measurements, which are still being used and have their downsides [
17] with lower chances for researcher errors. Consumer-grade cameras are already available to many researchers and are not expensive. Timed photos can also provide basic timeframes for the work cycle during the whole shift. Together with GPS and CAN-Bus data, this method of load volume estimation can lead to a more automated approach to the forwarders time studies.
5. Conclusions
The photogrammetry can be used as a more effective method for measuring forwarder loads, mainly due to its ability to observe the top of the load. Use of photos for estimation of height of forwarder load showed inaccuracy issues in measurement by gauge measuring—mainly inaccuracy in estimation of the exact height, which is not always clearly visible from the ground. The photogrammetry method also saves time. Even though data processing is more time-consuming, researchers in the field do not need to be present at the roadside landings, or they can record other aspects of the work cycles.
We demonstrated that accuracy levels well within the limitations of the currently used method of gauge measuring could be relatively easily achieved. Furthermore, the proposed photogrammetric method enhanced with time-stamped photos can be effectively used in time studies.
Author Contributions
Conceptualization, O.N. and J.D.; methodology, O.N. and M.S.; validation, O.N. and M.S.; formal analysis, O.N. and M.S.; investigation, O.N. and M.S.; resources, O.N. and J.D.; data curation, O.N.; writing—original draft preparation, O.N. and M.S.; writing—review and editing, O.N., M.S. and J.D.; visualization, M.S.; supervision, J.D.; project administration, O.N.; funding acquisition, O.N. All authors have read and agreed to the published version of the manuscript.
Funding
This research was funded by the Faculty of Forestry and Wood Sciences, Czech University of Life Sciences in Prague, grant project IGA A_19_05 (Analysis of the new data collection methods for use in forestry machines for productivity studies).
Acknowledgments
We would like to thank the School Forestry Enterprise for their support in performing the experiment.
Conflicts of Interest
The authors declare no conflict of interest. The funders had no role in the design of the study; in the collection, analyses, or interpretation of data; in the writing of the manuscript; or in the decision to publish the results.
References
- Nurminen, T.; Korpunen, H.; Uusitalo, J. Time consumption analysis of the mechanized cut-to-length harvesting system. Silva Fenn. 2006, 40, 336–363. [Google Scholar] [CrossRef]
- Dvořák, J.; Chytrý, M.; Natov, P.; Martin, J.; Karlo, B. Long-term cost analysis of Mid-performance harvesters in czech conditions. Austrian J. For. Sci. 2019, 136, 351–372. [Google Scholar]
- Stankic, I.; Poršinsky, T.; Tomašić, Ž.; Tonkovic, I.; Frntic, M. Productivity models for operational planning of timber forwarding in croatia. Croat. J. For. Eng. 2012, 33, 61–78. [Google Scholar]
- Moskalik, T.; Borz, S.A.; Dvořák, J.; Ferencik, M.; Glushkov, S.; Muiste, P.; Lazdiņš, A.; Styranivsky, O. Timber harvesting methods in eastern european countries: A review. Croat. J. For. Eng. 2017, 38, 231–241. [Google Scholar]
- Laitila, J.; Asikainen, A.; Nuutinen, Y. Forwarding of whole trees after manual and mechanized felling bunching in pre-commercial thinnings. Int. J. For. Eng. 2007, 18, 29–39. [Google Scholar] [CrossRef]
- Jiroušek, R.; Klvač, R.; Skoupý, A. Productivity and costs of the mechanised cut-to-length wood harvesting system in clear-felling operations. J. For. Sci. 2007, 53, 476–482. [Google Scholar] [CrossRef]
- Lukáč, T. Viacoperačné Stroje v Lesnom Hospodárstve [Anglicky]; Technická univerzita vo Zvolene: Zvolen, Slovakia, 2005. [Google Scholar]
- Eriksson, M.; Lindroos, O. Productivity of harvesters and forwarders in CTL operations in northern Sweden based on large follow-up datasets. Int. J. For. Eng. 2014, 25, 179–200. [Google Scholar] [CrossRef]
- Manner, J.; Palmroth, L.; Nordfjell, T.; Lindroos, O. Load level forwarding work element analysis based on automatic follow-up data. Silva Fenn. 2016, 50. [Google Scholar] [CrossRef]
- Dvořák, J.; Bystrický, R.; Hrib, M.; Hošková, P.; Jarkovská, M.; Kováč, J.; Krilek, J.; Natov, P.; Natovová, L. The Use of Harvester Technology in Production Forests; Folia Fore; Lesnická práce s.r.o.: Kostelec nad Černými lesy, Czech Republic, 2011; ISBN 9788074580185. [Google Scholar]
- Proto, A.R.; Macrì, G.; Visser, R.; Harrill, H.; Russo, D.; Zimbalatti, G. Factors affecting forwarder productivity. Eur. J. For. Res. 2018, 137, 143–151. [Google Scholar] [CrossRef]
- Javůrek, P.; Dvořák, J. Evaluation of total time consumption in harvester technology deployment in conditions of the forest sector of the Czech Republic. J. For. Sci. 2018, 64, 33–42. [Google Scholar]
- Holzfeind, T.; Stampfer, K.; Holzleitner, F. Productivity, setup time and costs of a winch-assisted forwarder. J. For. Res. 2018, 23, 196–203. [Google Scholar] [CrossRef]
- Apafaian, A.; Proto, A.R.; Borz, S. Performance of a mid-sized harvester-forwarder system in integrated harvesting of sawmill, pulpwood and firewood. Ann. For. Res. 2017, 60. [Google Scholar]
- Proto, A.R.; Macrì, G.; Visser, R.; Harrill, H.; Russo, D.; Zimbalatti, G. A case study on the productivity of forwarder extraction in small-scale Southern Italian forests. Small-Scale For. 2018, 17, 71–87. [Google Scholar] [CrossRef]
- Berg, S.; Yoshida, M.; Sakurai, R.; Sakai, H. Productivity of loaders and forwarders in Japanese forestry operation conditions. J. For. Res. 2018, 23, 149–155. [Google Scholar] [CrossRef]
- Natov, P.; Nuhlíček, O.; Dvořák, J.; Szala, L.M.; Syrovátková, H. Analysis of volume differences occuring during timber scaling on different production locations. Zpravy Lesn. Vyzk. 2019, 64, 45–50. [Google Scholar]
- Knyaz, V.A.; Maksimov, A.A. Photogrammetric technique for timber stack volume contol. Int. Arch. Photogramm. Remote Sens. Spat. Inf. Sci. ISPRS Arch. 2014, 40, 157–162. [Google Scholar] [CrossRef]
- Manner, J.; Berg, S.; Ersson, B.T. Forwarding during final felling: Work element-specific distributions of driving distances at the stand level. Int. J. For. Eng. 2020, 31, 51–69. [Google Scholar] [CrossRef]
- Pandur, Z.; Horvat, D.; Susnjar, M.; Zoric, M.; Benic, D.; Matija, B. Applicability of hydraulic dynamometer for measuring load mass on forwarders. Glas. Sumar. Fak. 2015, 2015, 101–110. [Google Scholar] [CrossRef]
- Galsgaard, B.; Lundtoft, D.H.; Nikolov, I.; Nasrollahi, K.; Moeslund, T.B. Circular hough transform and local circularity measure for weight estimation of a graph-cut based wood stack measurement. In Proceedings of the 2015 IEEE Winter Conference on Applications of Computer Vision, WACV 2015, Waikoloa, HI, USA, 5–9 January 2015; pp. 686–693. [Google Scholar]
- Nylinder, M.; Kubénka, T.; Hultnäs, M. Roundwood Measurement of Truck Loads by Laser Scanning a Field Study at Arauco Pulp Mill Nueva Aldea; Curitiba, Brazil; Unpublished report; 2009. [Google Scholar]
- White, J.C.; Coops, N.C.; Wulder, M.A.; Vastaranta, M.; Hilker, T.; Tompalski, P. Remote sensing technologies for enhancing forest inventories: A review. Can. J. Remote Sens. 2016, 42, 619–641. [Google Scholar] [CrossRef]
- Mikita, T.; Janata, P.; Surový, P. Forest stand inventory based on combined aerial and terrestrial close-range photogrammetry. Forests 2016, 7, 165. [Google Scholar] [CrossRef]
- Liang, X.; Jaakkola, A.; Wang, Y.; Hyyppä, J.; Honkavaara, E.; Liu, J.; Kaartinen, H. The use of a hand-held camera for individual tree 3D mapping in forest sample plots. Remote Sens. 2014, 6, 6587–6603. [Google Scholar] [CrossRef]
- Forsman, M.; Börlin, N.; Holmgren, J. Estimation of tree stem attributes using terrestrial photogrammetry with a camera rig. Forests 2016, 7, 61. [Google Scholar] [CrossRef]
- Dick, A.R.; Kershaw, J.A.; MacLean, D.A. Spatial tree mapping using photography. North. J. Appl. For. 2010, 27, 68–74. [Google Scholar] [CrossRef]
- Mokroš, M.; Výbošt’ok, J.; Tomaštík, J.; Grznárová, A.; Valent, P.; Slavík, M.; Merganič, J. High precision individual tree diameter and perimeter estimation from close-range photogrammetry. Forests 2018, 9, 696. [Google Scholar] [CrossRef]
- Acuna, M.; Sosa, A. Automated Volumetric Measurements of Truckloads through Multi-View Photogrammetry and 3D Reconstruction Software. Croat. J. For. Eng. 2019, 40, 151–162. [Google Scholar]
- Willmott, C.J.; Matsuura, K. Advantages of the mean absolute error (MAE) over the root mean square error (RMSE) in assessing average model performance. Clim. Res. 2005, 30, 79–82. [Google Scholar] [CrossRef]
- R Core Team. R: A Language and Environment for Statistical Computing; R Foundation for Statistical Computing: Vienna, Austria, 2017; Available online: https://www.R-project.org/ (accessed on 22 June 2020).
- Poulin-Girard, A.-S.; Thibault, S.; Laurendeau, D. Influence of camera calibration conditions on the accuracy of 3D reconstruction. Opt. Express 2016, 24, 2678–2686. [Google Scholar] [CrossRef]
- Rodríguez-García, C.; Montes, F.; Ruiz, F.; Cañellas, I.; Pita, P. Stem mapping and estimating standing volume from stereoscopic hemispherical images. Eur. J. For. Res. 2014, 133, 895–904. [Google Scholar] [CrossRef]
- Sánchez-González, M.; Cabrera, M.; Herrera, P.J.; Vallejo, R.; Cañellas, I.; Montes, F. Basal area and diameter distribution estimation using stereoscopic hemispherical images. Photogramm. Eng. Remote Sensing 2016, 82, 605–616. [Google Scholar] [CrossRef]
- Liang, X.; Hyyppä, J.; Kaartinen, H.; Lehtomäki, M.; Pyörälä, J.; Pfeifer, N.; Holopainen, M.; Brolly, G.; Francesco, P.; Hackenberg, J.; et al. International benchmarking of terrestrial laser scanning approaches for forest inventories. ISPRS J. Photogramm. Remote Sens. 2018, 144, 137–179. [Google Scholar] [CrossRef]
- Sosa, A.; Klvac, R.; Coates, E.; Kent, T.; Devlin, G. Improving log loading efficiency for improved sustainable transport within the irish forest and biomass sectors. Sustainability 2015, 7, 3017–3030. [Google Scholar] [CrossRef]
- Kruglov, A.; Chiryshev, Y. The image analysis algorithm for the log pile photogrammetry measurement. WSEAS Trans. Signal Process. 2017, 13, 135–145. [Google Scholar]
© 2020 by the authors. Licensee MDPI, Basel, Switzerland. This article is an open access article distributed under the terms and conditions of the Creative Commons Attribution (CC BY) license (http://creativecommons.org/licenses/by/4.0/).


