Investigating the Optimal Location of Potential Forest Industry Clusters to Enhance Domestic Timber Utilization in South Korea

 , , ,
, , ,
Abstract
1. Introduction
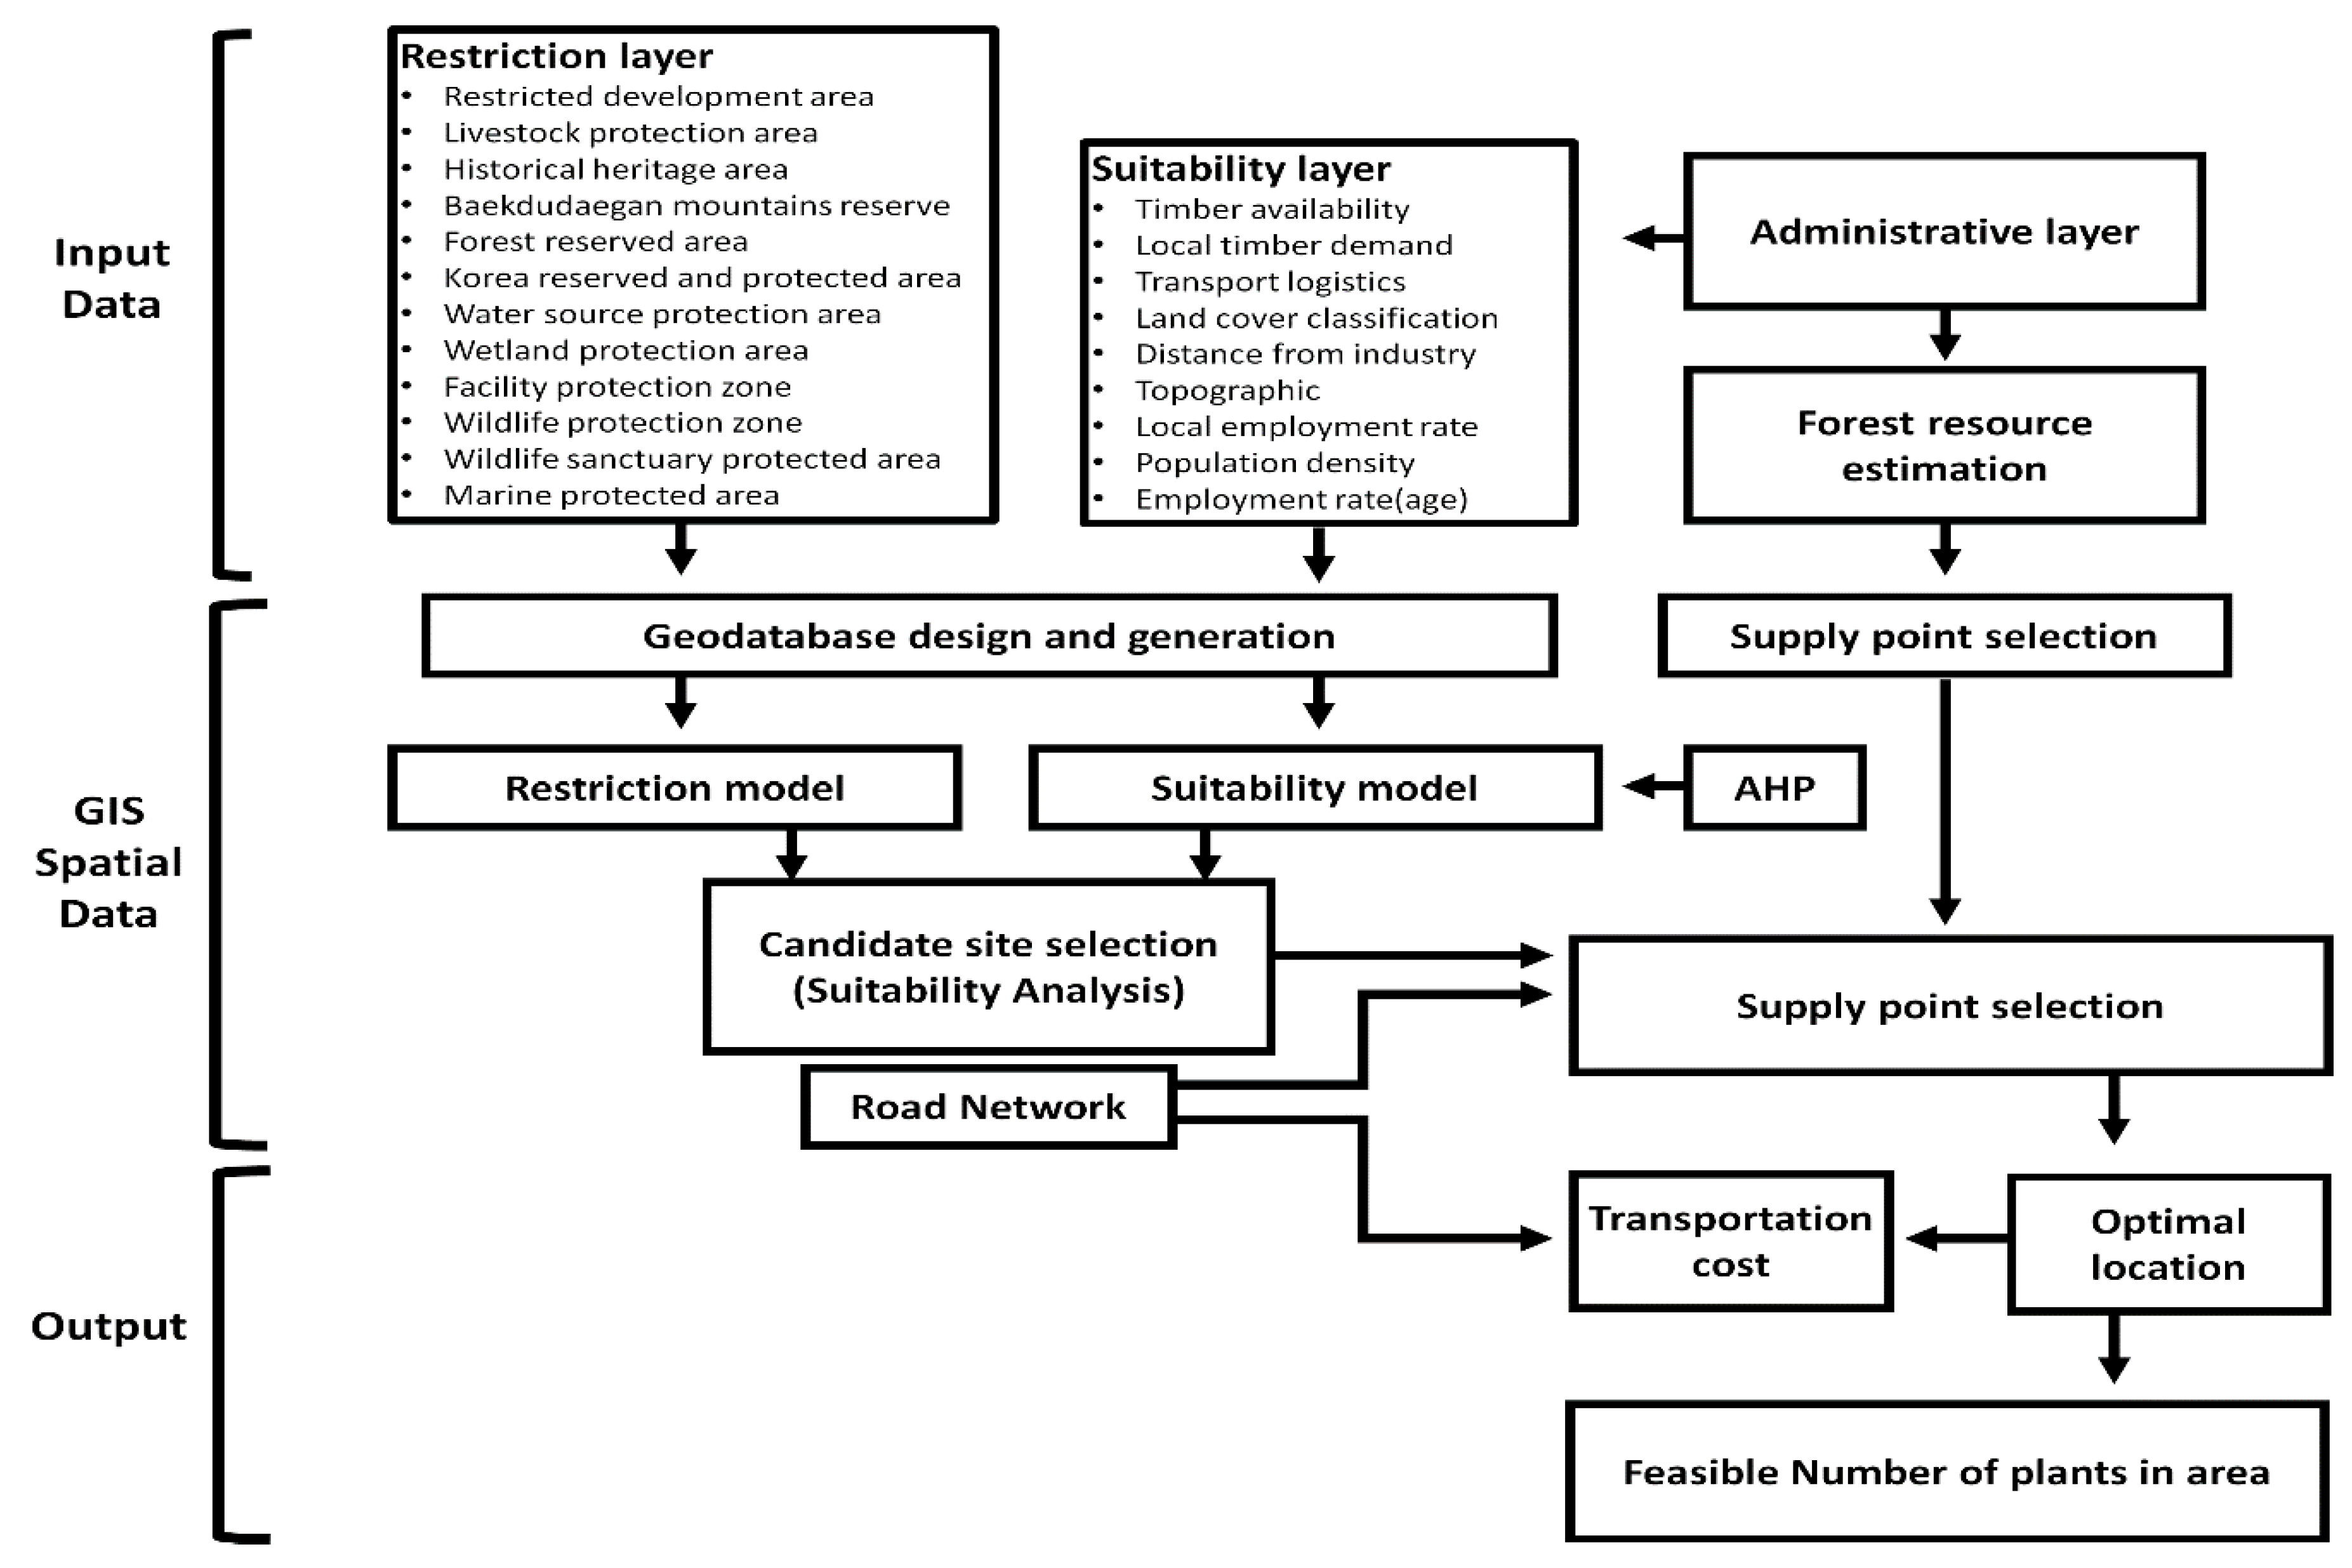
2. Methodology
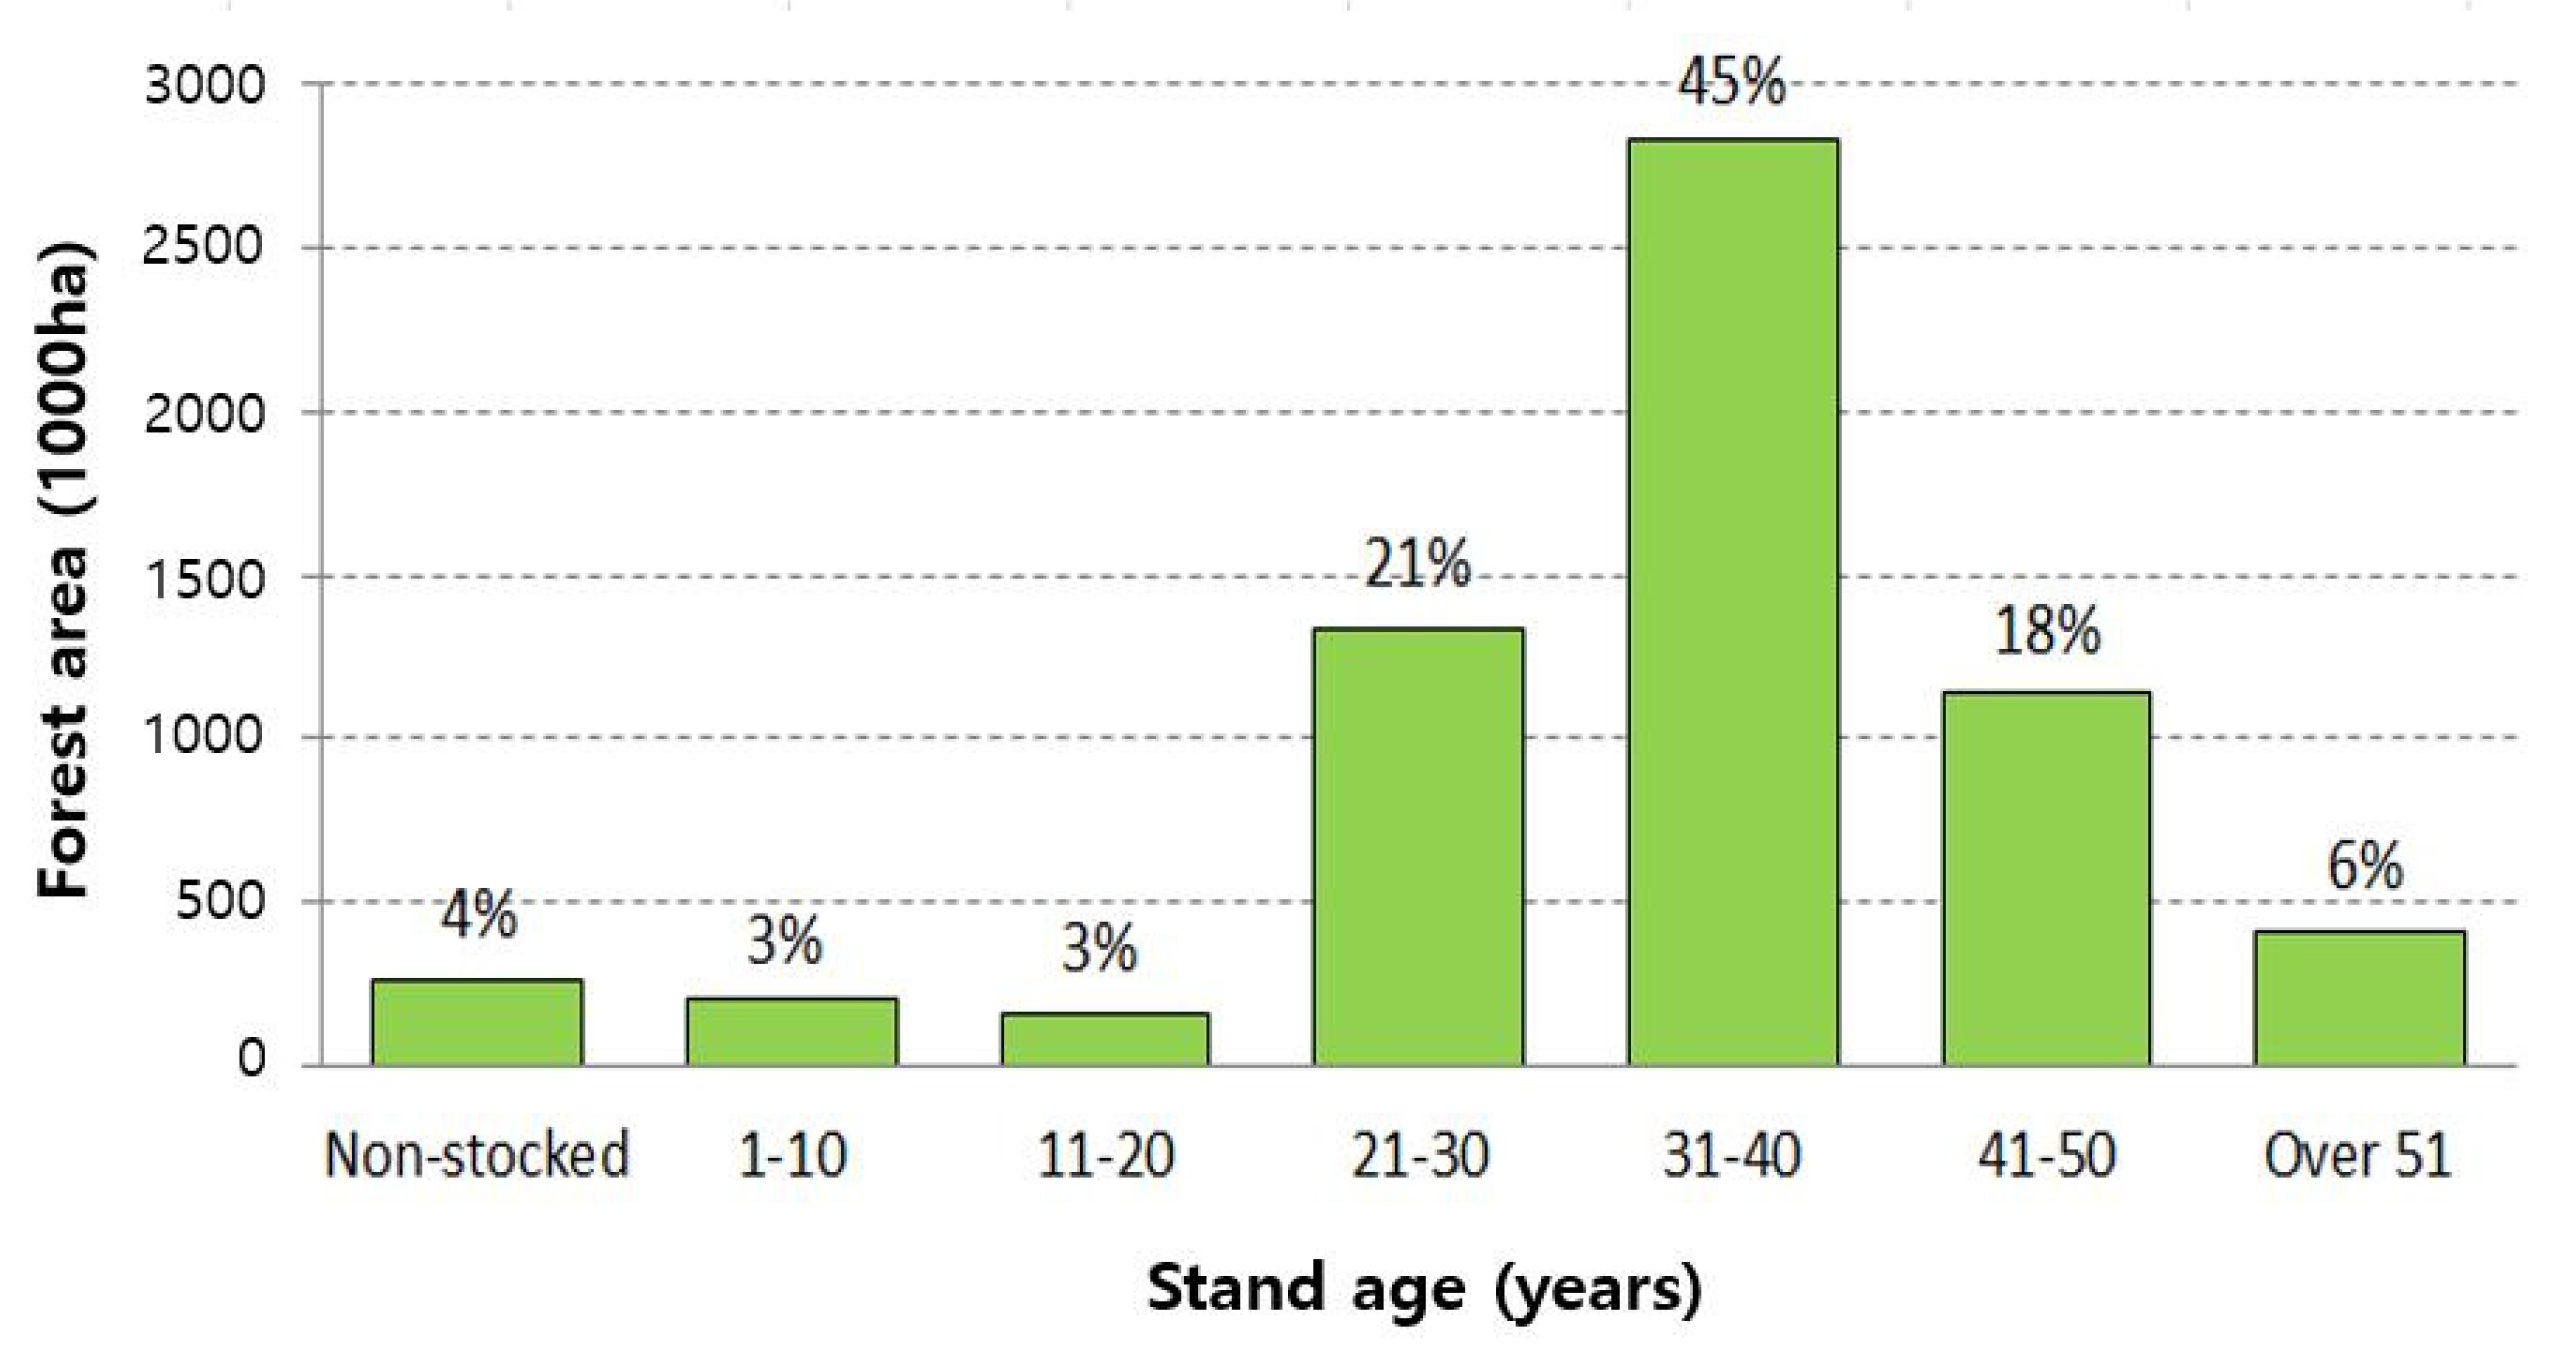
2.1. Forest Resources Availability in South Korea
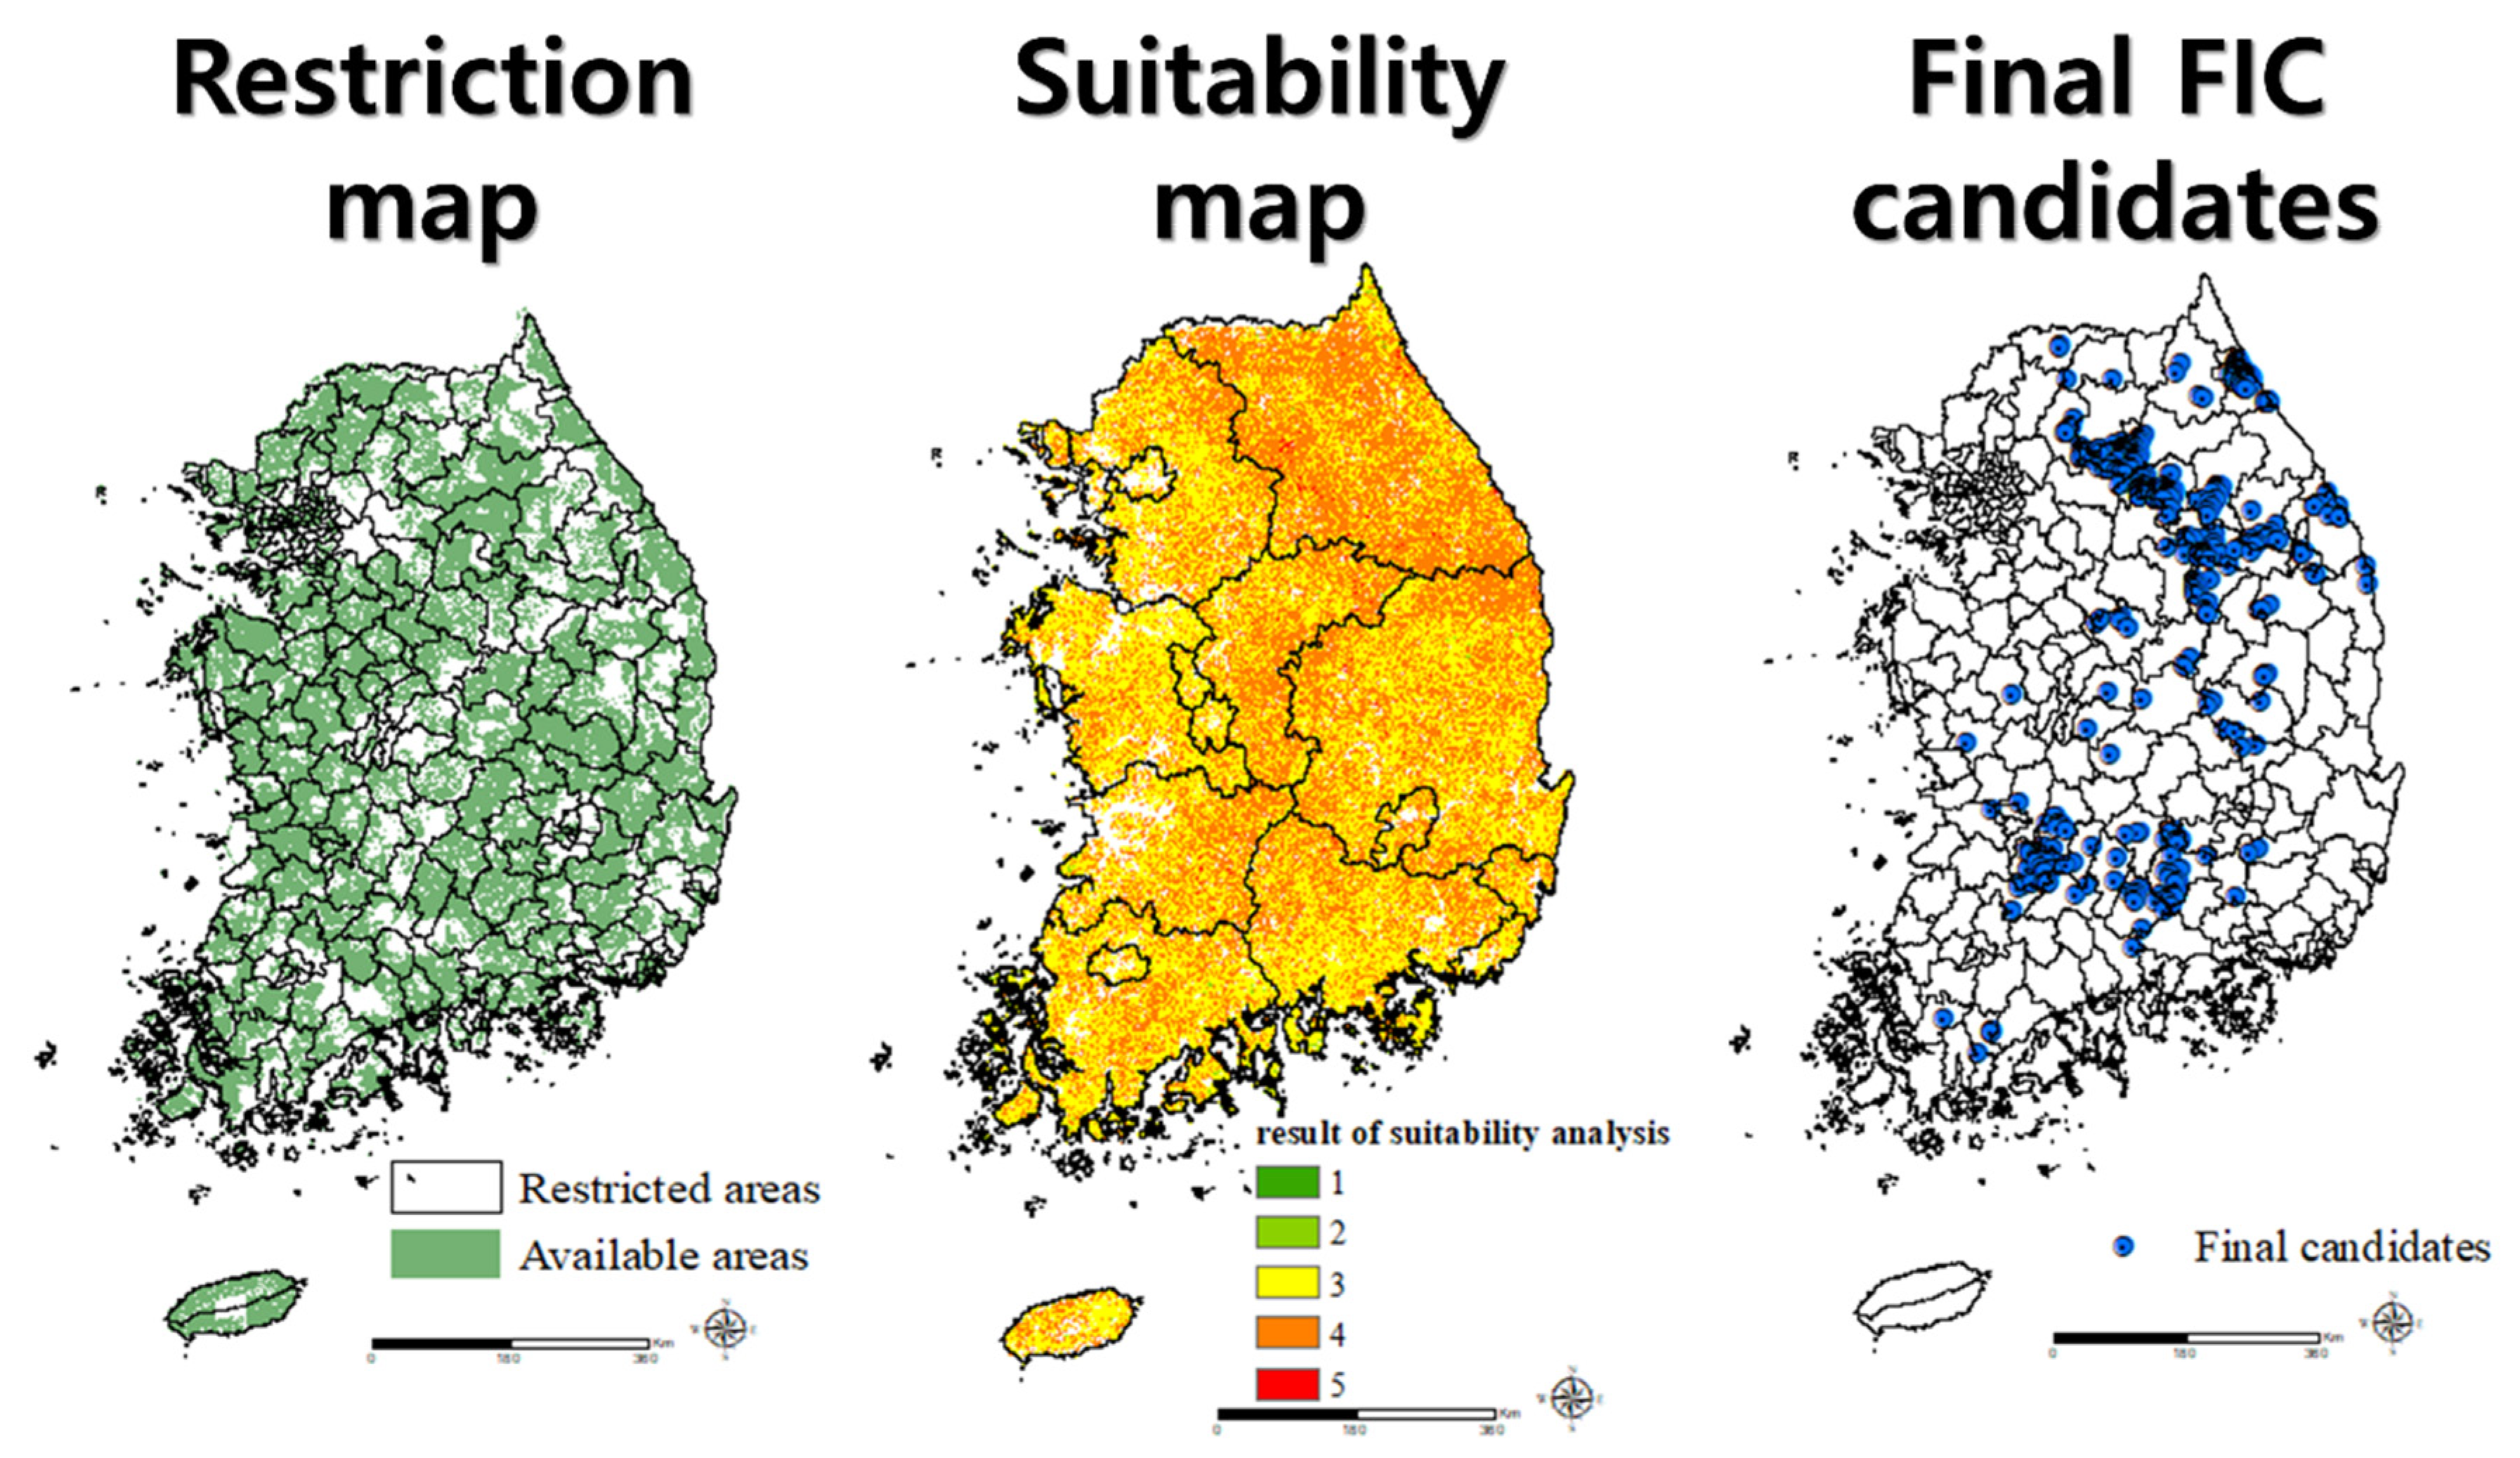
2.2. Restriction Model to Identify FIC Available Area
2.3. Developing a Suitability Model Using AHP
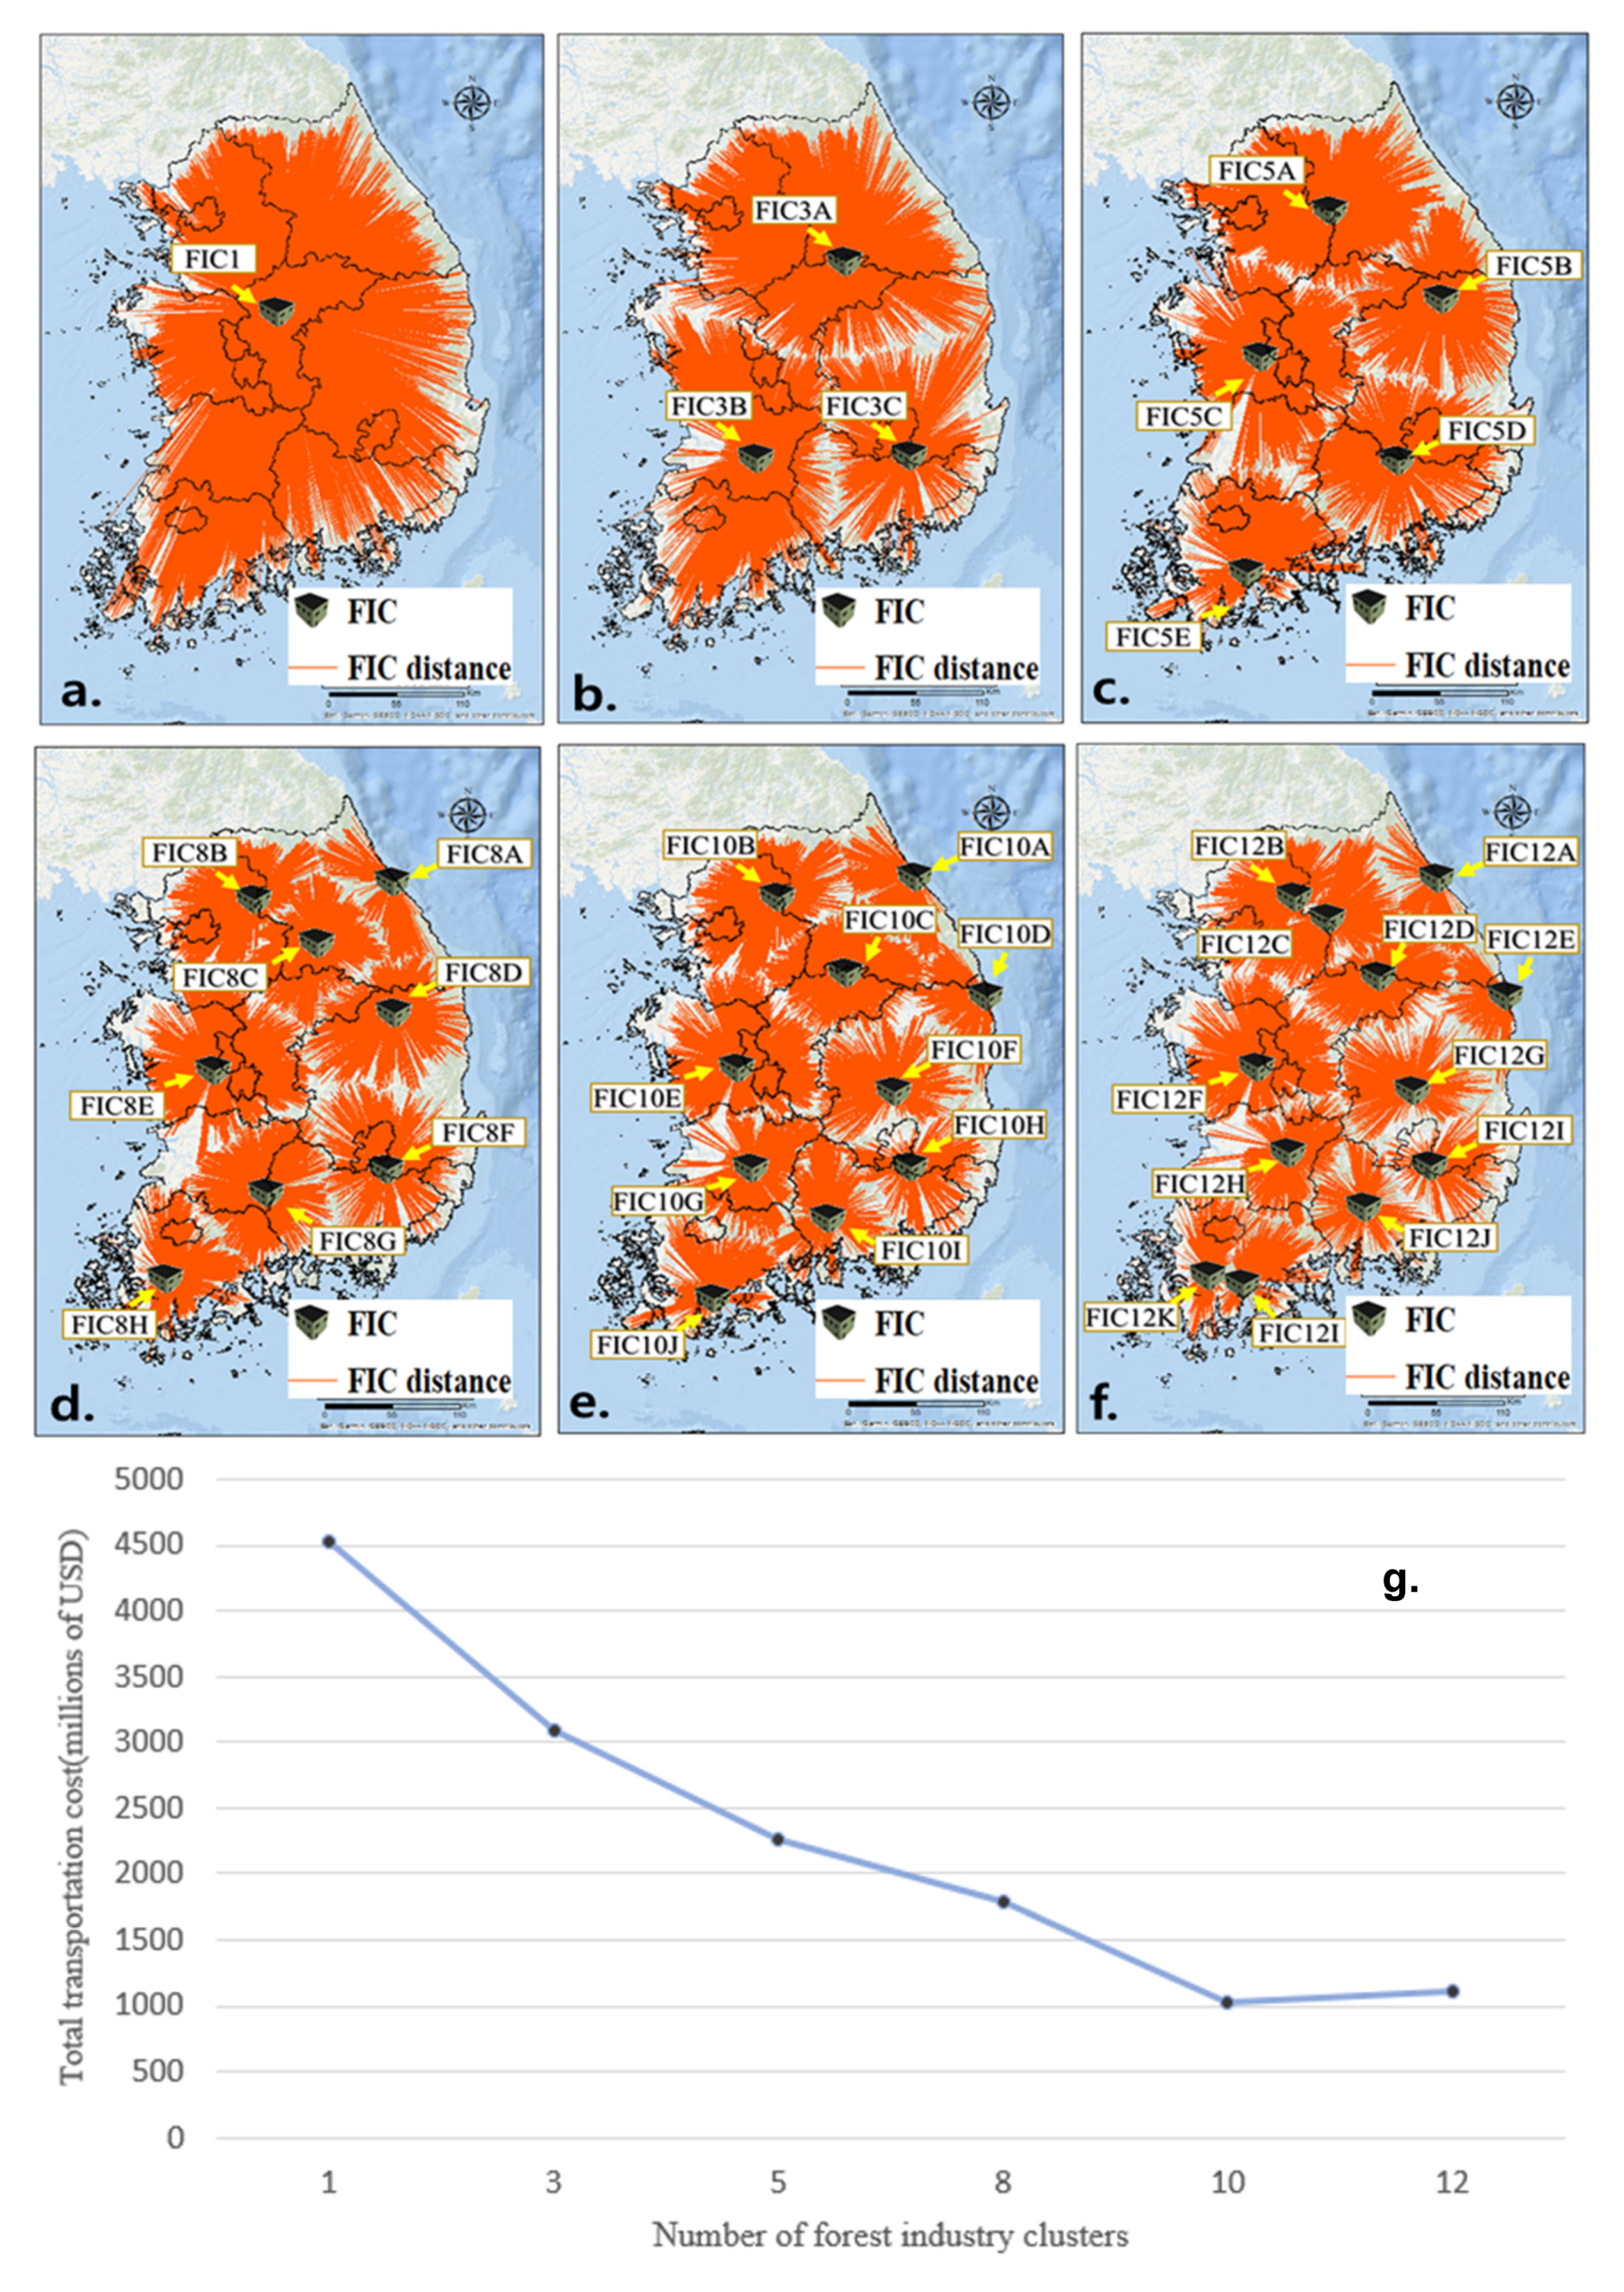
2.4. Identifying the Optimal Location of FIC Using Network Analysis
3. Results and Discussion
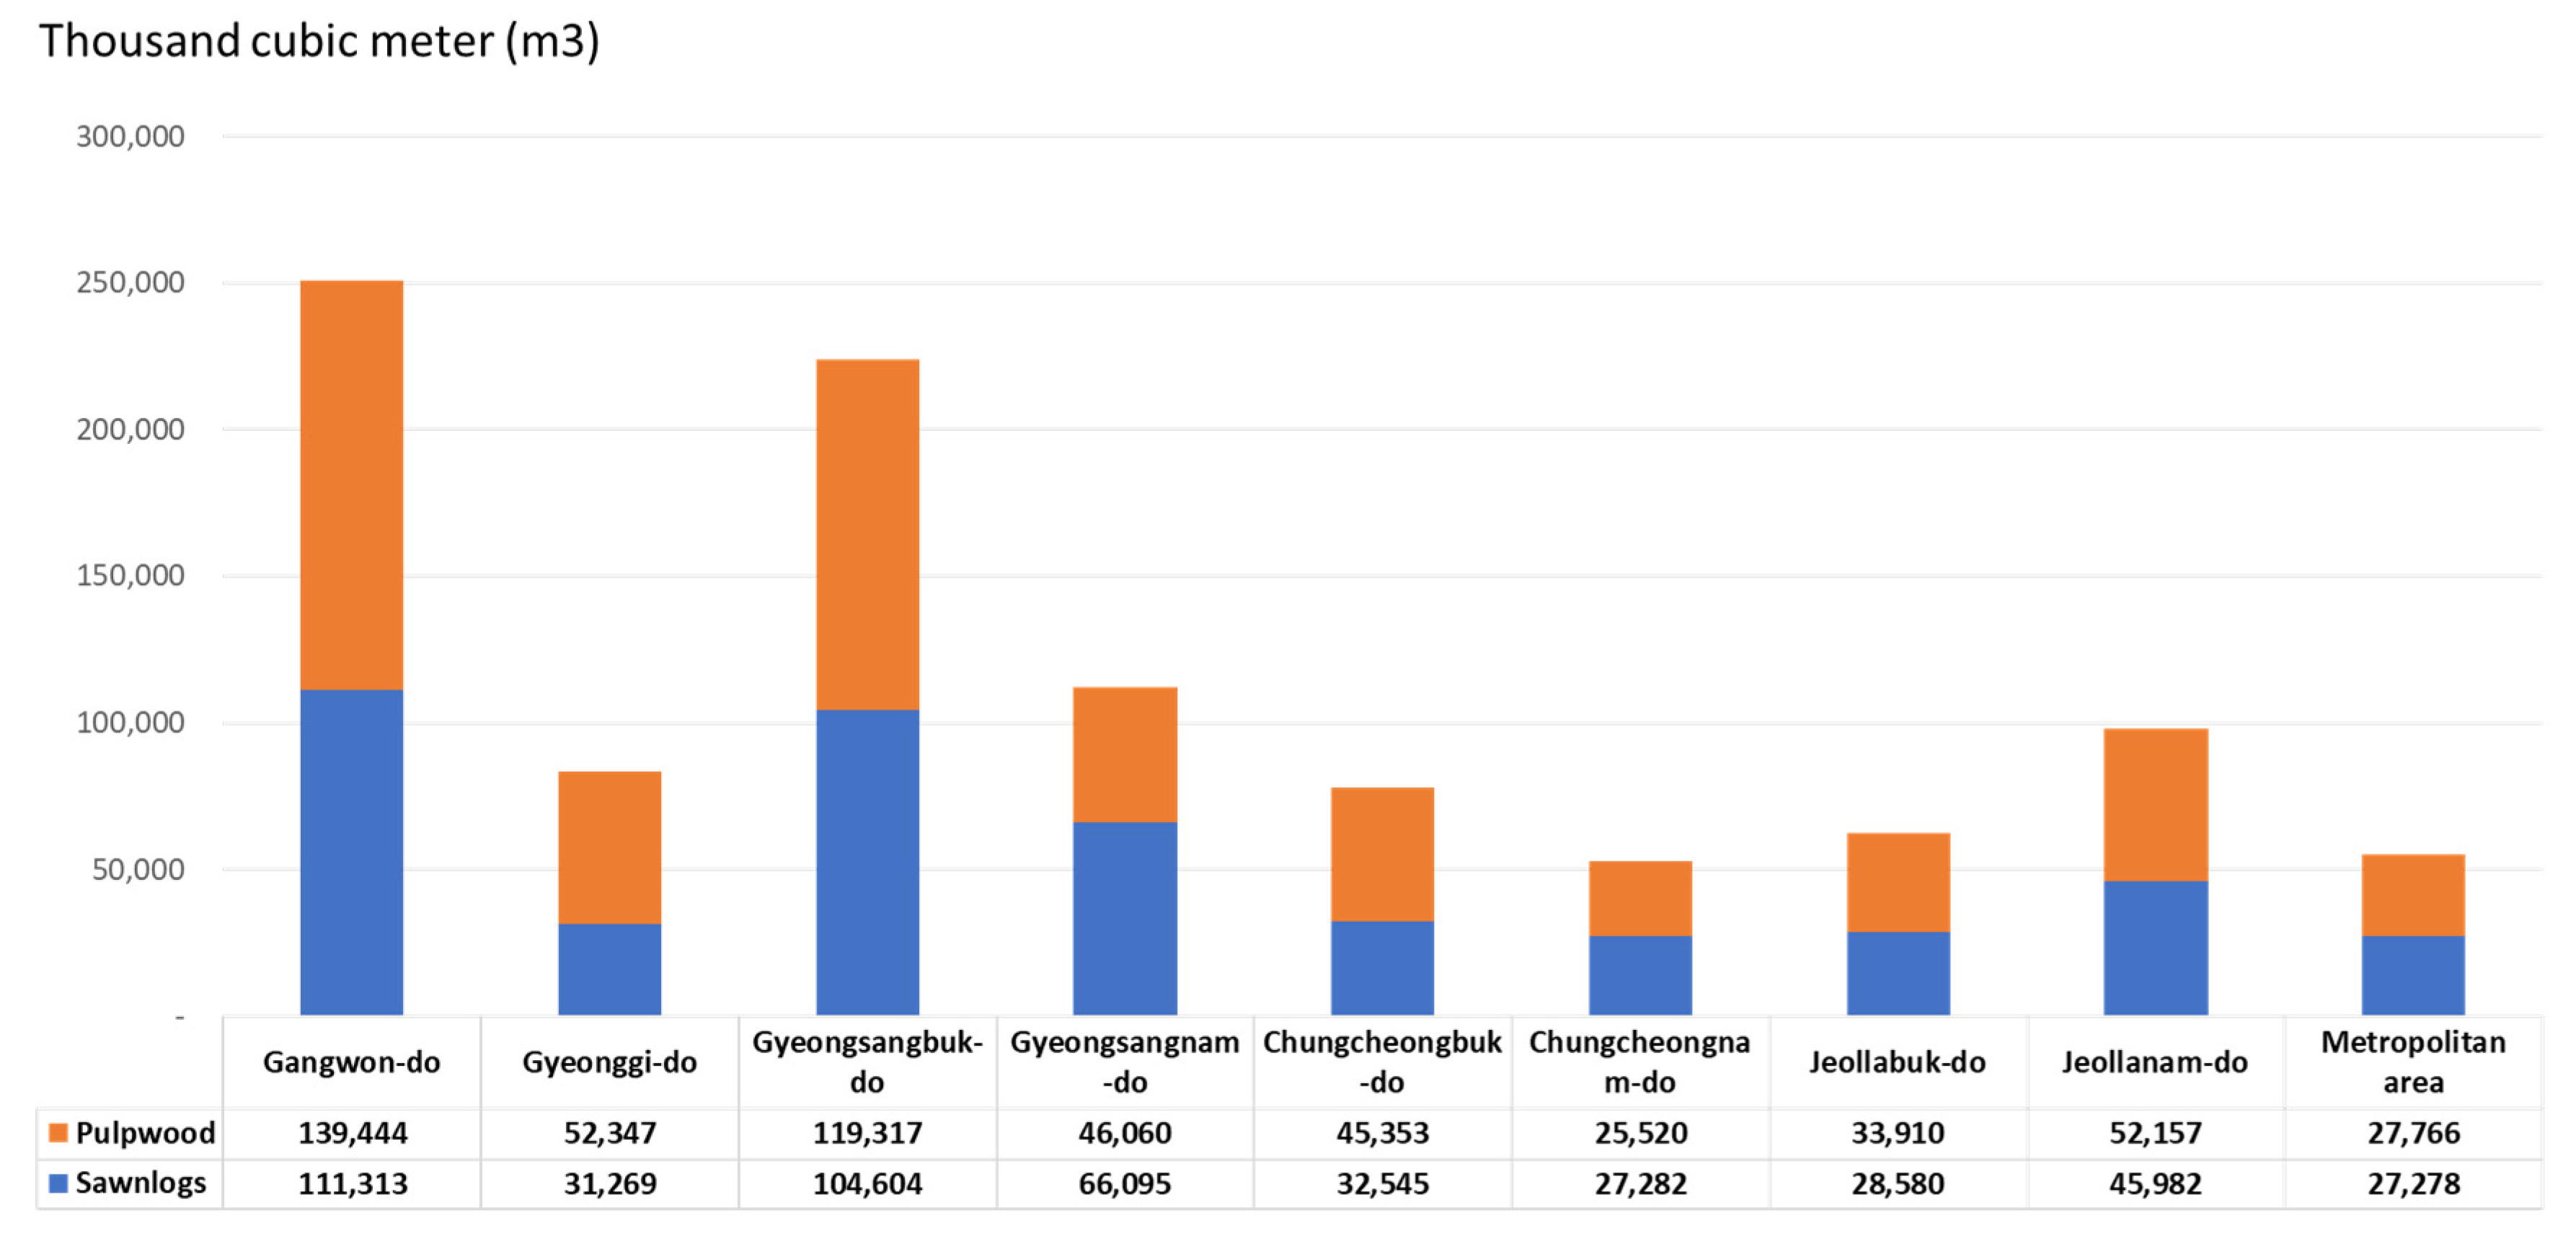
3.1. Forest Resources Availability in South Korea
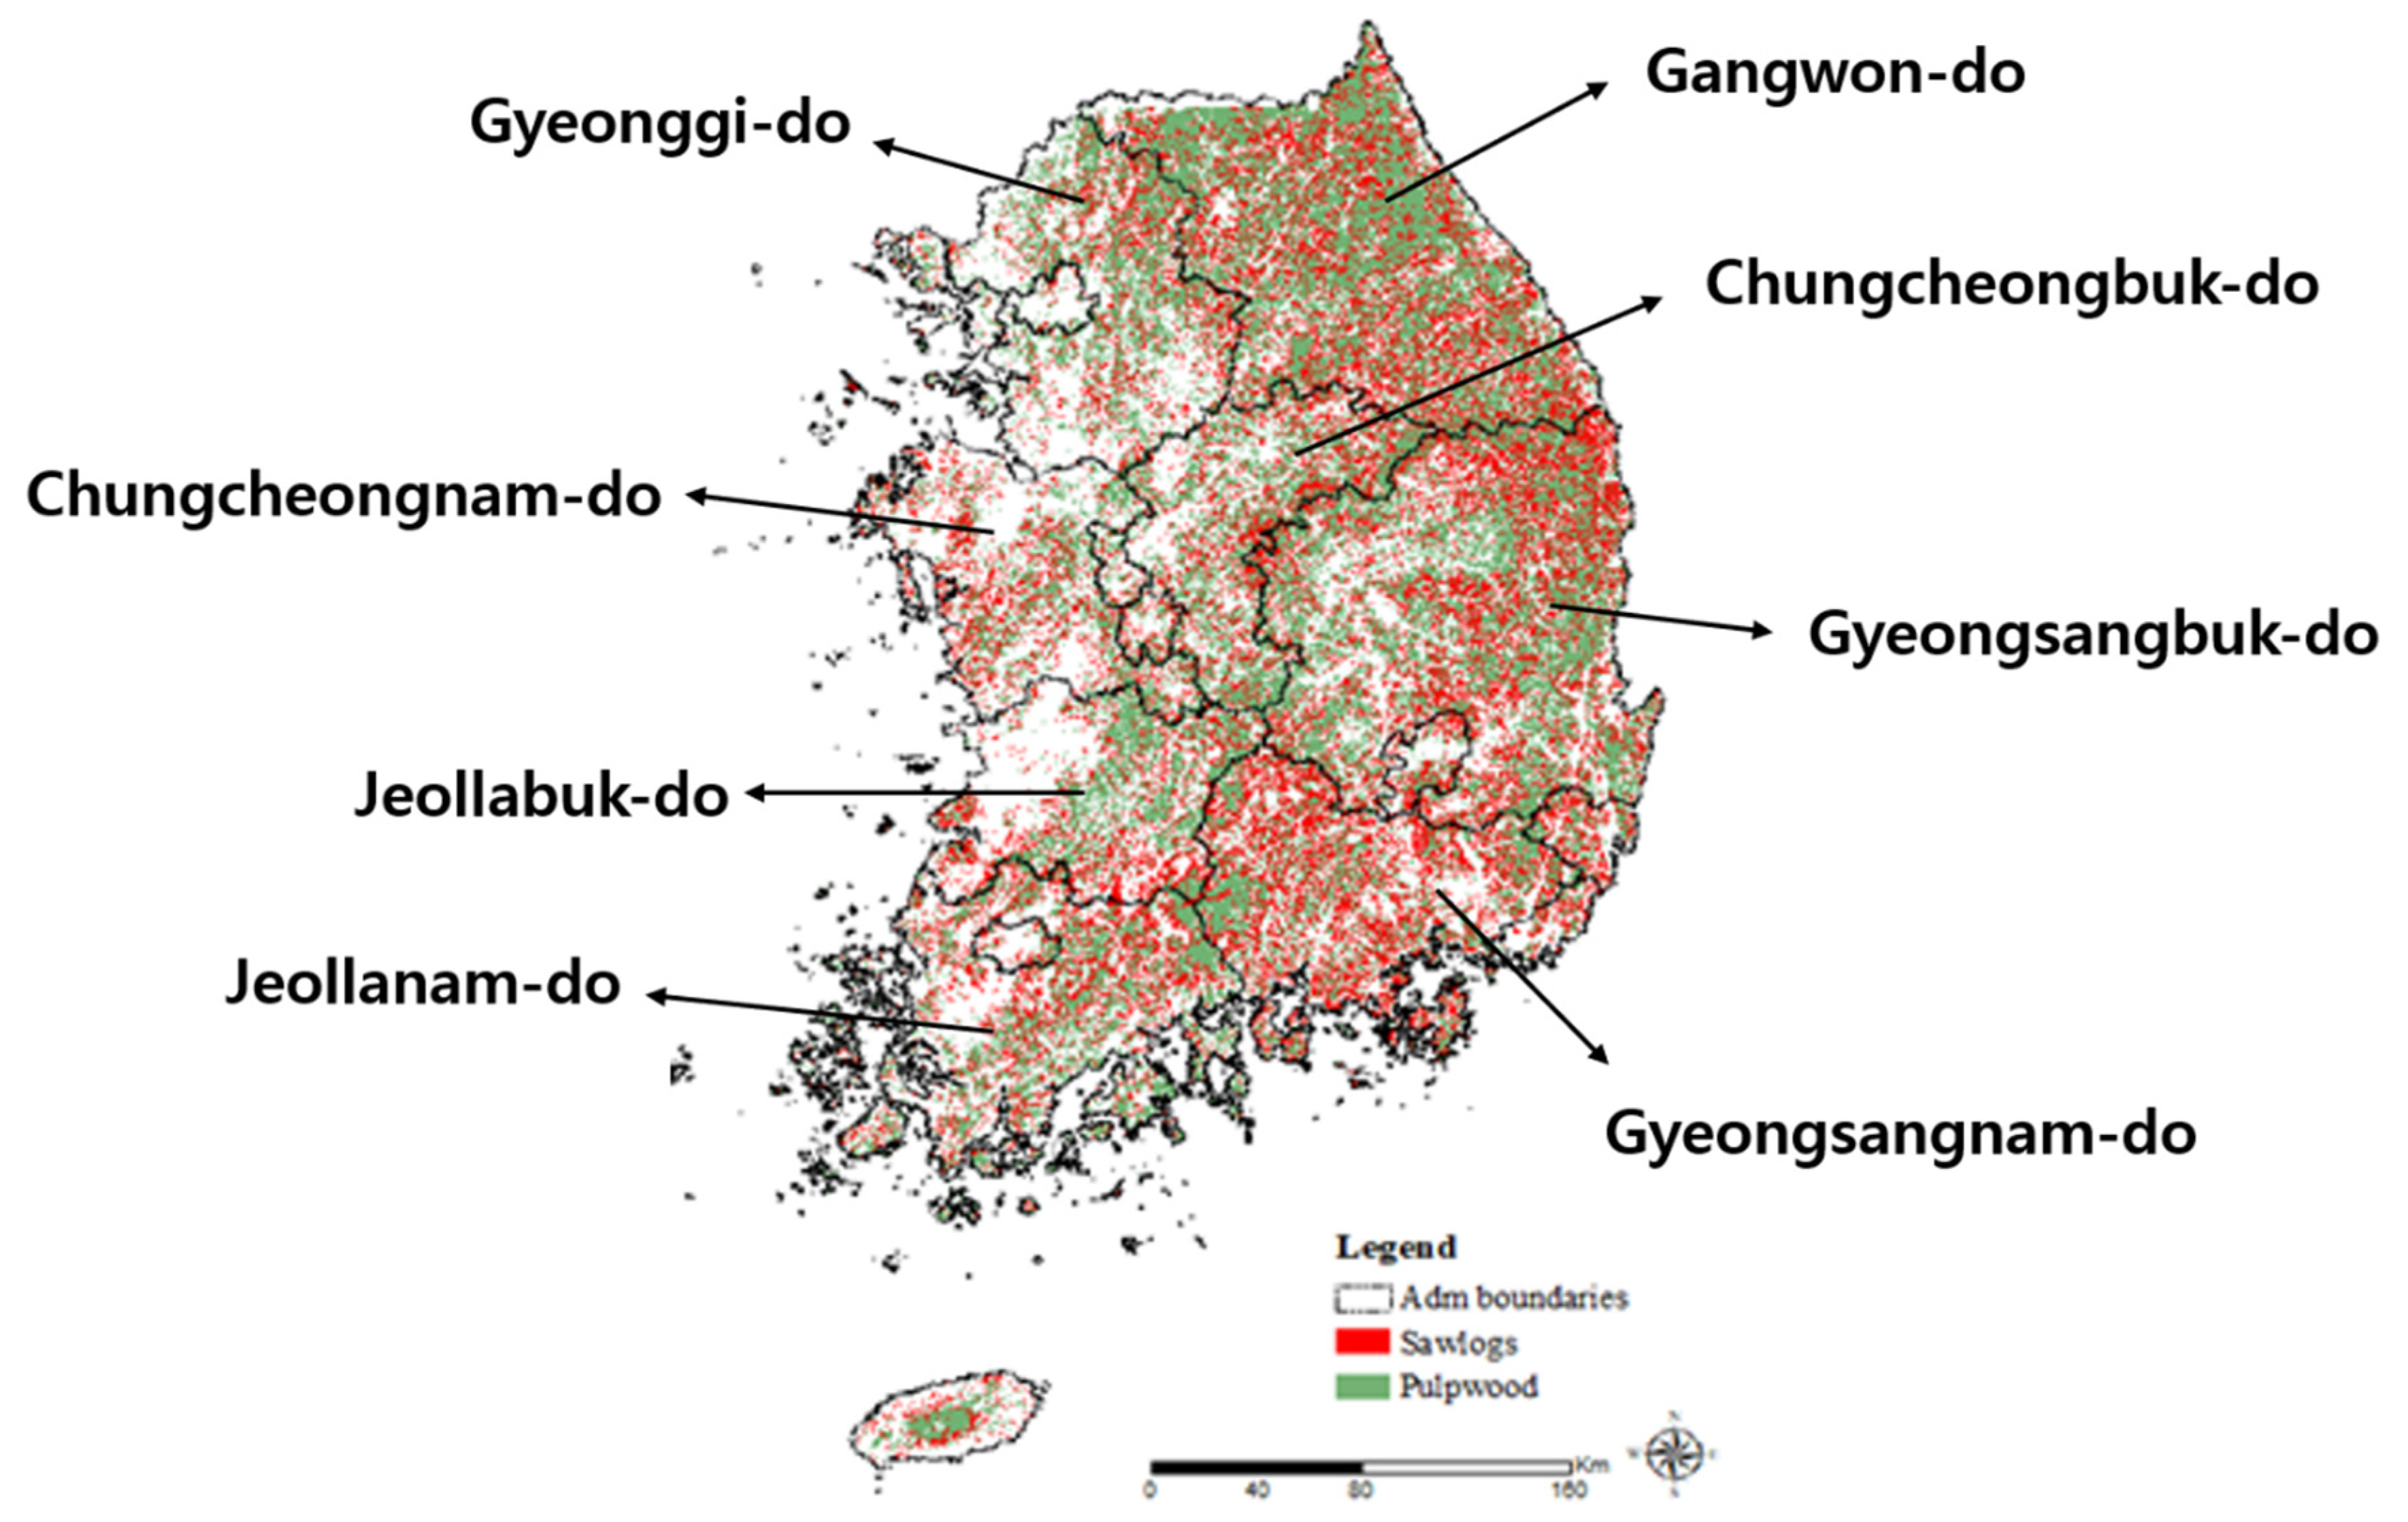
3.2. Identified Locations of Forest Industry Clusters Candidates in South Korea
3.3. Identified Optimal Locations of Potential FIC in South Korea
4. Conclusions
Author Contributions
Funding
Conflicts of Interest
References
- Carlsson, D.; Rönnqvist, M. Supply chain management in forestry—Case studies at Södra Cell AB. Eur. J. Oper. Res. 2005, 163, 589–616. [Google Scholar] [CrossRef]
- Bettinger, P.; Boston, K.; Siry, J.P.; Grebner, D.L. Forest Management and Planning; Academic Press: Cambridge, MA, USA, 2016. [Google Scholar]
- Shapiro, J. Modeling the Supply Chain; Nelson Education: Toronto, ON, Canada, 2006. [Google Scholar]
- Tayur, S.; Ganeshan, R.; Magazine, M. Quantitative Models for Supply Chain Management; Springer Science & Business Media: Berlin, Germany, 2012; Volume 17. [Google Scholar]
- Zhang, F.; Johnson, D.M.; Sutherland, J.W. A GIS-based method for identifying the optimal location for a facility to convert forest biomass to biofuel. Biomass Bioenergy 2011, 35, 3951–3961. [Google Scholar] [CrossRef]
- Koo, J.C. Enhancing Productivity of Domestic Wood through Industrial Clusters; Korea Forest Service, Ed.; Korea Forest Service: Daejeon, Korea, 2016. [Google Scholar]
- Sandberg, D.; Vasiri, M.; Trischler, J.; Öhman, M. The role of the wood mechanical industry in the Swedish forest industry cluster. Scand. J. For. Res. 2014, 29, 352–359. [Google Scholar] [CrossRef]
- Han, H.; Seol, A.; Jung, Y.; Chung, J. Maintaining long-rotation forestry: A new challenge for sustained yield of timber resources in South Korea. Int. For. Rev. 2018, 20, 199–205. [Google Scholar] [CrossRef]
- Korea Forest Service. Statistical Yearbook of Forestry; Korea Forest Service: Daejeon, Korea, 2019. [Google Scholar]
- MacDicken, K.G. Global forest resources assessment 2015: What, why and how? For. Ecol. Manag. 2015, 352, 3–8. [Google Scholar] [CrossRef]
- Lee, D.K.; Lee, Y.K. Roles of Saemaul Undong in reforestation and NGO activities for sustainable forest management in Korea. J. Sustain. For. 2005, 20, 1–16. [Google Scholar] [CrossRef]
- Choi, S.-W. Diversity and composition of larger moths in three different forest types of Southern Korea. Ecol. Res. 2008, 23, 503–509. [Google Scholar] [CrossRef]
- Korea Forest Service. The 6th Basic Forest Plan; Korea Forest Service: Daejeon, Korea, 2018. [Google Scholar]
- Yu, S.; Park, J.; Kim, M.; Kim, H.; Ryu, C.; Lee, Y.; Yang, W.; Jeong, Y.-g. Improving energy density and grindability of wood pellets by dry torrefaction. Energy Fuels 2019, 33, 8632–8639. [Google Scholar] [CrossRef]
- Korea Forest Service. Wood Supply Plan; Korea Forest Service: Daejeon, Korea, 2018. [Google Scholar]
- Min, K.; Seok, H.D.; Choi, J.Y. Policy Tasks to Improve the Profitability of Forest Management in Korea; Korea Rural Economic Institute, Ed.; Korea Rural Economic Institute: Naju, Korea, 2018. [Google Scholar]
- Kim, K.D. A Study on the Policy of Sustainable Domestic Timber Supply Using Delphi Technique and AHP. In Forestry; Kyungpook National University: Daegu, Korea, 2012; p. 133. [Google Scholar]
- Korea Forest Service. A Survey on the Actual Condition of Timber Use in South Korea; Korea Forest Service, Ed.; Korea Forest Service: Daejeon, Korea, 2011. [Google Scholar]
- Kim, J.; Choi, S.; Kim, C.; Kim, W. Analysis of Wood Distribution Structure; Korea Forest Service, Ed.; Korea Forest Service: Daejeon, Korea, 2005; p. 87. [Google Scholar]
- Kim, C.; Park, Y.; Kim, J.; Choi, S. Trends of Wood Industry and Analysis of Impacts on Log Demand and Supply in 2005. J. Korean For. Econ. 2006, 14, 13–22. [Google Scholar]
- Woo, H. Forestry Biomass Residue Supply Chains in Tasmania: Developing a Digital Tool and Enhancing Modelling to Improve Data Accuracy, Location Mapping and Impact Assessments for Future Bioenergy; University of Tasmania: Hobart, Australia, 2020. [Google Scholar]
- Noon, C.E.; Daly, M.J. GIS-based biomass resource assessment with BRAVO. Biomass Bioenergy 1996, 10, 101–109. [Google Scholar] [CrossRef]
- Burak, A.; Harry, C.; David, W.; Kevin, G.; Sujith, S.; Mario, E.; Norman, S. Woody biomass and mill waste utilization opportunities in Alabama: Transportation cost minimization, optimum facility location, economic feasibility, and impact. Environ. Prog. Sustain. Energy 2011, 30, 720–732. [Google Scholar] [CrossRef]
- Köhl, M.; Magnussen, S.S.; Marchetti, M. Sampling Methods, Remote Sensing and GIS Multiresource Forest Inventory; Springer Science & Business Media: Berlin, Germany, 2006. [Google Scholar]
- Wijaya, A.; Kusnadi, S.; Gloaguen, R.; Heilmeier, H. Improved strategy for estimating stem volume and forest biomass using moderate resolution remote sensing data and GIS. J. For. Res. 2010, 21, 1–12. [Google Scholar] [CrossRef]
- Chirici, G.; Barbati, A.; Maselli, F. Modelling of Italian forest net primary productivity by the integration of remotely sensed and GIS data. For. Ecol. Manag. 2007, 246, 285–295. [Google Scholar] [CrossRef]
- Yoshioka, T.; Sakai, H. Amount and availability of forest biomass as an energy resource in a mountainous region in Japan: A GIS-based analysis. Croat. J. For. Eng. J. Theory Appl. For. Eng. 2005, 26, 59–70. [Google Scholar]
- Devlin, G.J.; McDonnell, K.; Ward, S. Timber haulage routing in Ireland: An analysis using GIS and GPS. J. Transp. Geogr. 2008, 16, 63–72. [Google Scholar] [CrossRef]
- Dean, D.J. Finding optimal routes for networks of harvest site access roads using GIS-based techniques. Can. J. For. Res. 1997, 27, 11–22. [Google Scholar] [CrossRef]
- Woo, H.; Acuna, M.; Moroni, M.; Taskhiri, M.; Turner, P. Optimizing the location of biomass energy facilities by integrating Multi-Criteria Analysis (MCA) and Geographical Information Systems (GIS). Forests 2018, 9, 585. [Google Scholar] [CrossRef]
- Yue, C.-D.; Yang, G.G.-L. Decision support system for exploiting local renewable energy sources: A case study of the Chigu area of southwestern Taiwan. Energy Policy 2007, 35, 383–394. [Google Scholar] [CrossRef]
- Buchholz, T.; Rametsteiner, E.; Volk, T.A.; Luzadis, V.A. Multi criteria analysis for bioenergy systems assessments. Energy Policy 2009, 37, 484–495. [Google Scholar] [CrossRef]
- Van Dael, M.; Van Passel, S.; Pelkmans, L.; Guisson, R.; Swinnen, G.; Schreurs, E. Determining potential locations for biomass valorization using a macro screening approach. Biomass Bioenergy 2012, 45, 175–186. [Google Scholar] [CrossRef]
- Perpiña, C.; Martínez-Llario, J.C.; Pérez-Navarro, Á. Multicriteria assessment in GIS environments for siting biomass plants. Land Use Policy 2013, 31, 326–335. [Google Scholar] [CrossRef]
- Mourmouris, J.; Potolias, C. A multi-criteria methodology for energy planning and developing renewable energy sources at a regional level: A case study Thassos, Greece. Energy Policy 2013, 52, 522–530. [Google Scholar] [CrossRef]
- Boggia, A.; Cortina, C. Measuring sustainable development using a multi-criteria model: A case study. J. Environ. Manag. 2010, 91, 2301–2306. [Google Scholar] [CrossRef] [PubMed]
- Wang, J.-J.; Jing, Y.-Y.; Zhang, C.-F.; Zhao, J.-H. Review on multi-criteria decision analysis aid in sustainable energy decision-making. Renew. Sustain. Energy Rev. 2009, 13, 2263–2278. [Google Scholar] [CrossRef]
- Massimo, M. Optimal plant size and feedstock supply radius: Minimize the production or maximize the profits? In Proceedings of the 20th European Biomass Conference and Exhibition, Milan, Italy, 18–22 June 2012; pp. 1–7. [Google Scholar]
- Korea Forest Service. Wood Grade Standard; Korea Forest Service: Daejeon, Korea, 2019; Notice 2017-97. [Google Scholar]
- Saaty, T.L. Decision making with the analytic hierarchy process. Int. J. Serv. Sci. 2008, 1, 83–98. [Google Scholar] [CrossRef]
- Won, H.K.; Jang, K.M.; Kim, Y.H.; Lee, K.H.; Kim, H.H. Estimation of Potential Wood Supply by according to Geographical and Forest Management Conditions in Korea. J. Agric. Life Sci. 2011, 45, 35–41. [Google Scholar]
- Yeong-Hwan, K.; Eo-Jin, J.; Yong, S.M.; Il-Bin, C.; Sangtae, L.; Kyungwon, S.; Jungkee, P. A Study on the Baseline Carbon Stock for Major Species in Korea for Conducting Carbon Offset Projects based on Forest Management. J. Korean Soc. For. Sci. 2014, 103. [Google Scholar] [CrossRef]
- Son, Y.; Kim, R.; Lee, K.; Pyo, J.; Kim, S.; Hwang, J.; Lee, S.; Park, H. Carbon Emission Factors and Biomass Allometric Equations by Species in Korea; Korea Forest Research Institute: Seoul, Korea, 2014; (In Korean with English abstract). [Google Scholar]
- Mickler, R.A.; Earnhardt, T.S.; Moore, J.A. Regional estimation of current and future forest biomass. Environ. Pollut. 2002, 116, S7–S16. [Google Scholar] [CrossRef]
- Korea Forest Service. Forest Geospatial Information System. Available online: http://data.forest.go.kr (accessed on 3 January 2020).
- MOLIT. Enforcement Rules of the Law on Planning and Utilization of National Territory. In 1438; Ministry of Land, Infrastructure and Transport: Seoul, Korea, 2018. [Google Scholar]
- Analyst, A.S. Advanced GIS Spatial Analysis Using Raster and Vector Data; Environmental System Research Institute: New York, NY, USA, 2001. [Google Scholar]
- Sultana, A.; Kumar, A. Optimal siting and size of bioenergy facilities using geographic information system. Appl. Energy 2012, 94, 192–201. [Google Scholar] [CrossRef]
- Daskin, M.S. Network and Discrete Location: Models, Algorithms, and Applications; John Wiley & Sons: NewYork, NY, USA, 2011. [Google Scholar]
- ESRI. Algorithm Used by Network Analyst; ESRI: Redlands, CA, USA, 2011. [Google Scholar]
- Delivand, M.K.; Cammerino, A.R.B.; Garofalo, P.; Monteleone, M. Optimal locations of bioenergy facilities, biomass spatial availability, logistics costs and GHG (greenhouse gas) emissions: A case study on electricity productions in South Italy. J. Clean. Prod. 2015, 99, 129–139. [Google Scholar] [CrossRef]
- Korea Forest Service. The Quarterly Market Prices of Domestic Timber; Korea Forest Service, Ed.; Korea Forestry Promotion Institute (KOFPI): Daejeon, Korea, 2019; pp. 2288–7369. [Google Scholar]
- Ogunwusi, A.; Ifeyinwa, O. Enhancing Productivity of Forest Industry through Industrial Clusters Concept. Ind. Eng. Lett. 2012, 2, 19–29. [Google Scholar]


| Species | Total (1000 ha) | The Area by Stand Age (1000 ha) | ||||||
|---|---|---|---|---|---|---|---|---|
| Non-Stocked | 1–10 | 11–20 | 21–30 | 31–40 | 41–50 | >50 | ||
| Coniferous | 2339 | - | 91 | 60 | 397 | 1172 | 504 | 115 |
| Deciduous | 2029 | - | 76 | 61 | 515 | 829 | 357 | 191 |
| Mixed | 1706 | - | 36 | 39 | 422 | 829 | 276 | 103 |
| Total | 6334 | 261 | 203 | 160 | 1334 | 2830 | 1137 | 409 |
| Province | Species | |||
|---|---|---|---|---|
| Gangwon | Coniferous | Pinus densiflora Siebold & Zucc. | 63.409 | 37.519 |
| Pinus koraiensis Siebold & Zucc. | 68.681 | 67.668 | ||
| Larix kaempferi (Lamb.) Carr. | 50.261 | 2.235 | ||
| Pinus rigida Mill. | 60.577 | 3.290 | ||
| Deciduous | 37.380 | −3.065 | ||
| Mixed | 60.795 | 45.833 | ||
| Gyeonggi | Coniferous | Pinus densiflora | 51.020 | 18.414 |
| Pinus koraiensis | 64.854 | 58.107 | ||
| Larix kaempferi | 40.858 | −23.908 | ||
| Pinus rigida | 58.098 | 20.300 | ||
| Deciduous | 39.891 | −0.960 | ||
| Mixed | 58.712 | 40.769 | ||
| Gyeongnam | Coniferous | Pinus densiflora | 49.434 | 21.596 |
| Pinus koraiensis | 62.312 | 44.090 | ||
| Larix kaempferi | 52.589 | 15.390 | ||
| Pinus rigida | 57.766 | 27.816 | ||
| Deciduous | 40.252 | 9.064 | ||
| Mixed | 45.103 | 15.693 | ||
| Gyeongbuk | Coniferous | Pinus densiflora | 51.757 | 27.696 |
| Pinus koraiensis | 66.129 | 68.206 | ||
| Larix kaempferi | 49.357 | 8.254 | ||
| Pinus rigida | 54.482 | 21.319 | ||
| Deciduous | 36.319 | −2.969 | ||
| Mixed | 52.683 | 31.890 | ||
| Jeonnam | Coniferous | Pinus densiflora | 49.358 | 17.900 |
| Pinus koraiensis | 63.658 | 63.331 | ||
| Larix kaempferi | 58.850 | 38.981 | ||
| Pinus rigida | 66.256 | 47.963 | ||
| Deciduous | 44.670 | 21.006 | ||
| Mixed | 52.656 | 32.501 | ||
| Jeonbuk | Coniferous | Pinus densiflora | 46.583 | 10.233 |
| Pinus koraiensis | 65.630 | 52.956 | ||
| Larix kaempferi | 50.880 | 4.475 | ||
| Pinus rigida | 62.345 | 36.370 | ||
| Deciduous | 37.500 | 1.088 | ||
| Mixed | 56.243 | 40.125 | ||
| Chungnam | Coniferous | Pinus densiflora | 44.131 | 6.237 |
| Pinus koraiensis | 58.696 | 42.510 | ||
| Larix kaempferi | 47.798 | 7.356 | ||
| Pinus rigida | 55.158 | 22.320 | ||
| Deciduous | 37.167 | 3.603 | ||
| Mixed | 51.003 | 30.027 | ||
| Chungbuk | Coniferous | Pinus densiflora | 48.167 | 16.337 |
| Pinus koraiensis | 50.389 | 26.762 | ||
| Larix kaempferi | 48.751 | 4.898 | ||
| Pinus rigida | 60.341 | 28.426 | ||
| Deciduous | 39.747 | −0.283 | ||
| Mixed | 56.087 | 32.564 | ||
| Forest Product Types | Softwood | Hardwood | |
|---|---|---|---|
| Diameter (cm) | ≥18 | <18 | >6 |
| Grade | Sawlogs | Pulp | Pulp |
| List of GIS Layers to Generate Restriction Map | |
|---|---|
| Baekdudaegan mountains reserve | Riparian buffer zone |
| Country park | Scenic site |
| Ecosystem and landscape conservation area | Special island |
| Environment conservation marine area | Special measure area |
| Fishery resource conservation area | Urban natural park area |
| Forest genetic resources reserve | Water source protection area |
| Marine protected area | Wetland protected area |
| Marine protected area | Wetland protected area–Tidal flat |
| National park | Wildlife protection area |
| Natural environment conservation area | Wildlife special protection area |
| Natural monument | Catchment reserve protection area |
| Nature reserve | Disaster prevention reserve |
| Provincial park | Landscape reserve |
| Restricted development area | Wildlife reserved area |
| Historical heritage area | Native forest reserved area |
| Forest reserved area | Water source protection area |
| Wetland protection area | Native forest reserved area |
| Facility protection zone | Livestock protection area |
| Wildlife protection zone | |
| Scenario | No. of Optimal Locations | Location Code | Constraints |
|---|---|---|---|
| 1 | 1 | FIC1A | No. of potential location: 1 Transportaion limit (radious): 500 km |
| 2 | 3 | FIC3A, 3B, 3C | No. of potential locations: 3 Transportaion limit (radious): 200 km |
| 3 | 5 | FIC5A, 5B, 5C, 5D, 5E | No. of potential locations: 5 Transportaion limit (radious): 150 km |
| 4 | 8 | FIC8A, 8B, 8C, 8D, 8E, 8F, 8G, 8H | No. of potential locations: 8 Transportaion limit (radious): 100 km |
| 5 | 10 | FIC10A, 10B, 10C, 10D, 10E, 10F, 10G, 10H, 10I, 10J | No. of potential locations: 10 Transportaion limit (radious): 100 km |
| 6 | 12 | FIC12A, 12B, 12C, 12D, 12E, 12F, 12G, 12H, 12I, 12J, 12K, 12L | No. of potential locations: 12 Transportaion limit (radious): 100 km |
| Main Criteria | Weights (Criteria) | Second Level: Sub-Criteria | Weights (Sub-Criteria) | Total Weight | Consistency Ratio |
|---|---|---|---|---|---|
| Economic | 0.59 | Timber availability | 0.489 | 0.289 | 0.073 |
| Local timber demand | 0.282 | 0.166 | |||
| Transport logistics | 0.229 | 0.135 | |||
| Environmental | 0.249 | Land cover classification | 0.344 | 0.086 | 0.009 |
| Distance from industry | 0.474 | 0.118 | |||
| Topographic | 0.182 | 0.045 | |||
| Social | 0.161 | Local employment rate | 0.591 | 0.095 | 0.004 |
| Population density | 0.194 | 0.031 | |||
| The employment rate (age) | 0.215 | 0.035 | |||
| Sum of weights | 1 | 3 | 1 |
| Location Code a | City Name | Radius (km) b | Demand (No.) c | Coverage Rate(%) d | Total Area (ha) | Forest Volume Availability (m3) e | Ave Distance (km) f | USD/m3/km | Total Cost (Thous USD) g |
|---|---|---|---|---|---|---|---|---|---|
| FIC1A | Goesan-gun | 500 | 17,915 | 99 | 188,800 | 39,130,170 | 141 | 0.82 | 4,526,521 |
| FIC3A | Jecheon-si | 200 | 9856 | 54 | 106,144 | 22,247,770 | 101 | 0.82 | 1,851,429 |
| FIC3B | Imsil-gun | 200 | 5883 | 32 | 60,913 | 12,486,776 | 92 | 0.82 | 942,672 |
| FIC3C | Cheongdo-gun | 200 | 2155 | 12 | 21,537 | 4,355,947 | 80 | 0.82 | 286,839 |
| FIC5A | Hongcheon-gun | 150 | 6391 | 35 | 70,835 | 15,202,779 | 71 | 0.82 | 889,017 |
| FIC5B | Bonghwa-gun | 150 | 2608 | 14 | 27,323 | 5,377,544 | 77 | 0.82 | 339,635 |
| FIC5C | Gongju-si | 150 | 4687 | 26 | 46,937 | 9,605,629 | 64 | 0.82 | 503,773 |
| FIC5D | Hapcheon-gun | 150 | 2289 | 13 | 22,743 | 4,635,115 | 80 | 0.82 | 304,674 |
| FIC5E | Jangheung-gun | 150 | 1935 | 11 | 20,919 | 4,300,325 | 64 | 0.82 | 227,269 |
| FIC8A | Yangyang-gun | 100 | 627 | 3 | 6223 | 1,253,699 | 65 | 0.82 | 67,035 |
| FIC8B | Gapyeong-gun | 100 | 3271 | 18 | 34,814 | 7,468,894 | 51 | 0.82 | 313,770 |
| FIC8C | Hoengseong-gun | 100 | 3063 | 17 | 35,351 | 7,541,616 | 52 | 0.82 | 324,393 |
| FIC8D | Bonghwa-gun | 100 | 1877 | 10 | 20,133 | 3,968,434 | 66 | 0.82 | 214,103 |
| FIC8E | Gongju-si | 100 | 3908 | 22 | 39,519 | 8,050,590 | 57 | 0.82 | 375,681 |
| FIC8F | Cheongdo-gun | 100 | 1359 | 7 | 13,564 | 2,740,918 | 62 | 0.82 | 139,851 |
| FIC8G | Namwon-si | 100 | 2235 | 12 | 23,545 | 4,858,787 | 61 | 0.82 | 243,896 |
| FIC8H | Yeongam-gun | 100 | 1160 | 6 | 11,627 | 2,425,884 | 55 | 0.82 | 109,395 |
| FIC10A | Yangyang-gun | 100 | 954 | 5 | 10,700 | 2246,982 | 74 | 0.82 | 136,147 |
| FIC10B | Gapyeong-gun | 100 | 3741 | 21 | 39,989 | 8,592,063 | 14 | 0.82 | 100,472 |
| FIC10C | Jecheon-si | 100 | 2962 | 16 | 32,861 | 6,818,676 | 19 | 0.82 | 105,772 |
| FIC10D | Uljin-gun | 100 | 734 | 4 | 8279 | 1,580,938 | 96 | 0.82 | 124,280 |
| FIC10E | Gongju-si | 100 | 3437 | 19 | 35,071 | 7,122,147 | 16 | 0.82 | 91,069 |
| FIC10F | Gunwi-gun | 100 | 1312 | 7 | 12,866 | 2,625,634 | 43 | 0.82 | 92,141 |
| FIC10G | Imsil-gun | 100 | 1639 | 9 | 15,882 | 3,348,409 | 32 | 0.82 | 88,144 |
| FIC10H | Cheongdo-gun | 100 | 846 | 5 | 8581 | 1,743,222 | 65 | 0.82 | 92,317 |
| FIC10I | Sancheong-gun | 100 | 1006 | 6 | 11,442 | 2,289,663 | 55 | 0.82 | 103,860 |
| FIC10J | Jangheung-gun | 100 | 1088 | 6 | 11,223 | 2,355,943 | 47 | 0.82 | 90,826 |
| FIC12A | Yangyang-gun | 100 | 591 | 3 | 6480 | 1,368,522 | 103 | 0.82 | 115,365 |
| FIC12B | Gapyeong-gun | 100 | 2840 | 16 | 30,328 | 6,515,714 | 17 | 0.82 | 93,470 |
| FIC12C | Hongcheon-gun | 100 | 2245 | 12 | 26,057 | 5,613,319 | 21 | 0.82 | 94,458 |
| FIC12D | Jecheon-si | 100 | 2153 | 12 | 23,130 | 4,629,757 | 24 | 0.82 | 89,881 |
| FIC12E | Uljin-gun | 100 | 627 | 3 | 6603 | 1,268,192 | 108 | 0.82 | 111,911 |
| FIC12F | Gongju-si | 100 | 3320 | 18 | 33,819 | 6,853,133 | 16 | 0.82 | 89,458 |
| FIC12G | Gunwi-gun | 100 | 1241 | 7 | 12,120 | 2,471,450 | 44 | 0.82 | 88,838 |
| FIC12H | Jinan-gun | 100 | 1660 | 9 | 16,077 | 3,420,382 | 29 | 0.82 | 81,814 |
| FIC12I | Cheongdo-gun | 100 | 713 | 4 | 7166 | 1,448,869 | 73 | 0.82 | 86,483 |
| FIC12J | Sancheong-gun | 100 | 850 | 5 | 8971 | 1,763,269 | 58 | 0.82 | 84,310 |
| FIC12K | Yeongam-gun | 100 | 532 | 3 | 5155 | 1,063,276 | 97 | 0.82 | 84,267 |
| FIC12L | Jangheung-gun | 100 | 970 | 5 | 11,182 | 2347,519 | 47 | 0.82 | 91,400 |
© 2020 by the authors. Licensee MDPI, Basel, Switzerland. This article is an open access article distributed under the terms and conditions of the Creative Commons Attribution (CC BY) license (http://creativecommons.org/licenses/by/4.0/).
Share and Cite
Woo, H.; Han, H.; Cho, S.; Jung, G.; Kim, B.; Ryu, J.; Won, H.K.; Park, J. Investigating the Optimal Location of Potential Forest Industry Clusters to Enhance Domestic Timber Utilization in South Korea. Forests 2020, 11, 936. https://doi.org/10.3390/f11090936
Woo H, Han H, Cho S, Jung G, Kim B, Ryu J, Won HK, Park J. Investigating the Optimal Location of Potential Forest Industry Clusters to Enhance Domestic Timber Utilization in South Korea. Forests. 2020; 11(9):936. https://doi.org/10.3390/f11090936
Chicago/Turabian StyleWoo, Heesung, Hee Han, Seungwan Cho, Geonhwi Jung, Bomi Kim, Jiyeon Ryu, Hyun Kyu Won, and Joowon Park. 2020. "Investigating the Optimal Location of Potential Forest Industry Clusters to Enhance Domestic Timber Utilization in South Korea" Forests 11, no. 9: 936. https://doi.org/10.3390/f11090936
APA StyleWoo, H., Han, H., Cho, S., Jung, G., Kim, B., Ryu, J., Won, H. K., & Park, J. (2020). Investigating the Optimal Location of Potential Forest Industry Clusters to Enhance Domestic Timber Utilization in South Korea. Forests, 11(9), 936. https://doi.org/10.3390/f11090936