Article

Assessing Restoration Potential of Fragmented and Degraded Fagaceae Forests in Meghalaya, North-East India

1
Department of Botany, North-Eastern Hill University, Shillong 793022, India
2
CSIR-National Botanical Research Institute, Council of Scientific & Industrial Research, Rana Pratap Marg, Lucknow 226001, Uttar Pradesh, India
3
Institute of Forest Ecosystems, Thünen Institute, Alfred-Möller-Str. 1, House number 41/42, D-16225 Eberswalde, Germany
4
Chair of Silviculture, University of Freiburg, Tennenbacherstr. 4, D-79085 Freiburg, Germany
5
Institute for Geography and Geoecology, Karlsruhe Institute of Technology, Kaiserstr. 12, D-76131 Karlsruhe, Germany
6
Northern Research Station, USDA Forest Service, 202 Natural Resources Building, Columbia, MO 65211-7260, USA
7
Institute for Technology Assessment and Systems Analysis, Karlsruhe Institute of Technology, Karlstr. 11, D-76133 Karlsruhe, Germany
*
Authors to whom correspondence should be addressed.
Forests 2020, 11(9), 1008; https://doi.org/10.3390/f11091008
Submission received: 5 August 2020 / Revised: 14 September 2020 / Accepted: 16 September 2020 / Published: 19 September 2020
(This article belongs to the Special Issue Silviculture for Restoration and Regeneration)

Abstract

:
The montane subtropical broad-leaved humid forests of Meghalaya (Northeast India) are highly diverse and situated at the transition zone between the Eastern Himalayas and Indo-Burma biodiversity hotspots. In this study, we have used inventory data from seedlings to canopy level to assess the impact of both biotic and abiotic disturbances on structure, composition, and regeneration potential of the Fagaceae trees of these forests. Fagaceae trees are considered as the keystone species in these forests due to their regional dominance and their importance as a fuel wood source, and also because they form an important component of climax community in these forests. Unfortunately, these forests are highly degraded and fragmented due to anthropogenic disturbances. We have assessed, for the first time, the restoration potential (i.e., capacity to naturally regenerate and sustain desired forest structure) of Fagaceae species in the genera Lithocarpus Blume, Castanopsis (D. Don) Spach, and Quercus Linn. We also evaluated how biotic and abiotic factors, as well as anthropogenic disturbances, influence the restoration potential of these species in six fragmented forest patches located along an elevational gradient on south-facing slopes in the Khasi Hills, Meghalaya. Fagaceae was the most dominant family at all sites except one site (Laitkynsew), where it was co-dominant with Lauraceae. Fagaceae forests have shown high diversity and community assemblages. Fagaceae species had high levels of natural regeneration (i.e., seedlings and saplings) but low recruitment to large trees (diameter at breast height or DBH ≥ 10 cm) at all sites. The ability to sprout was higher in Fagaceae tree species than non-Fagaceae tree species. We have shown that human disturbance and structural diversity were positively related to regeneration of Fagaceae tree species due to high sprouting. However, with increasing human disturbance, recruitment of saplings and pole-sized trees to mature trees hampered the resulting proportion of mature Fagaceae tree species. This study provides a means for assessing regeneration and a basis for forest management strategies in degraded and fragmented forests of Meghalaya.

1. Introduction

Current rates of anthropogenic destruction and degradation of natural ecosystems have severely fragmented natural landscapes worldwide, leading to loss of forests and reductions in biodiversity [1,2], reduced ecosystem services [3], increased carbon emission [4], and undesirable changes in forest composition and structure. The need for restoring degraded forest landscapes was recognized by various National and International conservation agencies around the globe, causing them to call for reforestation and forest restoration programs [5,6,7,8,9,10]. Such initiatives would provide many co-benefits, such as income opportunities for rural households, enhancement of biodiversity conservation, sustainable production of raw materials for forest industries, and a wide array of supporting and regulating ecosystem services [6,11].
Natural regeneration is a fundamental process of forest ecosystem dynamics [12], essential for the preservation and maintenance of biodiversity [13], and foundational to long-term forest sustainability [14]. It plays a key role in reforestation and forest restoration. Approaches to restoring natural ecosystems largely depend on the level of forest and soil degradation, residual vegetation, and desired restoration outcomes [6], as well as the ability to implement restoration practices. The residual vegetation plays a critical role in forest restoration as it provides the sources of natural regeneration, i.e., seed and vegetative sprouting, which varies by species, thereby influencing a species regeneration potential for any given site. During regeneration, there is a rapid increase in tree density, competing vegetation, and species richness [15,16]. Recent studies in tropical forests showed that ecological restoration achieved through natural regeneration was more successful than assisted regeneration by planting and seeding [3,7]. Successful regeneration is achieved when there is an adequate number of seedlings, saplings, and pole-size trees of a species in competitive positions throughout forest development, such that they are able to recruit into dominant and codominant positions in the overstory at maturity in sufficient numbers to achieve management goals. Regeneration potential can be assessed by evaluating the population structure of species in the forest [17,18], and for a species, it must be high enough to ensure its long-term sustainability in future forests [19]. Regeneration, and growth and survival of trees through forest development largely depends on the interaction between biotic and abiotic factors and the regime of disturbances that alter the balance of resources, which need to be understood and managed to promote dominance of the desired species [20].
Species in Fagaceae are major components of forests in the northern hemisphere from tropical to temperate regions [21,22,23]. In addition to their valuable contribution to the economy at local to global scales, members of Fagaceae play vital ecological roles as keystone species in forest ecosystems [24,25,26]. Fagaceae-dominated forests harbor a high diversity of plant species and seed-eating native vertebrates [24,27], contributing to diversity in wildlife habitat and food sources. Overall, they contribute significantly to global ecosystem services and standing biomass [28]. However, on a global scale, species in the Fagaceae family are declining due to land-use changes and modifications to the environment from climate change at a macro scale and increased forest density influences on microclimates [14,29,30,31,32,33]. Collectively, these changes modify novel natural disturbance regimes, promote the spread of invasive species, increase forest herbivory, and alter plant competitive dynamics that result in regeneration failure and lack of recruitment into the overstory of desired species.
In Northeast India, Fagaceae tree species are the dominant climax tree species of the moist subtropical and temperate forests [34,35,36]. The subtropical broad-leaved wet hill forests of Meghalaya are highly diverse, and part of the Indo-Burma biodiversity hotspot, which is primarily dominated by broad-leaved oak-laurel forests [37,38,39,40]. Various studies have been conducted in these forests to study species diversity, composition and structure [37,39,40,41], natural regeneration [42,43,44], nutrient dynamics [45,46], and litter decomposition [47,48].
The state of Meghalaya has large reserves of minerals, coal, and limestone. In recent decades, mining activities have increased substantially due to the increasing demands of a rapidly growing population, causing large-scale deforestation and degradation of the environment [49]. In the last decade, the state has lost 202 km2 of forest cover [50,51]. On these degraded sites, a large portion of the topsoil has been eroded in this region of very heavy rainfall (averaging >11,000 mm a year). The remaining soil is shallow, nutrient-poor and acidic, and has low mechanical stability [46,52]. Consequently, forests in the region that once provided continuous cover, today, are fragmented into small remnant patches (Figure 1), which are often in a degraded state [46,53]. About 6967 patches or forest fragments of varying sizes have been identified in Meghalaya [51]. The collapse of the traditional way of management of forest resources triggered by the rapid population increase in the state from the 1960s and unsustainable land-use practices, such as the reduced cycle of shifting cultivation, have severely degraded and fragmented the entire landscape [54]. Only 6.5% of forests are protected under state management [55], while the remaining forests are mostly owned by private individuals or clan/community organizations [56]. These lands are not protected or under a sustainable forest management plan and are vulnerable to further degradation from high grading of vegetation and exploitation of rock, coal, and mineral resources.
About 80% of the population in Meghalaya live in rural areas and are mainly dependent on agriculture and other related activities to support their livelihood [57]. Trees of the Fagaceae family are the most preferred species for firewood, construction timber, and charcoal by the local communities within the state. Acorns of Castanopsis species are consumed locally. Thus, Fagaceae trees are an economically, socially, and culturally significant part of local communities. However, due to the overexploitation of this valuable forest resource, remnant forests continue to be degraded. The key drivers of deforestation in the state are forest wildfires, unsustainable collection of firewood, uncontrolled grazing, charcoal making, and changes in land use [54].
The objective of this study was to determine the potential of recovery and sustainability of dominant Fagaceae species in fragmented and degraded subtropical broad-leaved wet hill forests of Meghalaya. We assessed plant diversity, population structure, and potential of Fagaceae species to regenerate and recruit into positions of dominance in the overstory in relation to abiotic factors and anthropogenic disturbances.

2. Materials and Methods

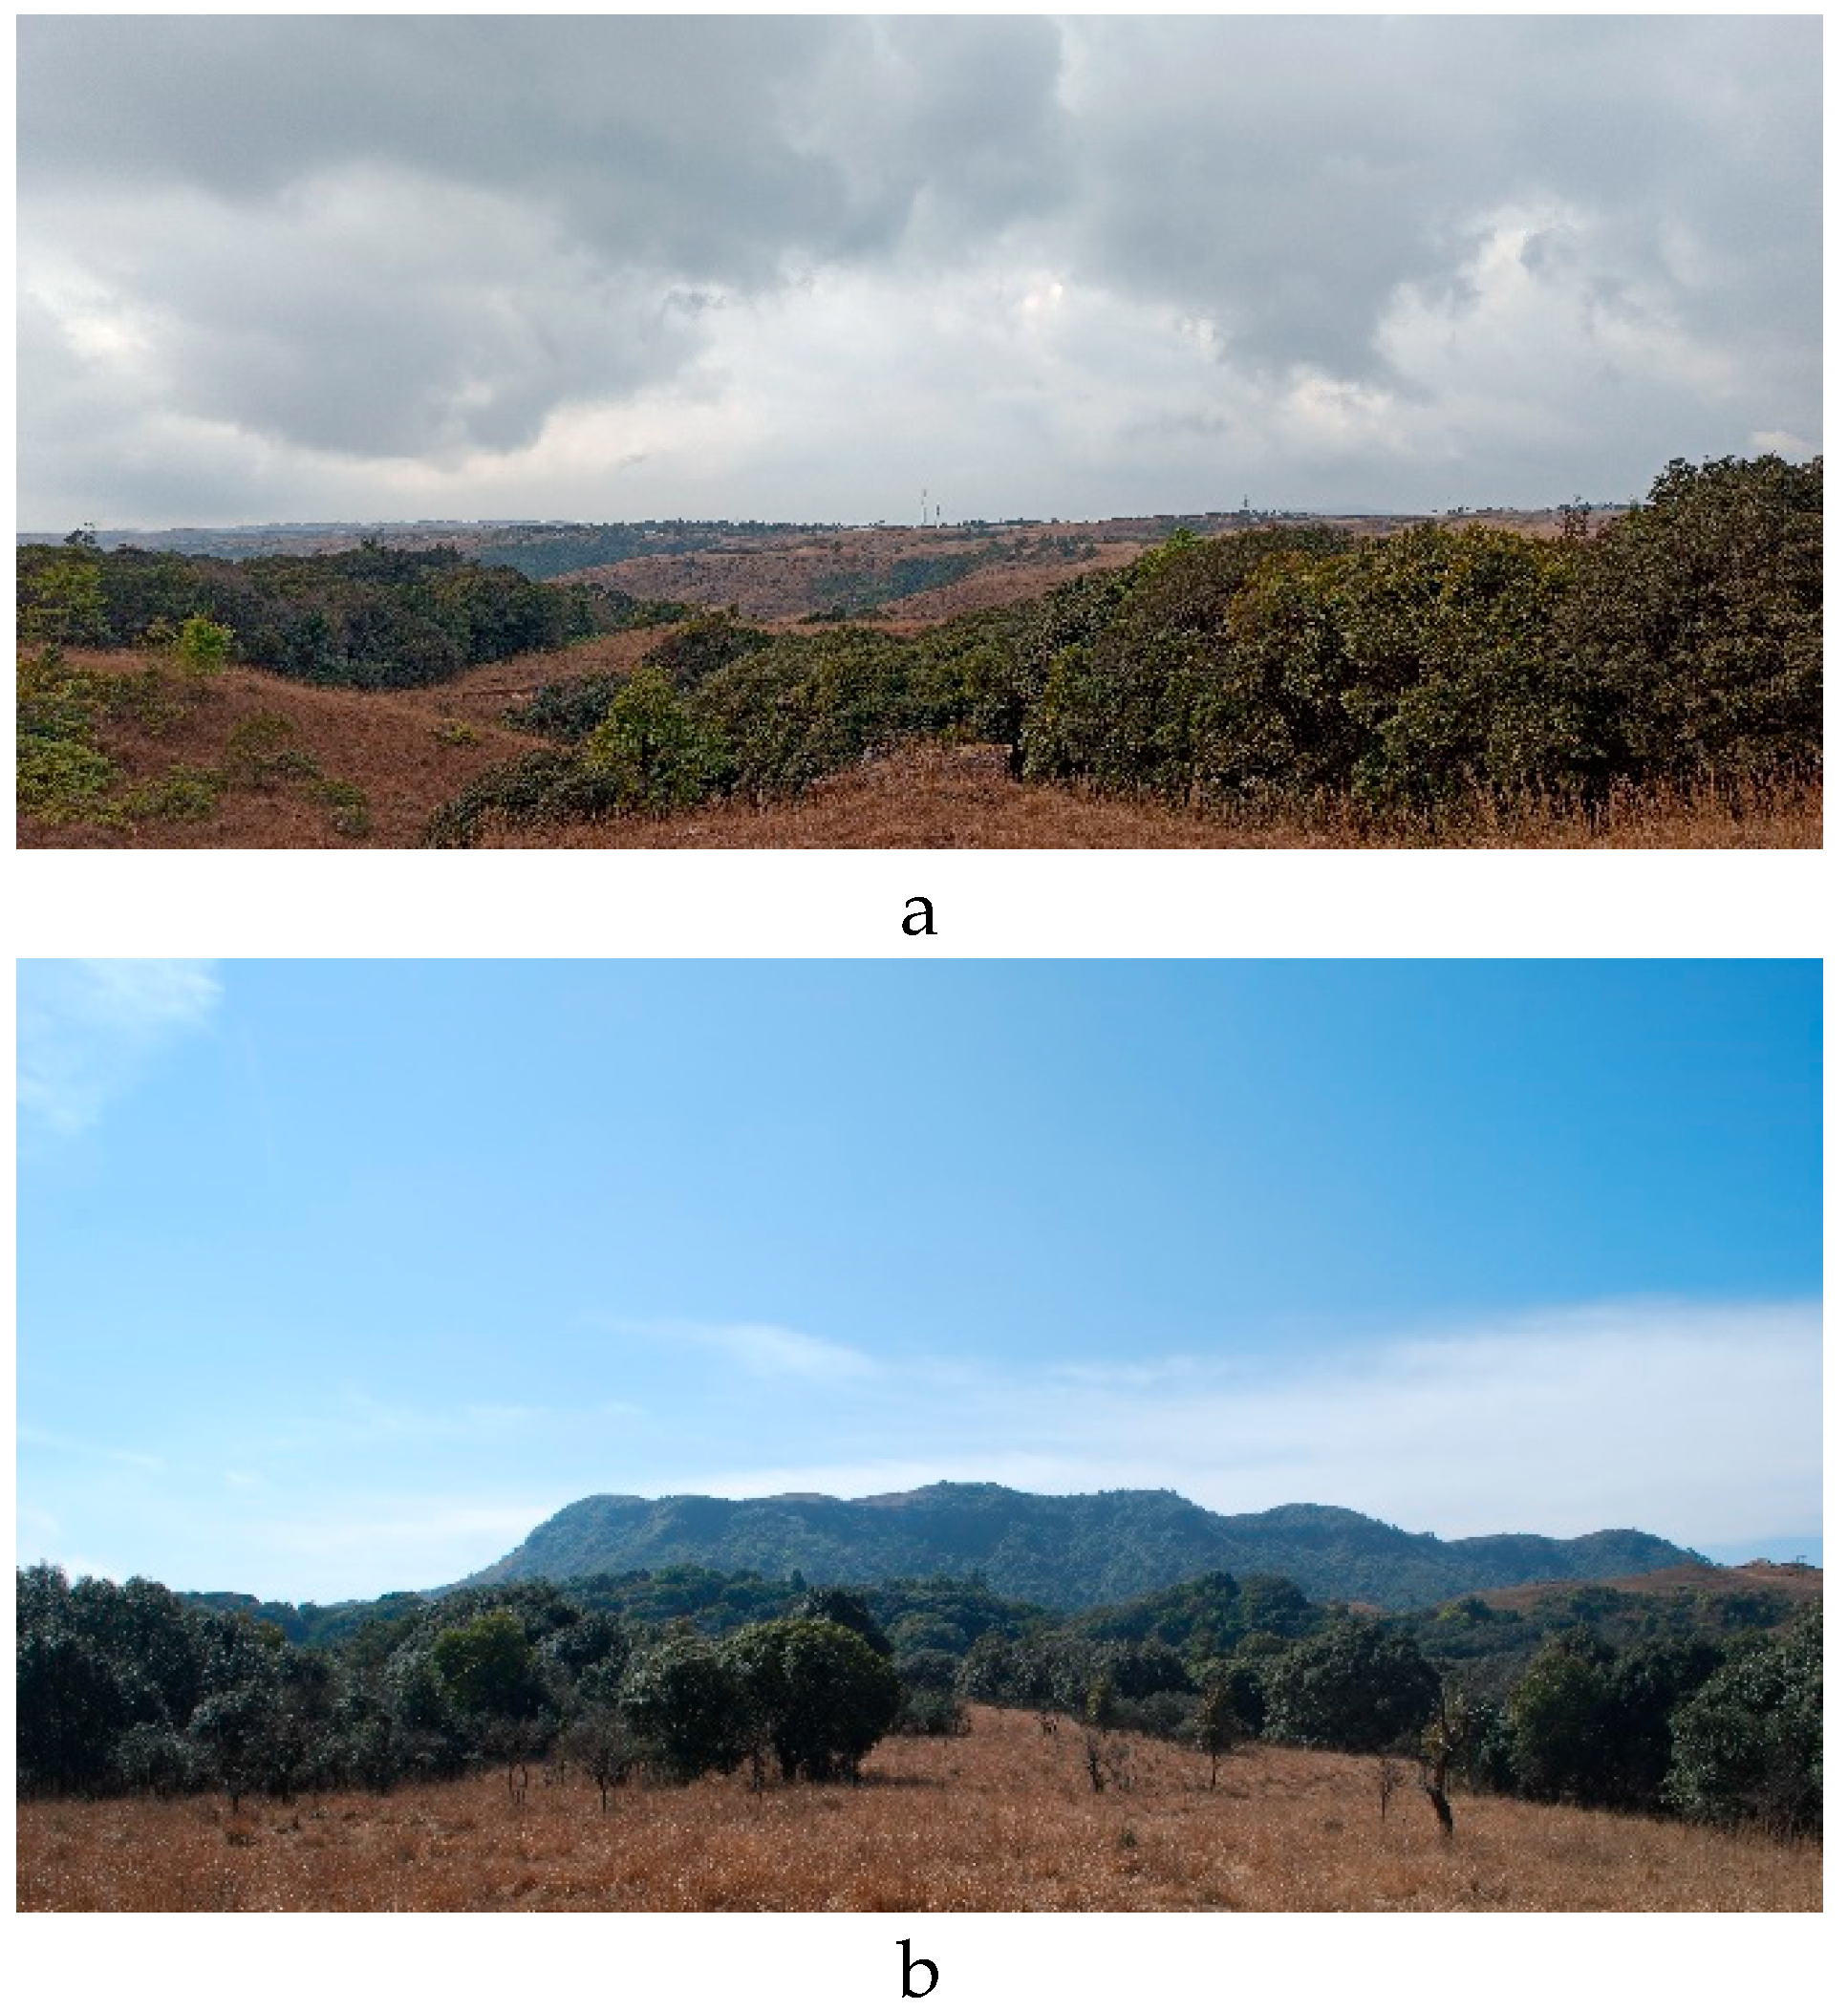
2.1. Study Area Description

The study was conducted in the Khasi-Jaintia hills district in the montane sub-tropical broad-leaved wet hill forests of Meghalaya, India. It reaches from approximately 25°07″ to 25°41″ N of latitude and from 91°21″ to 92°09″ E of longitude (Figure 2 and Table 1). This state receives the heaviest rainfall in the world (annually 11,873 mm) as it is the initial landfall in the pathway of the Indian monsoon and falls within the Indo-Burma biodiversity hotspot boundary [58]. The climate of the area is a monsoon type with a distinct wet and dry period. The wet summer period extends from April to October in which more than 90% of the total rainfall is received. The mean annual maximum and minimum temperatures are 22 and 16 °C, respectively. In general, the soil is laterite, loam to loamy silt in texture, and acidic. The state is home to more than a thousand endemic species, and has a large number of sacred groves where biodiversity is very high due to nature conservation efforts [17].
Montane sub-tropical wet broad-leaved forests of the Khasi and Jaintia hills within the East Khasi hills District were chosen as the study area with the permission of the Chairperson (locally called as Rangbah Shnong or Headman) of the local community (primarily the Khasi and Jaintia tribes) who manage the forests (Figure 2). The Fagaceae family forms the dominant tree component of these degraded and fragmented forests, which were all located close to human settlements. Chief anthropogenic disturbances were logging, slash and burn shifting cultivation, extended grazing, and mining. Overall, our study area is composed of human-disturbed fragmented forest patches.

2.2. Sampling Design

Systematic sampling of vegetation in six fragmented forest patches was done along an altitudinal gradient ranging between 800 and 2000 m (Table 1). We defined three altitudinal classes from 800 to 1200, 1200 to 1600, and 1600 to 2000 m, with two study sites in each altitudinal class. Five sites on the Meghalaya plateau were located in the Khasi hill area and one in the border region of the Khasi and Jaintia hills. All of these sites are located on south-facing slopes and on the windward sides of the hills, which receive the highest amount of rainfall. We ensured that each site consisted of a continuous forest patch of at least one hectare. We ensured that each site consisted of a continuous forest patch of at least one hectare. We avoided forest roads to minimize the effects of external disturbances and very steep slopes that made data collection unsafe. In each of the six study sites, we randomly located two 50 × 50 m plots for data collection, resulting in a total of 12 plots for the study. We used a lottery-based sampling method to select the plots by randomly picking two plots out of all possible plots in the forest.
In this study, we have used tree inventory data of different size cohorts to assess the impact of both biotic and abiotic disturbances on structure, composition, and regeneration potential of the dominant component of these forests.

2.3. Field Data Collection

Species Structure, Composition, Anthropogenic Disturbance, and Soils

The vegetation sampling in the study area was completed in 2016. In each of the plots (50 × 50 m), circumference at breast height (cbh) of all trees ≤ 31.5 cm (10 cm) in circumference and saplings occurring within the 50 × 50 m plot were measured at 1.37 m above the ground level. For larger trees, the circumference at breast height (cbh at 1.37 m) was measured to the nearest 0.1 cm using a meter tape. Cbh was later converted to the diameter at breast height (DBH) using the formula DBH = cbh/pi (pi = 3.14), assuming a circular stem cross-section at the point of measurement. In the case of multiple stems, the circumference of every single stem was recorded and converted into DBH and later converted to a single DBH by taking the square root of the sum of all squared stem DBHs. The plant specimens were identified to species when possible with the help of a regional flora list [59,60,61,62], and by consulting the herbaria at the Botanical Survey of India, Eastern Circle, Shillong.
Information on the damage of trees was recorded using a four-class system, i.e., “no damage”, “cut”, “broken stem”, and “sign of pathogen attack”. Additionally, signs of mechanical cuts on trees, grazing, and trampling were recorded as present or absent (i.e., 0 and 1) at plot level. The damage scores were summed to represent three levels of anthropogenic disturbance intensity (total scores of 1, 2, and 3 representing Mild, Moderate, and High levels of disturbance, respectively). The plot level disturance intensity, distance of the forest to the nearest forest-dependent village (km), the proportion of cut stumps to the total number of standing and cut trees (%), and the proportion of trees de-branched to the total number of trees (%) were used as variables for representing anthropogenic disturbances. The structural diversity of the plot (see Section 2.4.2) was used as an additional covariate in generalized linear model (GLM) analyses (see Section 2.6.1) which represented the size asymmetry. Gini index was successfully used in the past to capture asymmetric competition for light between trees due to natural mortality or removal of trees by humans [63].
The spatial coordinates (using Global Positioning Sytem or GPS) and elevation were recorded at each corner and the center of the 50 × 50 m plots. Six soil cores were randomly collected within each plot using metal corers to extract soil from the 0–20 cm layer. For each plot, the soil cores were combined into one composite sample for analysis. Soil bulk density was estimated following Allen et al. [64].

2.4. Compositional and Structural Diversity Assessment

The data collected in the field were used to determine dominance and diversity indices.

2.4.1. Importance Value Index (IVI)

The Importance Value Index (IVI) was used to determine the overall ecological importance of the species in a community. Community parameters such as frequency, density, and basal area of each species were determined following References [65,66], as shown below:
Frequency   ( % ) = Number   of   quadrats   in   which   a   species   occurred total   number   of   quadrats   studied ×   100 Density = Number   of   individuals   of   a   species   in   all   the   quadrats total   number   of   quadrats   studied
Basal area = π r2, where π = 22/7 or 3.14 and r = radius
Importance Value Index (IVI) of each tree species was computed by summing the values of the relative frequency, relative density, and relative basal area.

2.4.2. Diversity Indices

Several measures of diversity were used to characterize the tree community. Species richness (S), the total number of tree species, was recorded for each forest site. Shannon’s diversity index (HBA) was estimated using the following formula using percentage basal area of each species to total basal area of plot as importance value [67]:
H BA = i = 1 S b i B A   ln   ( b i B A )
where S is the total number of species, BA is the total basal area, and bi is the basal area of species i.
Simpson’s dominance index (D) was estimated using the Simpson index [68] and was calculated as:
D   =   ( N i N ) 2
where ‘Ni’ is the IVI value of individuals of species i, and ‘N’ is the total IVI of all species. Pielou’s Evenness index ‘e’, was calculated using the following formula [69]:
e   = H BA ln S
where, ‘HBA’ represents the Shannon–Weiner diversity index, and ‘S’ represents the total number of species. Gini structural diversity in the plots was quantified as follows:
Gini DBH = 1 n ( 2 i n 1 ) x n 2 μ
where n is the total number of trees in the plot, x is the diameter of tree number i, and µ is the mean tree diameter. A Gini Index of 0 represents perfect size equality, whereas values of 1 represent maximum size inequality [70,71].

2.5. Stem Sprouts and Sprouts Turnover Rate

Mean tree density (ha−1), stem density (ha−1), healthy stems, cut stems, and damage information due to natural causes was calculated from the collected data. Damage percentage for each Fagaceae species was calculated by summing up both anthropogenic cut stems and naturally damaged stems data and dividing it with mean stem density (ha−1) of Fagaceae species. Similarly, healthy and damaged information for total Fagaceae and Non-Fagaceae is calculated by dividing the Mean healthy stem and damaged stem data to Total Stem density. Sprouting stem percentage was calculated by taking the difference between individuals of the stem (S) and tree (T) to the total sum of their differences, i.e., Sprouting   Percentage = S T   ( S T ) ×   100 . For calculating the percentage sprouting of Fagaceae and Non-Fagaceae components of the forests, the difference between individuals of the stem (S) and tree (T) was divided with the mean stem density of each component separately, i.e., S-T/Mean stem density of each component. Average sprouting stem per tree was calculated by dividing the stem density to tree density (S/T).

2.6. Data Analysis

2.6.1. Population Structure and Regeneration Potential

Population structure of the oak species was assessed using the diameter distribution. Individuals of the oak species were tallied into 10 diameter classes from 10–20 to 100–110 cm. The stem density data for each size class was used to depict the population structure. Stem density was scaled up to per hectare.
Regeneration potential is the capacity or the potential of the dominant species (Fagaceae family members in the present study) in these forests to regenerate and successfully recruit into dominance within the overstory. To assess regeneration potential of Fagaceae trees, the following size classification was used to define the structure of each Fagaceae population: seedlings (<20 cm height), small saplings (20–150 cm height), large saplings (>150 cm height but <10 cm DBH), polesize trees (10–30 cm DBH), and large trees (>30 cm DBH). Hence, the different size classes represent the biological life stages of Fagaceae species through development from the seedling stage to maturity in the overstory canopy. Regeneration potential of the Fagaceae species was determined based on the number of seedlings, saplings, poles, and large trees [72]: (a) ‘good or strong’ if seedlings > or < saplings > poles and large trees, (b) ‘fair’ if seedlings > or ≤ saplings ≤ poles and large trees, (c) ‘poor’ if a species survives only in sapling stage, but no seedlings (though saplings may be <, >, or = poles and large trees), (d) ‘none’, if it is absent both in sapling and seedlings stages, but found only in large trees, and (e) ‘new or early regeneration’ if a species has no large trees, but only saplings and/or seedlings.
Regeneration success of the Fagaceae species is demonstrated by the number of seedlings, saplings, pole trees, and large trees that attain dominance in the stand. To facilitate interpretation, the proportion of seedlings and saplings to that of pole-size trees and large trees were calculated to study the potential of a Fagaceae species to regenerate and recruit into the overstory. A population structure with a higher percentage of seedlings and saplings compared to larger classes suggests strong regeneration and recruitment potential.
We finally used generalized linear models (GLMs) to study the influence of anthropogenic disturbances, biotic and abiotic factors, and elevation on the restoration potential of Fagaceae species. The GLMs do not require presumption on any specific probability distribution of data often used in the field studies of forest ecology [73,74]. The regeneration potential of Fagaceae species was used as the target/response variable and all the anthropogenic disturbances, biotic factors, and abiotic factors were modelled as independent variables. We used log transformation on the response variables that had distribution models other than a normal distribution. Spearman correlation was performed on the independent variables to identify autocorrelated variables. The auto-correlated variables were added in the model by building an interacting term between them. Finally, the best general linear models were selected based on the Akaike information criterion (AIC) values.
All data analysis was carried out using Microsoft Excel 2010 v14.0 (Microsoft corporation, Washington, United States), PAleontological Statistics (PAST 3.0) software package developed by Hammer et al. [75], and IBM SPSS 25 (International Business Machines Corporation (IBM), Armonk, New York).

3. Results

3.1. Species Diversity and Composition

The forests on the southern slopes are heterogeneous assemblage of different tree species. A total of 144 tree species belonging to 89 genera and 53 families were recorded from the six studied stands. This includes ten tree species that could not be identified in the field. Lauraceae was the dominant family comprising 25 species, followed by Rubiaceae and Fagaceae (10 species each), Elaeocarpaceae and Magnoliaceae (7 species each), Araliaceae and Rosaceae (5 species each), Symplocaceae and Aquifoliaceae (4 species each), and Celastraceae, Euphorbiaceae, Anacardiaceae, Myrtaceae, Moraceae, and Pentaphyllaceae were represented by 3 species each. Eleven families were bispecific and 17 families were monospecific.
The dominance, evenness, and diversity varied among the six forest stands. High species richness was recorded at Jarain with 51 tree species, followed by Laitryngew (45), and was lowest at Weiloi, where only ten tree species occurred (Table 2). Shannon’s diversity was highest at Jarain (2.75) followed by Pynursla (2.72) and Laitkynsew (2.49). The lowest of Shannon’s diversity was at Weiloi (0.48). All the forest stands had low evenness index with a maximum value of 0.54 at Pynursla (Table 2).

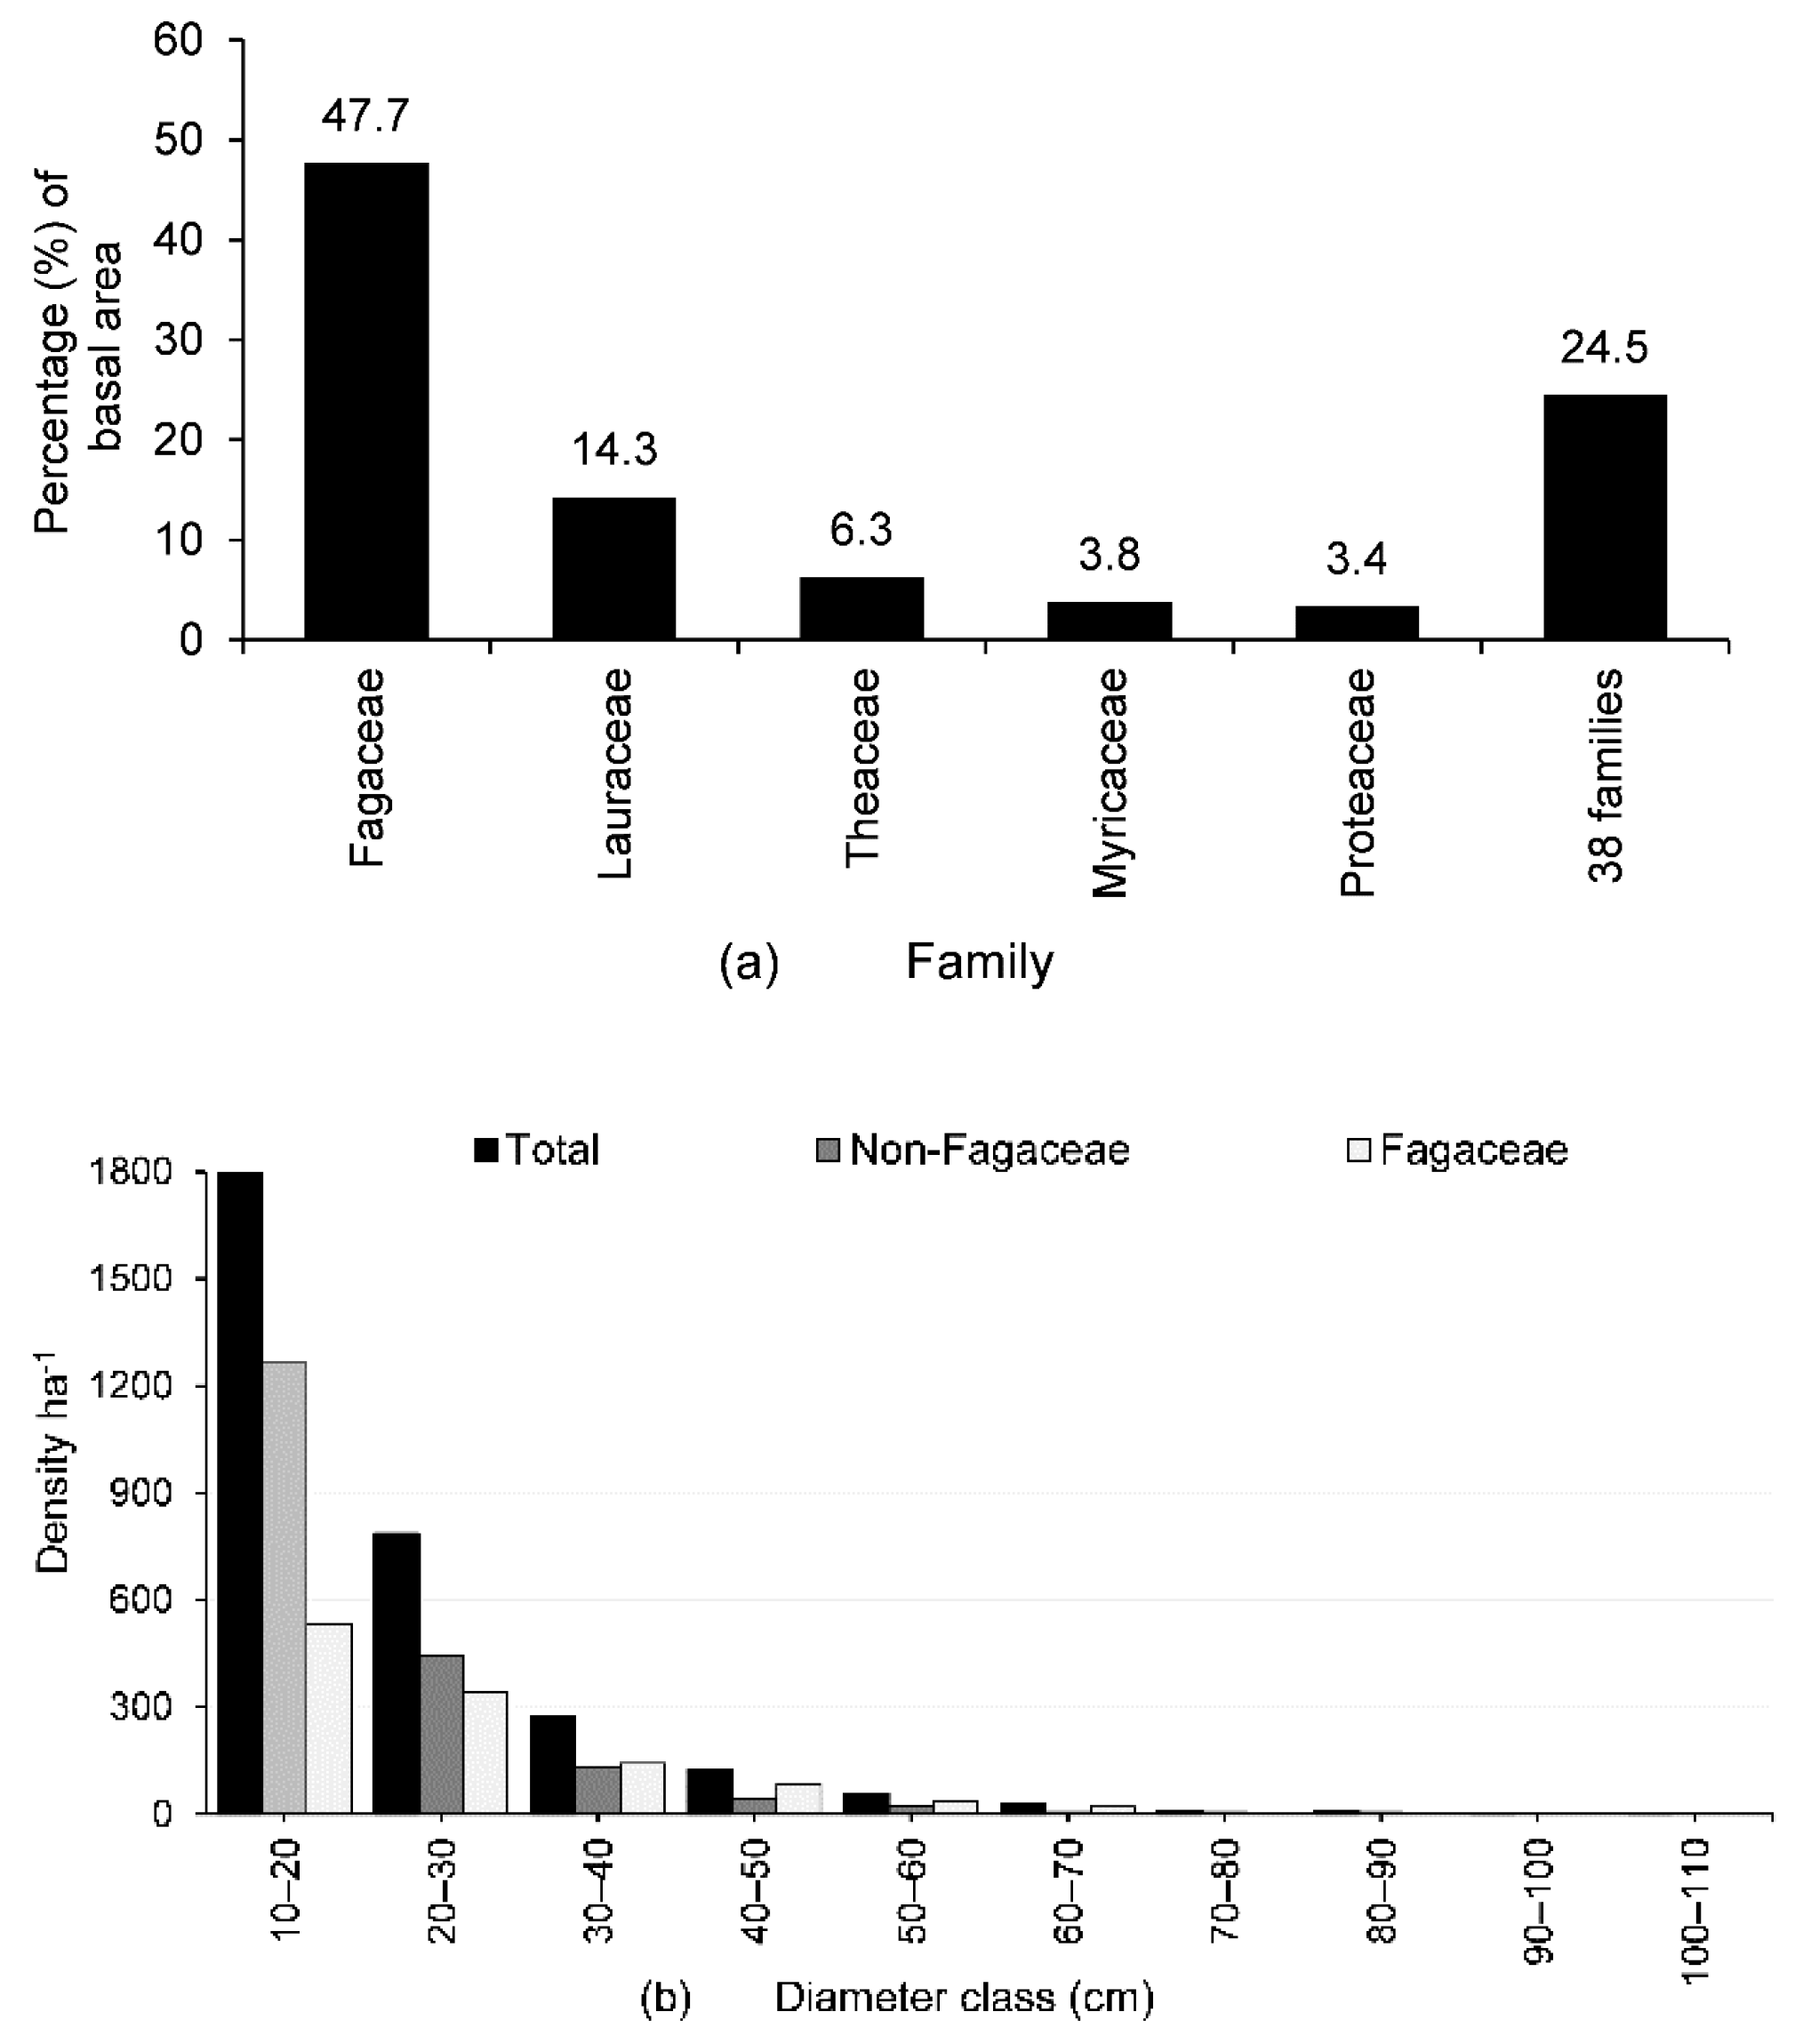
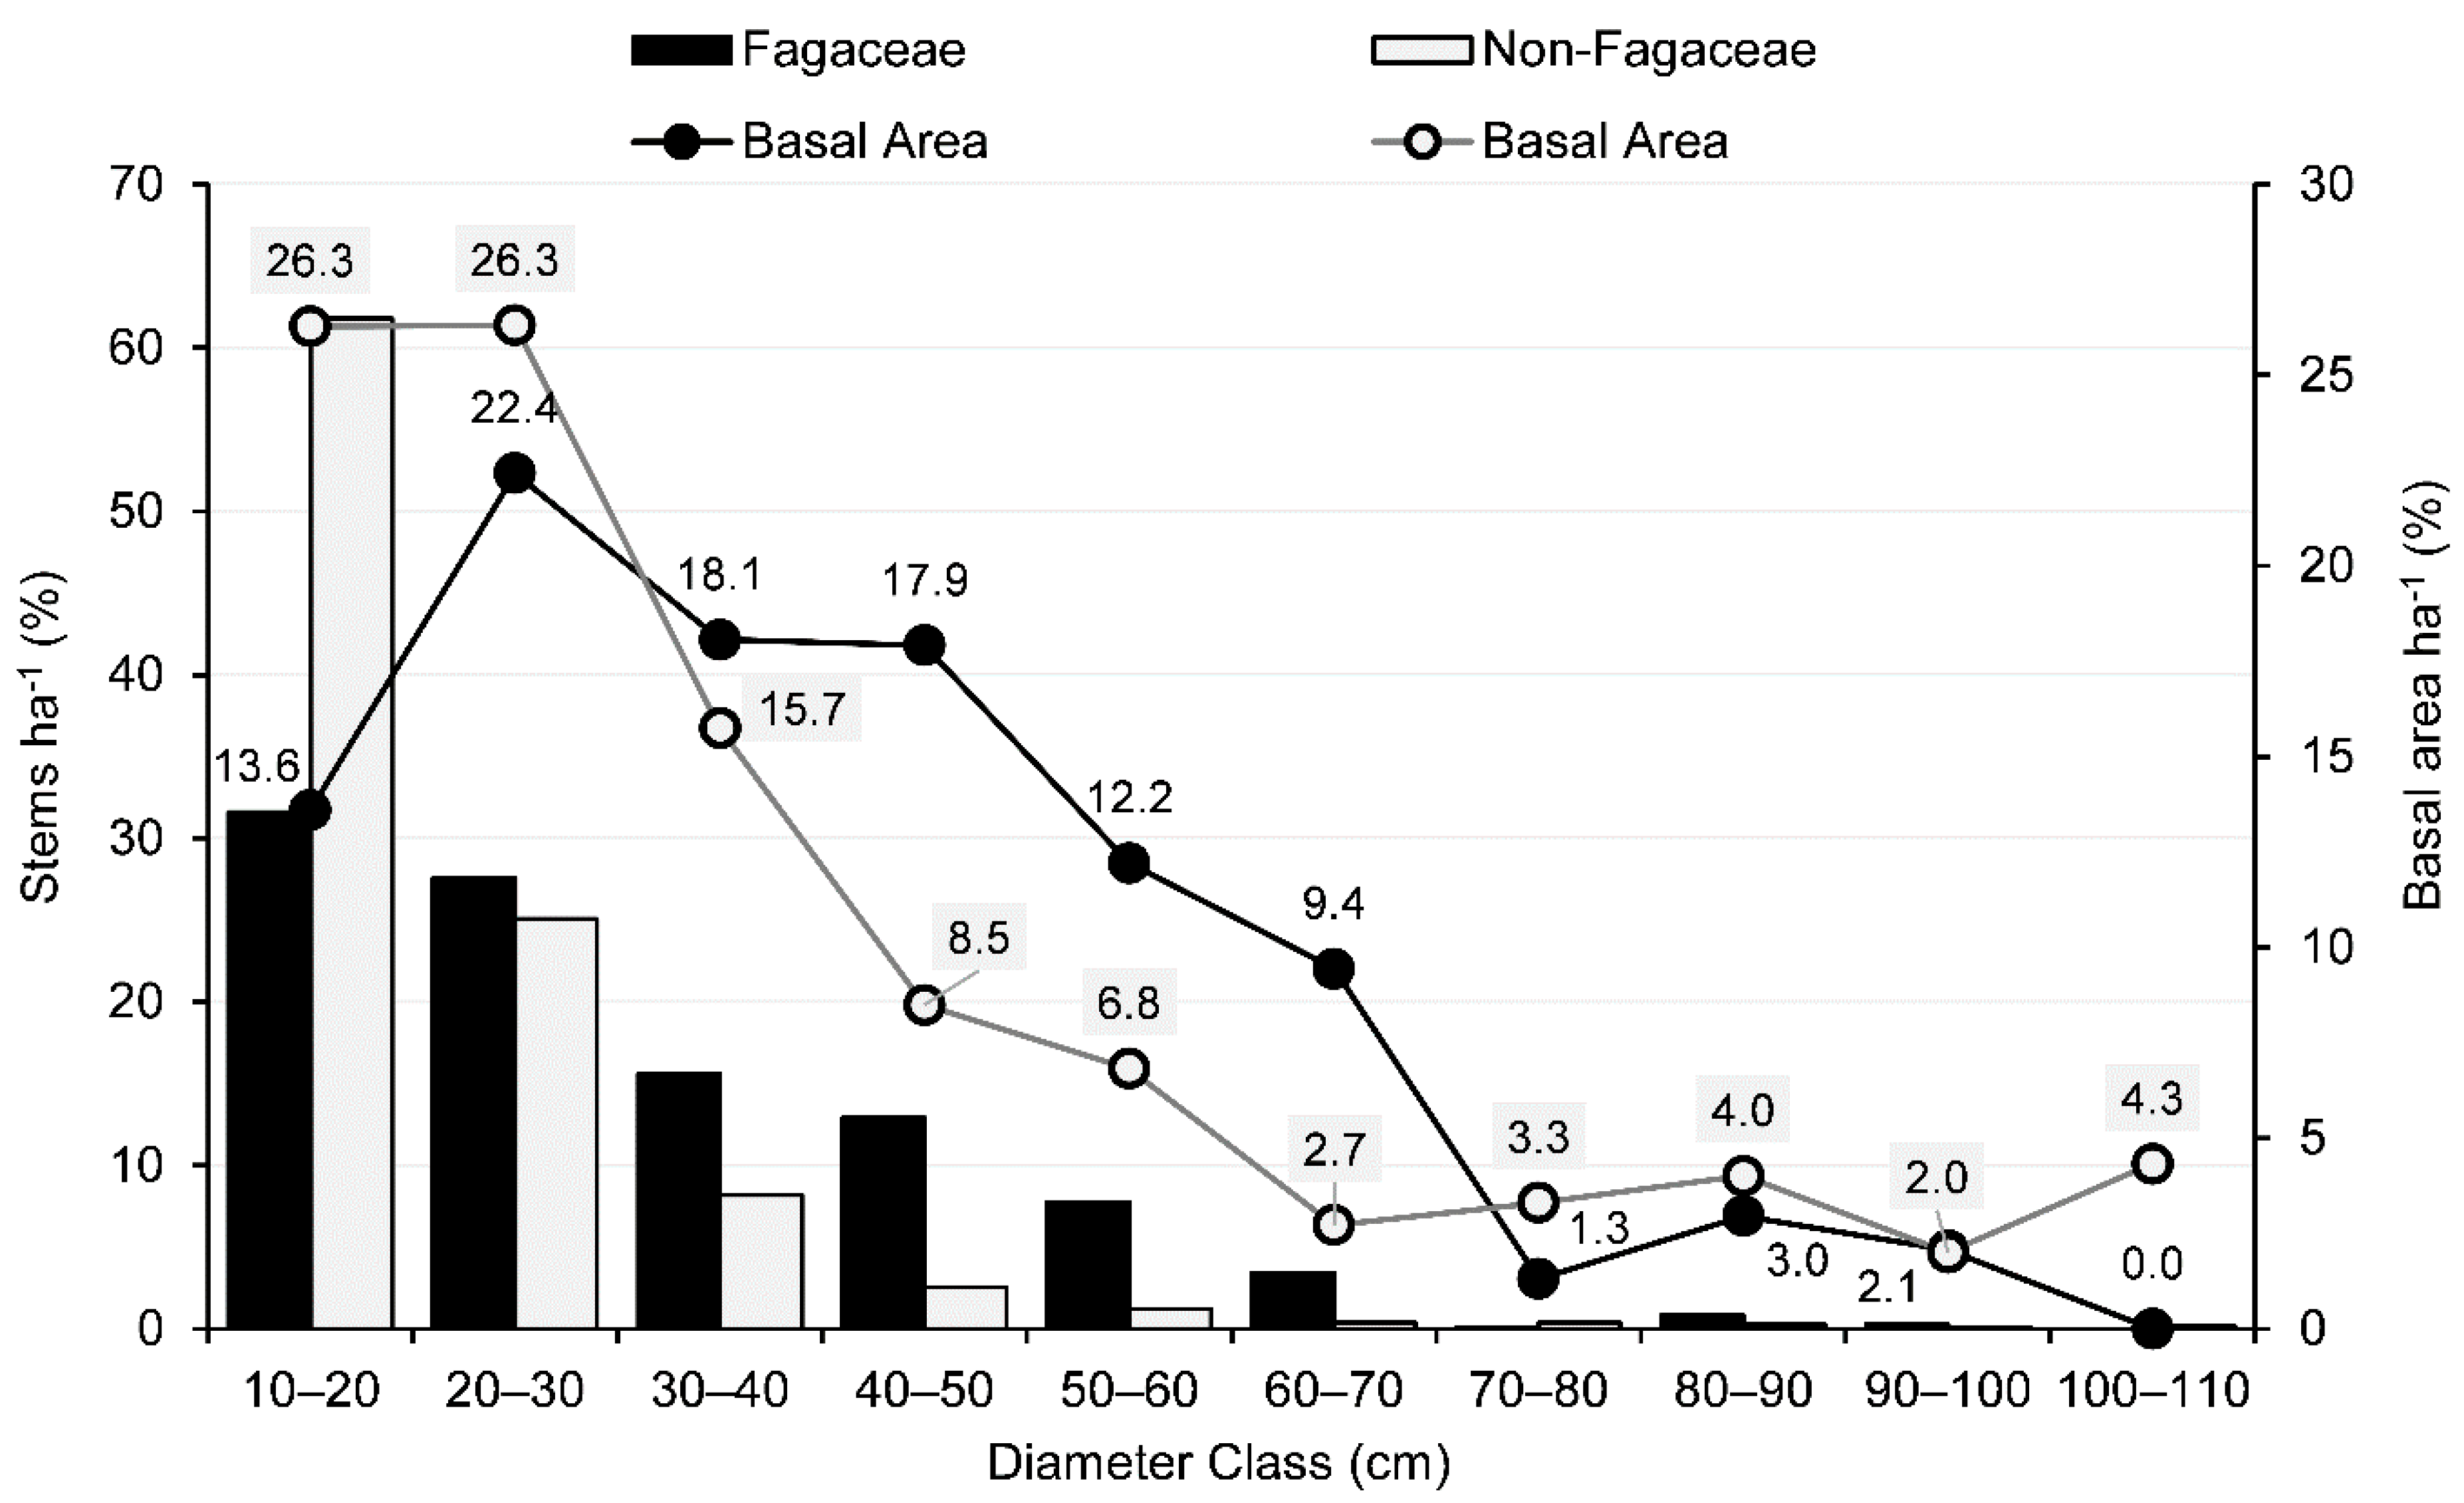
3.2. IVI, Basal Area, Tree Density, and Population Structure

Based on IVI values, the species of Fagaceae family dominated all the five stands except the Laitkynsew stand, where Lauraceae members dominated. The maximum IVI value for Fagaceae was 203.9 at Weiloi and the lowest was 41.7 at Laitkynsew (Appendix A, Table A1). The other co-dominant families were Theaceae, Myricaceae, and Proteaceae.
The tree basal area in the six forests stands varied between 16.5 to 35.3 m2 ha−1 with the mean basal area of 24.4 ± 6.17 m2 ha−1. The Fagaceae members which had 37.6% of the total stand density contributed to 47.7% of the total basal area. Fagaceae, Lauraceae, Theaceae, Myricaceae, and Proteaceae together represented 75.5% of the total basal area (Figure 3a). Lithocarpus dealbatus (Hook.f. & Thomson ex Miq.) Rehder was found in all six forest stands and constituted 19.3% of the total basal area. This was followed by Quercus lineata Blume (18.6%), Schima wallichii Choisy and Persea odoratissima (Nees) Kosterm. (6.2% each), Myrica esculenta Buch.-Ham. ex D. Don (3.8%), Castanopsis indica (Roxb. ex Lindl.) A.DC. (3.6%), and Castanopsis tribuloides (Sm.) A.DC. (2.7%). The rest of the 136 tree species distributed in 38 families contributed 24.5% to the total basal area.
In general, both the Fagaceae and Non-Fagaceae members in the fragmented forests showed reverse J-shape in their size distribution (Figure 3b). The density of trees (≥ 10 cm DBH) ranged between 276 and 868 individuals ha−1 in the six stands, with a mean density of 515 ± 325.8 individuals ha−1 (Table 2). Across the stands, the Fagaceae species contributed 37.6% to the total stand density. The other important families were Lauraceae (15.7%), Theaceae (6%), Proteaceae (4.6%), Elaeocarpaceae (4.2%), and Aquifoliaceae (4.1%). Lithocarpus dealbatus was the greatest single species contributor (22.3%) to the overall stand density, followed by Quercus lineata (8.3%), Persea odoratissima (5.8%), Schima wallichii (5.7%), Cinnamomum cassia (L.) J.Presl (3.9%), Helicia nilagirica Bedd. (3.7%), and Castanopsis tribuloides (2.7%). These seven species together constituted 52.4% of the total stand density (Appendix A, Table A1).
The trees were further categorized into three DBH classes, i.e., pole trees (10–30 cm DBH), middle-sized trees (30–60 cm DBH), and mature trees (≥60 cm DBH). The tree population structure revealed that the pole-sized trees made the highest percentage of contribution to overall stand density (83.6%), followed by middle-sized trees (14.7%), and least by the mature trees (1.7%). Similarly, the pole-sized trees contributed significantly to stem density (73.5%), followed by middle-sized trees (23.7%) and finally, mature trees (2.8%). The basal area was dominated by trees in the middle and mature tree classes (55.4%). Across the stand, four out of six sites showed a high density of pole-sized trees in both trees and stem categories (>80%), with basal cover ranging between 50% and 72% (Table 3).
Pynursla forest had the highest percentage of pole tree density, i.e., 574 trees ha−1, stem density of 718 stems ha−1, and a basal area of 11.8 m2 ha−1, followed by the Laitryngew site (Table 3). Whereas, Weiloi forest had the least number of individuals among all stands but had the highest density of trees (130 trees ha−1) and stems (446 stems ha−1), with a basal area of 17.3 m2 ha−1 in the middle-sized category, followed by the Laitkynsew site (Table 3). Weiloi and Laitkynsew had high densities of mature trees (18 and 30 trees ha−1, respectively) and stems (84 trees ha−1 and 38 stems ha−1, respectively), with a basal area of 7.1 and 15.7 m2 ha−1, respectively.
Fagaceae tree density constituted 28.3% to the total pole-sized class, whereas the Non-Fagaceae tree species constituted 55.3%. Consequently, the contribution of pole-sized trees to the total basal area by the Fagaceae members was lower (17.2%) as compared to Non-Fagaceae trees (27.5%). However, Fagaceae members with 9.4% trees in the middle-sized and mature classes contributed 30.5% to the total basal area, and the Non-Fagaceae trees in the same category with 7.1% tree density contributed 24.9% to the total basal area. Overall, the Fagaceae members showed high stem density (19.7%) above 30 cm DBH class as compared to Non-Fagaceae trees (6.8%) (Table 3 and Figure 4).

3.3. Diversity, Regeneration Potential, and Overstory Recruitment of Fagaceae Species

At Laitkynsew, Jarain, and Pynursla, the family Fagaceae was represented by five species, Laitryngew had four species, but only three species occurred at both Weiloi and Upper Shillong (Table 4). Lithocarpus dealbatus was the most widely and frequently occurring species, and was recorded at all the study sites. Castanopsis tribuloides occurred at five sites, whereas L. elegans (Blume) Hatus. ex Soepadmo and Quercus glauca Thunb. occurred at three sites. Castanopsis purpurella (Miq.) N.P.Balakr. and Quercus lineata were present at two sites, and C. indica, C. lanceifolia (Oerst.) Hickel & A. Camus, and Q. semiserrata Roxb. were rare in occurrence, being present only at the Laitkynsew site. Q. griffithii Hook.f. & Thomson ex Miq. was only recorded at Upper Shillong.
The regeneration potential of the Fagaceae species varied across the stands (Table 4). Large trees (>60 cm DBH) were very poorly represented (≤5% relative density) at all the sites, small and large saplings were most abundant and seedling densities were often relatively low. Across the stands, 60% of the Fagaceae species showed good regeneration potential, 12% had poor to fair potential, 16% were in a new regeneration phase, while 12% of species present on the study sites showed no regeneration potential. Laitkynsew forest had the highest percentage of small saplings (60.5%) and the lowest proportion of pole trees.
The Fagaceae species at Jarain, Pynursla, Laitryngew, and Upper Shillong forest stands were often classified as having good regeneration potential. Lithocarpus dealbatus was the only species which occurred at all six sites and it universally had good regeneration potential. Castanopsis purpurella (Jarain and Pynursla), Quercus semiserrata, and C. indica (Laitkynsew) at lower elevation sites had good regeneration potential, as did Q. griffithii (Upper Shillong) at the higher elevations. Q. lineata had good to fair regeneration potential at both Weiloi and Laitryngew forests.
Castanopsis tribuloides showed good regeneration potential at the Jarain site. It appears that C. tribuloides (Weiloi and Upper Shillong) and C. lanceifolia (Laitkynsew) were in an early phase of regeneration, which may indicate a response to forest disturbances or colonization by these species of new areas. At certain sites, C. tribuloides (Pynursla and Laitryngew) and Quercus glauca (Pynursla) lacked seedling and sapling populations, indicating that they had no to low regeneration potential. Lithocarpus dealbatus and Q. lineata together were the most abundant Fagaceae species, contributing 69.2% of the total number of individuals. These species accounted for 68% of the Fagaceae seedlings, 57.5% of small saplings, 73% of large saplings, 78% of pole trees, and 81.4% of large trees.
The analysis of the size structure of Fagaceae by regeneration class: seedlings, small saplings, and large saplings, showed that seedling populations were low at all sites (Figure 5a). At Jarain, Pynursla, and Laitryngew, the distribution of individuals across regeneration classes formed a J-shaped distribution reflecting the lack of adequate numbers of trees in the smaller regeneration classes to sustain current density of trees observed in the larger classes. The analysis of diameter distributions of Fagaceae species by site also revealed that almost all sites had good regeneration potential, i.e., seedlings > or < saplings > large trees (total number of seedling and saplings), but low recruitment capacity to sustain current densities in the larger size classes (Figure 5). The population structure of Fagaceae differ markedly between the sites (Figure 5b). Jarain, Laitryngew, Pynursla, and Upper Shillong sites showed reverse J-shaped curves. The number of individuals was concentrated in lower DBH classes that gradually declined in the successively larger diameter classes. The Weiloi distribution trended toward a normal bell-shape skewed to the right where the greater proportion of individuals were distributed in the intermediate and larger DBH classes. The Laitkynsew site had the lowest density of Fagaceae across all diameter classes.

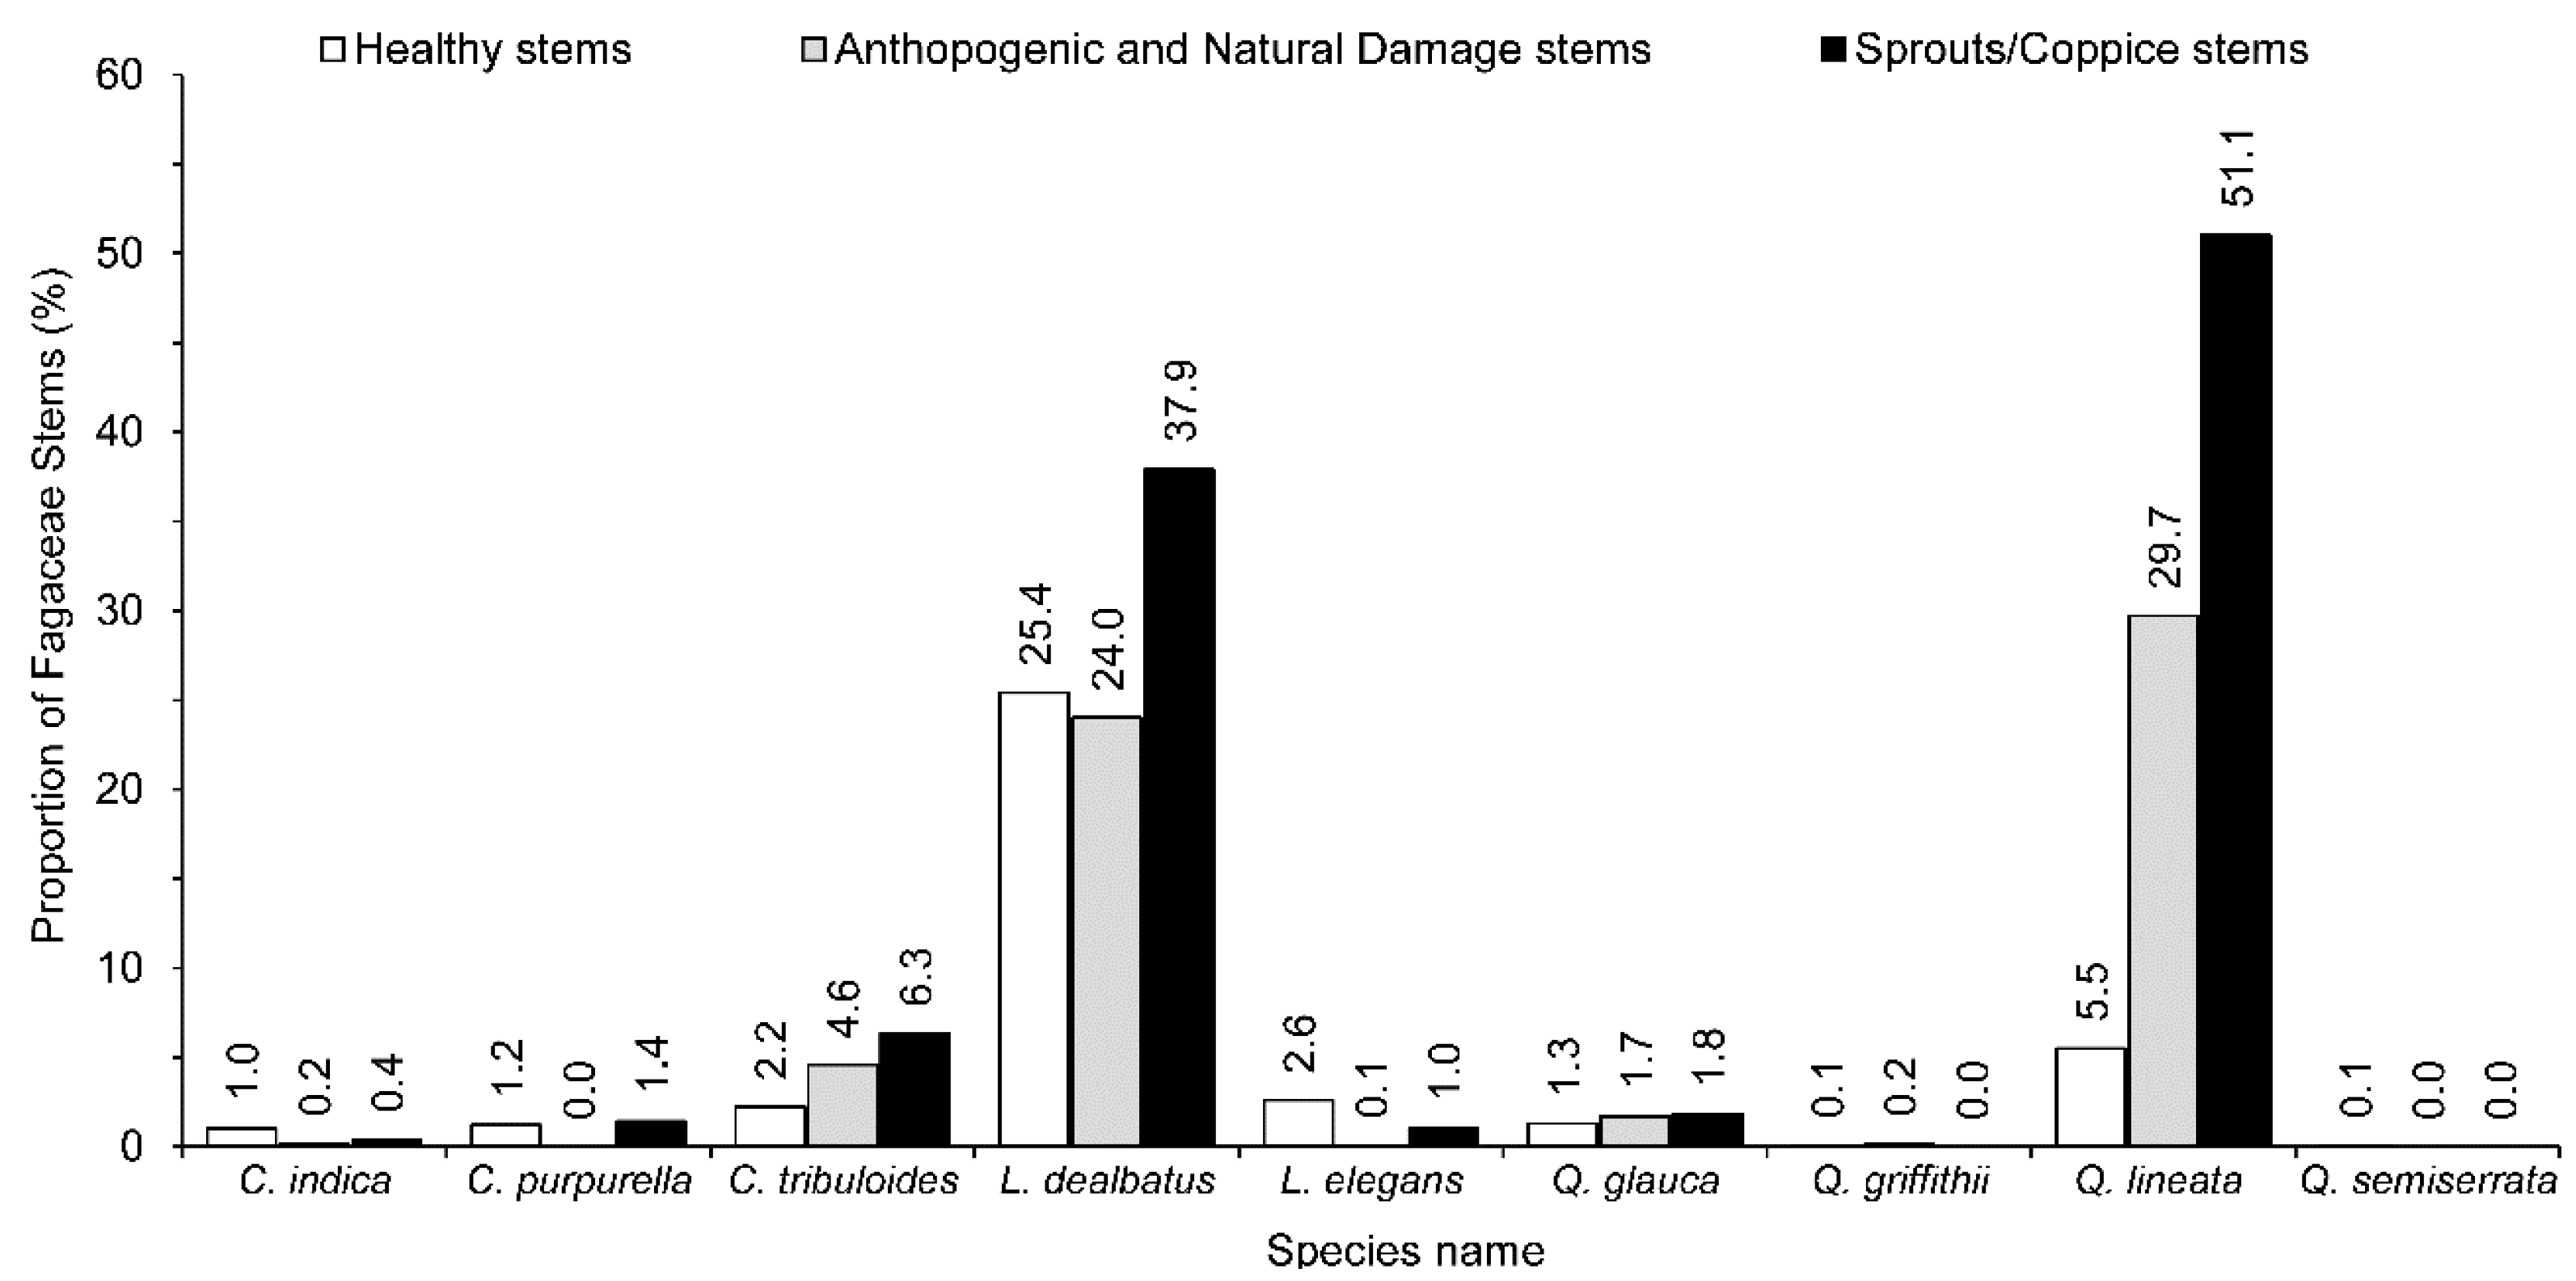
3.4. Adaptation Strategy to Disturbance Stress by Fagaceae Species

Laitryngew, Jarain, and Weiloi have experienced a high level of disturbance based on the scores generated from the disturbance indicators (signs of cutting, grazing, burning, and trampling) (Table 5). Weiloi forest had the highest levels of tree harvesting as evidenced by cut-stems and stumps, and Laitkynsew had the lowest level.
Across all study stands, 61% of the trees were healthy, 35.8% were cut, and 3.2% were damaged by natural causes (Table 6). Non-Fagaceae species showed a higher percentage of healthy trees (41.9%) than trees in Fagaceae (19.1%). Fagaceae trees were three times more likely to be affected by cutting and two times more impacted by natural causes than Non-Fagaceae trees. However, damage due to natural causes in both Fagaceae and Non-Fagaceae trees was <5%. Fagaceae species, which constituted 37.6% of total tree density, showed high stem sprouting following disturbance. Sprouting was observed to be higher after stem cutting in individual Fagaceae trees, which produced 1.84 times more stems on average after cutting compared to Non-Fagaceae trees that only produced 1.19 stems per cut stump (Table 6). The percentage of sprouting was 16.1% in Non-Fagaceae trees in response to stem cutting and 45.6% in Fagaceae trees (Table 6). Among the Fagaceae trees, only Castanopsis purpurella and Quercus semiserrata showed no sign of damage. Three Fagaceae members, viz., Q. lineata, C. tribuloides, and L. dealbatus, together constituting 88% of the total Fagaceae tree density, were the most damaged due to anthropogenic and natural disturbances. The extent of damage in these three species varied from 48.6% in L. dealbatus, 67.1% in C. tribuloides, to 84.3% in Q. lineata. Correspondingly, these three species showed high sprouting/sprouting ability following disturbance (Table 6 and Figure 6). Q. lineata (2.94) had the highest number of stems per tree followed by C. purpurella (2.17), C. tribuloides (1.74), L. dealbatus (1.54), and Q. glauca (1.39), and the rest of the four Fagaceae members had <1.21 stem turnover rate per tree (Table 6).
Proportionately, Lithocarpus dealbatus and Quercus lineata had high stem density, and were the two Fagaceae species most affected by natural and anthropogenic causes, with 24.0% and 29.7% damage, respectively (Table 6). Slightly more than a third (37.9%) of the L. dealbatus and half of Q. lineata (51.1%) that were harvested by cutting were able to coppice (Figure 6).

3.5. Influence of Biotic and Abiotic Factors on the Regeneration of Fagaceae Tree Species

The results from GLM analyses are presented in tabulated form in Table 7. The adjusted R2 between observed and predicted values from five GLM analyses ranged from 0.50 to 0.98 (Figure 7), reflecting a moderate to high accuracy of GLM analyses. The increase in the disturbance was positively related to the higher number of seedlings, small saplings, and pole-sized trees. Here, disturbance intensity of a plot was assessed as being mild, moderate, or high. It was calculated from the summation of the presence or absence (i.e., 0 or 1) of signs of cuts on trees, grazing, burning, and trampling in each plot. The interactions between elevation, the proportion of cut stems, and stumps had a negative effect on the frequency of seedlings but a positive effect on the frequency of pole-sized trees. The frequency of small saplings, large saplings, and pole-sized trees increased significantly as the distance between the plots and nearest villages increased. The interaction between structural diversity (Gini index) and stand density had a positive effect on the frequency of Fagaceae seedlings, small saplings, large saplings, and pole-sized trees. However, the interactions between tree species diversity and stand density had a negative effect on the frequency of seedlings, small saplings, and large saplings. The interaction between the proportion of the cut basal area between Fagaceae trees and other trees had a positive effect on the frequency of seedlings and trees but a negative effect on the frequency of small saplings, large saplings, and pole-sized trees. Bulk density had a positive effect on the occurrence of large saplings but did not influence other tree size classes.

4. Discussion

The degraded and fragmented subtropical broad-leaved humid forests on southern slopes of Meghalaya are exposed to numerous biotic and abiotic disturbances. These forests are the remnants of the continuous forests of the past and harbor high species richness and diversity [41,46]. The taxonomic diversity of species, genus, and family is comparable with the findings reported [53] from fragmented forests of Jaintia Hill district in Meghalaya. The heterogeneous, diverse assembly of plants reported in this study is largely a result of the unique geographical location, topography, and seasonality in the climate. The tree species diversity in these remnant forests is also comparable with some of the well-protected old-growth forests in sacred groves throughout the region [38,39]. We observed that the species richness did not show any linear relationship with the increase in forest fragment size. This trend corroborates the findings [53] in the fragmented subtropical forests of Meghalaya and in the temperate forests of Chile [76]. Such fragmented forests do not support the idea that larger fragments harbor a high number of species [77]. On the contrary, these remnant forest fragments are under severe threat due to anthropogenic activities that may negatively impact disturbance-sensitive species. These forest fragments serve as potential refuges for the conservation of native species that are resilient to the anthropogenic disturbances [78].
In terms of species richness, Lauraceae was the dominant family, followed by Rubiaceae and Fagaceae. A similar distribution of families was recorded in sub-tropical and lower-temperate forests of south-east Asia [40,41,79,80,81]. The range of species recorded from the different study sites (10–51 tree species) was higher than oak-dominated forests of the Mid-Appalachians of the eastern United States (4–12 tree species) and the Kumaun Himalaya area of northern India (1–9 tree species) [36].
Except for the Weiloi forest, which was dominated by Fagaceae, all the other forests were characterized as having a low dominance index and high Shannon’s diversity. The negative relationship between the dominance and evenness indices indicates a diverse community assemblage and demonstrates the importance of these remnant forests for the conservation of plant diversity in this fragmented landscape [53,82]. Fagaceae was the dominant family on the basis of basal area and was followed by Lauraceae, Theaceae, Myricaceae, and Proteaceae. These families are widely distributed in the entire landscape of sub-tropical forests of Meghalaya [40,41,81]. Fagaceae species play an important role as keystone species in the sustainability of these fragmented remnant forests. Lithocarpus dealbatus was the dominant species accounting for 19.3% of the total basal area across the study sites, followed by Quercus lineata, Schima wallichii, Persea odoratissima, Myrica esculenta, Castanopsis indica, and Castanopsis tribuloides. Together, these seven species accounted for 60.4% of the total basal area. These dominant native species have co-evolved and coexisted for a long time in these forests.
Landscape-level restoration to connect the fragmented forest patches may be achieved if these dominant species, together with some fast-growing native species, are planted together [83]. The fast-growing species such as Alnus nepalensis D.Don., Betula alnoides Buch.-Ham.ex D.Don, etc., can grow fast and provide forest products and services in a short time, which may be utilized by the local people to meet their needs [83]. The natural regeneration and recruitement of late successional species (Fagaceae species) is often poor, as was observed in our present study and reported by others for oak forests around the world [44,84,85]. Therefore, planting site-adapted fast-growing tree species on the degraded land near viallges may decrease the dependency on the slow-growing Fagaceae tree species of Meghalaya, which may provide the time that these dominant native species need to undergo natural regeneration and recruit themselves into the mature tree canopy [6,86,87,88].

4.1. Community Characteristics

The range of basal area and stand density reported in this study is comparable to the temperate pine-oak mixed forests of the Qinling Mountains in north-western China [89], tropical forests of Kenya [90], and fragmented subtropical forests of Meghalaya [53]. However, basal area and tree density is lower than sub-tropical and temperate oak forests of central Himalaya [91,92]. The stem density showed no linear relationship with the size of the forest fragment, it did, however, increase significantly with increasing disturbance. The increase in stem density following disturbance may be attributed to species resilience by prolific sprouting in these forest fragments [93]. Gaps created by selective harvesting of large diameter trees promoted tree recruitment by releasing established seedlings and saplings, thereby increasing stem density in the larger size classes, a process also reported by Reference [37] from the subtropical forest of Meghalaya. Consequently, basal area was lower, despite high densities of small diameter stems, at Jarain, Pynursla, Laitryngew, and Upper Shillong than the old-growth forests at Laitkynsew and Weiloi. These findings are supported by recent studies in a disturbed dry tropical forest in northern India [94].
In general, across the remnant forests, we observed a high percentage of pole-sized trees showing a reverse J-shaped diameter distribution. The preponderance of smaller-sized trees clearly indicates that these forests are regenerating [39,53,90]. In undisturbed forests, such a distribution results from a high density of trees in the lower diameter classes and low tree mortality [95]. However, in disturbed forests, such distributions are largely due to the extraction of larger diameter trees and recruitment of existing seedlings and saplings into larger size classes [37]. The relative density of pole-sized trees in Fagaceae (28.3%) was lower than Non-Fagaceae (55.3%) species. Selective extraction of Fagaceae trees has led to increases in the number of Non-Fagaceae species in the lower diameter classes within the forests. Consequently, the slow-growing Fagaceae trees are being replaced by the fast-growing diverse Non-Fagaceae species under disturbance regime [37,92]. However, adopting sustainable management practices, such as reducing the over-exploitation of trees, may result in the recruitment of pole-sized trees to mature and large trees of Fagaceae species, which can foster the natural regeneration of Fagaceae trees in the future forests [96].
In the present study, the population structure of Fagaceae (DBH > 10 cm) in four out of the six remnant forests, viz., Laitryngew, Jarain, Upper Shillong, and Pynursla, showed a reverse J-shaped distribution, indicating that species are regenerating [53,90]. However, at Weiloi, where Fagaceae alone was dominant (91.2% total basal area), we observed a bell-shaped distribution that was skewed to the right. The highest concentration of trees was in the intermediate diameter class, indicating infrequent recruitment in the lower DBH classes and resulting from harvest of the larger diameter trees. Eventually, the lack of regeneration will lead to inadequate recruitment of Fagaceae and a higher risk of their loss locally [37,97]. However, recruitment of the current intermediate-sized tree into the larger diameter class of mature trees may provide an opportunity to establish natural regeneration and avoid local extinction of the forest species. The forest at Laitkynsew had a bimodal diameter distribution, which may be due to episodic regeneration or recruitment events that produced pulses in the distribution over time [98]. Among the Fagaceae species, the contribution of Lithocarpus dealbatus and Quercus lineata to the population structure was the greatest. This illustrates the importance of these two species to the overall structure of the Fagaceae-dominated subtropical forests. To better understand the principles governing the dynamics of such frequently disturbed forests, a long-term study on natural regeneration and forest dynamics is needed, especially how human disturbances can be used to favor the desired species as the forests provide for local communities [99].

4.2. Regeneration Potential

The density of Fagaceae seedlings was lower at all sites than that of saplings, indicating that there may be insufficient numbers to sustain current stocking of larger trees in the future. Low regeneration density may be due to over-grazing pressure on seedlings, removal of acorns as fruits, and extraction of mature trees for timber and fuelwood by anthropogenic activities in these forests [37,44]. The seed of Fagaceae species is highly desirable to seed pests and predators. The abundance of seedlings in these forests is currently low, which conforms to the study [44] from the sub-tropical forest in Meghalaya. However, the ratio between successively larger size classes from sapling to large trees shows that at some time in the past, there must have been a good number of seedlings that grew to form the current diameter distribution, which shows the reproductive capacity for success within Fagaceae [99,100,101]. Fagaceae contributed to 37.6% of the total tree density and their population structure showed sufficient recruitment of saplings to pole trees (60%), which suggest good competitiveness in recruitment of Fagaceae in these forest remnants, and ability to sustain themselves in the future [7,39].
Due to removal of seeds and seedlings in the early phases of natural regeneration of Fagaceae by various types of disturbances, saplings outnumbered seedlings in fragmented forests of Jarain, Pynursla, Laitryngew, and Upper-Shillong. Similar results were reported [37] at different intensities of disturbance. Whereas, in Laitkynsew and Weiloi sites, the size structure shows a bell-shaped distribution with a higher density of small saplings than the seedlings and large saplings. Such distribution is commonly seen in disturbed forests, where removal of larger trees and infrequent recruitment of seedlings occurs [37,43,98]. The low density of large saplings is due to over-harvesting by local people for various purposes, and to mortality from competition in overcrowded forests [102].
In general, the Fagaceae species across the sites showed good regeneration potential. Similar results were also reported from the oak-dominated forest in Garhwal Himalaya [103]. Lithocarpus dealbatus, which was present in all the six sites, showed good regeneration potential. Similarly, Castanopsis purpurella, Quercus semiserrata, C. indica, and Q. griffithii also showed good regeneration potential. All other species showed variation in their ability to regenerate at different sites.

4.3. Response of Fagaceae to Disturbance

A large percentage of the human population live in rural areas in Meghalaya, and they depend entirely on forest products such as timber, firewood, and Non-Timber Forest Products (NTFPs) to meet their daily requirements [54]. Unscientific and over-harvesting of these forest resources has reduced the forest cover by 202 km2 in just one decade, and the degradation continues further fragmenting the sub-tropical broad-leaved hill forests across the landscape [50,51,55]. Fagaceae species, particularly Quercus lineata, Lithocarpus dealbatus, and Castanopsis tribuloides, are preferred by the indigenous community for their high timber and fuelwood qualities. In addition to such rampant deforestation, overgrazing and browsing, frequent forest fires, seed predation, and adverse environmental conditions have severely affected the inherent capacity of these forests to regenerate naturally by seed in these forests [39,42,44,104,105]. In contrast, natural regeneration by means of sprouting is less susceptible to environmental conditions and other sources of disturbance [20,42]. Sprouting ability following disturbances varies by species, and has been documented for many species of Fagaceae [106,107,108] and Non-Fagaceae trees in tropical forests [16,109]. In the present study, we found that Fagaceae trees had better sprouting ability than the Non-Fagaceae trees. We also observed that Fagaceae trees were more damaged by both natural and anthropogenic causes than Non-Fagaceae trees. The damage on Fagaceae trees due to anthropogenic activity, i.e., by cutting, was three times higher than it was with Non-Fagaceae trees. However, the Fagaceae species are adapted to such disturbances by having a high capacity to sprout. By sprouting, they are able to grow multiple stems capable of rapid height growth to maintain their dominance over the Non-Fagaceae species. The cutting of Fagaceae trees increased the stem density by almost three times over that of non-Fagaceae, and the average number of stems per tree was higher in Fagaceae (1.84) than Non-Fagaceae (1.19). This result indicates that disturbances that remove the top of trees favor Fagaceae regeneration through stem sprouting in these remnant forests. Among the nine Fagaceae species, Q. lineata and L. dealbatus were the two most damaged species and are frequently cut by the locals for meeting their needs for fuelwood and timber. However, they showed better sprouting ability with high stems sprouting per tree than all the other species in the forest. This also indicates that these two species are well adapted to persist through vegetative regeneration following natural or anthropogenic disturbances that remove the aerial portion of the tree but leave the root system alive and intact. Consequently, it may be inferred that both of these species may be considered as one of the desired species for landscape-level restoration activities in these fragmented forests. Their capability to withstand such adverse conditions (e.g., heavy rainfall and anthropogenic disturbances) and ability as prolific sprouters gives them an aided advantage over other species that are capable of dominating the entire degraded and fragmented landscape [20,42,44].

4.4. Influence of Biotic and Abiotic Variables

Disturbance plays a very important role in shaping the species composition, structure, and regeneration status of the forest [37,110,111]. Our study shows a positive interaction of disturbance intensity on seedling, large sapling, and pole-sized tree density. Similarly, the distance from the nearest village to the study site showed a positive interaction. Our results suggest that Fagaceae seedlings grow better in sites where a moderate level of disturbance occurs [44]. They found that the heavy seeds of Litocarpus dealbatus and Quercus spp. are more likely to establish successfully in moderately disturbed sites. The growth of Fagaceae species such as L. dealbatus, Q. glauca, and Q. griffithii is increased in higher light environments, such as canopy tree gaps in the forest [42,43]. Tree gaps also promote survival of Fagaceae saplings and pole trees [14,42]. Distance from the nearest village directly relates to the frequency of anthropogenic disturbance by which the forest is harvested, resulting in improved light conditions for regeneration [53]. However, the interaction between elevation, percentage of cut stump, and percentage of the cut stem had a negative effect on seedling regeneration. This result may develop as a consequence of selective felling of large, mature, seed-bearing trees by the locals to meet their needs for timber and fuelwood from the forest. Along the elevation gradient, Fagaceae seedlings were distributed in a bell-shaped pattern. Excessive grazing pressure occurred at higher elevations may have contributed to lower seedling densities [112]. At lower elevations, low density of Fagaceae seedlings may be due to higher levels of competition from an abundance of competing Non-Fagaceae species. Regeneration of Fagaceae species was predominantly distributed at an elevation above 1000 meters above sea level [60,61].
The bulk density had a positive interaction with large saplings. The bulk density influences the water storage capacity of forests soils. For instance, high bulk density results to low soil water storage capacity, which can create a situation of drought during the dry months of the year. Fagaceae species are deep-rooted, and perhaps, in stony soils, they send the roots in deeper to fetch water. However, it warrants further below-ground experiment on fine and coarse roots in the study area. The study revealed that across the different forest fragment sizes, Castanopsis purpurella was the dominant species both in terms of basal area and density and, 55–74% of individuals were distributed in 5–15 cm DBH class, which corroborates with our results.
The interaction between the percentage of basal area and percentage of cut stems shows a positive relationship with seedling and large tree populations and negatively impacts the large saplings and pole-sized trees. This may be because higher basal area is associated with greater resource utilization by Fagaceae, and percentage of cut stem positively increases stem regeneration through sprouting from the cut trees [93]. However, it negatively affects the large saplings and pole-sized trees due to their low basal area and susceptibility to injury by cutting that may lead to infection and increased mortality rate in the lower diameter classes [95]. Large saplings and pole trees also suffer to a greater extent due to suppression under the canopy and low-light conditions [42].
The interaction between the Gini index and stem density had a positive impact on the regeneration potential of Fagaceae. Gini index at all the sites ranged from 0.4 to 0.59, which suggests that the forests are structurally heterogeneous and diverse. Regeneration potential increased with increases in structural heterogeneity and stem density as these fragmented forests are successfully recruiting with 83% of the density of the trees in 10–30 cm DBH class [53]; thus, allowing sufficient recruitment of seedlings of late successional species (Fagaceae) at sites where the tree canopy is opened by harvesting or natural mortality. The result is increases in large sapling and pole-sized tree density. In this study, we saw that one single-family (Fagaceae) produced higher stem and pole-sized tree density compared to 52 species in the Non-Fagaceae families.
The interaction between tree species diversity and tree density had a negative impact on Fagaceae seedlings, small saplings, and large saplings. This result indicates that the increase in species diversity results in an increase in competing species and competition for available resources, which are always in limited supply. This intensifies the interspecific competition for light, moisture, space, and nutrients, which results in high seedling and sapling mortality. Similar results were seen in pine-oak mixed forests in the Qinling Mountains in northwestern China [89].

5. Conclusions

From our study, it is evident that the Fagaceae populations in the forest were strongly influenced by the human-modifications of structure and composition of the forest that effected regeneration potential and recruitment of mature trees, in a way that brings into question the sustainability of Fagaceae in these forests. Sustaining the health, productivity, and goods and services of disconnected forest remnants requires science-based forest management and utilization. The pillars of sustainability are the sufficient and timely regeneration of Fagaceae tree species and their recruitment into the big and mature trees in the overstory of the forest. These fragmented and degraded forests still have the potential to naturally regenerate Fagaceae species with management that ensures high regeneration potential in desired species. Efforts should be made to undertake sustainable forest management at the landscape level to promote reconnecting fragmented forests, enlarging existing forests, and improving the stocking of desired species in degraded forests. We can conclude that the low recruitment of pole-sized Fagaceae trees to mature and big trees due to overexploitation can pose serious challenges to the long-term survival of Fagaceae forests if we fail to conserve, restore and sustainably manage existing fragmented forests. Active and passive restoration strategies should be combined for restoring these forests. For instance, enrichment planting of Fagaceae tree species as well as site-adapted fast-growing species should be carried out on the degraded forest lands under active restoration to fulfil local demand. And at the same time, existing Fagaceae trees should not be overexploited so that passive restoration can take place inside the Fagaceae forests. The involvement of the local community as stewards of the forests and commitment from governmental agencies to provide management guidance and demonstrate best management practices are essential. There is an urgent need to develop silvicultural strategies to manage these forests under the framework of community forest management and benefit sharing, which is not yet well-developed. It would enable the sustainable management of Fagaceae forests for biodiversity conservation and maintaining the flow of ecosystem and economic goods and services. However, if the current trend of anthropogenic forest degradation continues, the existing forest remnants may continue to shrink in size, be degraded by loss of desired species, and will eventually and significantly lose their ecological resilience.

Author Contributions

S.S., T.C., S.K.B., and J.B. developed the concept of this field study. The field data was collected by P.P.S., A.D., and F.D. Database preparation, soil analyses, and data curation were done by P.P.S., D.A., A.D., F.D., and S.S. The data analyses were carried out by P.P.S., T.C., and S.S., P.B.G. identified herbarium specimens and tallied them to the specimens from the Botanical Survey of India, Eastern Circle, Shillong. The first draft of the manuscript was co-written by P.P.S., T.C., and S.S., F.E.F., C.R., and D.C.D. contributed in structuring and conceptualizing the manuscript. S.S., J.B., S.K.B., and C.R. contributed in grant proposal related to this study. Supervisory support to P.P.S., A.D., and F.D. was provided by S.S., S.K.B., and J.B. All authors have read and agreed to the published version of the manuscript.

Funding

A.D. and F.D. went to India from Germany after getting financial support from the German Academic Exchange Service (DAAD). Partial funding of this work was met from a project funded by the Department of Biotechnology (DBT), Government of India (BT/env/BC/01/2010). P.P.S. short-term visit to Germany was funded under the Young Scientist Initiative of the International Union of Forest Research Organizations (IUFRO) and the European Forest Institute (EFI). The visit to study sites in Meghalaya by S.S. and D.C.D. was funded by the Karlsruhe Institute of Technology and USDA’s Forest Service, respectively. The article processing charge was funded by the Karlsruhe Institute of Technology.

Acknowledgments

We acknowledge support from the villagers and community leaders for allowing us to work in forest lands owned by them. We sincerely thank Meghalaya Forest Department for their support. P.P.S. thanks IUFRO-EFI for awarding him Young Scientist Initiative award in 2018. S.S. thanks Andreas Bolte, John A. Stanturf, Magnus Löf, and Palle Madsen of IUFRO’s Task Force “Transforming Forest Landscapes for future Climates and Human Well-Being” for providing guidance on forest restoration research and application.

Conflicts of Interest

The authors declare no conflict of interest. The funders had no role in the design of the study; in the collection, analyses, or interpretation of data; in the writing of the manuscript, or in the decision to publish the results.

Appendix A

Table A1. List of tree species and their IVI values in study sites. Unidentified species were marked as UNK.
Species Name LaitkynsewJarainPynurslaWeiloiLaitryngewUpper Shillong
FamilyIVIBA/
ha
D/haIVIBA/
ha
D/haIVIBA/
ha
D/haIVIBA/
ha
D/haIVIBA/
ha
D/haIVIBA/
ha
D/
ha
Gynocardia odorata R.Br.Achariaceae2.60.052
Brucea javanica (L.) Merr.Anacardiaceae 3.20.022
Toxicodendron hookeri (K.C. Sahni & Bahadur) C. Y. Wu & T.L. MingAnacardiaceae 3.30.042
Rhus succedanea L.Anacardiaceae 12.41.024 3.30.042
Miliusa roxburghiana Hook.f. & ThomsonAnnonaceae2.70.082
Ilex embelioides Hook.f.Aquifoliaceae 2.50.12 8.80.532
Ilex excelsa (Wall.) VoigtAquifoliaceae 2.80.222.70.04
Ilex khasiana Purkay.Aquifoliaceae 8.60.2310
Ilex venulosa Hook.f.Aquifoliaceae 21.91.074 2.30.12
Macropanax dispermus (Blume) KuntzeAraliaceae2.60.042
Merrilliopanax alpinus (C.B.Clarke) C.B.ShangAraliaceae6.70.426
Pentapanax sp.Araliaceae 2.00.02 3.90.14
Schefflera hypoleuca (Kurz) HarmsAraliaceae 5.20.267.20.3128.00.027.30.422
Schefflera sp.Araliaceae10.41.3316
Betula alnoides Buch.-Ham. ex D.DonBetulaceae 4.00.094
Carpinus viminea Wall. ex Lindl.Betulaceae 3.80.24
Euonymus sp1.Celastraceae2.50.022
Euonymus sp2.Celastraceae 2.40.02
Microtropis discolor (Wall.) Arn.Celastraceae 2.00.02
Calophyllum polyanthum Wall. ex Planch. & TrianaClusiaceae21.12.78327.90.318
Garcinia cowa Roxb. ex ChoisyClusiaceae 2.00.12
Daphniphyllum himalayense (Benth.) Müll. Arg.Daphniphyllaceae 2.50.12 3.20.022
Diospyros sp.Ebenaceae 1.90.02
Elaeocarpus sp1.Elaeocarpaceae 20.01.648
Elaeocarpus acuminatus Wall. ex Mast.Elaeocarpaceae 4.50.26
Elaeocarpus bracteatus KurzElaeocarpaceae 3.30.042
Elaeocarpus floribundus BlumeElaeocarpaceae 4.70.36
Elaeocarpus lanceifolius Roxb.Elaeocarpaceae 15.21.456
Elaeocarpus prunifolius Wall. ex Müll. Berol.Elaeocarpaceae 5.90.210
Elaeocarpus sp2.Elaeocarpaceae 2.60.032
Lyonia ovalifolia (Wall.) DrudeEricaceae 4.70.156
Rhododendron arboreum Sm. Ericaceae 1.90.0216.81.4122
Croton oblongus Burm.f.Euphorbiaceae 3.80.26
Macaranga peltata (Roxb.) Müll.Arg.Euphorbiaceae3.50.164
Ostodes paniculata BlumeEuphorbiaceae16.80.8536
Castanopsis indica (Roxb. ex Lindl.) A.DC.Fagaceae25.15.2022
Castanopsis purpurella (Miq.) N.P.Balakr.Fagaceae 3.80.265.10.46
Castanopsis tribuloides (Sm.) A.DC.Fagaceae 27.32.8586.70.76 8.80.920
Lithocarpus dealbatus (Hook.f. & Thomson ex Miq.) RehderFagaceae12.41.161843.34.410051.94.413218.60.4862.98.821095.59.08220
Lithocarpus elegans (Blume) Hatus. ex SoepadmoFagaceae 5.50.3616.10.942
Quercus glauca Thunb.Fagaceae 19.01.7402.50.12 2.20.04
Quercus griffithii Hook.f. & Thomson ex Miq.Fagaceae 10.00.696
Quercus lineata Blume Fagaceae 185.325.822412.51.432
Quercus semiserrata Roxb.Fagaceae4.20.612
Exbucklandia populnea (R.Br. ex Griff.) R.W.Br.Hamamelidaceae 3.00.12 5.30.612
Itea macrophylla Wall.Iteaceae8.20.3012
Engelhardtia spicata Lechen ex BlumeJuglandaceae 3.40.16 1.80.023.50.082
Callicarpa arborea Roxb.Lamiaceae2.80.102
Alseodaphne khasyana (Meisn.) Kosterm.Lauraceae8.50.6210
Beilschmiedia assamica Meisn.Lauraceae 11.40.818
Cinnamomum cassia (L.) J.Presl Lauraceae 2.30.02 26.92.51183.30.042
Cinnamomum glanduliferum (Wall.) Meisn.Lauraceae 9.30.3710
Cinnamomum sp.Lauraceae 10.80.722
Cinnamomum tamala (Buch.-Ham.) T.Nees & Eberm.Lauraceae14.61.5222 11.30.720
Cinnamomum verum J.PreslLauraceae 1.80.02
Iteadaphne caudata (Nees) H.W. LiLauraceae 3.20.022
Lindera caudata (Nees) Hook. f.Lauraceae 3.70.044
Lindera latifolia Hook. f.Lauraceae11.32.2541.90.02
Lindera sp.Lauraceae 1.90.02
Lindera nacusua (D. Don) Merr.Lauraceae 2.50.12
Litsea sp1.Lauraceae 2.40.12
Litsea sp2.Lauraceae 2.20.12
Litsea sp3.Lauraceae 2.00.02
Litsea elongata (Nees) Hook. f.Lauraceae 2.30.128.00.510 6.00.314
Litsea sp4.Lauraceae 2.00.12
Litsea sp5.Lauraceae2.80.112
Machilus duthiei KingLauraceae2.80.102
Neolitsea umbrosa (Nees) GambleLauraceae 2.70.14
Ocotea lancifolia (Schott) MezLauraceae 5.20.38
Persea sp3Lauraceae 3.60.16
Persea odoratissima (Nees) Kosterm.Lauraceae27.85.96242.20.1218.41.150 22.41.91023.30.042
Persea sp1.Lauraceae 8.00.02
Persea sp2.Lauraceae 3.90.084
Albizia sp.Leguminosae 1.90.02
Pongamia pinnata (L.) PierreLeguminosae2.90.152
Magnolia sp4.Magnoliaceae 7.00.310
Magnolia sp3.Magnoliaceae 2.00.12
Magnolia insignis Wall.Magnoliaceae 3.10.16 15.61.362
Magnolia punduana (Hook.f. & Thomson) FiglarMagnoliaceae 6.70.86
Magnolia sp2.Magnoliaceae 3.10.16
Magnolia sp1.Magnoliaceae 2.30.12
Manglietia caveana Hook.f. & ThomsonMagnoliaceae2.60.052
Sterculia roxburghiana Wall.Malvaceae7.41.732
Ficus auriculata Lour.Moraceae 2.20.02
Ficus curtipes CornerMoraceae3.90.522
Ficus neriifolia Sm.Moraceae 6.10.3143.20.022
Ficus nervosa B.Heyne ex RothMoraceae 4.90.28
Myrica esculenta Buch.-Ham. ex D. DonMyricaceae 3.00.228.80.51221.10.9108.10.71825.93.1824
Knema sp.Myristicaceae 2.70.14
Syzygium sp1.Myrtaceae 2.00.02
Syzygium tetragonum (Wight) Wall. ex Walp.Myrtaceae 5.10.185.00.16 1.80.02
Olea salicifolia Wall. ex G.DonOleaceae 3.30.24
Eurya acuminata DC.Pentaphylacaceae 6.50.064
Eurya cerasifolia (D.Don) KobuskiPentaphylacaceae 1.90.02
Eurya japonica Thunb.Pentaphylacaceae 2.30.027.90.022.20.14
Glochidion acuminatum Müll.Arg.Phyllanthaceae 2.80.18
Glochidion sp.Phyllanthaceae 3.20.16
Pinus kesiya Royle ex GordonPinaceae 9.00.32 31.92.3572
Ardisia sp.Primulaceae 2.30.02
Myrsine semiserrata Wall.Primulaceae 2.10.125.90.110
Helicia nilagirica Bedd.Proteaceae 12.50.83023.81.376 4.50.18
Helicia robusta (Roxb.) R.Br. ex BlumeProteaceae20.02.7928
Docynia indica (Wall.) Decne.Rosaceae 1.90.02
Eriobotrya sp.Rosaceae 2.10.12
Photinia integrifolia Lindl.Rosaceae 2.90.12
Prunus cerasoides Buch.-Ham. ex D.DonRosaceae 3.20.022
Prunus phaeosticta (Hance) Maxim.Rosaceae 1.90.02
Hyptianthera stricta (Roxb. ex Schult.) Wight & Arn.Rubiaceae 2.10.12
Meyna spinosa Roxb. ex LinkRubiaceae2.80.112
Psychotria sp.Rubiaceae 4.10.14
Psychotria symplocifolia KurzRubiaceae 2.10.12
Wendlandia sp2.Rubiaceae 1.90.022
UNK 11Rubiaceae 8.91.374
UNK 12Rubiaceae 2.00.032
Randia sp.Rubiaceae5.50.204
Tarennoidea wallichii (Hook.f.) Tirveng. & SastreRubiaceae 2.50.16
Wendlandia sp.Rubiaceae2.60.052
Acronychia pedunculata (L.) Miq.Rutaceae 8.00.412
Casearia glomerata Roxb.Salicaceae6.00.156 7.00.212
Acer laevigatum Wall.Sapindaceae 6.40.310 4.20.163.30.042
Aesculus assamica Griff.Sapindaceae9.01.206
Sarcosperma griffithii Hook.f. ex C.B.ClarkeSapotaceae6.00.1667.20.34148.20.316
Illicium griffithii Hook.f. & ThomsonSchisandraceae 1.90.02
Styrax hookeri C.B. ClarkeStyracaceae 3.20.14
Styrax sp1.Styracaceae 5.30.28
Styrax serrulatus Roxb.Styracaceae3.60.1842.00.0328.10.412
Symplocos sp. Symplocaceae 1.80.02
Symplocos paniculata (Thunb.) Miq.Symplocaceae 3.20.287.10.106
Symplocos cochinchinensis var. laurina (Retz.) Noot.Symplocaceae 5.10.138 7.90.025.60.2143.40.052
Symplocos sp1. Symplocaceae 1.80.02
Camellia caudata Wall.Theaceae 11.30.110
Schima wallichii ChoisyTheaceae28.14.18426.10.40145.30.21222.91.01410.70.93429.12.3060
UNK 1UNK 12.600.042
UNK 10UNK 10 2.00.062
UNK 2UNK 22.640.052
UNK 3UNK 3 3.00.232
UNK 4UNK 4 2.10.062
UNK 5UNK 5 2.20.072
UNK 6UNK 6 3.20.214
UNK 7UNK 7 2.20.082
UNK 8UNK 8 2.30.082
UNK 9UNK 9 2.40.042
Leea alata Edgew.Vitaceae2.570.032
Grand Total 300353383002152430016608300292763002586830021478

References

  1. Haddad, N.M.; Brudvig, L.A.; Clobert, J.; Davies, K.F.; Gonzalez, A.; Holt, R.D.; Lovejoy, T.E.; Sexton, J.O.; Austin, M.P.; Collins, C.D.; et al. Habitat fragmentation and its lasting impact on Earth ’ s ecosystems. Appl. Ecol. 2015, 1–9. [Google Scholar]
  2. Pereira, H.M.; Leadley, P.W.; Proenca, V.; Alkemade, R.; Scharlemann, J.P.W.; Fernandez-Manjarres, J.F.; Araujo, M.B.; Balvanera, P.; Biggs, R.; Cheung, W.W.L.; et al. Scenarios for Global Biodiversity in the 21st Century. Science 2010, 330, 1496–1501. [Google Scholar] [CrossRef] [PubMed] [Green Version]
  3. Chazdon, R.L. Second Growth; University of Chicago Press: Chicago, IL, USA, 2014; ISBN 9780226118079. [Google Scholar]
  4. Foley, J.A. Global Consequences of Land Use. Science 2005, 309, 570–574. [Google Scholar] [CrossRef] [PubMed] [Green Version]
  5. Calmon, M.; Brancalion, P.H.S.; Paese, A.; Aronson, J.; Castro, P.; da Silva, S.C.; Rodrigues, R.R. Emerging Threats and Opportunities for Large-Scale Ecological Restoration in the Atlantic Forest of Brazil. Restor. Ecol. 2011, 19, 154–158. [Google Scholar] [CrossRef]
  6. Chazdon, R.L. Beyond Deforestation: Restoring Forests and Ecosystem Services on Degraded Lands. Science 2008, 320, 1458–1460. [Google Scholar] [CrossRef] [PubMed] [Green Version]
  7. Crouzeilles, R.; Ferreira, M.S.; Chazdon, R.L.; Lindenmayer, D.B.; Sansevero, J.B.B.; Monteiro, L.; Iribarrem, A.; Latawiec, A.E.; Strassburg, B.B.N. Ecological restoration success is higher for natural regeneration than for active restoration in tropical forests. Sci. Adv. 2017, 3, e1701345. [Google Scholar] [CrossRef] [Green Version]
  8. Mansourian, S.; Stanturf, J.A.; Derkyi, M.A.A.; Engel, V.L. Forest Landscape Restoration: increasing the positive impacts of forest restoration or simply the area under tree cover? Restor. Ecol. 2017, 25, 178–183. [Google Scholar] [CrossRef]
  9. Suding, K.; Higgs, E.; Palmer, M.; Callicott, J.B.; Anderson, C.B.; Baker, M.; Gutrich, J.J.; Hondula, K.L.; LaFevor, M.C.; Larson, B.M.H.; et al. Committing to ecological restoration. Science 2015, 348, 638–640. [Google Scholar] [CrossRef] [Green Version]
  10. Chazdon, R.L.; Guariguata, M.R. Natural regeneration as a tool for large-scale forest restoration in the tropics: prospects and challenges. Biotropica 2016, 48, 716–730. [Google Scholar] [CrossRef]
  11. Barr, C.M.; Sayer, J.A. The political economy of reforestation and forest restoration in Asia-Pacific: Critical issues for REDD+. Biol. Conserv. 2012, 154, 9–19. [Google Scholar] [CrossRef]
  12. Tesfaye, G.; Teketay, D.; Fetene, M.; Beck, E. Regeneration of seven indigenous tree species in a dry Afromontane forest, southern Ethiopia. Flora Morphol. Distrib. Funct. Ecol. Plants 2010, 205, 135–143. [Google Scholar] [CrossRef]
  13. Rahman, M.; Nishat, A.; Vacik, H. Anthropogenic disturbances and plant diversity of the Madhupur Sal forests ( Shorea robusta C.F. Gaertn) of Bangladesh. Int. J. Biodivers. Sci. Manag. 2009, 5, 162–173. [Google Scholar] [CrossRef]
  14. Dey, D.C. Sustaining Oak Forests in Eastern North America: Regeneration and Recruitment, the Pillars of Sustainability. For. Sci. 2014, 60, 926–942. [Google Scholar] [CrossRef]
  15. Guariguata, M.R.; Ostertag, R. Neotropical secondary forest succession: changes in structural and functional characteristics. For. Ecol. Manag. 2001, 148, 185–206. [Google Scholar] [CrossRef]
  16. Kammesheidt, L. The role of tree sprouts in the restorations of stand structure and species diversity in tropical moist forest after slash-and-burn agriculture in Eastern Paraguay. Plant Ecol. 1998, 139, 155–165. [Google Scholar] [CrossRef]
  17. Khan, M.L.; Menon, S.; Bawa, K.S. Effectiveness of the protected area network in biodiversity conservation: a case-study of Meghalaya state. Biodivers. Conserv. 1997, 6, 853–868. [Google Scholar] [CrossRef]
  18. Saxena, A.K.; Singh, J.S. Tree population structure of certain Himalayan forest associations and implications concerning their future composition. Vegetatio 1984, 58, 61–69. [Google Scholar] [CrossRef]
  19. Saikia, P.; Khan, M. Population structure and regeneration status of Aquilaria malaccensis Lam. in homegardens of Upper Assam, northeast India. Trop. Ecol. 2013, 54, 1–13. [Google Scholar]
  20. Khan, M.L.; Tripathi, R.S. Tree regeneration in a disturbed sub-tropical wet hill forest of north-east India: Effect of stump diameter and height on sprouting of Four tree species. For. Ecol. Manag. 1986, 17, 199–209. [Google Scholar] [CrossRef]
  21. Soepadmo, E. Fagaceae. ‘Flora Malesiana Vol. 7’. Ser. 1.; van Steenis, C.G.G.J., Ed.; Wolters-Noordhoff Publisher: Groningen, The Netherlands, 1972; Volume 7, pp. 265–403. [Google Scholar]
  22. Van Benthem, F.; Clarke, G.C.S.; Punt, W. Fagaceae. Rev. Palaeobot. Palynol. 1984, 42, 87–110. [Google Scholar] [CrossRef]
  23. Manos, P.S.; Stanford, A.M. The Historical Biogeography of Fagaceae: Tracking the Tertiary History of Temperate and Subtropical Forests of the Northern Hemisphere. Int. J. Plant Sci. 2001, 162, S77–S93. [Google Scholar] [CrossRef]
  24. Kremer, A.; Abbott, A.G.; Carlson, J.E.; Manos, P.S.; Plomion, C.; Sisco, P.; Staton, M.E.; Ueno, S.; Vendramin, G.G. Genomics of Fagaceae. Tree Genet. Genomes 2012, 8, 583–610. [Google Scholar] [CrossRef] [Green Version]
  25. Aoki, K.; Ueno, S.; Kamijo, T.; Setoguchi, H.; Murakami, N.; Kato, M.; Tsumura, Y. Genetic Differentiation and Genetic Diversity of Castanopsis (Fagaceae), the Dominant Tree Species in Japanese Broadleaved Evergreen Forests, Revealed by Analysis of EST-Associated Microsatellites. PLoS One 2014, 9, e87429. [Google Scholar] [CrossRef] [PubMed] [Green Version]
  26. Cannon, C.H.; Brendel, O.; Deng, M.; Hipp, A.L.; Kremer, A.; Kua, C.-S.; Plomion, C.; Romero-Severson, J.; Sork, V.L. Gaining a global perspective on Fagaceae genomic diversification and adaptation. New Phytol. 2018, 218, 894–897. [Google Scholar] [CrossRef] [Green Version]
  27. Johnson, W.C.; Webb, T. The Role of Blue Jays (Cyanocitta cristata L.) in the Postglacial Dispersal of Fagaceous Trees in Eastern North America. J. Biogeogr. 1989, 16, 561. [Google Scholar] [CrossRef]
  28. Cavender-Bares, J. Diversity, distribution and ecosystem services of the North American oaks. Int. Oaks 2016, 27, 37–48. [Google Scholar]
  29. Kappelle, M. Neotropical Montane Oak Forests: Overview and Outlook. In Ecology and Conservation of Neotropical Montane Oak Forests; Springer: Berlin/Heidelberg, Germany, 2004; Volume 185, pp. 449–467. [Google Scholar]
  30. Li, Q.; Ma, K. Factors affecting establishment of Quercus liaotungensis Koidz. under mature mixed oak forest overstory and in shrubland. For. Ecol. Manage. 2003, 176, 133–146. [Google Scholar] [CrossRef]
  31. Pulido, F.J.; Díaz, M. Regeneration of a Mediterranean oak: A whole-cycle approach. Écoscience 2005, 12, 92–102. [Google Scholar] [CrossRef]
  32. Johnson, P.S.; Shifley, S.R.; Rogers, R.; Dey, D.C.; Kabrick, J.M. The Ecology and Silviculture of Oaks; Cabi: London, UK, 2019; ISBN 1780647085. [Google Scholar]
  33. Singh, S.P.; Rawat, Y.S.; Garkoti, S.C. Failure of brown oak (Quercus semecarpifolia) to regenerate in central Himalaya: A case of environmental semisurprise. Curr. Sci. 1997, 73, 371–374. [Google Scholar]
  34. Singh, B.; Singh, B. Fagaceae contribution to floral wealth of Himalaya: Checklist on diversity and distribution in North-eastern states of India. Curr. Life Sci. 2016, 2, 72–78. [Google Scholar]
  35. Troup, R.S. The Silviculture of Indian Trees; Oxford at the Clarendon Press: Oxford, UK, 1921; Volume III. [Google Scholar]
  36. Stephenson, S.L.; Saxena, A.K. A Comparative Study of Oak-Dominated Forests in the Mid-Appalachians of the Eastern United States and the Kumaun Himalaya of Northern India. Bull. Torrey Bot. Club 1994, 121, 369. [Google Scholar] [CrossRef]
  37. Rao, P.; Barik, S.K.; Pandey, H.N.; Tripathi, R.S. Community Composition and Tree Population Structure in a Sub-Tropical Broad-Leaved Forest along a Disturbance Gradient. Vegetatio 1990, 88, 151–162. [Google Scholar] [CrossRef]
  38. Jamir, S.A.; Pandey, H.N. Vascular plant diversity in the sacred groves of Jaintia Hills in northeast India. Biodivers. Conserv. 2003, 12, 1497–1510. [Google Scholar] [CrossRef]
  39. Mishra, B.P.; Tripathi, O.P.; Laloo, R.C. Community characteristics of a climax subtropical humid forest of Meghalaya and population structure of ten important tree species. Trop. Ecol. 2005, 46, 241–251. [Google Scholar]
  40. Tripathi, O.P.; Tripathi, R.S. Community composition, structure and management of subtropical vegetation of forests in Meghalaya State, northeast India. Int. J. Biodivers. Sci. Ecosyst. Serv. Manag. 2010, 6, 157–163. [Google Scholar] [CrossRef] [Green Version]
  41. Upadhaya, K. Structure and Floristic Composition of Subtropical Broad-Leaved Humid Forest of Cherapunjee in Meghalaya, Northeast India. J. Biodivers. Manag. For. 2015, 4, 1–8. [Google Scholar] [CrossRef]
  42. Khan, M.L.; Rai, J.P.N.; Tripathi, R.S. Regeneration and survival of tree seedlings and sprouts in tropical deciduous and sub-tropical forests of Meghalaya, India. For. Ecol. Manag. 1986, 14, 293–304. [Google Scholar] [CrossRef]
  43. Barik, S.K.; Pandey, H.N.; Tripathi, R.S.; Rao, P. Microenvironmental Variability and Species-Diversity in Treefall Gaps in a Subtropical Broadleaved Forest. Vegetatio 1992, 103, 31–40. [Google Scholar]
  44. Barik, S.K.; Tripathi, R.S.; Pandey, H.N.; Rao, P. Tree Regeneration in a Subtropical Humid Forest: Effect of Cultural Disturbance on Seed Production, Dispersal and Germination. J. Appl. Ecol. 1996, 33, 1551–1560. [Google Scholar] [CrossRef]
  45. Maithani, K.; Tripathi, R.S.; Arunachalam, A.; Pandey, H.N. Seasonal dynamics of microbial biomass C, N and P during regrowth of a disturbed subtropical humid forest in north-east India. Appl. Soil Ecol. 1996, 4, 73–80. [Google Scholar] [CrossRef]
  46. Mylliemngap, W.; Nath, D.; Barik, S.K. Changes in vegetation and nitrogen mineralization during recovery of a montane subtropical broadleaved forest in North-eastern India following anthropogenic disturbance. Ecol. Res. 2016, 31, 21–38. [Google Scholar] [CrossRef]
  47. Maithani, K.; Arunachalam, A.; Tripathi, R.S.; Pandey, H.N. Influence of leaf litter quality on N mineralization in soils of subtropical humid forest regrowths. Biol. Fertil. Soils 1998, 27, 44–50. [Google Scholar] [CrossRef] [Green Version]
  48. Arunachalam, A.; Arunachalam, K.; Pandey, H.N.; Tripathi, R.S. Fine litterfall and nutrient dynamics during forest regrowth in the humid subtropics of north-eastern India. For. Ecol. Manage. 1998, 110, 209–219. [Google Scholar] [CrossRef]
  49. Sarma, K.; Kushwaha, S.P.S.; Singh, K.J. Impact of coal mining on plant diversity and tree population structure in Jaintia Hills district of Meghalaya, North East India. New York Sci. J. 2010, 3, 79–85. [Google Scholar]
  50. Forest Survey of India. India State of Forest Report; Forest Survey of India: Dehradun, India, 2009. [Google Scholar]
  51. Forest Survey of India. India State of Forest Report; Forest Survey of India: Dehradun, India, 2017. [Google Scholar]
  52. Shankar, U.; Boral, L.; Pandey, H.N.; Tripathi, R.S. Degradation of land due to coal mining and its natural recovery pattern. Curr. Sci. 1993, 65, 680–687. [Google Scholar]
  53. Pao, N.T.; Upadhaya, K. Effect of fragmentation and anthropogenic disturbances on floristic composition and structure of subtropical broad leaved humid forest in Meghalaya, Northeast India. Appl. Ecol. Environ. Res. 2017, 15, 385–407. [Google Scholar] [CrossRef]
  54. Poffenberger, M. Land Tenure and Forest Carbon Management in India: A Khasi Approach to REDD+ Project Development. In Local responses to global issues; International Union of Forest Research Organizations (IUFRO): Vienna, Austria, 2014; pp. 229–240. [Google Scholar]
  55. Forest Survey of India. India State of Forest Report; Forest Survey of India: Dehradun, India, 2019. [Google Scholar]
  56. Sarma, K. Land ownership, administration and status of forests of Khasi Hills Autonomous District Council of Meghalaya. NeBIO 2010, 1, 8–13. [Google Scholar]
  57. Chandramouli, C.; General, R. Census of India; Government of India: New Delhi, India, 2011.
  58. Myers, N.; Mittermeier, R.A.; Mittermeier, C.G.; Da Fonseca, G.A.; Kent, J. Biodiversity hotspots for conservation priorities. Nature 2002, 403, 853–858. [Google Scholar] [CrossRef]
  59. Balakrishnan, N.P. Flora of Jowai and vicinity, Meghalaya; Botanical Survey of India: Howrah, India, 1981; Volume I.
  60. Balakrishnan, N.P. Flora of Jowai and vicinity, Meghalaya; Botanical Survey of India: Howrah, India, 1983; Volume II.
  61. Haridasan, K.; Rao, R.R. Forest Flora of Meghalaya; Bishen Singh and Mahendrapal Singh: Dehradun, India, 1985; Volume I. [Google Scholar]
  62. Haridasan, K.; Rao, R.R. Forest Flora of Meghalaya; Bishen Singh Mahendra Pal Singh: Dehra Dun, India, 1985; Volume II. [Google Scholar]
  63. Cordonnier, T.; Kunstler, G. The Gini index brings asymmetric competition to light. Perspect. Plant Ecol. Evol. Syst. 2015, 17, 107–115. [Google Scholar] [CrossRef]
  64. Allen, S.E.; Grimshaw, H.M.; Parkinson, J.A.; Quarmby, C. Chemical Analysis of Ecological Materials; Blackwell Scientific Publications: Oxford, UK, 1974; ISBN 0632003219. [Google Scholar]
  65. Misra, R.; Misra, R. Ecology Workbook; Oxford and IBH Publishing Co.: Calcutta, India, 1968. [Google Scholar]
  66. Muller-Dombois, D.; Ellenberg, H. Measuring Species Quantites. In Aims and Methods of Vegetation Ecology; John Wiley and Sons: New York, NY, USA, 1974; pp. 67–92. [Google Scholar]
  67. Lei, P.; Scherer-Lorenzen, M.; Bauhus, J. The effect of tree species diversity on fine-root production in a young temperate forest. Oecologia 2012, 169, 1105–1115. [Google Scholar] [CrossRef]
  68. Simpson, E.H. Measurement of Diversity. Nature 1949, 163, 688. [Google Scholar] [CrossRef]
  69. Pielou, E.C. The measurement of diversity in different types of biological collections. J. Theor. Biol. 1966, 13, 131–144. [Google Scholar] [CrossRef]
  70. Gini, C. Variabilità e mutabilità. Reprinted in E. Pizetti & T. Salvemini. Mem. Metodol. Stat. 1912. [Google Scholar] [CrossRef] [Green Version]
  71. Lexerød, N.L.; Eid, T. An evaluation of different diameter diversity indices based on criteria related to forest management planning. For. Ecol. Manage. 2006, 222, 17–28. [Google Scholar] [CrossRef]
  72. Shankar, U. A case of high tree diversity in a sal (Shorea robusta) -dominated lowland forest of Eastern Himalaya: Floristic composition, regeneration and conservation. Curr. Sci. 2001, 81, 776–786. [Google Scholar]
  73. Saha, S.; Kuehne, C.; Bauhus, J. Intra- and interspecific competition differently influence growth and stem quality of young oaks (Quercus robur L. and Quercus petraea (Mattuschka) Liebl.). Ann. For. Sci. 2014, 71, 381–393. [Google Scholar] [CrossRef] [Green Version]
  74. Chakraborty, T.; Saha, S.; Matzarakis, A.; Reif, A. Influence of multiple biotic and abiotic factors on the crown die-back of European beech trees at their drought limit. Flora 2017, 229, 58–70. [Google Scholar] [CrossRef]
  75. Hammer, Ø.; Harper, D.A.T.; Ryan, P.D. PAST: Paleontological statistics software package for education and data analysis. Palaeontol. Electron. 2001, 4, 9. [Google Scholar]
  76. Echeverría, C.; Newton, A.C.; Lara, A.; Benayas, J.M.R.; Coomes, D.A. Impacts of forest fragmentation on species composition and forest structure in the temperate landscape of southern Chile. Glob. Ecol. Biogeogr. 2007, 16, 426–439. [Google Scholar] [CrossRef] [Green Version]
  77. MacArthur, R.H.; Wilson, E.O. The Theory of Island Biogeography; Princeton University Press: Princeton, NJ, USA, 1967. [Google Scholar]
  78. Tabarelli, M.; Cardoso da Silva, J.M.; Gascon, C. Forest fragmentation, synergisms and the impoverishment of neotropical forests. Biodivers. Conserv. 2004, 13, 1419–1425. [Google Scholar] [CrossRef]
  79. Mittermeier, R.A.; van Dijk, P.P.; Rhodin, A.G.J.; Nash, S.D. Turtle Hotspots: An Analysis of the Occurrence of Tortoises and Freshwater Turtles in Biodiversity Hotspots, High-Biodiversity Wilderness Areas, and Turtle Priority Areas. Chelonian Conserv. Biol. 2015, 14, 2–10. [Google Scholar] [CrossRef]
  80. Li, X.-S.; Liu, W.-Y.; Chen, J.-W.; Tang, C.Q.; Yuan, C.-M. Regeneration pattern of primary forest species across forest-field gradients in the subtropical Mountains of Southwestern China. J. Plant Res. 2010, 123, 751–762. [Google Scholar] [CrossRef] [PubMed]
  81. Upadhaya, K.; Pandey, H.N.; Law, P.S.; Tripathi, R.S. Tree diversity in sacred groves of the Jaintia hills in Meghalaya, northeast India. Biodivers. Conserv. 2003, 12, 583–597. [Google Scholar] [CrossRef]
  82. Shaw, T.E. Species diversity in restoration plantings: Important factors for increasing the diversity of threatened tree species in the restoration of the Araucaria forest ecosystem. Plant Divers. 2019, 41, 84–93. [Google Scholar] [CrossRef]
  83. Lu, Y.; Ranjitkar, S.; Harrison, R.D.; Xu, J.; Ou, X.; Ma, X.; He, J. Selection of Native Tree Species for Subtropical Forest Restoration in Southwest China. PLoS ONE 2017, 12, e0170418. [Google Scholar] [CrossRef] [Green Version]
  84. Aldrich, P.R.; Parker, G.R.; Romero-severson, J.; Michler, C.H. Confirmation of Oak Recruitment Failure in Indiana Old-Growth Forest: 75 Years of Data. For. Sci. 2005, 51, 406–416. [Google Scholar]
  85. Watt, A.A.S. On the Causes of Failure of Natural Regeneration in British Oakwoods. J. Ecol. 1919, 7, 173–203. [Google Scholar] [CrossRef]
  86. Li, Y.; Lo, Y.; Lin, Y.; Guan, B.; Blanco, J.; You, C. Bringing the Natives Back: Identifying and Alleviating Establishment Limitations of Native Hardwood Species in a Conifer Plantation. Forests 2018, 9, 3. [Google Scholar] [CrossRef] [Green Version]
  87. Loewenstein, E.F.; Johnson, P.S.; Garrett, H.E. Age and diameter structure of a managed uneven-aged oak forest. Can. J. For. Res. 2011, 30, 1060–1070. [Google Scholar] [CrossRef]
  88. Manjaribe, C.; Frasier, C.L.; Rakouth, B.; Louis, E.E. Ecological Restoration and Reforestation of Fragmented Forests in Kianjavato, Madagascar. Int. J. Ecol. 2013, 2013, 1–12. [Google Scholar] [CrossRef]
  89. Kang, H.; Zheng, Y.; Liu, S.; Chai, Z.; Chang, M.; Hu, Y.; Li, G.; Wang, D. Population structure and spatial pattern of predominant tree species in a pine–oak mosaic mixed forest in the Qinling Mountains, China. J. Plant Interact. 2017, 12, 78–86. [Google Scholar] [CrossRef] [Green Version]
  90. Fashing, P.J.; Forrestel, A.; Scully, C.; Cords, M. Long-term tree population dynamics and their implications for the conservation of the Kakamega Forest, Kenya. Biodivers. Conserv. 2004, 13, 753–771. [Google Scholar] [CrossRef]
  91. Rawat, Y.S.; Singh, J.S. Structure and Function of Oak Forests in Central Himalaya. I. Dry Matter Dynamics. Ann. Bot. 1988, 62, 397–411. [Google Scholar] [CrossRef]
  92. Singh, S.; Singh, J. Structure and function of the Central Himalayan oak forests. Proc. Plant Sci. 1986, 96, 159–189. [Google Scholar]
  93. Bellingham, A.P.J.; Tanner, E.V.J.; Healey, J.R. Sprouting of Trees in Jamaican Montane Forests, after a Hurricane. J. Ecol. 2009, 82, 747–758. [Google Scholar] [CrossRef]
  94. Sagar, R.; Singh, J.S. Tree density, basal area and species diversity in a disturbed dry tropical forest of northern India: implications for conservation. Environ. Conserv. 2006, 33, 256–262. [Google Scholar] [CrossRef]
  95. Enquist, B.J.; West, G.B.; Charnov, E.L.; Brown, J.H. Allometric scaling of production and life-history variation in vascular plants. Nature 1999, 401, 907–911. [Google Scholar] [CrossRef]
  96. Keren, S.; Medarević, M.; Obradović, S.; Zlokapa, B. Five Decades of Structural and Compositional Changes in Managed and Unmanaged Montane Stands: A Case Study from South-East Europe. Forests 2018, 9, 479. [Google Scholar] [CrossRef] [Green Version]
  97. Benton, A.H.; Werner, W.E. Field Biology and Ecology; McGraw-Hill: New York, NY, USA, 1974. [Google Scholar]
  98. Vlam, M.; van der Sleen, P.; Groenendijk, P.; Zuidema, P.A. Tree Age Distributions Reveal Large-Scale Disturbance-Recovery Cycles in Three Tropical Forests. Front. Plant Sci. 2017, 7, 1–12. [Google Scholar] [CrossRef] [Green Version]
  99. Odum, E.P.; Barrett, G.W. Fundamentals of Ecology; Saunders Philadelphia: Philadelphia, PA, USA, 1971; Volume 3. [Google Scholar]
  100. Singh, S.P.; Tewari, J.C.; Yadav, S.; Ralhan, P.K. Population structure of tree species in forests as an indicator of regeneration and future stability. Proc. Plant Sci. 1986, 96, 443–455. [Google Scholar]
  101. Manral, V.; Padalia, K.; Karki, H. Plant diversity and regeneration potential of three different forests of Central Himalaya. Curr. World Environ. 2018, 13, 113–123. [Google Scholar] [CrossRef]
  102. Lundqvist, L.; Nilson, K. Regeneration dynamics in an uneven-aged virgin Norway spruce forest in northern Sweden. Scand. J. For. Res. 2007, 22, 304–309. [Google Scholar] [CrossRef]
  103. Singh, S.; Malik, Z.A.; Sharma, C.M. Tree species richness, diversity, and regeneration status in different oak (Quercus spp.) dominated forests of Garhwal Himalaya, India. J. Asia-Pacific Biodivers. 2016, 9, 293–300. [Google Scholar] [CrossRef] [Green Version]
  104. Murali, K.S.; Shankar, U.; Shaanker, R.U.; Ganeshaiah, K.N.; Bawa, K.S. Extraction of non-timber forest products in the forests of Biligiri Rangan Hills, India. 2. Impact of NTFP extraction on regeneration, population structure, and species composition. Econ. Bot. 1996, 50, 252–269. [Google Scholar] [CrossRef]
  105. Götmark, F.; Berglund, Å.; Wiklander, K. Browsing damage on broadleaved trees in semi-natural temperate forest in Sweden, with a focus on oak regeneration. Scand. J. For. Res. 2005, 20, 223–234. [Google Scholar] [CrossRef]
  106. Weigel, D.R.; Peng, C.-Y.J. Predicting stump sprouting and competitive success of five oak species in southern Indiana. Can. J. For. Res. 2002, 32, 703–712. [Google Scholar] [CrossRef]
  107. Retana, J.; Riba, M.; Castell, C.; Espelta, J.M. Regeneration by Sprouting of Holm-Oak ( Quercus ilex ) Stands Exploited by Selection Thinning. Vegetatio 1992, 99, 355–364. [Google Scholar] [CrossRef]
  108. Keyser, T.L.; Zarnoch, S.J. Stump sprout dynamics in response to reductions in stand density for nine upland hardwood species in the southern Appalachian Mountains. For. Ecol. Manag. 2014, 319, 29–35. [Google Scholar] [CrossRef]
  109. Negreros-Castillo, P.; Hall, R.B. Sprouting capability of 17 tropical tree species after overstory removal in Quintana Roo, Mexico. For. Ecol. Manag. 2000, 126, 399–403. [Google Scholar] [CrossRef]
  110. Oliver, C.D. Forest development in North America following majir disturbances. Forest Ecology and Management. For. Ecol. Manag. 1981, 3, 153–168. [Google Scholar] [CrossRef]
  111. White, P.S. Pattern, process, and natural disturbance in vegetation. Bot. Rev. 1979, 45, 229–299. [Google Scholar] [CrossRef]
  112. Tiwari, O.P.; Rana, Y.S.; Krishan, R.; Sharma, C.M.; Bhandari, B.S. Regeneration dynamics, population structure, and forest composition in some ridge forests of the Western Himalaya, India. Forest Sci. Technol. 2018, 14, 66–75. [Google Scholar] [CrossRef] [Green Version]
Figure 1. Degraded and fragmented forests, as shown above, are common in Meghalaya, except protected areas (national parks and wildlife sanctuaries which are owned by the state) and sacred groves owned by the tribal communities. Nearly 93% of forests in Meghalaya are degraded and fragmented, which are mostly owned by private owners or by the tribal communities. The photographs are from study sites Laitryngew (a) and Weiloi (b) in 2016. In total, we covered six sites in this study.
Forests 11 01008 g001
Figure 2. Location of the six study sites in Khasi-Jaintia Hills district of Meghalaya (E1Jar = Jarain, E1LaitS = Laitkynsew, E2Pyn = Pynursla, E2Wei = Weiloi, E3LaiG = Laitryngew, E3Shi = Upper Shillong).
Forests 11 01008 g002
Figure 3. (a) Basal area distribution by families in the six forest stands, and (b) the population structure of Fagaceae and Non-Fagaceae.
Forests 11 01008 g003
Figure 4. Diameter class vs. average Basal area of Fagaceae and Non-Fagaceae tree species from six forest stands.
Forests 11 01008 g004
Figure 5. Regeneration potential of Fagaceae in six sites (a), site-wise population structure of Fagaceae (b).
Forests 11 01008 g005
Figure 6. Proportion of stems (coppice/sprouts) from a tree vs. damage information (sign of cutting, broken stem, dying tree, and pathogen attack) due to natural and anthropogenic disturbance.
Forests 11 01008 g006
Figure 7. The relations between observed and predicted frequency values from generalized linear model (GLM) analyses (Table 7) for seedlings (a), small saplings (b), large saplings (c), pole-sized trees (d), and large trees (e).
Forests 11 01008 g007
Table 1. Description of six study sites located in Khasi-Jaintia hills divided into three elevational zones. The approximate size of the fragmented stand was measured (in ha) from the Google Earth images.
SiteLaitkynsewJarainPynurslaWeiloiLaitryngewUpper Shillong
Elevation range (meters above sea level (m.a.s.l.)800–12001200–16001600–2000
Elevation (m.a.s.l.)90311321368159516361873
Stand Size (ha)7.82.415.717.611.760.4
Latitude (N)25°13.16′25°18.55′25°18.26′25°21.32′25°19.94′25°32.35′
Longitude (E)91°40.27′92°7.88′91°54.1′91°36.53′91°43.89′91°51.18′
Distance from the nearest village (km)0.831.260.470.590.511.07
Table 2. Tree Community characteristic of Fagaceae forests in the study locations.
ParameterLaitkynsewJarainPynurslaWeiloiLaitryngewUpper Shillong
Elevation (m)90311321368159916361873
Species richness375139104527
Number of families23242482217
Number of genera374032103223
Tree basal area (m2 ha−1)35.320.6916.4828.6924.720.6
Tree density ha−1338524608276868478
Shannon diversity index2.492.752.720.482.461.76
Simpson dominance index0.120.100.110.810.160.26
Pielou’s Evenness index0.460.460.540.240.360.31
Bulk density (g/cm3)0.941.061.391.470.990.65
Table 3. Trees density, stem density, and basal area in three diameter classes: Pole trees (10–30 cm, middle-sized trees (30–60 cm), and mature trees (≥60 cm) for the six study sites.
Sites Trees ha−1Stems ha−1Basal Area ha−1
PoleMiddle-SizedMaturePoleMiddle-SizedMaturePoleMiddle-SizedMature
LaitkynsewFag161881618120.52.54
Non-Fag202722221476266.79.911.7
Total218
(64.5)
90
(26.6)
30
(8.9)
230 (63.5)94
(26.0)
38 (10.5)7.1 (20.2)12.5
(35.4)
15.7 (44.4)
JarainFag1704002148205.440
Non-Fag2902223202627.62.80.8
Total460
(87.8)
62
(11.8)
2
(0.4)
534 (82.9)108
(16.8)
2
(0.3)
13
(63.0)
6.8
(32.9)
0.8
(4.1)
PynurslaFag1701802365603.52.90
Non-Fag4041604821808.31.80
Total574
(94.4)
34
(5.6)
0718 (90.7)74
(9.3)
011.8 (72.6)4.7
(28.4)
0
WeiloiFag9811618148396843.915.86.5
Non-Fag30140365000.51.50.6
Total128
(46.4)
130
(47.1)
18
(6.5)
184 (25.8)446
(62.5)
84 (11.8)4.3 (15.1)17.3
(60.4)
7
(24.4)
LaitryngewFag22640042819006.94.20
Non-Fag58022070846011.91.80
Total806
(92.9)
62
(7.1)
01136 (82.8)236
(17.2)
018.8 (75.9)6
(24.1)
0
Upper ShillongFag19430222434254.20.6
Non-Fag2044802365805.35.60
Total398
(83.3)
78
(16.3)
2
(0.4)
460 (83.0)92
(16.6)
2
(0.4)
10.2 (49.7)9.8
(47.5)
0.6
(2.8)
Total Fagaceae874
(28.3)
262
(8.5)
28
(0.9)
1266 (28.5)776
(17.5)
98
(2.2)
25.2 (17.2)33.6
(22.9)
11.1
(7.6)
Total Non-Fagaceae1710 (55.3)194
(6.3)
24
(0.8)
1996 (45.0)274
(6.2)
28
(0.6)
40.3 (27.5)23.4
(16.0)
13.1
(8.9)
Total
(Fag+ Non-Fag)
2584 (83.6)456
(14.7)
52
(1.7)
3262 (73.5)1050
(23.7)
126 (2.8)65.3 (44.6)57.0
(38.9)
24.1 (16.5)
where, number in the parentheses ( ) is the percentage contribution of each size class (ha−1).
Table 4. Regeneration potential of Fagaceae species in six study sites based on tree density in developmental size classes: Seed = Seedlings < 20 cm height, Sm. Sap. = Small Saplings 20–150 cm height, L. Sap. = Large Saplings > 150 cm height but <10 cm DBH (diameter at breast height), Pole = Pole-Sized Trees 10–30 cm DBH, L. Tr. = Large Trees > 30 cm DBH.
Study Sites Species NameBasal Area
(%)
Trees ha−1Regeneration Potential
SeedSm. Sap.L. Sap.PoleL. Tr.
LaitkynsewCastanopsis indica14.72215458418Good
Castanopsis lanceifolia-24818 New
Lithocarpus dealbatus3.32446126Good
Lithocarpus elegans-44634 New
Quercus semiserrata1.767848 2Good
Relative Proportion (%)19.75.960.526.82.64.2
JarainCastanopsis purpurella1.2226 6 Good
Castanopsis tribuloides13.346120624414Good
Lithocarpus dealbatus21.210982868020Good
Lithocarpus elegans1.4 148442Poor
Quercus glauca8.421826364Good
Relative Proportion (%)45.6627.545.616.94
PynurslaCastanopsis purpurella2.38221642Good
Castanopsis tribuloides3.9 42None
Lithocarpus dealbatus26.67212222011814Good
Lithocarpus elegans5.634381442 Good
Quercus glauca0.3 2 None
Relative Proportion (%)38.915.524.834.123.22.5
WeiloiCastanopsis tribuloides- 22 New
Lithocarpus dealbatus1.426622462Good
Quercus lineata89.864342292132Fair
Relative Proportion (%)91.219.220.910.320.928.6
LaitryngewCastanopsis tribuloides3.5 182None
Lithocarpus dealbatus35.64221820617832Good
Quercus glauca0.2 44 Poor
Quercus lineata5.741844266Good
Relative Proportion (%)44.95.729.431.728.25
Upper ShillongCastanopsis tribuloides- 2 New
Lithocarpus dealbatus44.15829024019030Good
Quercus griffithii3.32121242Good
Relative Proportion (%)47.47.135.930.2233.8
Table 5. Indicators of anthropogenic disturbances in the six forest stands.
StandsDisturbance Score Class *Distance from the Nearest Village (Km)Proportion of Stumps (%)Proportion of Cut Stems (%)Gini Index
Laitkynsew10.837.081.000.59
Jarain31.2617.8418.420.44
Pynursla30.4724.0610.510.46
Weiloi30.5935.2071.280.47
Laitryngew20.5118.5932.800.40
Upper Shillong21.0732.2823.870.47
* Mild = 1, Moderate = 2, and High = 3.
Table 6. Damage information on Fagaceae and Non-Fagaceae and their sprouting ability (%) in response to the damage.
ComponentsMean
tree ha−1
(T)
Mean Stems ha−1 (S)Mean Healthy Stems ha−1Mean
Cut Stems ha−1
Mean Natural Damage Stem ha−1 Sprouts (S-T)Sprouting Percentage (S-T)/Total Sprouts X 100Sprouting Stem per Tree Ratio (S/T)
Lithocarpus dealbatus114.7176.390.7 (51.4)76.0 (43.1)9.7 (5.5)61.637.91.54
Quercus lineata42.7125.719.7 (15.7)102.3 (81.4)3.7 (2.9)83.051.12.94
Castanopsis tribuloides14.024.38.0 (32.9)16.3 (67.1)0 (0.0)10.36.31.74
Quercus glauca7.710.74.7 (43.9)4.3 (40.2)1.7 (15.9)3.01.81.39
Lithocarpus elegans8.09.79.3 (95.9)0.3 (3.1)0 (0)1.71.01.21
Castanopsis indica3.74.33.7 (86.0)0 (0)0.7 (16.3)0.60.41.16
Castanopsis purpurella2.04.34.3 (100)0 (0)0 (0)2.31.42.15
Quercus griffithii1.01.00.3 (33)0.7 (70.0)0 (0)0.00.01.00
Quercus semiserrata0.30.30.3 (100)0 (0)0 (0)0.00.01.00
Fagaceae Total194.1 (37.7)356.7 (48.2)141 (19.1)200 (27.0)15.8 (2.1)162.6 (45.6)45.61.84
Non Fagaceae Total321.3 (62.4)383 (51.8)310 (41.9)64.7 (8.7)8.3 (1.1)61.7 (16.1)16.11.20
Grand Total515.3739.7451 (61.0)264.7 (35.8)24.0 (3.2)224.430.31.44
Table 7. Influence of biotic and abiotic variables on the frequency of seedlings, small saplings, large saplings, pole-sized trees, and large trees (n = 12 plots, df = degrees of freedom, SE = standard error, Sig. = Level of significant values or p-values, * indicates the interaction terms which were built between the auto-correlated variables and used as covariates during the Generalized Linear Modelling/GLM analyses).
Target VariableIndependent VariablesParameter EstimatesSE of Parameter Estimates95% Wald Confidence Interval of SEHypothesis Test
Lower LimitUpper LimitWald Chi-SquaredfSig.
Frequency of Fagaceae seedlings per plotIntercept−0.29241.3844−3.00582.42100.044610.8327
Disturbance intensity0.54440.13420.28140.807516.455610.0000
Elevation * % of stumps * % of cut stem−0.0000010.0000002−0.0000014−0.000000413.075310.0003
Distance to nearest village0.15000.4537−0.73921.03920.109410.7409
Bulk density0.05650.4864−0.89691.00980.013510.9075
Gini index * Stem density0.05930.01760.02480.093711.352710.0008
Tree species diversity * Tree density−0.00570.0018−0.0092−0.002210.292010.0013
% of basal area of Fagaceae trees × % of cut stem0.00050.00010.00030.000816.817310.0000
Omnibus test: Likelihood Ratio Chi Square = 43.38, df = 7, p < 0.05, Akaike information criterion (AIC) value = 103.47
Frequency of Fagaceae small saplings per plotIntercept4.00180.53532.95265.051055.883610.0000
Disturbance intensity−0.08990.0651−0.21750.03761.910910.1669
Elevation * % of stumps * % of cut stem−0.00000020.0000001−0.00000040.00000011.655310.1982
Distance to nearest village0.39970.19290.02150.77784.290910.0383
Bulk density−0.25800.2303−0.70950.19341.254910.2626
Gini index * Stem density0.01880.00770.00360.03405.879210.0153
Tree species diversity * Tree density−0.00220.0009−0.0039−0.00056.122310.0133
% of basal area of Fagaceae trees * % of cut stem−0.00010.0001−0.00020.00010.426610.5137
Omnibus test: Likelihood Ratio Chi Square = 118.79, df = 7, p < 0.05, AIC value = 104.52
Frequency of Fagaceae large saplings per plotIntercept−0.90630.6198−2.12110.30842.138510.1436
Disturbance intensity0.27230.06520.14460.400017.460510.0000
Elevation * % of stumps * % of cut stem0.00000010.0000002−0.00000020.00000040.181710.6699
Distance to nearest village1.76190.17531.41822.1055100.957010.0000
Bulk density0.84620.19670.46061.231718.503610.0000
Gini index * Stem density0.04820.00940.02970.066726.029110.0000
Tree species diversity * Tree density−0.00230.0010−0.0042−0.00034.995310.0254
% of basal area of Fagaceae trees * % of cut stem−0.000210.00010−0.00040−0.000024.483710.0342
Omnibus test: Likelihood Ratio Chi Square = 253.58, df = 7, p < 0.05, AIC value = 250.88
Frequency of Fagaceae pole−sized trees per plotIntercept−3.65951.2668−6.1424−1.17668.345010.0039
Disturbance intensity0.49360.11910.26020.726917.179810.0000
Elevation * % of stumps * % of cut stem0.0000010.00000020.00000060.000001327.660110.0000
Distance to nearest village1.70980.33271.05772.361826.413110.0000
Bulk density0.47540.2948−0.10231.05322.601410.1068
Gini index * Stem density0.05580.01360.02910.082516.785310.0000
Tree species diversity * Tree density0.00050.0011−0.00170.00270.220410.6387
% of basal area of Fagaceae trees * % of cut stem−0.00030.0001−0.0005−0.00017.246610.0071
Omnibus test: Likelihood Ratio Chi Square = 126.08, df = 7, p < 0.05, AIC value = 98.14
Frequency of Fagaceae large trees per plotIntercept1.84351.5448−1.18424.87121.424110.2327
Disturbance intensity−0.26520.1896−0.63670.10641.956710.1619
Elevation * % of stumps * % of cut stem−0.00000010.0000003−0.00000070.00000040.304410.5811
Distance to nearest village0.59350.5339−0.45291.64001.235810.2663
Bulk density0.01710.5853−1.13001.16420.000910.9767
Gini index * Stem density−0.01080.0216−0.05320.03160.248710.6180
Tree species diversity * Tree density0.00190.0024−0.00280.00660.617410.4320
% of basal area of Fagaceae trees * % of cut stem0.00040.00010.00010.00078.530210.0035
Omnibus test: Likelihood Ratio Chi Square = 81.16, df = 7, p < 0.05, AIC value = 67.96

