Profiling of Widely Targeted Metabolomics for the Identification of Secondary Metabolites in Heartwood and Sapwood of the Red-Heart Chinese Fir (Cunninghamia Lanceolata)


Abstract
1. Introduction
2. Materials and Methods
2.1. Plant Materials
2.2. Extraction and Separation of Flavonoid Secondary Metabolites
2.3. Metabolite Identification and Quantification
2.4. Data Analyses
3. Results
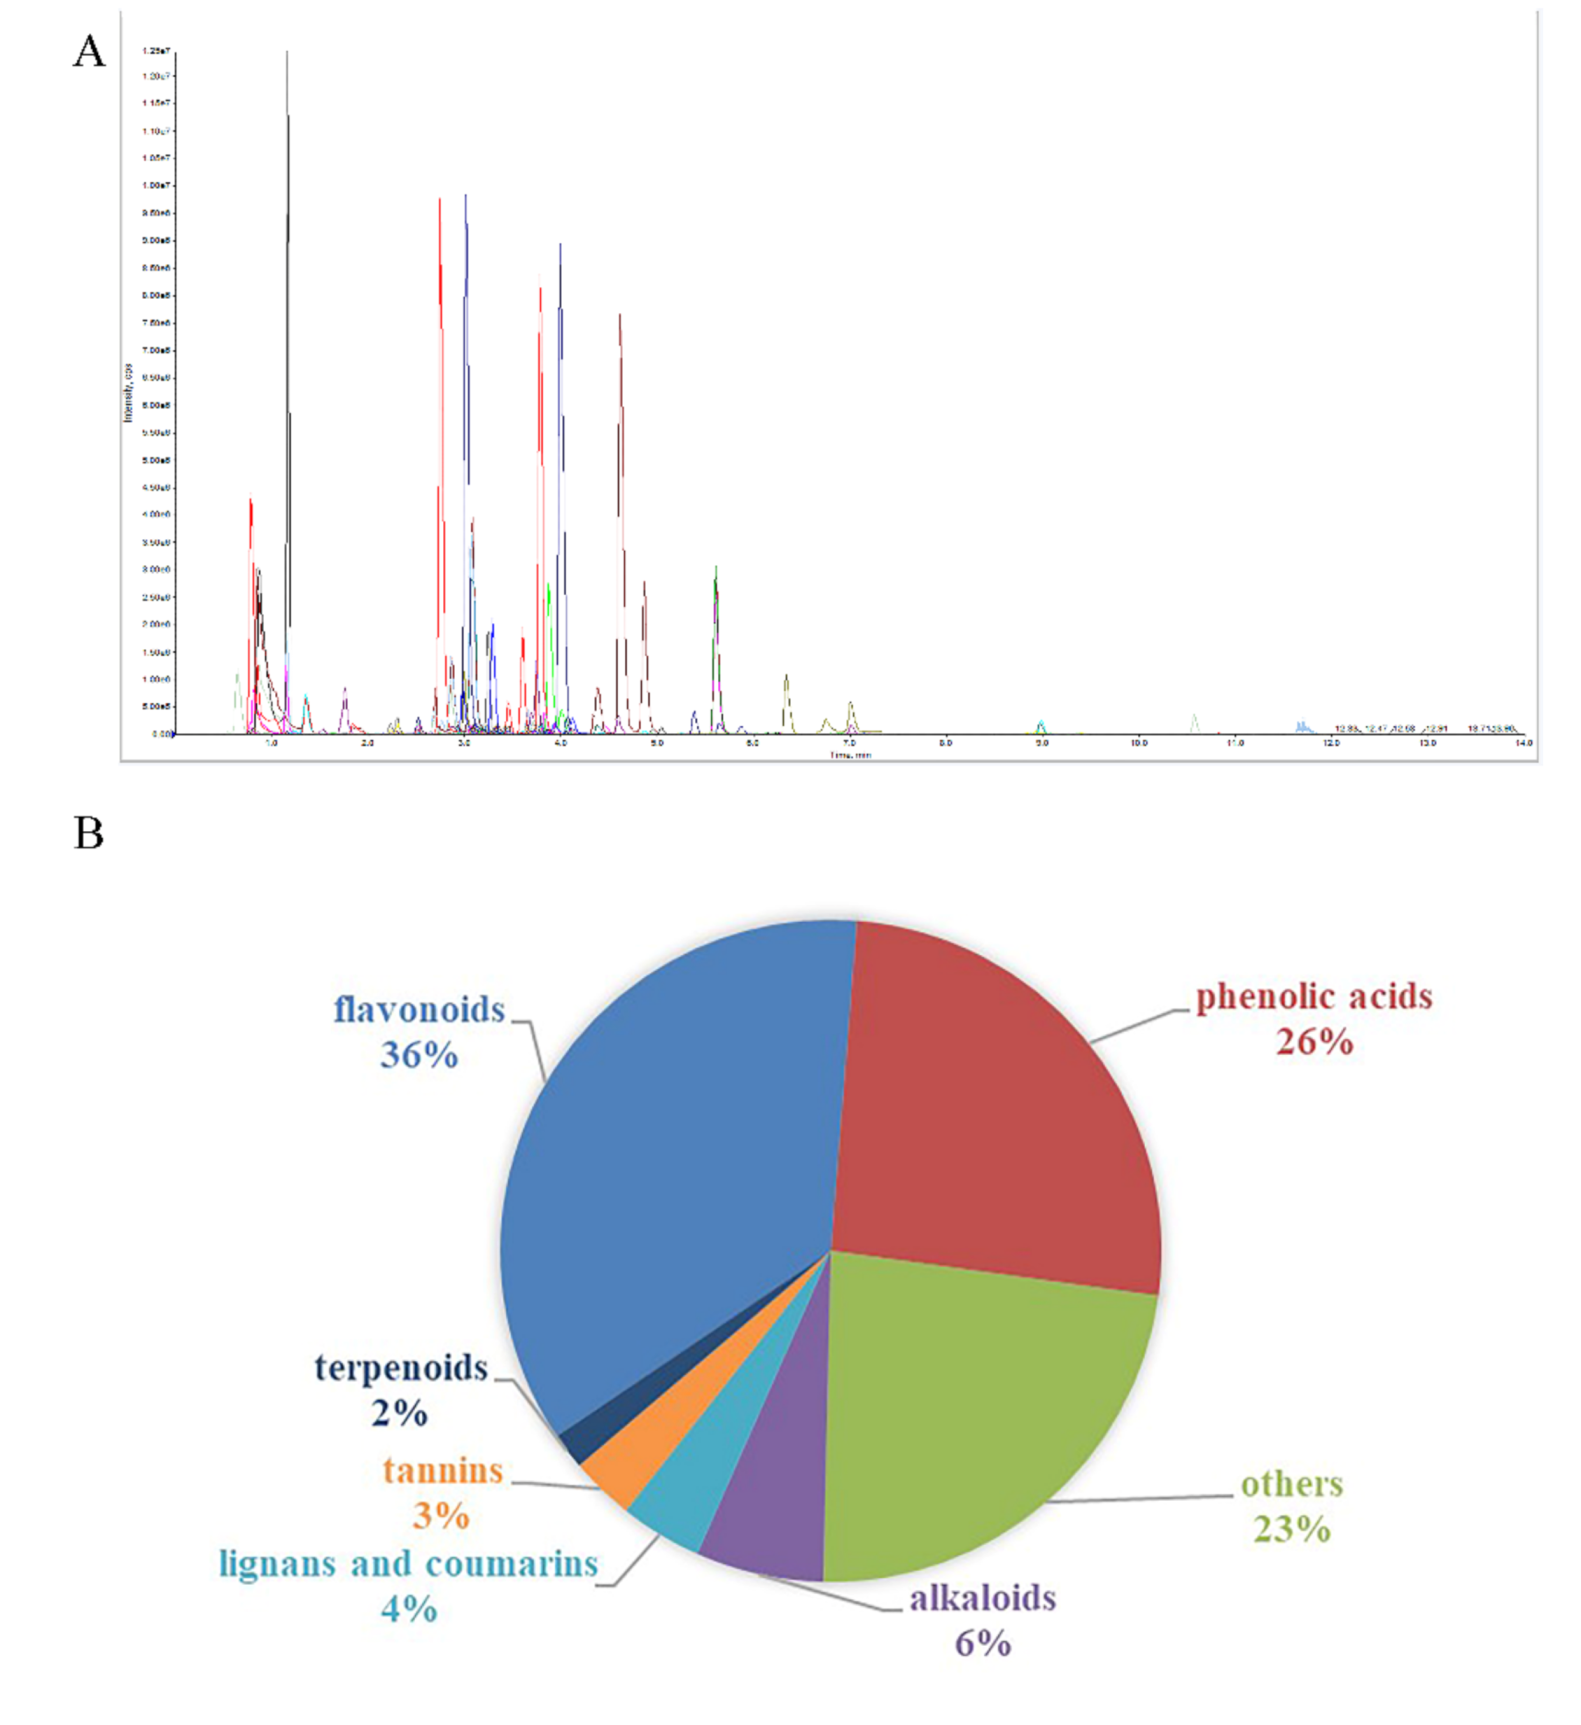
3.1. Metabolic Profiling of Heartwood and Sapwood Based on LC-MS/MS
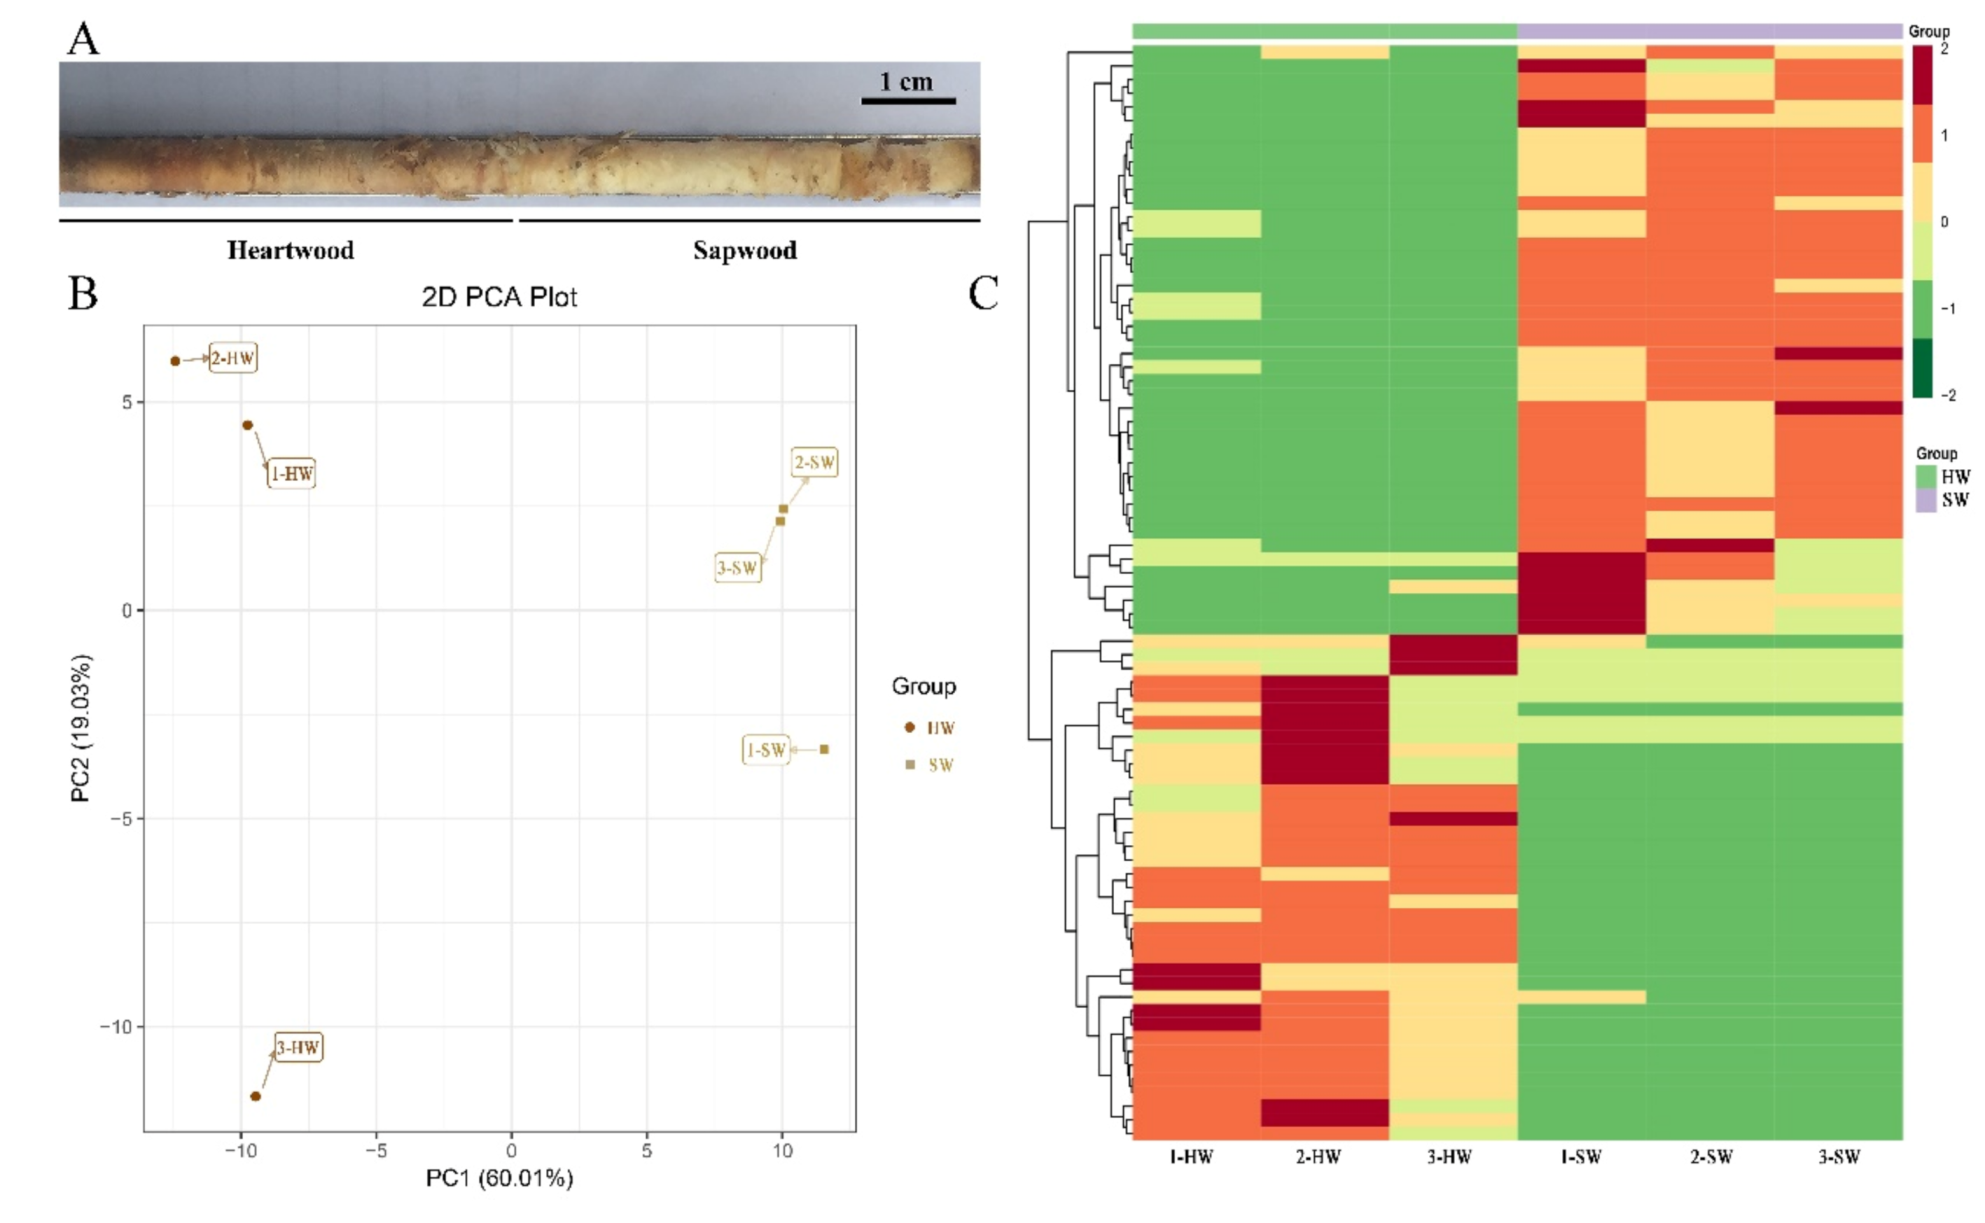
3.2. PCA
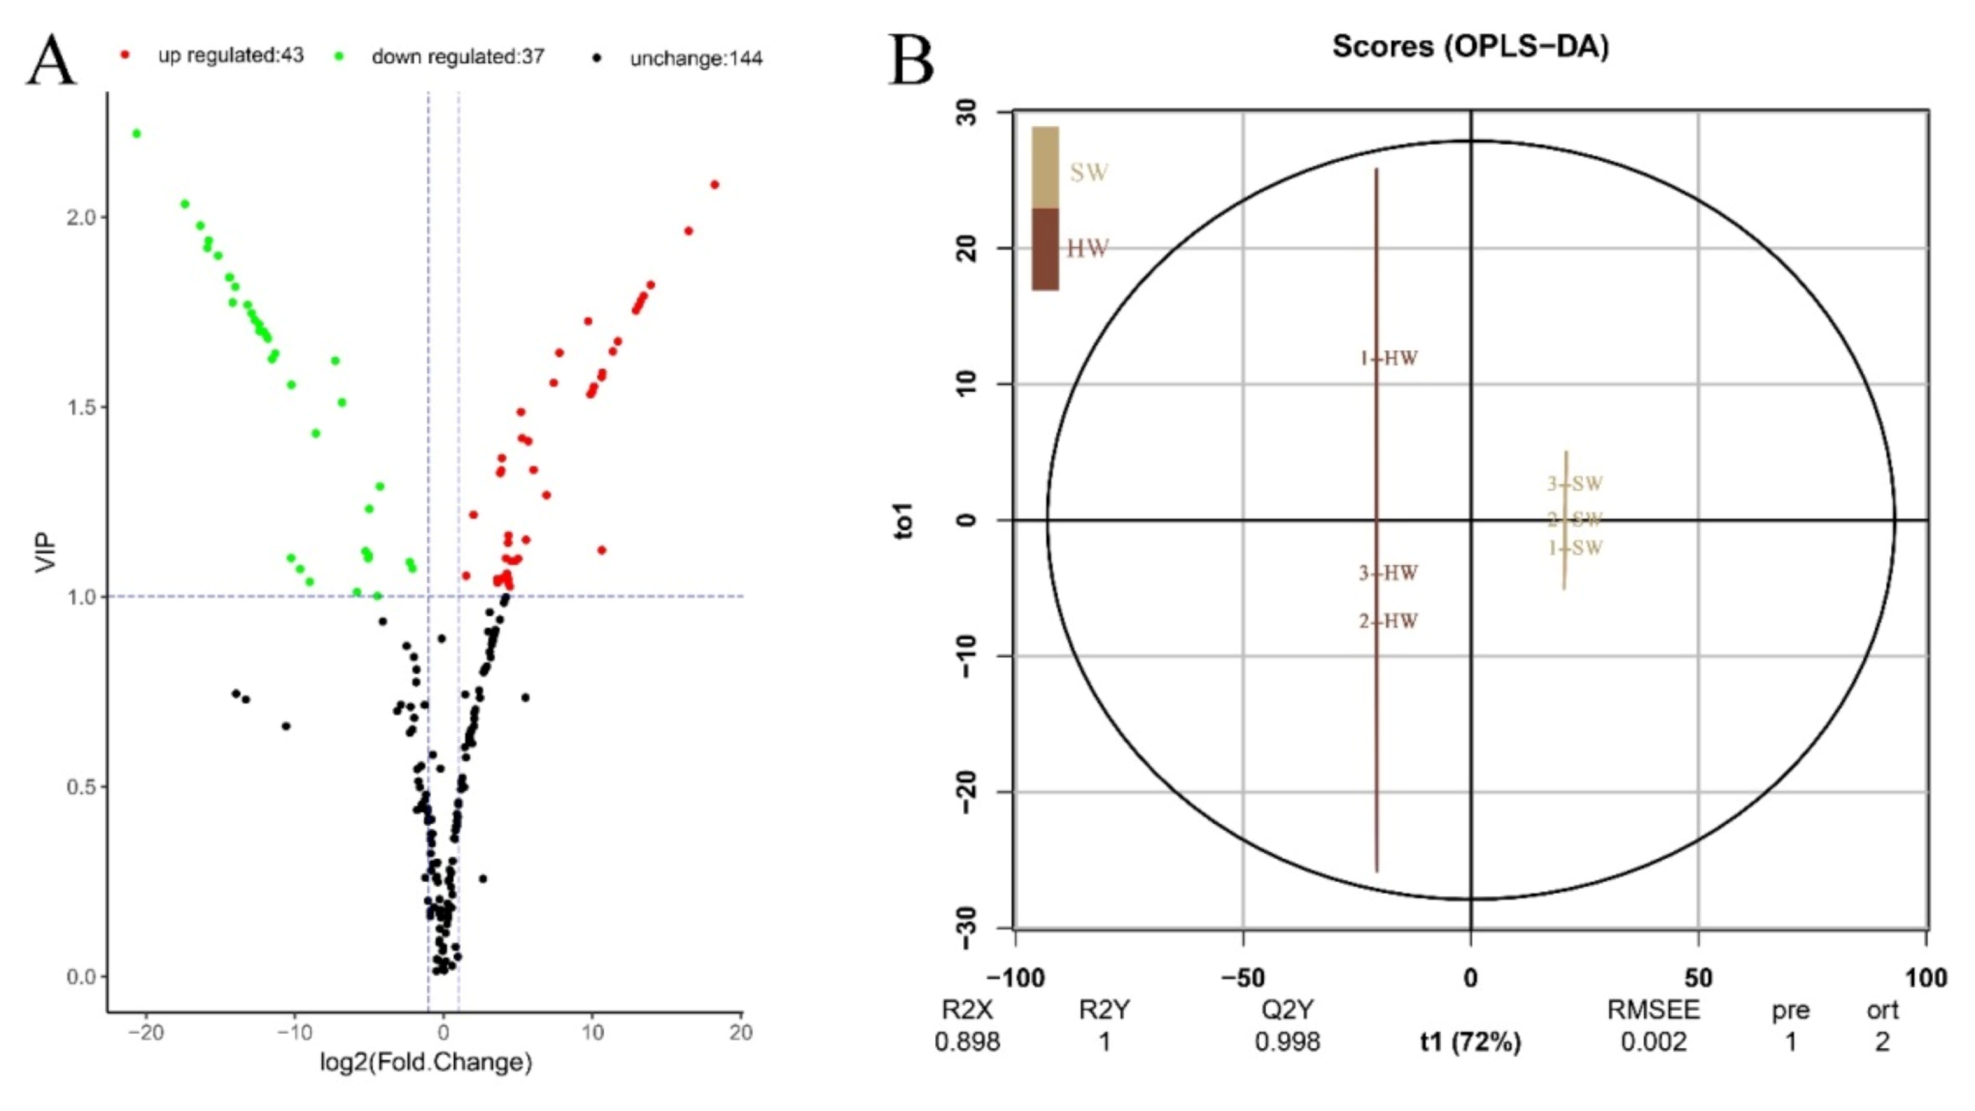
3.3. OPLS-DA
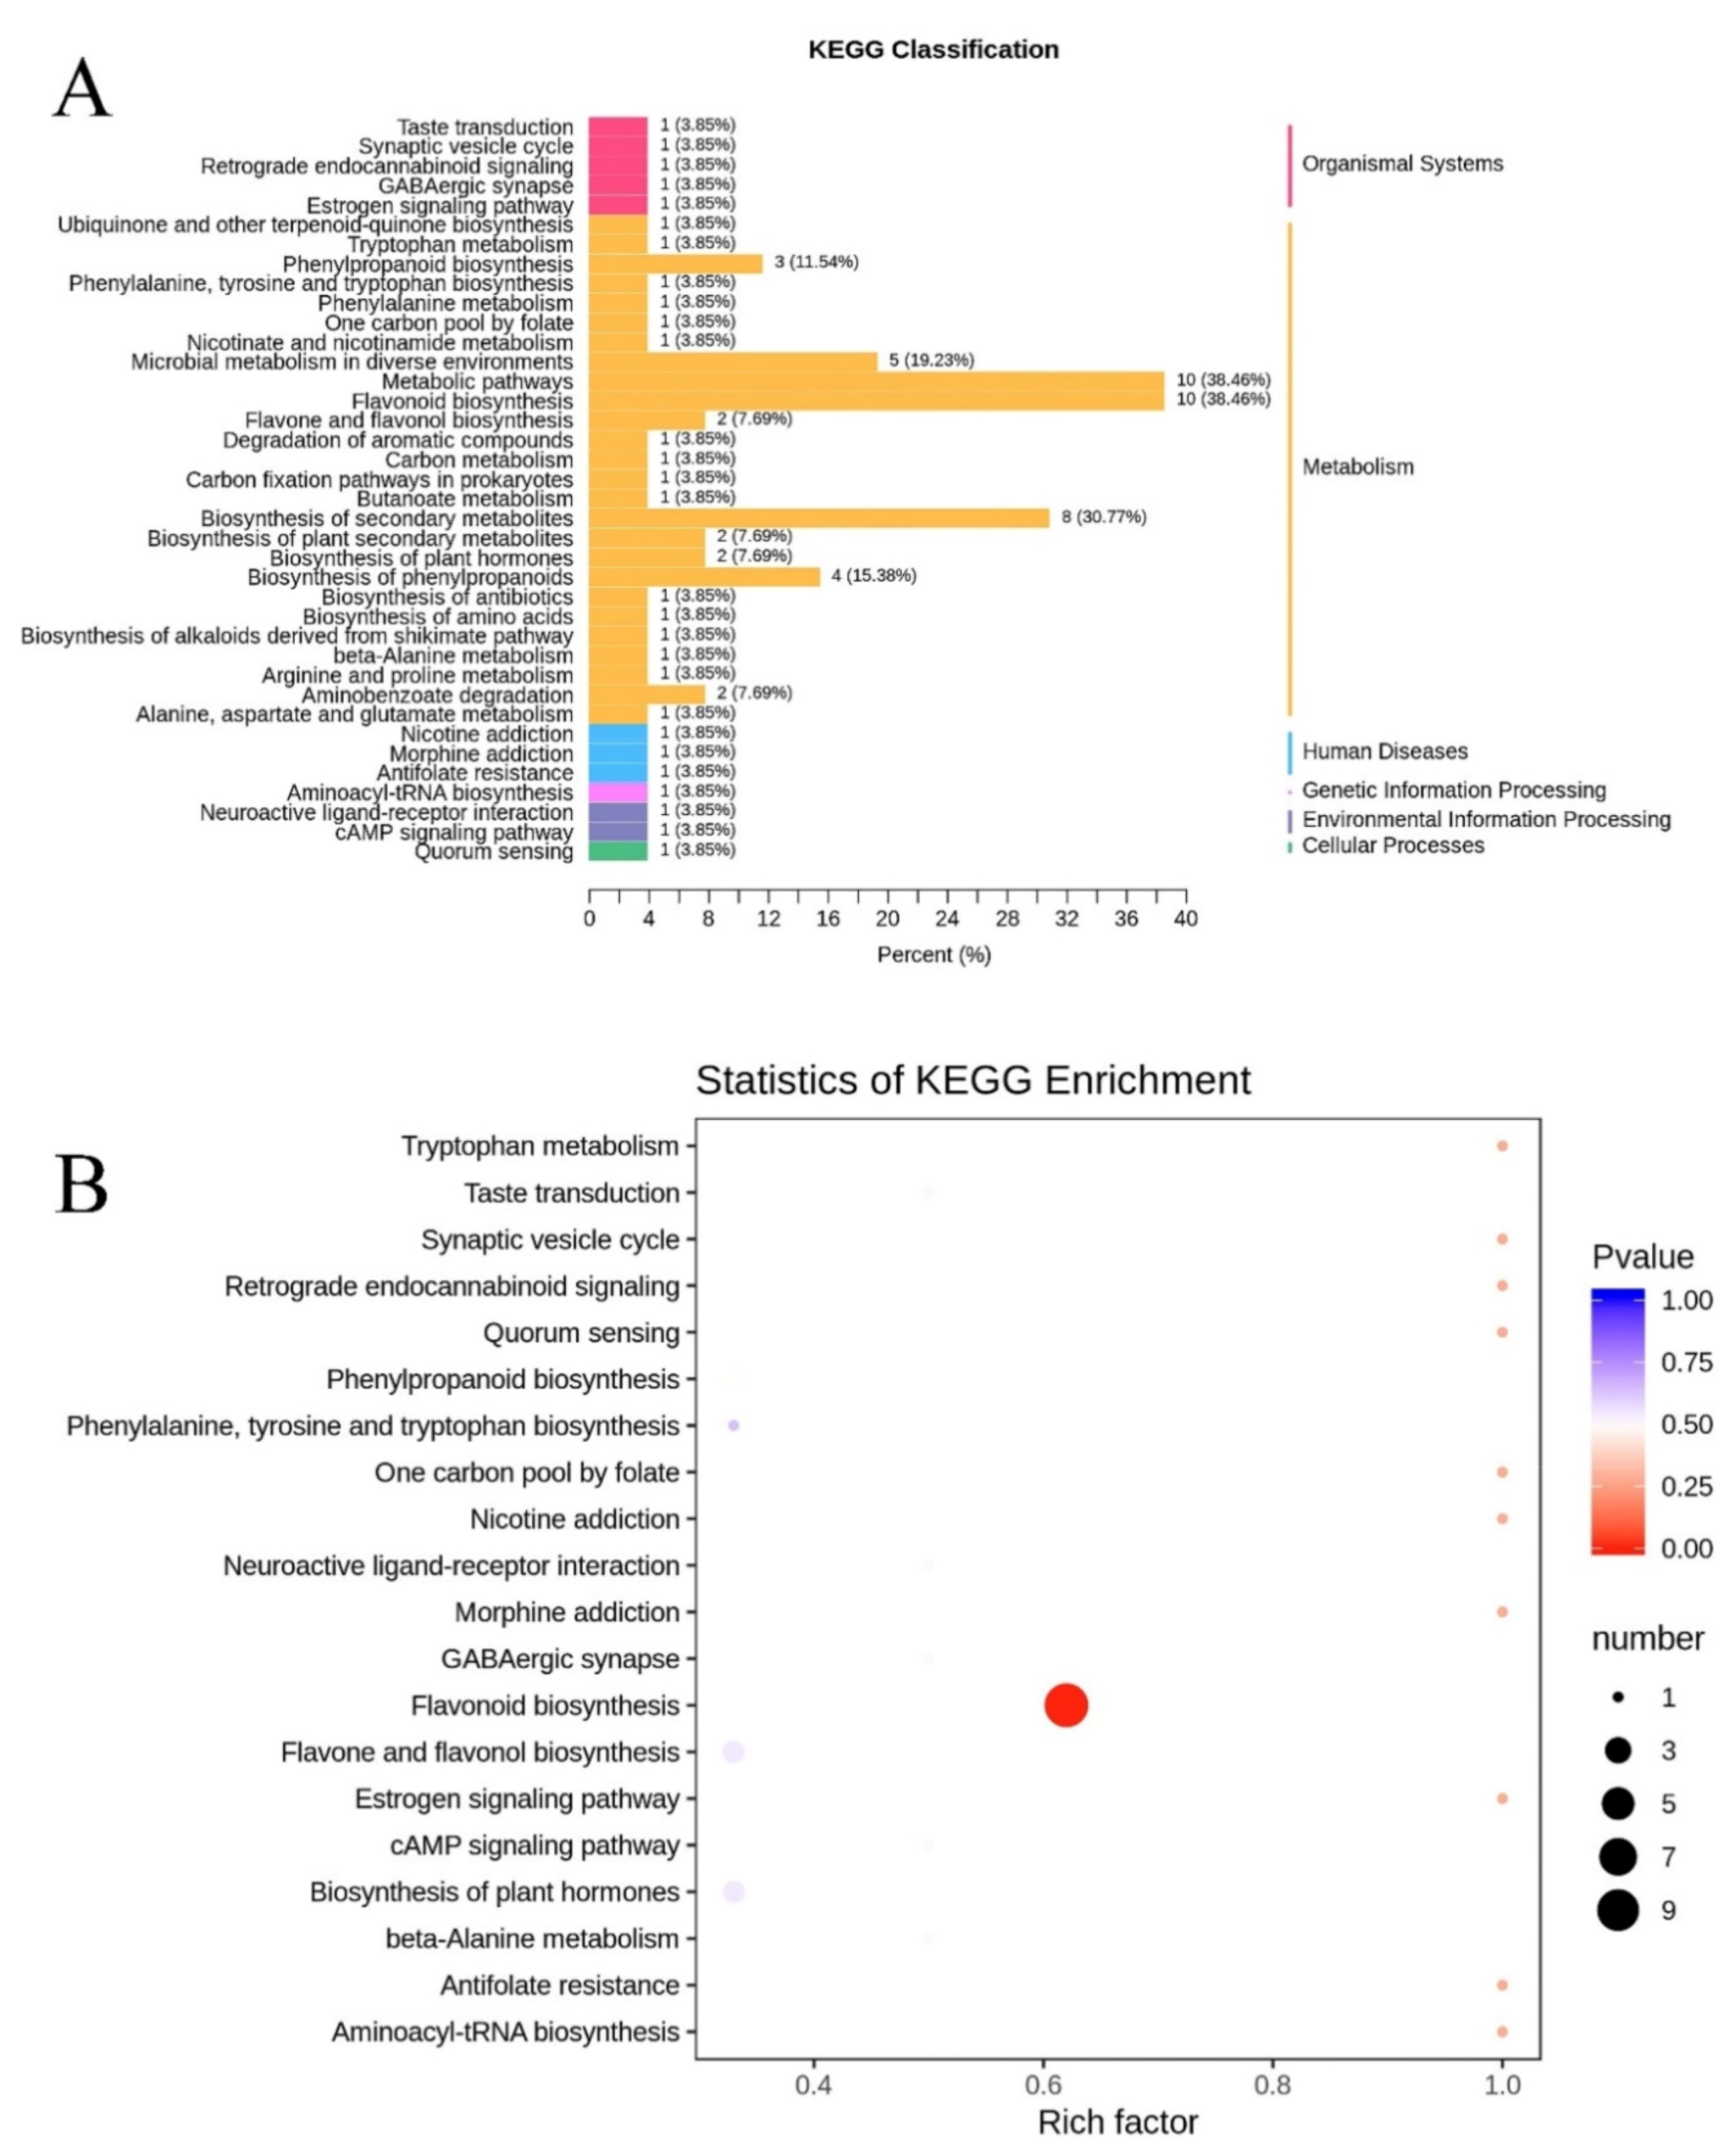
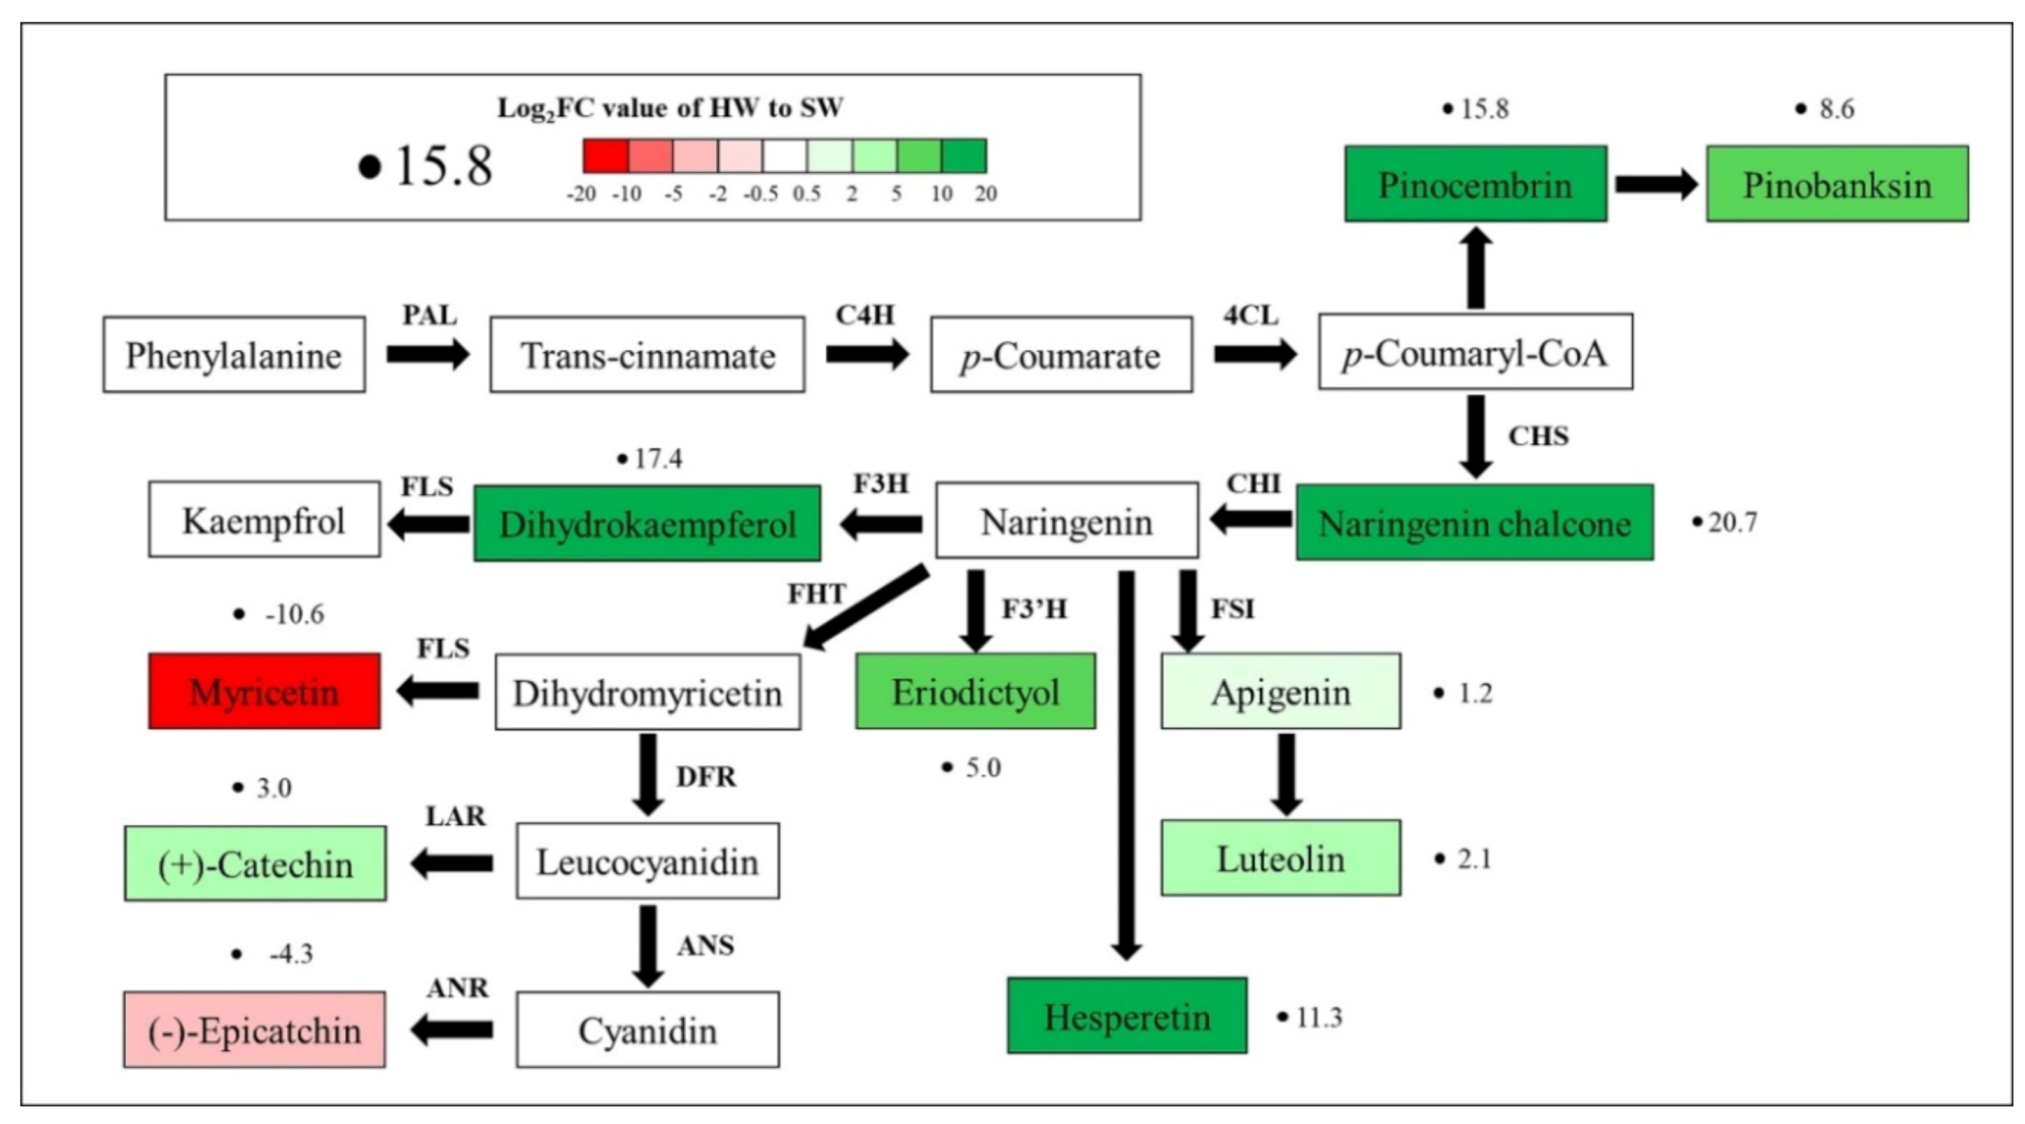
3.4. Putative Metabolic Pathways for Signal Metabolites
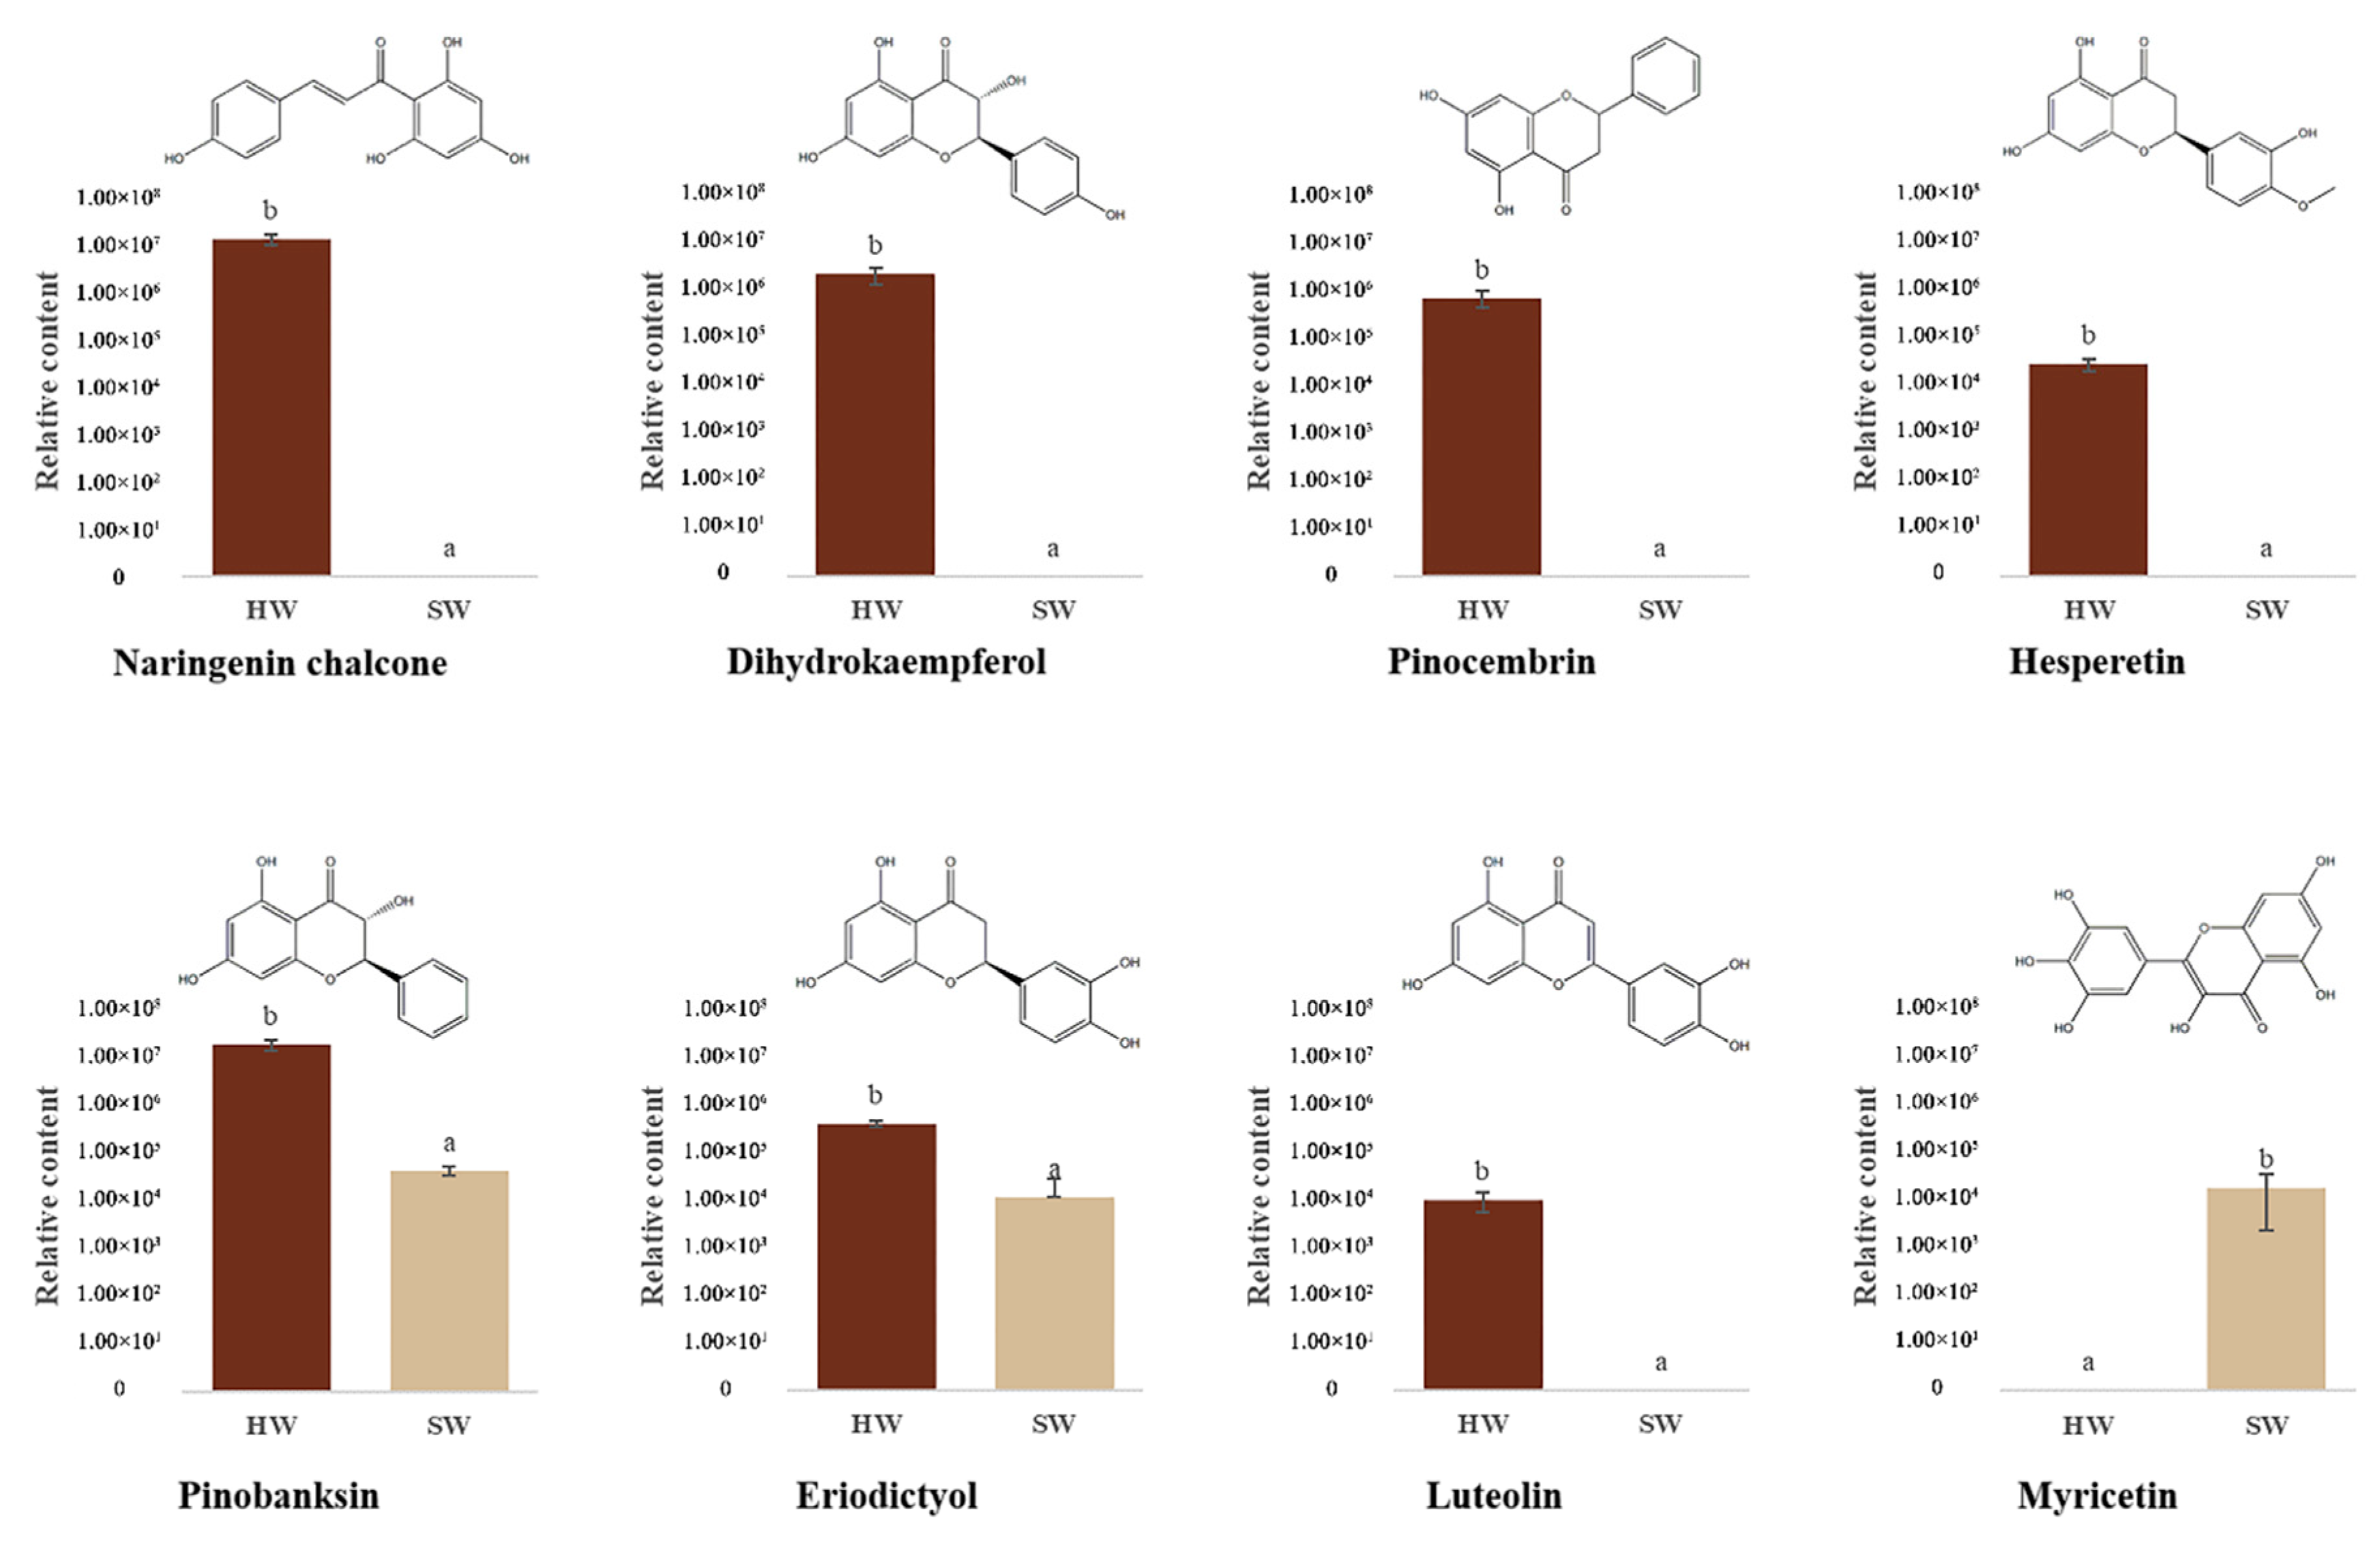
3.5. Secondary Metabolites Identified in the Flavonoid Pathway in HW and SW
4. Discussion
5. Conclusions
Author Contributions
Funding
Conflicts of Interest
References
- Spicer, R. Senescence in secondary xylem: Heartwood formation as an active developmental program. In Vascular Transport in Plants; Elsevier: Amsterdam, The Netherland, 2005; pp. 457–475. [Google Scholar]
- Miyamoto, N.; Iizuka, K.; Nasu, J.; Yamada, H. Genetic effects on heartwood color variation in Cryptomeria japonica. Silvae Genet. 2016, 65, 80–87. [Google Scholar] [CrossRef]
- Sundqvist, B. Color response of Scots pine (Pinus sylvestris), Norway spruce (Picea abies) and birch (Betula pubescens) subjected to heat treatment in capillary phase. Eur. J. Wood Wood Prod. 2002, 60, 106–114. [Google Scholar] [CrossRef]
- Gierlinger, N.; Jacques, D.; Grabner, M.; Wimmer, R.; Schwanninger, M.; Rozenberg, P.; Pâques, L.E. Colour of larch heartwood and relationships to extractives and brown-rot decay resistance. Trees-Struct. Funct. 2004, 18, 102–108. [Google Scholar] [CrossRef]
- Deklerck, V.; De Ligne, L.; Espinoza, E.; Beeckman, H.; Van den Bulcke, J.; Van Acker, J. Assessing the natural durability of xylarium specimens: Mini-block testing and chemical fingerprinting for small-sized samples. Wood Sci. Technol. 2020, 54, 981–1000. [Google Scholar] [CrossRef]
- Fries, A.; Ericsson, T.; Gref, R. High heritability of wood extractives in Pinus sylvestris progeny tests. Can. J. For. Res. 2000, 30, 1707–1713. [Google Scholar] [CrossRef]
- Ericsson, T.; Fries, A.; Gref, R. Genetic correlations of heartwood extractives in Pinus sylvestris progeny tests. For. Genet. 2001, 8, 73–80. [Google Scholar]
- Jeong, S.T.; Goto-Yamamoto, N.; Kobayashi, S.; Esaka, M. Effects of plant hormones and shading on the accumulation of anthocyanins and the expression of anthocyanin biosynthetic genes in grape berry skins. Plant Sci. 2004, 167, 247–252. [Google Scholar] [CrossRef]
- Gould, K.; Davies, K.M.; Winefield, C. Anthocyanins: Biosynthesis, Functions, and Applications; Springer Science & Business Media: Berlin/Heidelberg, Germany, 2008. [Google Scholar]
- Jia, L.; Wu, Q.; Ye, N.; Liu, R.; Shi, L.; Xu, W.; Zhi, H.; Rahman, A.R.B.; Xia, Y.; Zhang, J. Proanthocyanidins inhibit seed germination by maintaining a high level of abscisic acid in Arabidopsis thaliana F. J. Integr. Plant Biol. 2012, 54, 663–673. [Google Scholar] [CrossRef]
- Sehitoglu, M.H.; Farooqi, A.A.; Qureshi, M.Z.; Butt, G.; Aras, A. Anthocyanins: Targeting of signaling networks in cancer cells. Asian Pac. J. Cancer Prev. 2014, 15, 2379–2381. [Google Scholar] [CrossRef]
- Lee, S.L.; Chin, T.Y.; Tu, S.C.; Wang, Y.J.; Hsu, Y.T.; Kao, M.C.; Wu, Y.C. Purple sweet potato leaf extract induces apoptosis and reduces inflammatory adipokine expression in 3T3-L1 differentiated adipocytes. Evid. Based Complement. Altern. Med. 2015, 126302. [Google Scholar] [CrossRef]
- Wei, C.; Liang, G.; Guo, Z.; Wang, W.; Zhang, H.; Liu, X.; Yu, S. A novel integrated method for large-scale detection, identification, and quantification of widely targeted metabolites: Application in the study of rice metabolomics. Mol. Plant 2013, 6, 1769–1780. [Google Scholar] [CrossRef]
- Wang, D.; Zhang, L.; Huang, X.; Xiao, W.; Yang, R.; Jin, M.; Wang, X.; Wang, X.; Qi, Z.; Li, P. Identification of nutritional components in black sesame determined by widely targeted metabolomics and traditional Chinese Medicines. Molecules 2018, 23, 1180. [Google Scholar] [CrossRef]
- Wang, T.; Zou, Q.; Guo, Q.; Yang, F.; Zhang, W. Widely targeted metabolomics analysis reveals the effect of flooding stress on the synthesis of flavonoids in Chrysanthemum morifolium. Molecules 2019, 24, 3695. [Google Scholar] [CrossRef]
- Wu, X.; Prior, R.L. Systematic identification and characterization of anthocyanins by HPLC-ESI-MS/MS in common foods in the United States: Fruits and Berries. J. Agric. Food Chem. 2005, 53, 2589–2599. [Google Scholar] [CrossRef]
- Lin, L.Z.; Sun, J.; Chen, P.; Harnly, J.A. LC-PDA-ESI/MS(n) Identification of New Anthocyanins in purple bordeaux radish (Raphanus sativus L. variety). J. Agric. Food Chem. 2011, 59, 6616–6627. [Google Scholar] [CrossRef]
- Sun, J.; Lin, L.Z.; Pei, C. Study of the mass spectrometric behaviors of anthocyanins in negative ionization mode and its applications for characterization of anthocyanins and non-anthocyanin polyphenols. Rapid Commun. Mass Spectrom. RCM 2012, 26, 1123–1133. [Google Scholar] [CrossRef]
- Zheng, H.; Hu, D.; Wei, R.; Yan, S.; Wang, R. Chinese fir breeding in the high-throughput sequencing era: Insights from SNPs. Forests 2019, 10, 681. [Google Scholar] [CrossRef]
- Duan, H.; Hu, R.; Wu, B.; Chen, D.; Huang, K.; Dai, J.; Chen, Q.; Wei, Z.; Cao, S.; Sun, Y. Genetic characterization of red-colored heartwood genotypes of Chinese fir using simple sequence repeat (SSR) markers. Genet. Mol. Res. 2015, 14, 18552–18561. [Google Scholar] [CrossRef]
- Qiu, F.; Sun, S.; Xiao, F.; Zeng, Z.; Liang, C.; Liang, X. Growth analysis of half-sib families from first generation seed orchard of Cunninghamia lanceolata. South China For. Sci. 2016, 44, 1–4. (In Chinese) [Google Scholar] [CrossRef]
- Kui-Peng, L.I.; Wei, Z.C.; Huang, K.Y.; Dong, L.J.; Huang, H.F.; Chen, Q.; Dai, J.; Tan, W.J. Research on variation pattern of wood properties of red-heart Chinese fir plus trees, a featured provenance from Rongshui of Guangxi. For. Res. 2017, 30, 424–429. (In Chinese) [Google Scholar] [CrossRef]
- Wen, H.; Deng, X.; Zhang, Y.; Wei, X.; Zhu, N. Cunninghamia lanceolata variant with red-heart wood: A mini-review. Dendrobiology 2018, 79, 156–167. [Google Scholar] [CrossRef]
- Fan, G.R.; Zhang, W.Y.; Xiao, F.M.; Zhu, X.Z.; Jiang, X.M.; Yan-Shan, L.I. Studies on longitudinal variation of main chemical components in Chenshan red-heart Chinese-fir. Acta Agric. Univ. Jiangxiensis 2015, 37, 212–217. (In Chinese) [Google Scholar] [CrossRef]
- Yang, H.; Wen, S.; Xiao, F.; Fan, G. Study on the chemical compositions of ethanol extraction from Chenshan Red-heart Chinese fir. South China For. Sci. 2016, 44, 35–37. (In Chinese) [Google Scholar] [CrossRef]
- Afendi, F.M.; Okada, T.; Yamazaki, M.; Hirai-Morita, A.; Nakamura, Y.; Nakamura, K.; Ikeda, S.; Takahashi, H.; Altaf-Ul-Amin, M.; Darusman, L.K.; et al. KNApSAcK family databases: Integrated metabolite-plant species databases for multifaceted plant research. Plant Cell Physiol. 2012, 53, e1. [Google Scholar] [CrossRef]
- Eriksson, L.; Kettanehwold, N.; Trygg, J.; Wikström, C.; Wold, S. Part I: Basic Principles and Applications. In Multi- and Megavariate Data Analysis, 2nd ed.; Umetrics Academy: Umea, Sweden, 2006. [Google Scholar]
- Thevenot, E.A.; Roux, A.; Xu, Y.; Ezan, E.; Junot, C. Analysis of the human adult urinary metabolome variations with age, body mass index, and gender by implementing a comprehensive workflow for univariate and opls statistical analyses. J. Proteome Res. 2015, 14, 3322–3335. [Google Scholar] [CrossRef]
- Mounguengui, S.; Tchinda, J.B.S.; Ndikontar, M.K.; Dumarçay, S.; Attéké, C.; Perrin, D.; Gelhaye, E.; Gérardin, P. Total phenolic and lignin contents, phytochemical screening, antioxidant and fungal inhibition properties of the heartwood extractives of ten Congo Basin tree species. Ann. For. Sci. 2016, 73, 287–296. [Google Scholar] [CrossRef]
- Gierlinger, N.; Jacques, D.; Schwanninger, M.; Wimmer, R.; Pâques, L.E. Heartwood extractives and lignin content of different larch species (Larix sp.) and relationships to brown-rot decay-resistance. Trees 2004, 18, 230–236. [Google Scholar] [CrossRef]
- Fiehn, O.; Kloska, S.; Altmann, T. Integrated studies on plant biology using multiparallel techniques. Curr. Opin. Biotechnol. 2001, 12, 82–86. [Google Scholar] [CrossRef]
- Sawada, Y. Widely targeted metabolomics based on large-scale MS/MS Data for elucidating metabolite accumulation patterns in plants. Plant Cell Physiol. 2009, 50, 37–47. [Google Scholar] [CrossRef]
- Cho, K.; Cho, K.; Sohn, H.; Ha, I.J.; Hong, S.; Lee, H.; Kim, Y.; Nam, M.H. Network analysis of the metabolome and transcriptome reveals novel regulation of potato pigmentation. J. Exp. Bot. 2016, 67, 1519–1533. [Google Scholar] [CrossRef]
- Xue, Q.; Fan, H.; Yao, F.; Cao, X.; Liu, M.; Sun, J.; Liu, Y. Transcriptomics and targeted metabolomics profilings for elucidation of pigmentation in Lonicera japonica flowers at different developmental stages. Ind. Crop. Prod. 2020, 145, 111981. [Google Scholar] [CrossRef]
- Hadjipieri, M.; Georgiadou, E.C.; Marin, A.; Diazmula, H.M.; Goulas, V.; Fotopoulos, V.; Tomasbarberan, F.A.; Manganaris, G.A. Metabolic and transcriptional elucidation of the carotenoid biosynthesis pathway in peel and flesh tissue of loquat fruit during on-tree development. BMC Plant Biol. 2017, 17, 102. [Google Scholar] [CrossRef] [PubMed]
- Wang, Z.; Cui, Y.; Vainstein, A.; Chen, S.; Ma, H. Regulation of fig (Ficus carica L.) fruit color: Metabolomic and transcriptomic analyses of the flavonoid biosynthetic pathway. Front. Plant Sci. 2017, 8, 1990. [Google Scholar] [CrossRef] [PubMed]
- Li, Y.; Fang, J.; Qi, X.; Lin, M.; Zhong, Y.; Sun, L.; Cui, W. Combined analysis of the fruit metabolome and transcriptome reveals candidate genes involved in flavonoid biosynthesis in Actinidia arguta. Int. J. Mol. Sci. 2018, 19, 1471. [Google Scholar] [CrossRef] [PubMed]
- Paolo, B.; Saverio, O.; Mirko, M.; Matteo, B.; Lara, G.; Azeddine, S.A. Gene expression and metabolite accumulation during strawberry (Fragaria × ananassa) fruit development and ripening. Planta 2018, 248, 1143–1157. [Google Scholar] [CrossRef]
- Zhang, Q.; Wang, L.; Liu, Z.; Zhao, Z.; Zhao, J.; Wang, Z.; Zhou, G.; Liu, P.; Liu, M. Transcriptome and metabolome profiling unveil the mechanisms of Ziziphus jujuba Mill. peel coloration. Food Chem. 2020, 312, 125903. [Google Scholar] [CrossRef]
- Holt, R.R.; Lazarus, S.A.; Sullards, M.C.; Zhu, Q.Y.; Schramm, D.D.; Hammerstone, J.F.; Fraga, C.G.; Schmitz, H.H.; Keen, C.L. Procyanidin dimer B2 [epicatechin-(4β-8)-epicatechin] in human plasma after the consumption of a flavanol-rich cocoa. Am. J. Clin. Nutr. 2002, 76, 798–804. [Google Scholar] [CrossRef]
- Wu, S.; Dastmalchi, K.; Long, C.; Kennelly, E.J. Metabolite profiling of Jaboticaba (Myrciaria cauliflora) and other dark-colored fruit juices. J. Agric. Food Chem. 2012, 60, 7513–7525. [Google Scholar] [CrossRef]
- Boss, P.K.; Davies, C.H.J.; Robinson, S.P. Analysis of the expression of anthocyanin pathway genes in developing Vitis vinifera L. cv Shiraz Grape Berries and the implications for pathway regulation. Plant Physiol. 1996, 111, 1059–1066. [Google Scholar] [CrossRef]
- Ferreyra, M.L.F.; Rius, S.P.; Casati, P. Flavonoids: Biosynthesis, biological functions and biotechnological applications. Front. Plant Sci. 2012, 3, 222. [Google Scholar] [CrossRef]
- Pelletier, M.K.; Murrell, J.R.; Shirley, B.W. Characterization of flavonol synthase and leucoanthocyanidin dioxygenase genes in arabidopsis (further evidence for differential regulation of “early” and “late” genes). Plant Physiol. 1997, 113, 1437–1445. [Google Scholar] [CrossRef] [PubMed]
- Dick, C.A.; Buenrostro, J.D.; Butler, T.; Carlson, M.L.; Kliebenstein, D.J.; Whittall, J.B. Arctic mustard flower color polymorphism controlled by petal-specific downregulation at the threshold of the anthocyanin biosynthetic pathway. PLoS ONE 2011, 6, e18230. [Google Scholar] [CrossRef] [PubMed]
- Saito, K.; Yonekurasakakibara, K.; Nakabayashi, R.; Higashi, Y.; Yamazaki, M.; Tohge, T.; Fernie, A.R. The flavonoid biosynthetic pathway in Arabidopsis: Structural and genetic diversity. Plant Physiol. Biochem. 2013, 72, 21–34. [Google Scholar] [CrossRef] [PubMed]
- Dellus, V.; Mila, I.; Scalbert, A.; Menard, C.; Michon, V.; Du Penhoat, C.L.M.H. Douglas-fir polyphenols and heartwood formation. Phytochemistry 1997, 45, 1573–1578. [Google Scholar] [CrossRef]
- Dellus, V.; Scalbert, A.; Janin, G. Polyphenols and colour of douglas fir heartwood. Holzforschung 1997, 51, 291–295. [Google Scholar] [CrossRef]
- Pâques, L.E.; Garciacasas, M.D.C.; Charpentier, J. Distribution of heartwood extractives in hybrid larches and in their related European and Japanese larch parents: Relationship with wood colour parameters. Eur. J. For. Res. 2013, 132, 61–69. [Google Scholar] [CrossRef]
- Takahashi, K.; Mori, K. Relationships between blacking phenomenon and norlignans of sugi (Cryptomeria japonica) heartwood III: Coloration of norlignans with alkaline treatment. J. Wood Sci. 2006, 52, 134–139. [Google Scholar] [CrossRef]
- Shao, F.; Zhang, L.; Guo, J.; Liu, X.; Ma, W.; Wilson, I.W.; Qiu, D. A comparative metabolomics analysis of the components of heartwood and sapwood in Taxus chinensis (Pilger) Rehd. Sci. Rep. 2019, 9, 1–8. [Google Scholar] [CrossRef]
- Chen, S.; Yen, P.; Chang, T.; Chang, S.; Huang, S.; Yeh, T. Distribution of living ray parenchyma cells and major bioactive compounds during the heartwood formation of Taiwania cryptomerioides Hayata. J. Wood Chem. Technol. 2018, 38, 84–95. [Google Scholar] [CrossRef]
- Nakaba, S.; Arakawa, I.; Morimoto, H.; Nakada, R.; Bito, N.; Imai, T.; Funada, R. Agatharesinol biosynthesis-related changes of ray parenchyma in sapwood sticks of Cryptomeria japonica during cell death. Planta 2016, 243, 1225–1236. [Google Scholar] [CrossRef]


| Compounds | Formula | Class | VIP | Fold-Change | Log2FC |
|---|---|---|---|---|---|
| Naringenin chalcone | C15H12O5 | Flavonoids | 2.22 | 1.65 × 10⁶ | 20.65 |
| Dihydrokaempferol | C15H12O6 | Flavonoids | 2.03 | 1.73 × 10⁵ | 17.40 |
| 1-Feruloyl-sn-glycerol | C13H16O6 | Phenolic acids | 1.98 | 8.43 × 10⁴ | 16.36 |
| Ailantinol E | C21H24O7 | Others | 1.92 | 6.04 × 10⁴ | 15.88 |
| Pinocembrin (Dihydrochrysin) | C15H12O4 | Flavonoids | 1.94 | 5.66 × 10⁴ | 15.79 |
| Z-6,7-Epoxyligustilide | C12H14O3 | Others | 1.90 | 3.69 × 10⁴ | 15.17 |
| 3-O-Acetylpinobanksin | C17H14O6 | Flavonoids | 1.84 | 2.20 × 10⁴ | 14.43 |
| benzoyltartaric acid | C11H10O7 | Phenolic acids | 1.84 | 2.12 × 10⁴ | 14.37 |
| Sexangularetin | C16H12O7 | Flavonoids | 1.77 | 1.85 × 10⁴ | 14.18 |
| Quercetin galloglucoside | C28H24O16 | Flavonoids | 1.82 | 1.66 × 10⁴ | 14.02 |
© 2020 by the authors. Licensee MDPI, Basel, Switzerland. This article is an open access article distributed under the terms and conditions of the Creative Commons Attribution (CC BY) license (http://creativecommons.org/licenses/by/4.0/).
Share and Cite
Cao, S.; Zhang, Z.; Sun, Y.; Li, Y.; Zheng, H. Profiling of Widely Targeted Metabolomics for the Identification of Secondary Metabolites in Heartwood and Sapwood of the Red-Heart Chinese Fir (Cunninghamia Lanceolata). Forests 2020, 11, 897. https://doi.org/10.3390/f11080897
Cao S, Zhang Z, Sun Y, Li Y, Zheng H. Profiling of Widely Targeted Metabolomics for the Identification of Secondary Metabolites in Heartwood and Sapwood of the Red-Heart Chinese Fir (Cunninghamia Lanceolata). Forests. 2020; 11(8):897. https://doi.org/10.3390/f11080897
Chicago/Turabian StyleCao, Sen, Zijie Zhang, Yuhan Sun, Yun Li, and Huiquan Zheng. 2020. "Profiling of Widely Targeted Metabolomics for the Identification of Secondary Metabolites in Heartwood and Sapwood of the Red-Heart Chinese Fir (Cunninghamia Lanceolata)" Forests 11, no. 8: 897. https://doi.org/10.3390/f11080897
APA StyleCao, S., Zhang, Z., Sun, Y., Li, Y., & Zheng, H. (2020). Profiling of Widely Targeted Metabolomics for the Identification of Secondary Metabolites in Heartwood and Sapwood of the Red-Heart Chinese Fir (Cunninghamia Lanceolata). Forests, 11(8), 897. https://doi.org/10.3390/f11080897