Article

Long-Term Effects of Fuels Treatments, Overstory Structure, and Wildfire on Tree Regeneration in Dry Forests of Central Washington

by
Allison K. Rossman
1,*,
Jonathan D. Bakker
1,
David W. Peterson
2 and
Charles B. Halpern
1
1
School of Environmental and Forest Sciences, College of the Environment, University of Washington, Seattle, WA 98195, USA
2
U.S. Forest Service, Pacific Northwest Research Station, Wenatchee, WA 98801, USA
*
Author to whom correspondence should be addressed.
Forests 2020, 11(8), 888; https://doi.org/10.3390/f11080888
Submission received: 31 July 2020 / Accepted: 12 August 2020 / Published: 15 August 2020

Abstract

:
The long-term effectiveness of dry-forest fuels treatments (restoration thinning and prescribed burning) depends, in part, on the pace at which trees regenerate and recruit into the overstory. Knowledge of the factors that shape post-treatment regeneration and growth is limited by the short timeframes and simple disturbance histories of past research. Here, we present results of a 15-year fuels-reduction experiment in central Washington, including responses to planned and unplanned disturbances. We explore the changing patterns of Douglas-fir regeneration in 72 permanent plots (0.1 ha) varying in overstory abundance (a function of density and basal area) and disturbance history—the latter including thinning, prescribed burning, and/or wildfire. Plots were measured before treatment (2000/2001), soon afterwards (2004/2005), and more than a decade later (2015). Thinning combined with burning enhanced sapling recruitment (ingrowth) into the overstory, although rates of ingrowth were consistently low and greatly exceeded by mortality. Relationships between seedling frequency (proportion of quadrats within a plot) and overstory abundance shifted from weakly negative before treatment to positive after thinning, to neutral in the longer term. However, these relationships were overshadowed by more recent, higher-severity prescribed fire and wildfire that stimulated seedling establishment while killing advanced regeneration and overstory trees. Our results highlight the dependence of regeneration responses on the history of, and time since, fuels treatment and subsequent disturbance. Managers must be aware of this spatial and temporal complexity and plan for future disturbances that are inevitable but unpredictable in timing and severity.

1. Introduction

Large areas of dry coniferous forests in western North America require restoration to reduce the risk of high severity wildfire and to restore the structures and functions that characterized these forests historically [1,2,3,4,5]. Restoration treatments, including mechanical thinning and prescribed burning, have proven effective for achieving these objectives in the short term by reducing surface and ladder fuels, increasing canopy base height, and reducing canopy bulk density [6,7,8,9,10,11,12]. However, the longevity of these effects varies considerably within and among landscapes [13], and the factors influencing this variability are not well understood.
A key factor contributing to fuels-treatment longevity is the rate at which trees re-establish and grow following treatment. Understory regeneration is a primary source of ladder fuels, and as saplings recruit into the overstory they increase canopy bulk density and crown-fire potential [14]. Knowledge of the factors that regulate regeneration and growth is critical to the design of fuels-treatment prescriptions, including the need for, or timing of, re-entry to maintain fuels or structural objectives.
Regeneration responses to restoration treatments may be influenced by numerous factors, including pre-treatment densities, losses to thinning or fire, and changes in the biotic or abiotic conditions that affect recruitment. Prior to treatment, regeneration density or spatial variability may reflect past disturbance, overstory structure, or topo-edaphic controls (e.g., aspect, elevation, microtopography, or soil depth) [15,16,17]. Fuels treatments can reduce regeneration densities via mechanical damage (e.g., crushing or burial during felling or yarding) or by heating (fire). Subsequent recruitment can be shaped by changes in seedbed conditions, seed availability, and light or soil resources [18]. For example, thinning generates slash and fine litter that can inhibit germination, root development, and seedling survival [19,20,21]. In contrast, prescribed fire consumes surface litter, exposes mineral soil, and triggers a flush of mineral nitrogen [22,23]—conditions that benefit germination and growth [21,24,25]. Seed availability can be enhanced if thinning promotes diameter growth or cone production [26]. Conversely, loss of overstory trees can reduce proximity to seed sources, particularly for species that are less common or patchily distributed [16,27,28]. Thinning and burning can also promote regeneration by increasing the availability of light and soil resources [29,30] or, by the same effect, inhibit it if competing vegetation preferentially benefits [21,31], or shade-tolerant tree species are stressed by excessive radiation or evaporative demand [21,32]).
In the longer term, patterns of recruitment and growth may vary temporally, reflecting variation in cone production [33], climatic conditions that facilitate germination and early survival [27,30,34,35], or structural changes in the overstory and understory [27,36,37]. For example, recruitment may decline over time due to canopy infilling or expansion of competing shrubs. Conversely, recruitment may increase over time if seed production or overstory mortality—and associated changes in resource availability—lag behind initial treatment effects [14,38,39]. Similarly, growth of seedlings may be delayed until they emerge from the shrub layer (e.g., [31]).
Given the myriad factors that can influence regeneration in space and time, it may be difficult to predict longer-term (decade-scale) responses to fuels treatments from initial effects [40]. Within this timeframe, natural disturbances (e.g., wildfires or insect outbreaks) are likely to redirect the trajectory of treated stands. Moreover, climate warming should increase the frequency and/or severity of these disturbance events. Adaptive management of dry-forest ecosystems will benefit from long-term fuels-reduction experiments that capture the complex dynamics resulting from repeated disturbances, both planned and unplanned. In this experiment, we examine the long-term (15-year) dynamics of conifer regeneration in dry, mixed-conifer forests of central Washington State (USA) subjected to fuels-reduction treatments (mechanical thinning and prescribed burning) and natural disturbance (wildfire). Using longitudinal data from permanent plots representing diverse histories of disturbance, we model the changing relationships of regeneration to the individual and interactive effects of overstory abundance, fuels treatments, and wildfire.

2. Materials and Methods

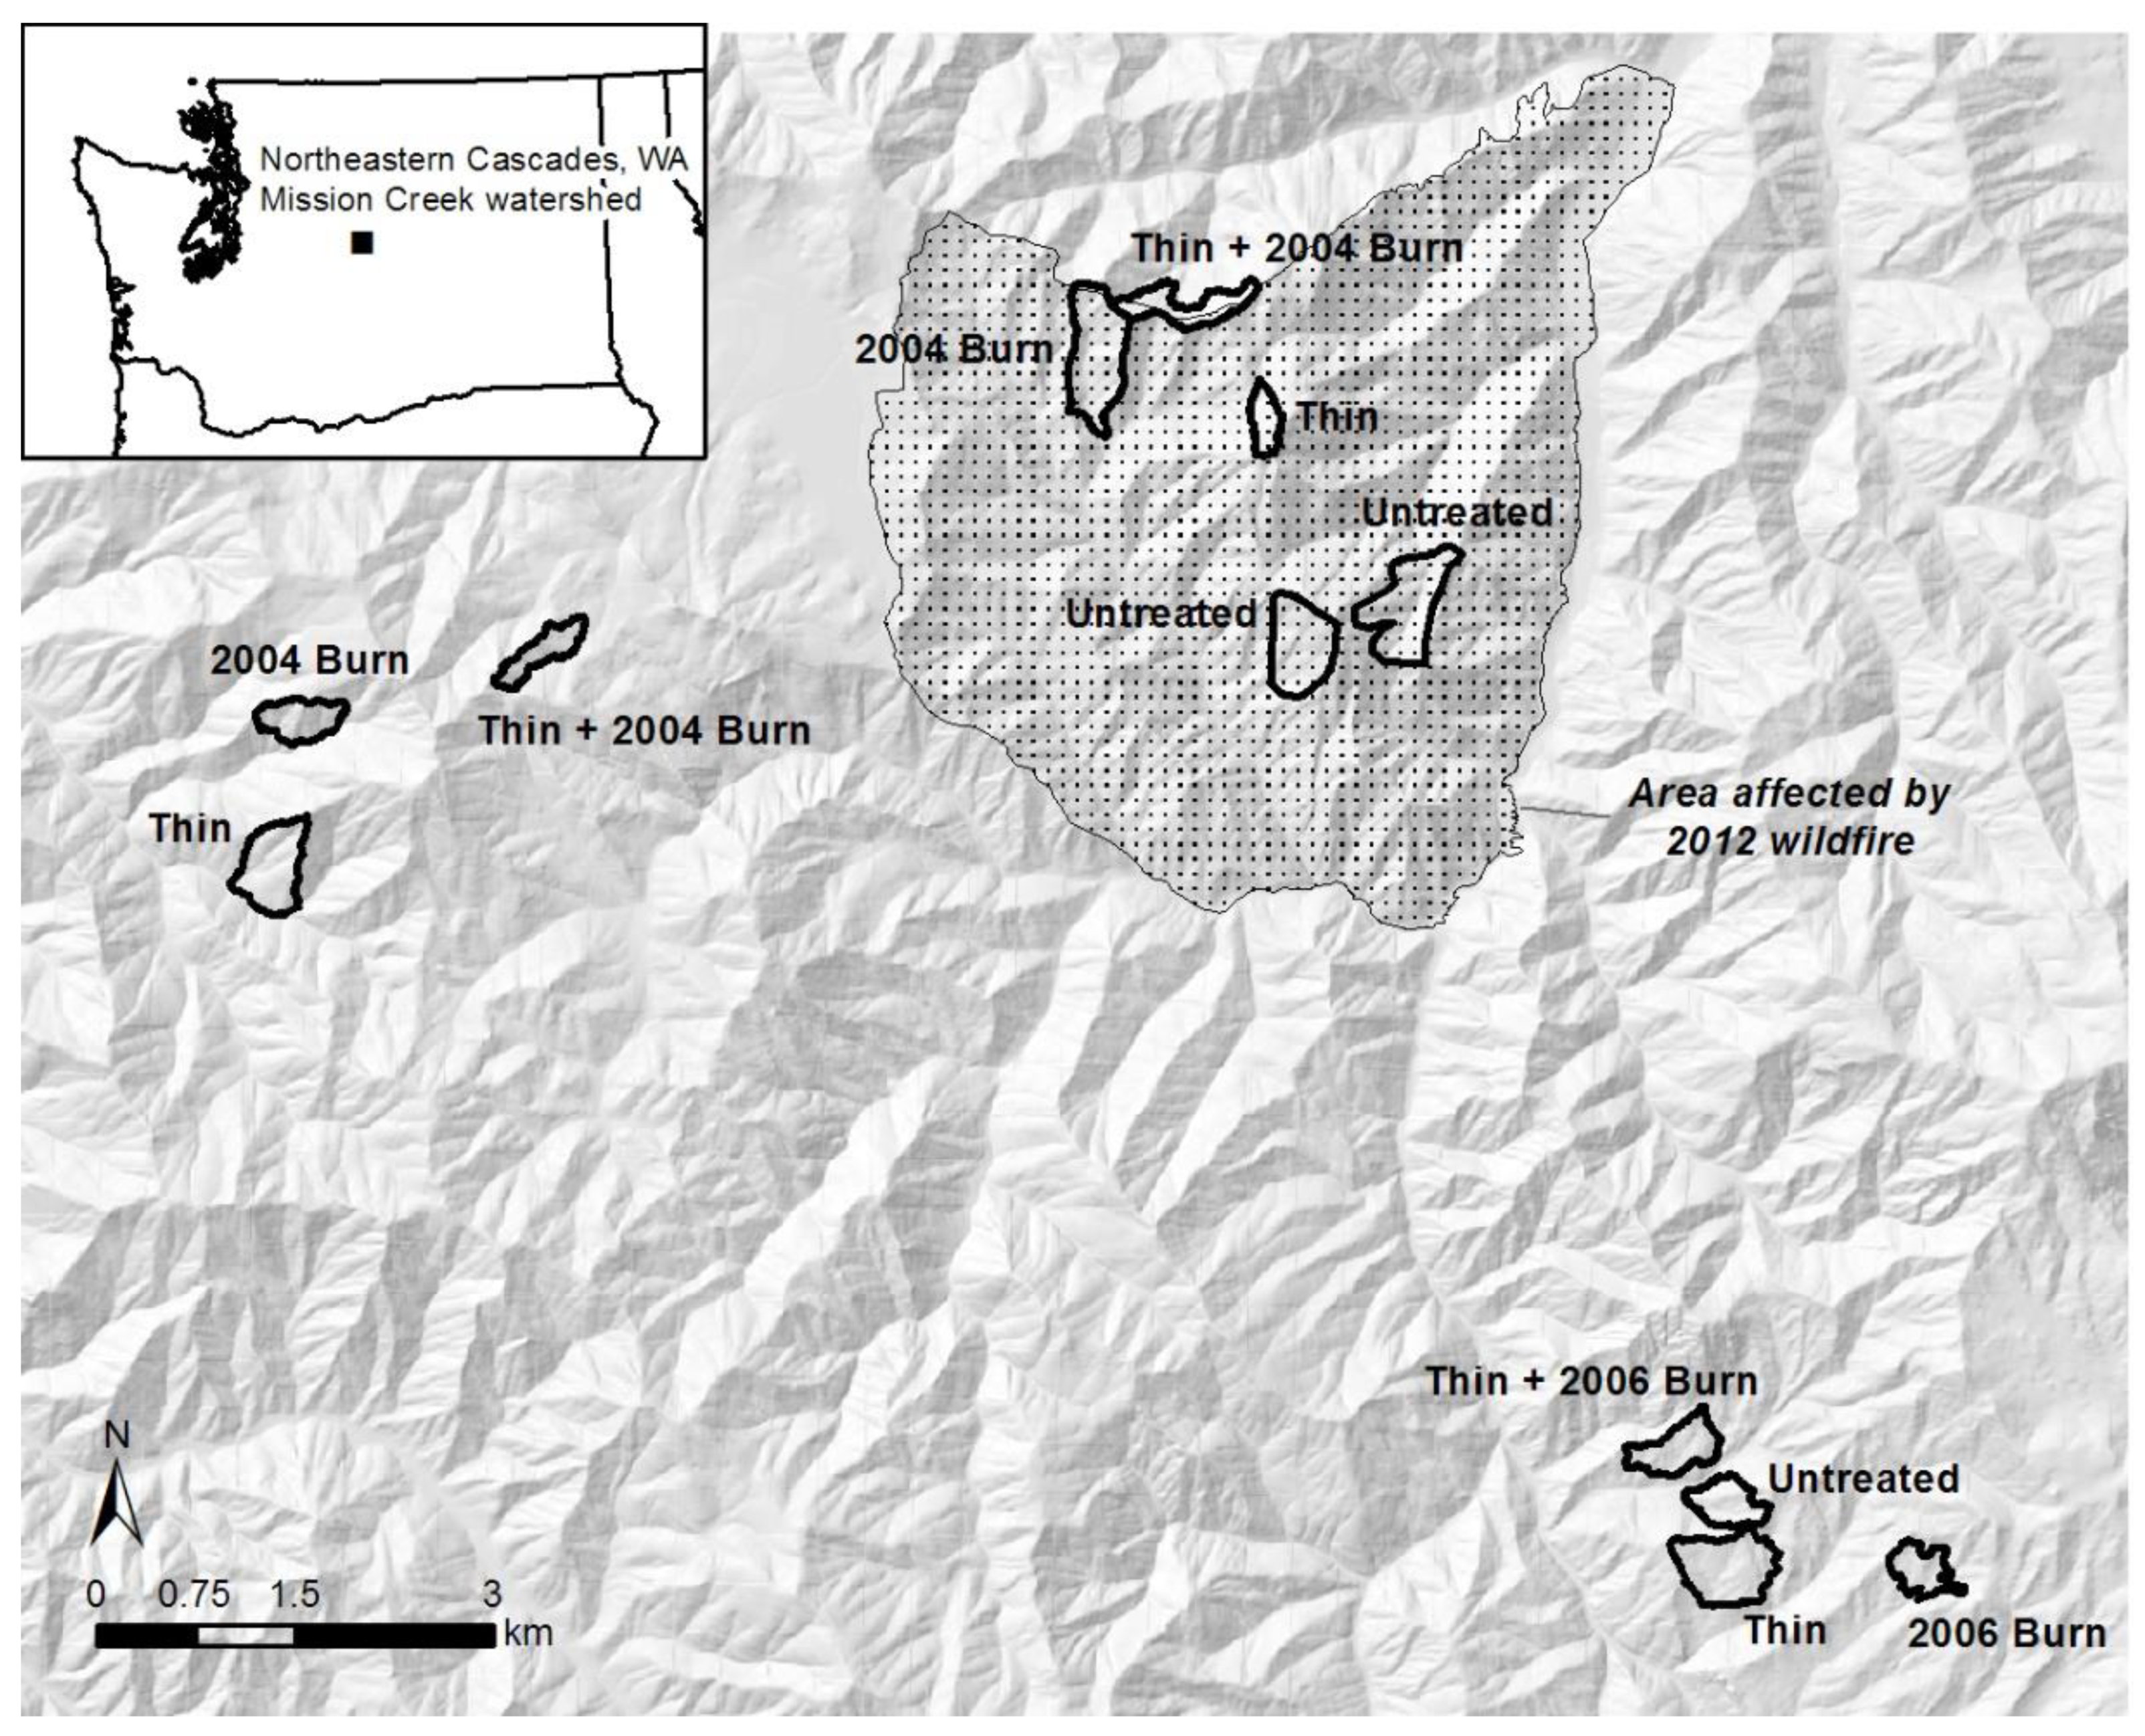
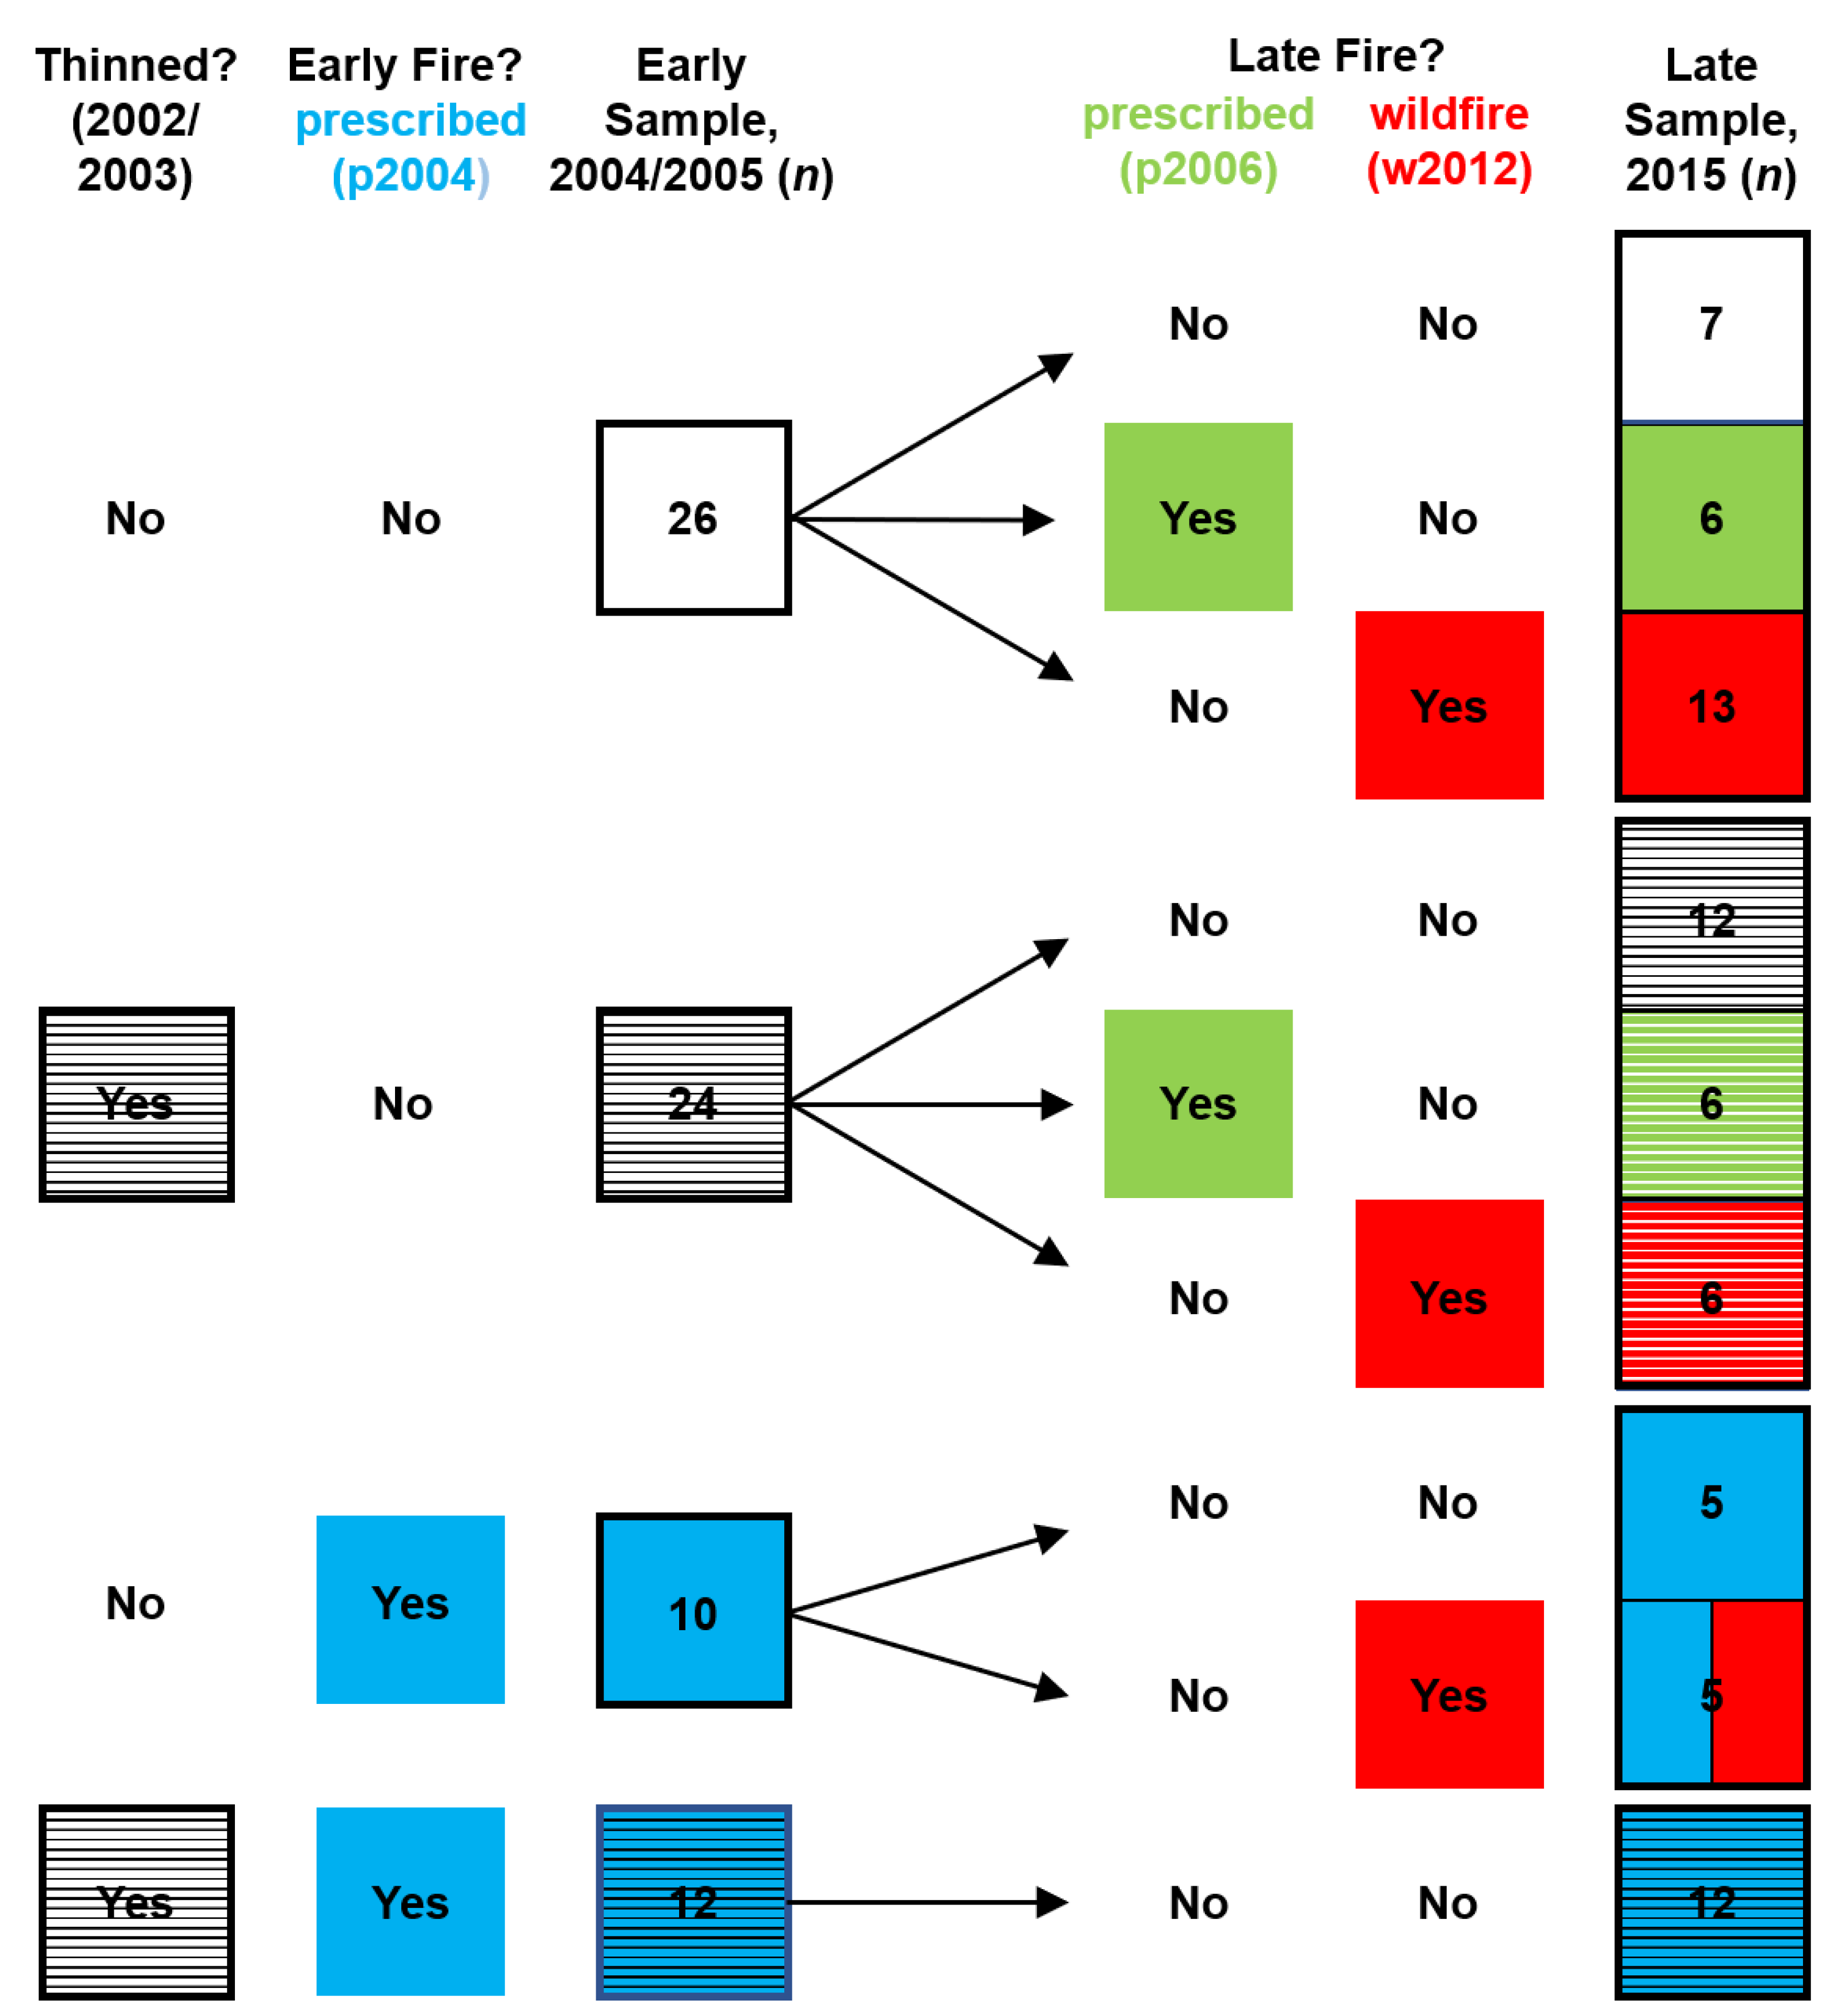
2.1. Study Sites and Treatments

This study occurred in dry forests of the Mission Creek watershed on the east side of the Cascade Mountains in central Washington State, USA (Figure 1). The site was chosen to represent forests of the interior Columbia River basin (Ecological Subregion 11) [41] as part of a broader network of sites for the Fire and Fire Surrogate (FFS) Study [42]. The climate is characterized by cool, wet winters and warm, dry summers, with frequent drought and long periods of low fuel moisture. Soils are primarily mollisols derived from sandstone [42]. The overstory is dominated by Douglas-fir (Pseudotsuga menziesii (Mirbel) Franco) and ponderosa pine (Pinus ponderosa Lawson & C. Lawson), with minor contributions by grand fir (Abies grandis (Douglas ex D. Don) Lindley) and western larch (Larix occidentalis Nutt.).
Twelve experimental units were established in 2000, each ~10 ha in area. A majority represented the Douglas-fir series [43]. Within each unit, six permanent plots (0.1 ha; 20 × 50 m) were subjectively placed in continuous forest vegetation to represent the dominant plant associations [42]. Plot elevations ranged from 670 to 1180 m (mean: 852 m) and slopes from 7% to 72% (mean: 41%). Prior to treatment, plots varied in relative abundance (density and basal area) of the principal tree species—from strong dominance by Douglas-fir to strong dominance by ponderosa pine [8].
The FFS experimental design included factorial combinations of thinning and prescribed-fire treatments (Figure 1). Treatments were randomly assigned to units, although the endangered northern spotted owl (Strix occidentalis caurina) and fire-control issues required some re-allocation [42]. We summarize treatments here; for details see [42]. Six units were thinned in fall 2002 and spring 2003. Units were thinned from below in a non-uniform pattern to a target basal area of 10–14 m2/ha such that thinning intensity varied with initial forest structure [44]. Targets reflected the historical structure, including clumped patterning of trees [42,45] and a goal of reducing fire hazard such that at least 80% of the basal area of dominant and co-dominant trees would survive if subjected to a head fire under 80th-percentile fire-weather conditions [18]. On average, density was reduced by 60% and basal area by 50%, leaving a mean residual basal area of 17.4 m2/ha—somewhat larger than the target [8]. Trees were yarded by helicopter. Prescribed-fire treatments had a more complex history. Although planned in six units, only four burns were conducted in spring 2004. Fire severity was low (crown scorch on 30% of trees) and coverage was patchy (23%–51% of the forest floor) such that treatments failed to meet most surface-fuel objectives [8,46]. The two remaining burn units were treated in spring 2006, when conditions were drier, severity was higher (crown scorch on 80% of trees), and coverage was more complete [8].
Following treatments, the Wenatchee Complex wildfire burned through four units in fall 2012. The units burned by the wildfire were thinned, previously burned, and untreated (Figure 1 and Figure 2). Anecdotal observations indicated that the wildfire burned at relatively low intensity due to an inversion layer; however, it was more severe than either prescribed fire.

2.2. Data Collection and Processing

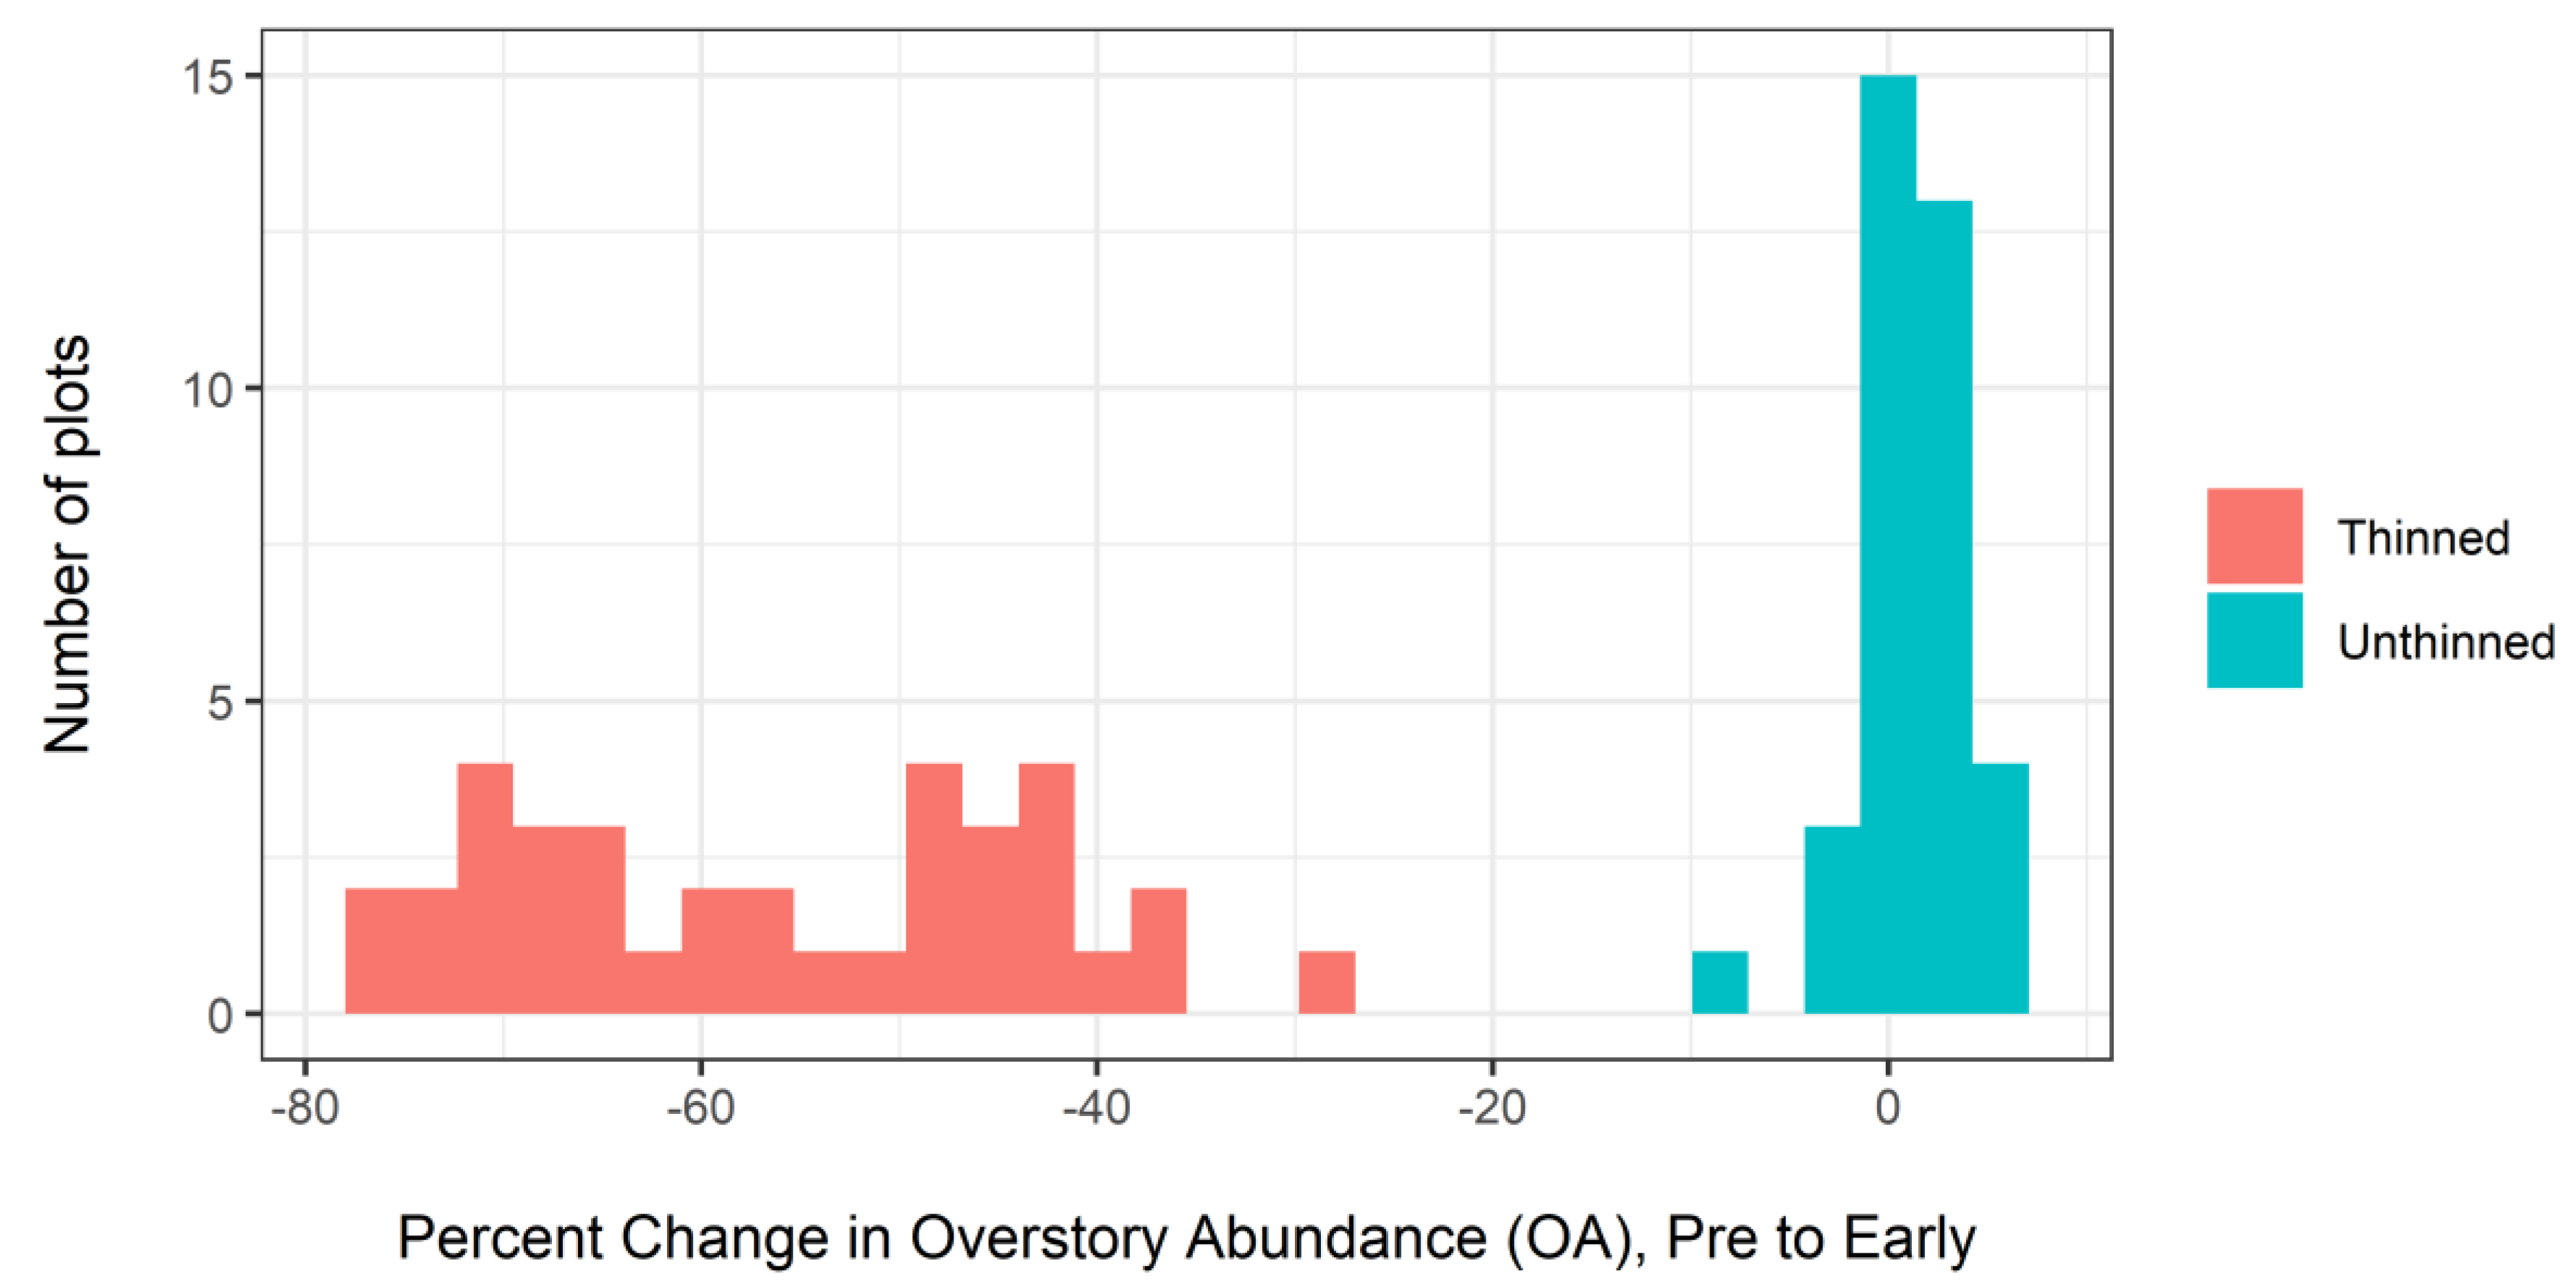
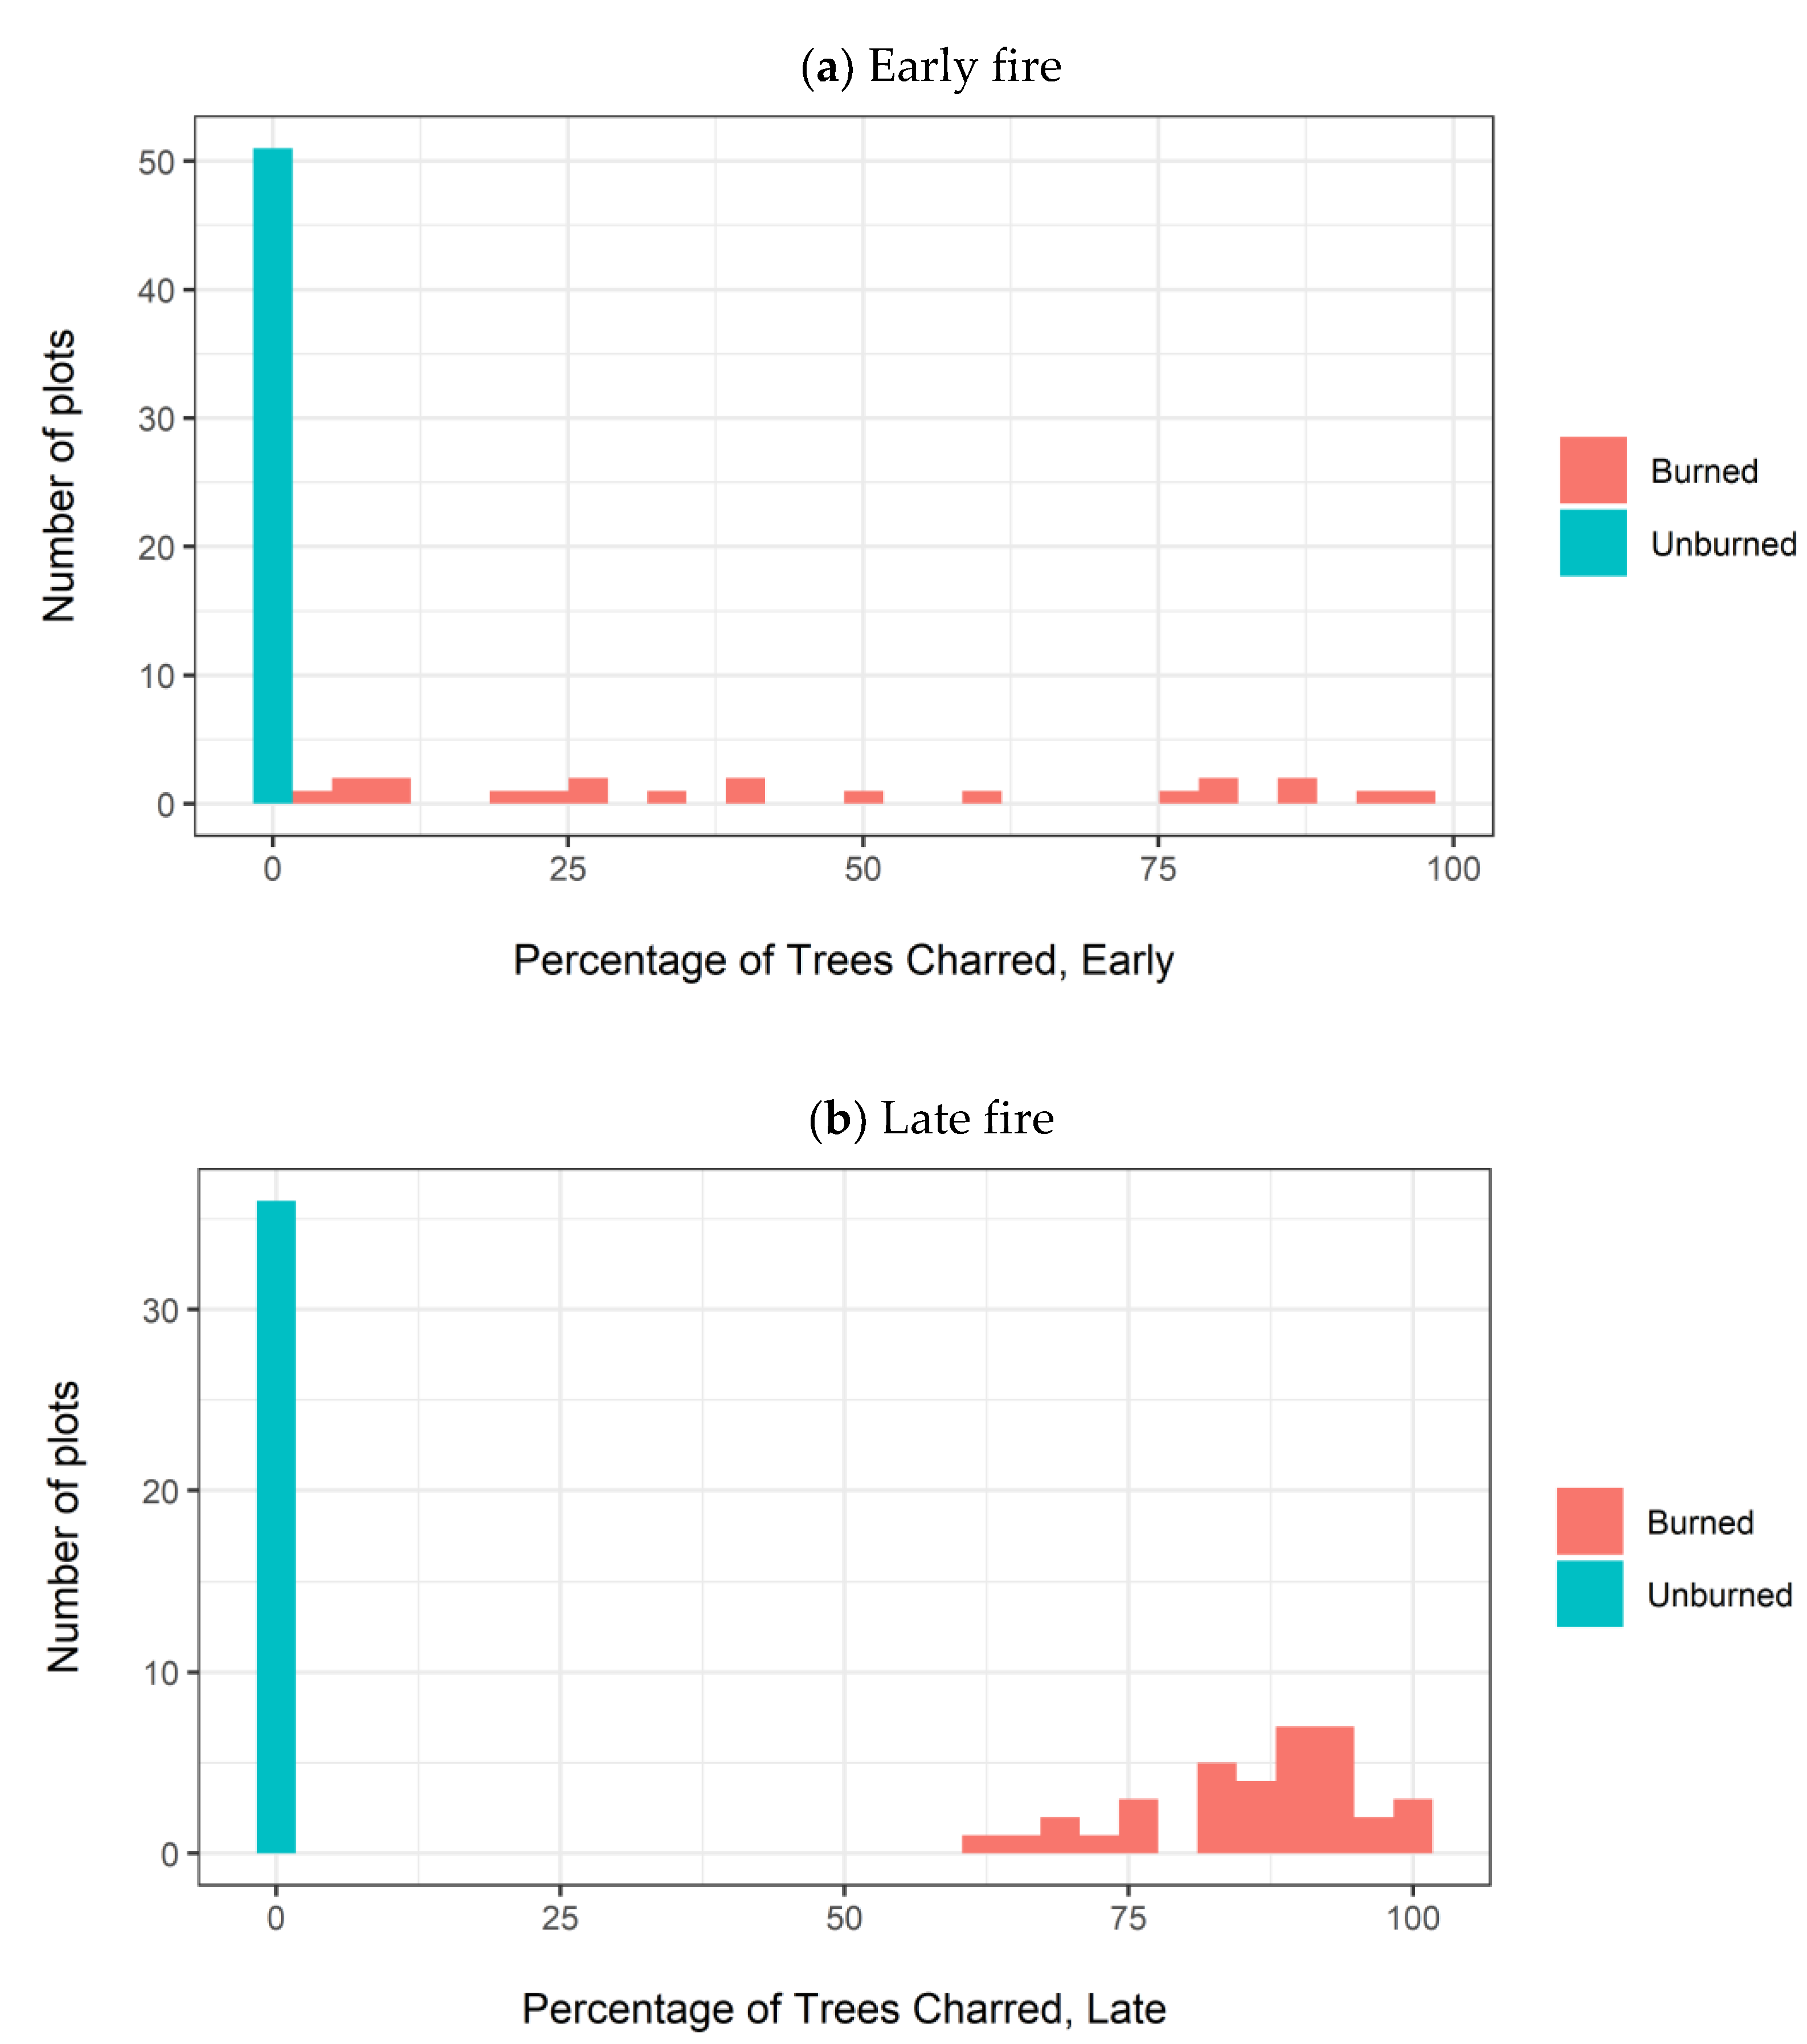
2.2.1. Overstory Structure

Overstory trees (≥7.6 cm diameter at breast height, DBH) were sampled before treatment (2000 or 2001, ‘Pre’), during the growing season after the first prescribed burn (2004, ‘Early’; second season after thinning), and in 2015 (‘Late’; Figure 2).
The trees within each plot were tagged and identified to species. At each sampling date, trees were coded as live or dead and DBH was measured on live trees. In prescribed burn or wildfire plots, presence/absence of bole char was recorded for each tree.
For each plot × sampling date, we computed tree density (number/ha), basal area (m2/ha), and a simple measure of overstory abundance (OA) that combined these two structural metrics (√(density × basal area)); (Figure A1, Appendix A.1), as in [44]. OA served as our primary measure of overstory structure. Because plots were thinned to a common target basal area, pre-treatment OA also serves as a proxy for thinning intensity in thinned plots. For each plot, we also calculated three metrics of overstory change during the Early–Late interval: (1) ingrowth (stems reaching 7.6 cm DBH between 2004 and 2015; number/ha); (2) mortality (trees alive in 2004 but dead in 2015; number/ha); and (3) basal area increment (BAI, difference in basal area between 2004 and 2015; m2/ha), capturing the net effect of ingrowth, mortality, and diameter growth of surviving trees (Table 1). Causes of mortality were not assessed. We did not compute these metrics for the Pre–Early interval as structural changes during this interval were reported in [8].

2.2.2. Regeneration

Regeneration was sampled before treatment (2000 or 2001, ′Pre′), during the second growing season after the first prescribed burn (2005, ‘Early’; third season after thinning), and in 2015 (‘Late′) (Figure 2). At each sampling date, the presence or absence of conifer seedlings (<1 m tall) was recorded in each of 20 permanent quadrats (1 × 1 m) using a stratified, random design to ensure a broad distribution of sampling across each plot (see Figure A3 in [44]).
Presence/absence data were used to compute three measures of seedling response for each plot: (1) frequency at each sampling date (proportion of quadrats with seedlings), (2) colonization (number of quadrats without seedlings at the start but with seedlings at the end of the interval), and (3) persistence (number of quadrats with seedlings at both the start and end of the interval, reflecting either survival or turnover). Colonization and persistence were calculated for each interval (Pre–Early, Early–Late, Pre–Late).
In 2015, we also tallied regeneration by height class to include taller stems that were more likely to influence near-term fire behavior and forest structure. We considered three height classes: small seedlings (<0.3 m tall), large seedlings (0.3–1.37 m tall), and saplings (>1.37 m tall but <7.6 cm DBH). Small seedlings were counted in each of the 20 quadrats per plot and large seedlings and saplings in each of 40, 5 × 5 m contiguous grid cells per plot. We did not distinguish among species in our analyses because Douglas-fir accounted for most of the regeneration (~90% of stems).

2.3. Statistical Analyses

Although fuels treatments were applied to experimental units, we treated plots within units as independent samples (n = 72) for several reasons. First, a primary goal was to explore how regeneration responded to overstory structure, which varied widely at the spatial scale of plots. Plots more appropriately capture the scale at which overstory and regenerating trees interact (0.1 ha vs. ~10 ha for units). Second, plots within the same unit showed wide variation in pre-treatment vegetation structure and physical environment (Figure A2, Appendix A.2). Third, not all plots within units received the intended treatments: three plots in prescribed-fire units fell outside burn perimeters and were included in analyses as unburned. We initially considered a mixed-model approach (i.e., plots nested within units, with unit designated as a random effect) but rejected it because lack of replication at the unit scale precluded testing of all disturbance histories.
We used three binary variables to represent the history of thinning and burning of each plot: ‘Thin treatment′ (thinned or unthinned), ′Early fire′ (burned in the 2004 prescribed fires or unburned), and ‘Late fire’ (burned or unburned after 2004). This approach facilitated data visualization, analysis, and interpretation, despite several limitations. First, binary treatment of thinning does not capture the variability in intensity of tree removal among plots [44] (Figure A3, Appendix A.3). However, by modeling early responses as a function of pre-treatment OA, we accounted for some of this variation: thinned plots with greater pre-treatment OA experienced greater thinning intensity. Second, binary treatment of fire does not account for variation in burn severity. Nevertheless, it captures the key difference between burned (particularly late fire) and unburned plots, as illustrated by the percentage of trees charred within a plot (Figure A4, Appendix A.3). Finally, the ′Late fire′ variable does not distinguish between the 2006 prescribed fire and the 2012 wildfire, although both were more severe than the 2004 prescribed fire. As a result, ′Early′ and ′Late′ fires reflect differences in severity, as well as timing of disturbance.
We analyzed nine response variables, representing overstory dynamics, the spatial frequency of regeneration, and seedling dynamics (Table 1). Some responses represented individual sampling dates (Pre, Early, or Late) and others represented changes over a sampling interval (Pre–Early, Early–Late, or Pre–Late). Densities of seedlings by height class were highly skewed and did not conform to model assumptions, thus we analyzed frequencies (i.e., number of quadrats or grid cells with individuals of a height class). BAI (which varied from negative to positive) was analyzed using a linear model (LM); all other responses had zero as a lower bound and were analyzed using generalized linear models (GLMs) with a negative binomial distribution.
Models represented the overstory structure (OA) of each plot, its disturbance history, and interactions between OA and disturbance history. Although pre-treatment values were highly predictive of post-treatment responses in previous analyses of understory vegetation [44], lack of pre-treatment data for several regeneration variables precluded their inclusion in these models. We added terms sequentially to each model, beginning with OA at the time of the response or at the beginning of the interval. Disturbance-related terms and associated second-order interactions were then added in chronological order. For example, responses at the Late sampling date were evaluated using the following model structure:
Response ~ OA + Thin + Early fire + Late fire + OA × Thin + OA × Early fire +
OA × Late fire + Thin × Early fire + Thin × Late fire + Early fire × Late fire
For responses at the Early sampling date or Pre-Early interval, we omitted terms that included ′Late fire′, thus testing effects of disturbance until 2004. For the model of pre-treatment seedling frequency (Table 1), OA was the only model term. The significance of each term was assessed using an F-test for the LM and a chi-squared test for GLMs (i.e., Analysis of Deviance) with α = 0.05. All analyses were conducted using R (v. 4.0.0) [47] with the MASS package (v. 7.3–51.5) [48]. For each model, we present the goodness-of-fit statistic, R2. For the linear model, R2 is the percentage of variance explained, and is calculated as 1 minus the ratio of the residual sum of squares to the total sum of squares. For the GLMs, R2 is the model’s discrepancy from a perfect representation of the data and is calculated as 1 minus the ratio of the deviance (fitted vs. ‘perfect’ model) to the null deviance (‘intercept-only’ vs. ′perfect′ model) [49]. We also present the percentage of each model’s total explained variance or deviance attributable to each term; these percentages sum to 100% for each model. For GLMs, this percentage is the ratio of the improvement in deviance with each added term to the deviance of the full, fitted model [49]. The analysis script, data, and metadata are available online in Supplementary Materials.

3. Results

3.1. Overstory Dynamics: Early–Late Interval (2004–2015)

Post-treatment ingrowth (recruitment of saplings into the overstory) was recorded in 33% of plots (24 of 72), at a low average density (10 trees/ha; range: 0–70; Figure 3). Ingrowth density was not related to OA but was related to thinning and burning history. Ingrowth density was higher in thinned than in unthinned plots. Early burning (2004) enhanced this effect (significant Thin × Early-fire interaction; Table 2), but the effect of Late fire was not significant.
Post-treatment mortality greatly exceeded ingrowth (mean: 100 trees/ha; range: 0–510; Figure 3), especially in plots subjected to late fire. The mortality model represented the data well (R2 = 0.64; Table 2). Mortality was unaffected by thinning but was positively related to post-treatment OA. The relationship to OA was steeper in unburned plots than in those that burned early (significant OA × Early-fire interaction). Mortality was also significantly greater in plots that experienced late fire than in those that did not.
Basal area increment (BAI), the net growth of overstory trees, was slightly positive on average (mean: 0.2 m2/ha) but varied widely among plots (range: −14.9–6.8; Figure 3). BAI was unaffected by thinning, positively related to post-treatment OA in plots that burned early, and negatively related to OA in plots that did not burn (significant OA × Early-fire interaction) (Table 2). Late burning reduced BAI irrespective of previous treatment history.

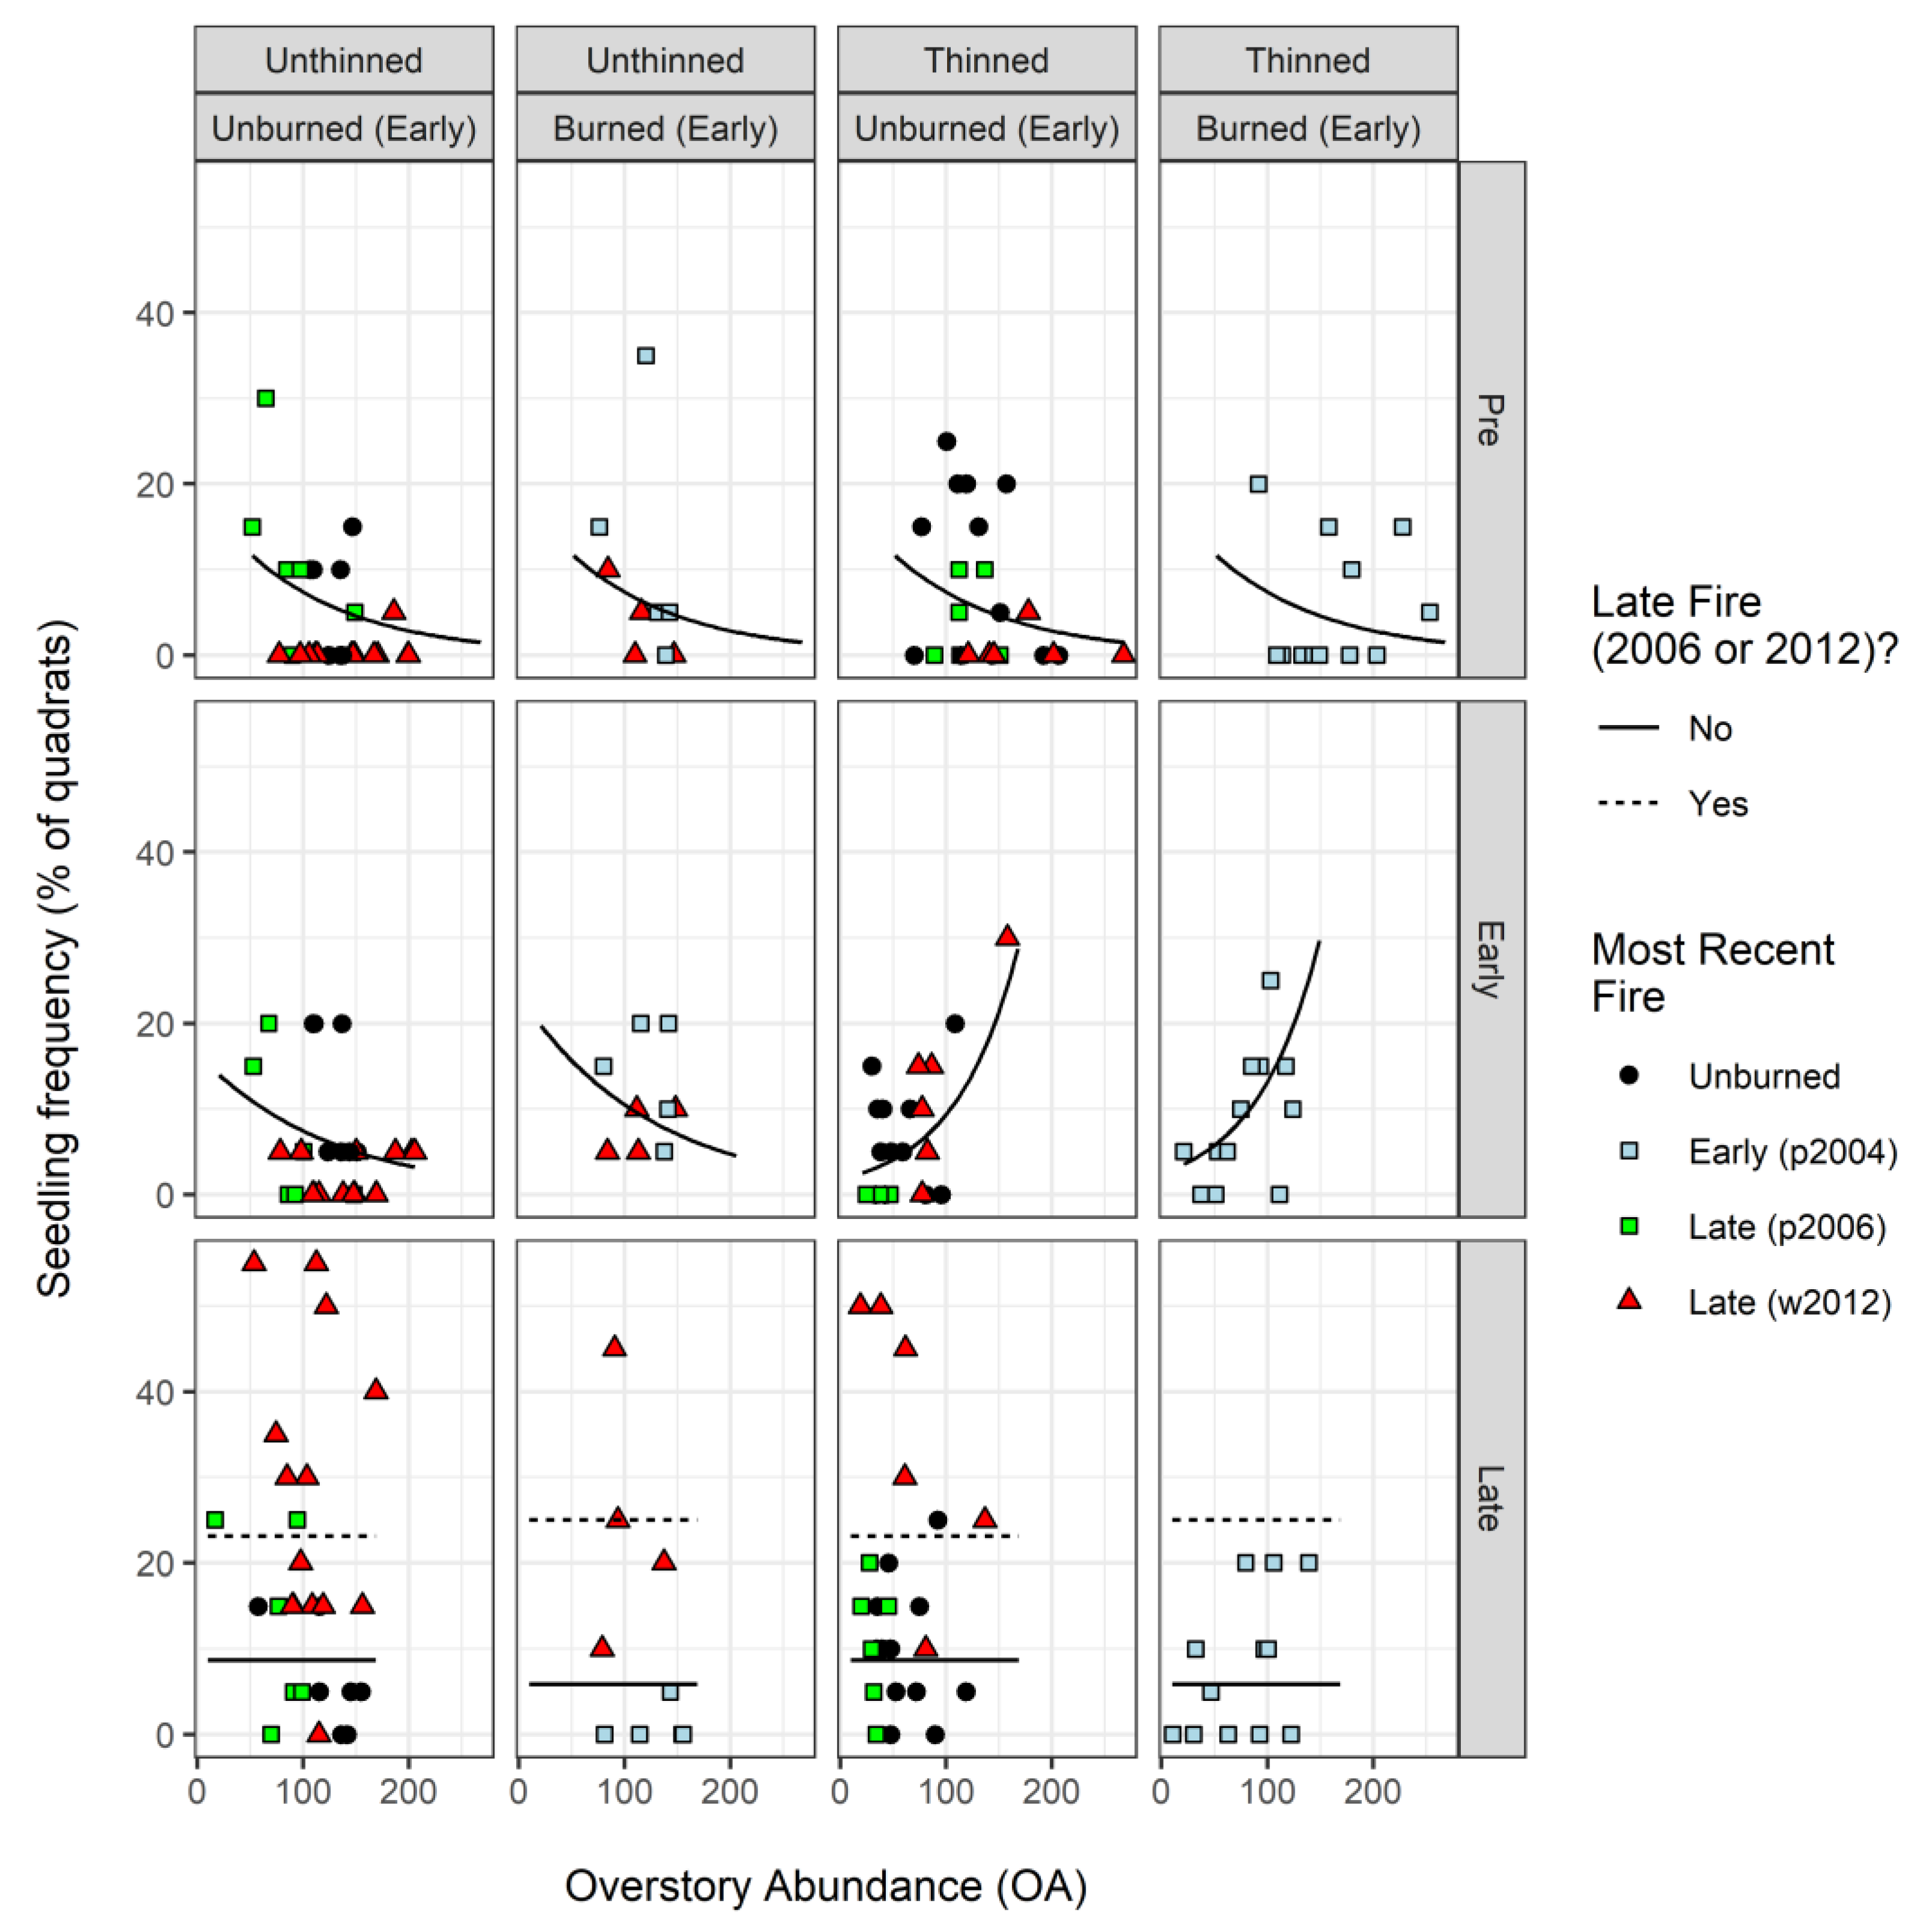
3.2. Frequency of Seedlings (<1 m Tall): Pre, Early, and Late Samples (2000/2001, 2005, 2015)

Prior to treatment, seedlings were present in 6% of quadrats (range: 0%–35%; Figure 4). Frequency declined with OA, although the overall model was weak (R2 = 0.07; Table 2).
In the Early sample, seedlings were present in 7% of quadrats (range: 0%–30%; Figure 4). Frequency declined with OA in unthinned plots (as it had before treatment) but increased with OA in thinned plots (significant OA × Thin interaction) (Table 2). Early burning enhanced seedling frequency.
In the Late sample, seedlings were present in more than twice as many quadrats (16%) as the Pre or Early samples (range: 0%–55%; Figure 4). Frequency was not related to OA or thinning (Table 2). Early burning reduced frequency (in contrast to its effect in the Early sample). Late burning increased frequency, with a greater effect in plots that were burned early (significant Early-fire × Late-fire interaction).

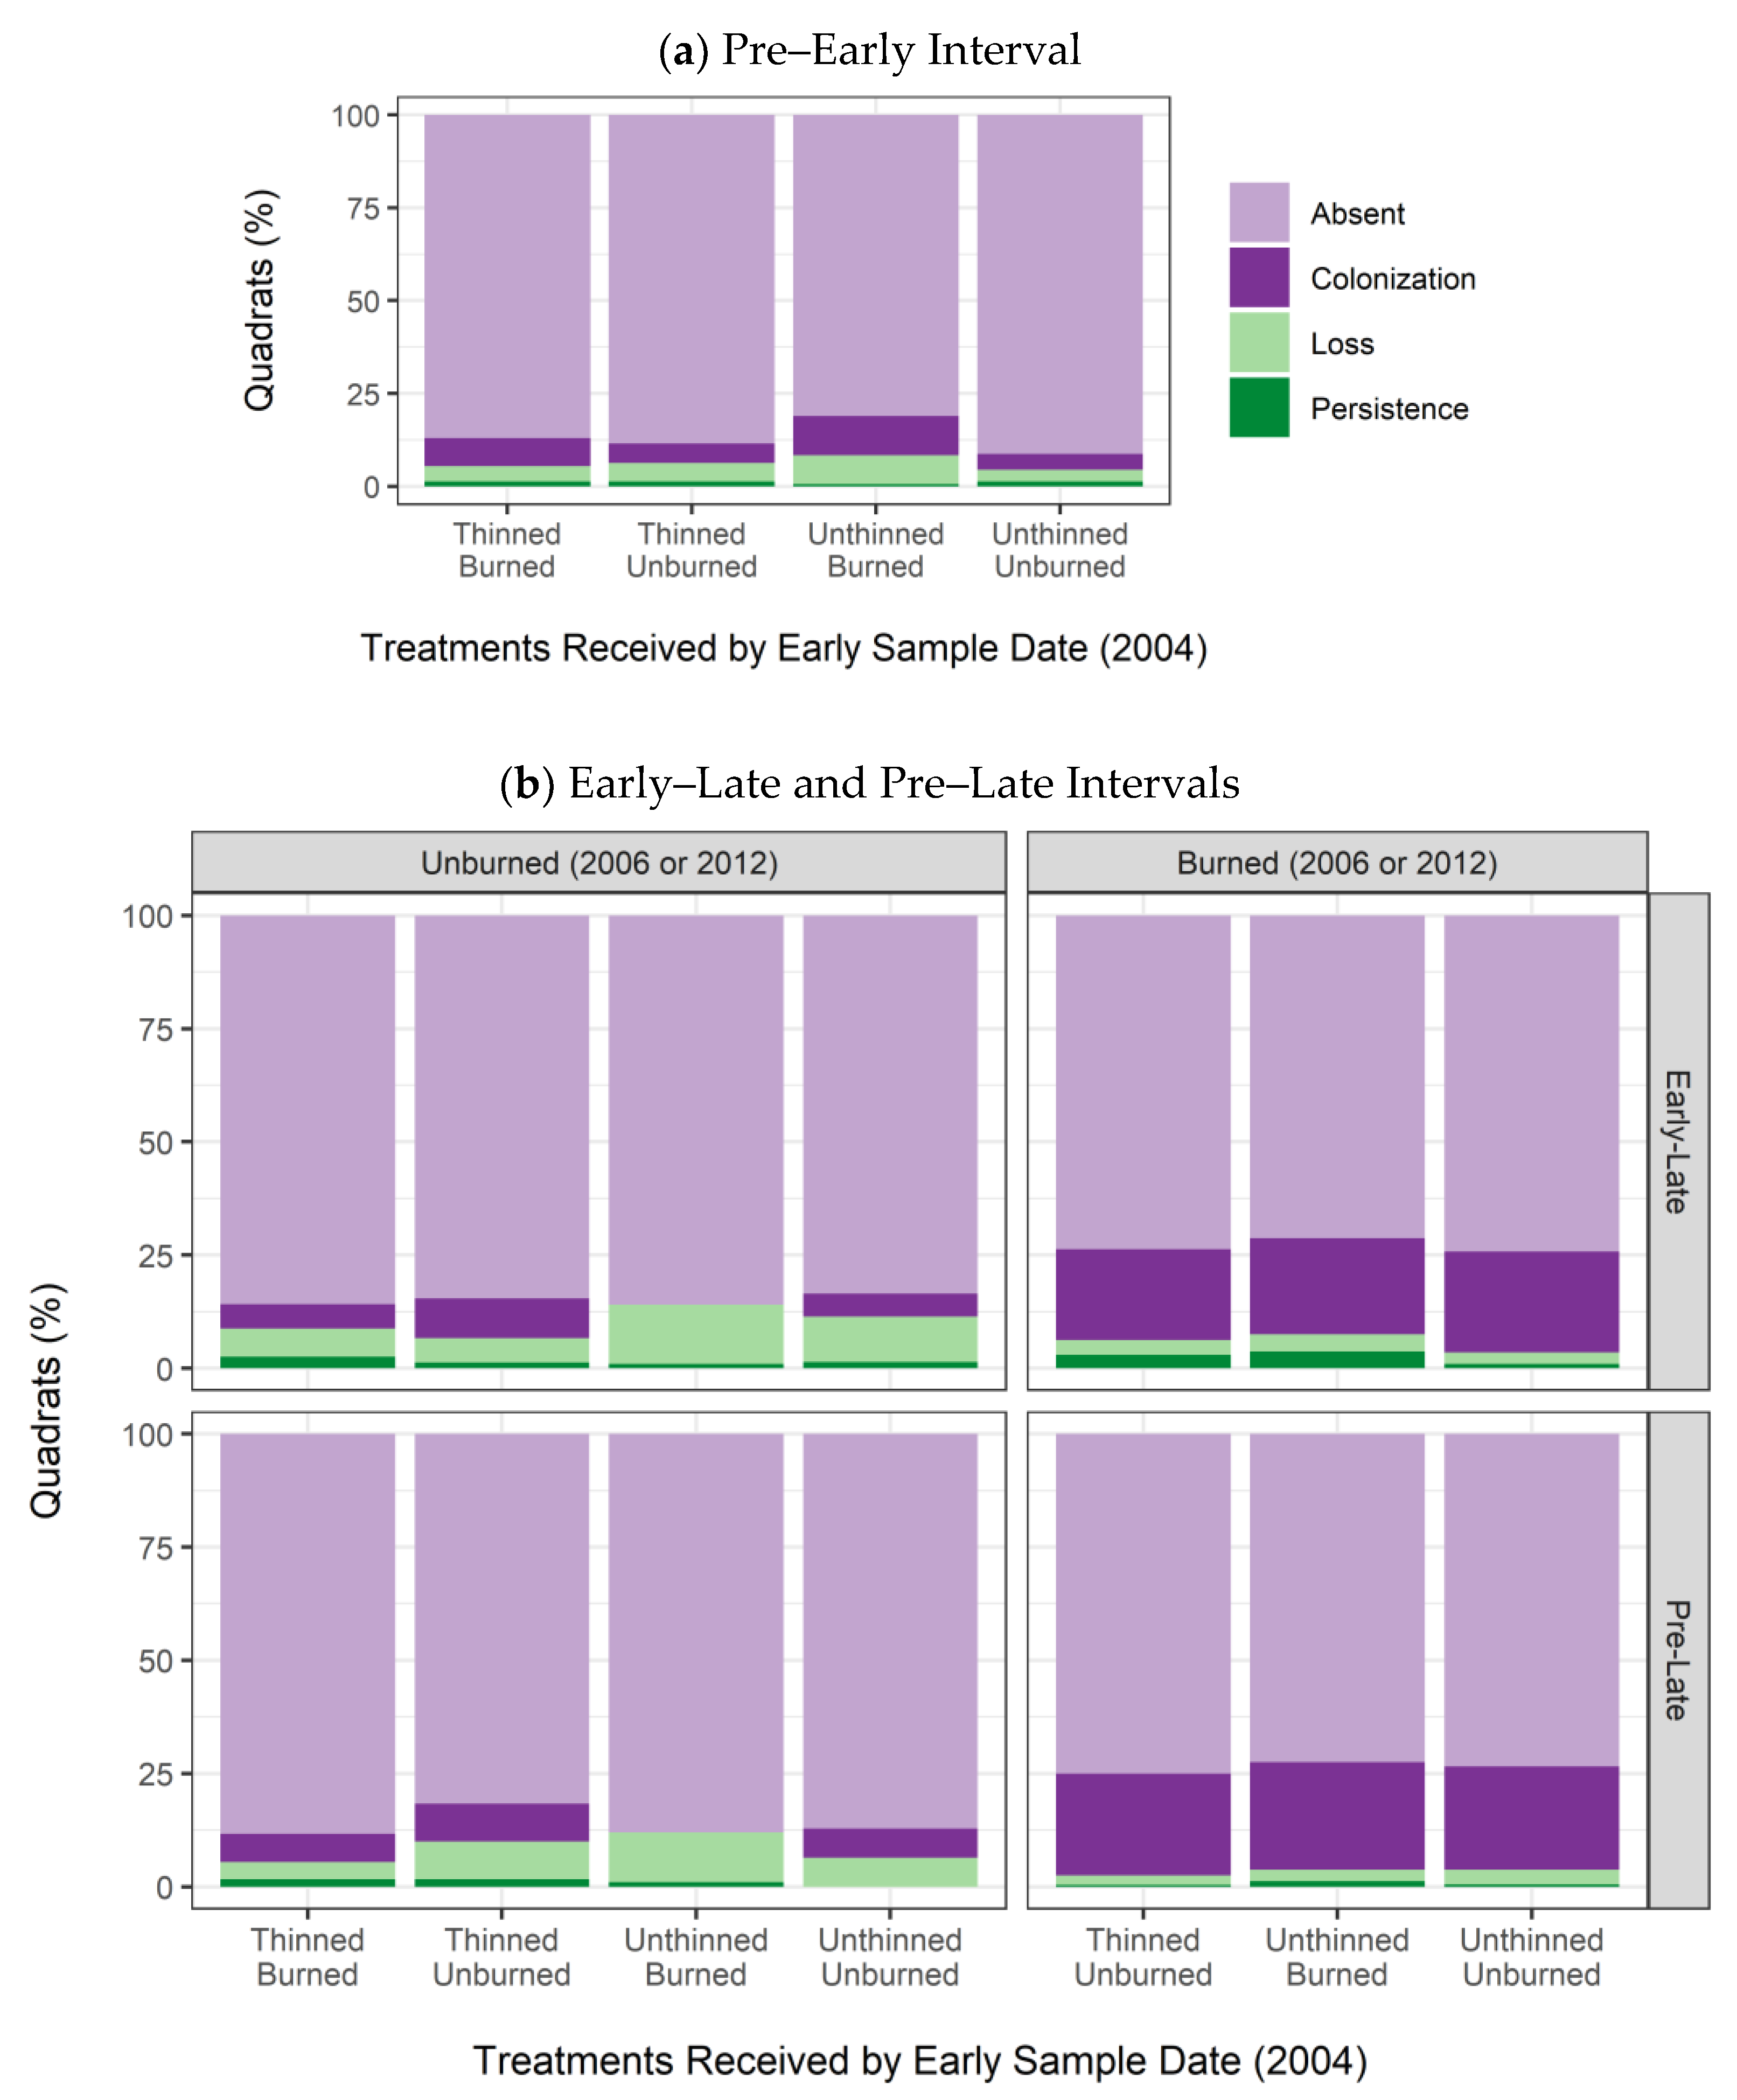
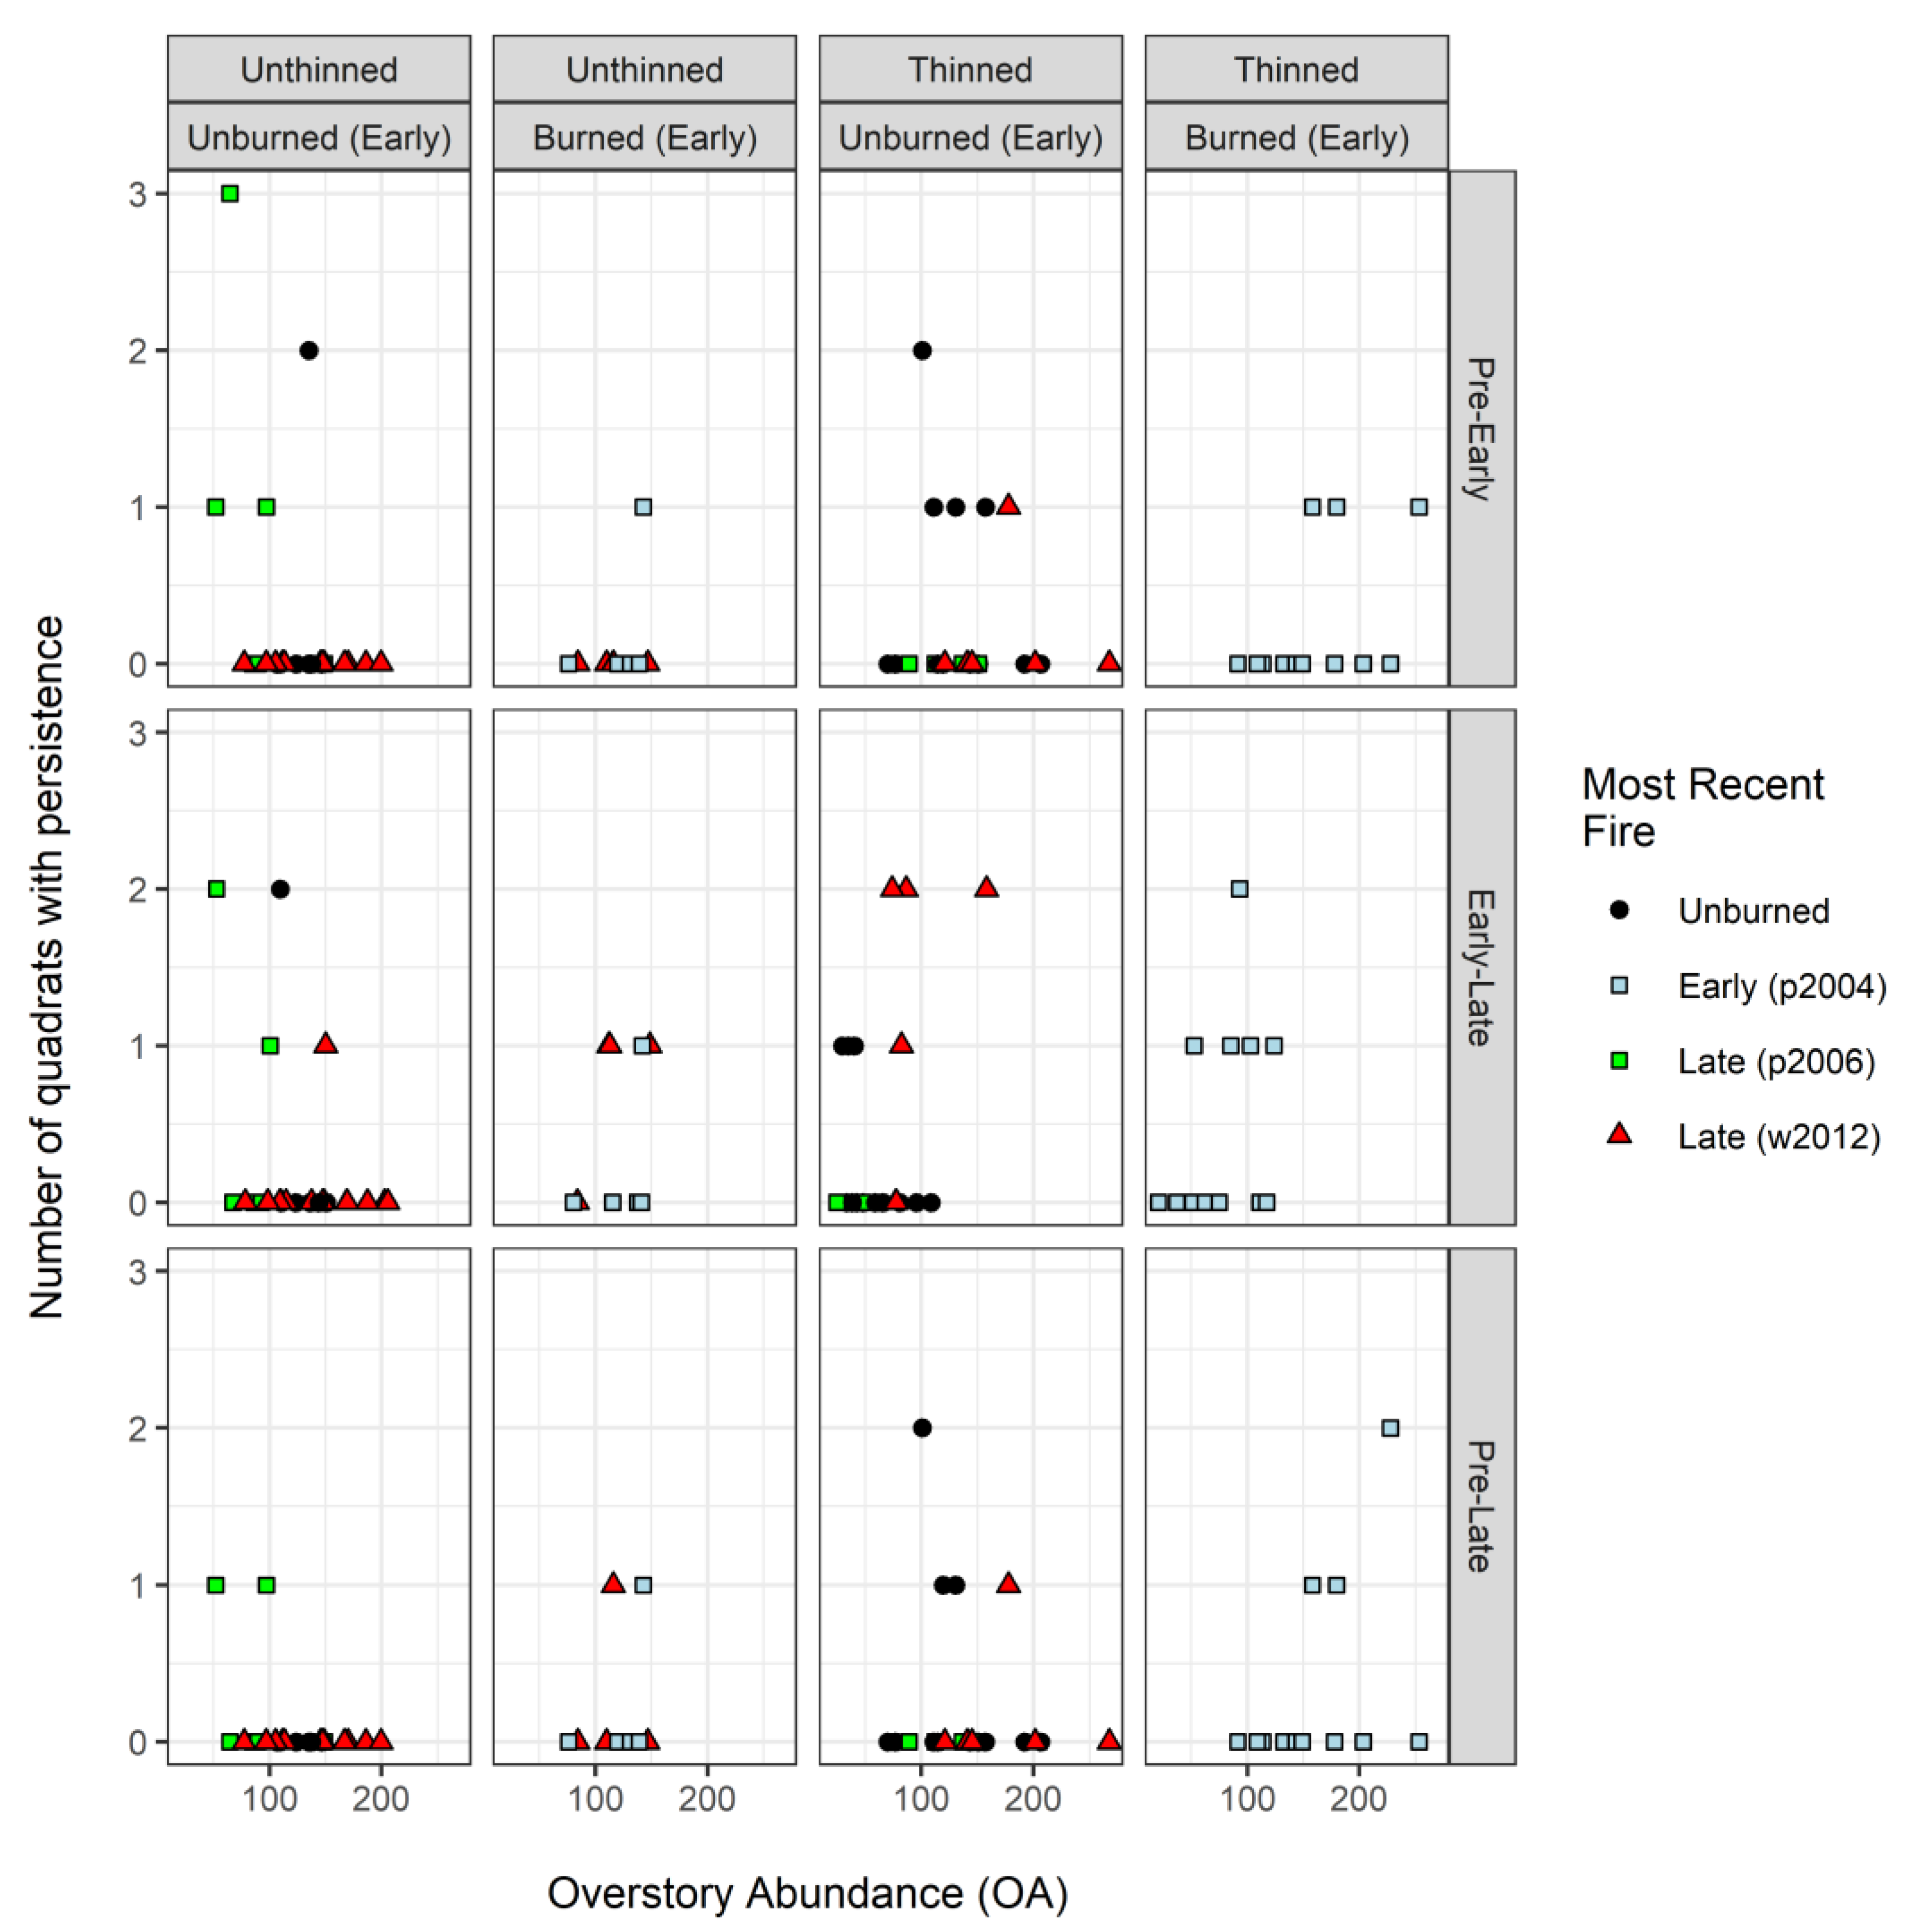
3.3. Regeneration Dynamics: Colonization and Persistence of Seedlings (<1 m Tall)

The vast majority of quadrats lacked conifer seedlings (<1 m tall) prior to and after treatment. Seedling colonization was often balanced by loss, and seedling persistence through or after thinning or burning was negligible (Figure 5). During the first interval (Pre–Early), seedlings colonized 0–6 quadrats per plot (Figure 6). As a percentage of available quadrats—those lacking seedlings at the start of the interval—colonization averaged 6% per plot (median: 5%; range: 0%–31%). Colonization declined with pre-treatment OA in unthinned plots but increased with OA in thinned plots (significant OA × Thin interaction; Table 2). Colonization was also greater in early-burned than in unburned plots.
Colonization was considerably more frequent during the second interval (Early–Late; range: 0–11 quadrats per plot; Figure 6). As a percentage of available quadrats, colonization averaged 15% per plot (median: 11%; range: 0%–55%). Colonization increased with post-treatment OA but was not affected by thinning (Table 2). Colonization was reduced by early burning (in contrast to the Pre–Early period) but greatly enhanced by late burning, particularly in plots that had burned earlier (significant Early-fire × Late-fire interaction).
Colonization over the combined interval (Pre–Late) was very similar to that in the second interval (range: 0–11 quadrats per plot; Figure 6). As a percentage of available quadrats, colonization averaged 15% per plot (median: 11%; range: 0%–55%). Colonization was unrelated to pre-treatment OA, but was slightly inhibited by thinning and early burning (Table 2). In contrast, late burning enhanced colonization, promoting greater colonization of unthinned than of thinned plots, and greater colonization of plots that had burned earlier (significant Thin × Late-fire and Early-fire × Late-fire interactions; Table 2).
Seedlings persisted less often than they colonized. During the Pre–Early interval, seedlings persisted in 0–2 quadrats per plot (Figure 7). As a percentage of available quadrats–those containing seedlings at the start of the interval–persistence averaged 23% (median: 0%; range: 0%–100%; Figure 7). Persistence was similarly low for the other intervals. Models (Table 2) failed to converge due to small sample sizes (n = 32–47 plots with seedlings present at the start of an interval) and low variance in responses (0–3 quadrats with persistence). However, data distributions suggest no relationships to OA, thinning, or burning history.

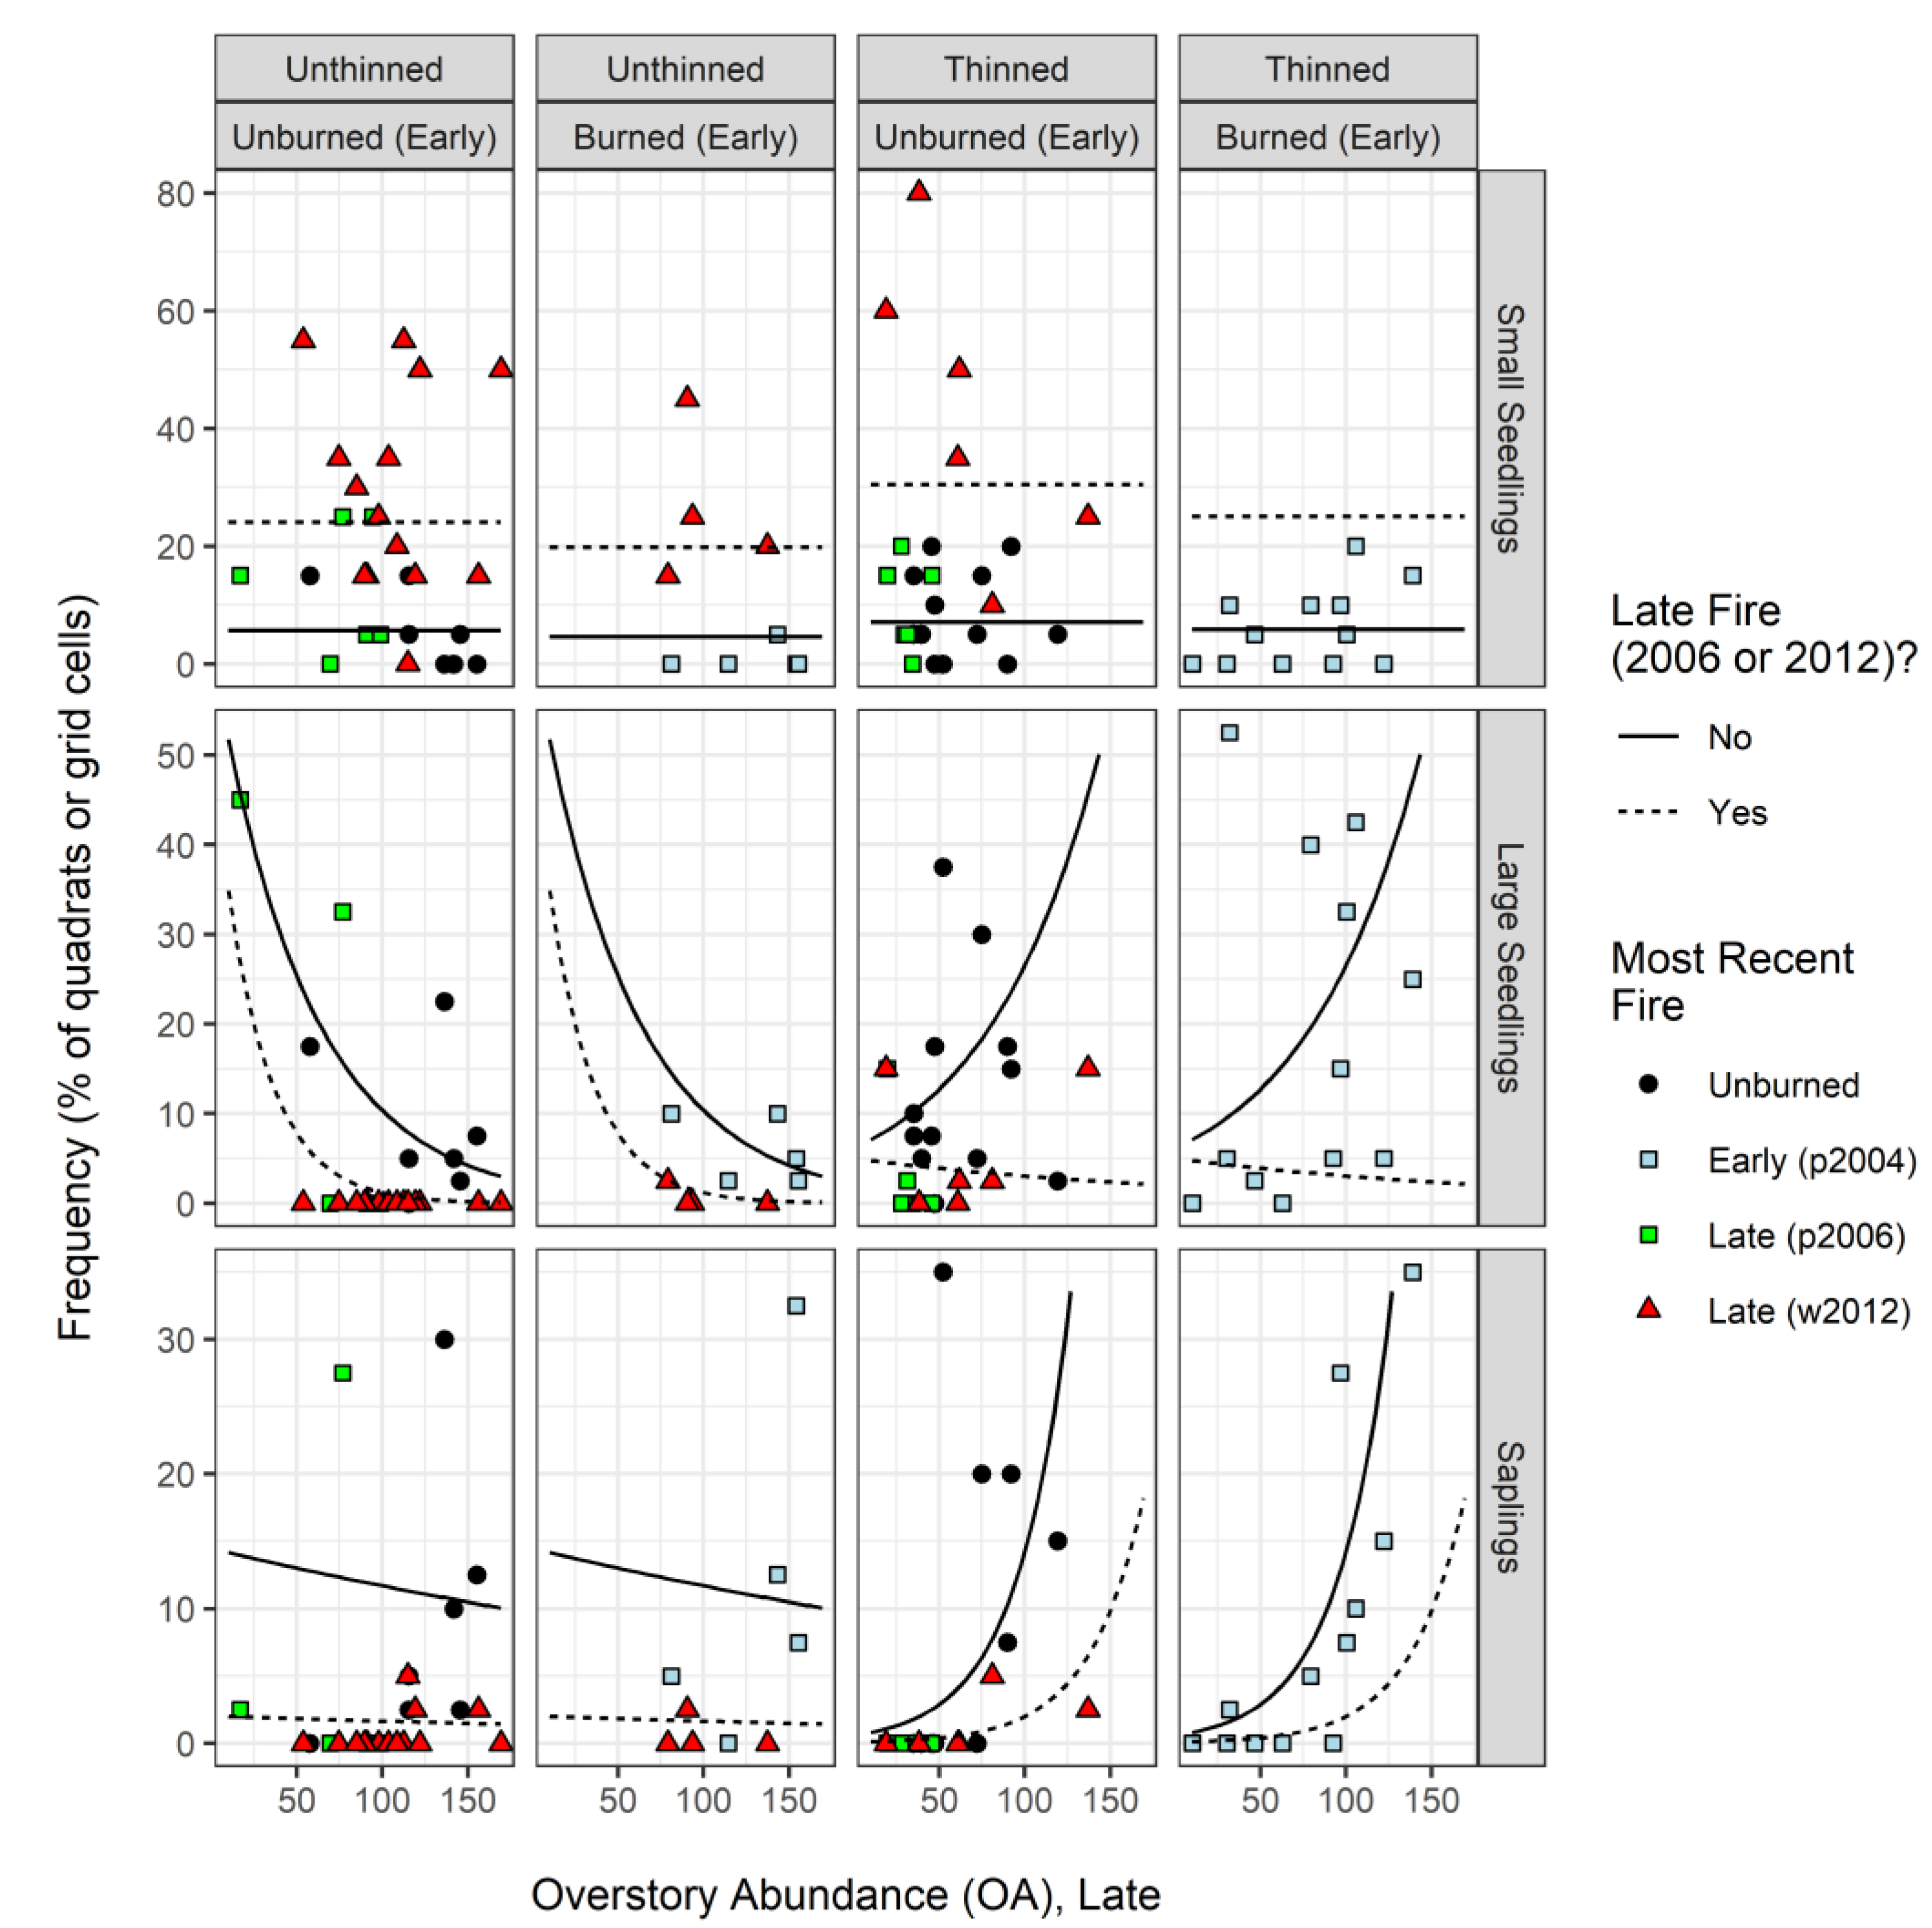
3.4. Frequency of Regeneration by Height Class: Late Sample (2015)

The vast majority (90%) of regeneration in the Late sample (2015) was Douglas-fir. For all height classes, frequency (% of quadrats or grid cells) and density (#/ha) were highly correlated, particularly in plots with low frequency (<20%; Figure 8). In plots with higher frequency, the range of small- and large-seedling densities varied substantially. In most plots, small seedlings (<0.3 m tall) were much denser than large seedlings (0.3–1.37 m tall) or saplings (>1.37 m tall, <7.6 cm DBH). Size class mean (and median) densities were 3188 (1500) stems/ha; 94 (10) stems/ha; and 44 (0) stems/ha, respectively.
In 2015, small seedlings were present in an average of 16% (range: 0%–80%) of the 20, 1-m2 quadrats per plot (Figure 9). Frequency was unrelated to OA, but was slightly greater in thinned than in unthinned plots, slightly reduced by early burning, and strongly enhanced by late burning (Table 2).
Large seedlings were present in an average of 8% (range: 0%–53%) of the 40, 5 × 5 m grid cells per plot (Figure 9). Frequency was unaffected by early burning. In contrast to small seedlings, frequency was consistently lower in plots that burned late than in those that did not. Relationships with OA were complex, varying with Thin and Late-fire treatments (significant OA × Thin and OA × Late-fire interactions; Table 2): absent late burning, frequency declined with OA in unthinned plots, but increased with OA in thinned plots. With late burning, frequency declined more steeply in unthinned than in thinned plots (Figure 9).
Similar to large seedlings, saplings were present in an average of 5% (range: 0%–35%) of grid cells (Figure 9), and their frequency was consistently reduced by late burning but unaffected by early burning. Relationships to OA were strong but dependent on thinning treatment: frequency declined with OA in unthinned plots but increased with OA in thinned plots (significant OA × Thin interaction; Table 2).

4. Discussion

Few experimental studies of restoration thinning or burning in dry forests have addressed the long-term dynamics of regenerating trees [15,50,51,52]. Long-term studies of regeneration are notably absent in forests of the Pacific Northwest (but see [53]). Our results, spanning more than decade, highlight the changing relationships of regenerating conifers to fuels treatments, residual forest structure, and wildfire. Relationships between regeneration frequency and overstory abundance (OA) shifted from weakly negative prior to treatment to strongly positive after thinning, both with and without early burning. Subsequent higher-severity burns severed these relationships, promoting abundant seedling recruitment while consuming previously established seedlings and saplings. Mortality greatly outpaced ingrowth, particularly in plots with greater OA (reflecting greater initial density), resulting in little increase in overstory density or canopy infilling. However, the recent pulse of seedling establishment could signal more rapid structural change in the future.

4.1. Seedling Relationships with Overstory Structure and Disturbance

We found that thinning temporarily altered the relationship between seedling frequency and overstory structure. Plots with greater OA tended to have fewer seedlings before thinning, but were colonized more frequently afterwards. Three factors may have contributed to this changing relationship. First, greater intensity of thinning in plots with greater initial density may have created more soil disturbance, enhancing seedbed conditions for germination of Douglas-fir [33,54]. Although plausible, this explanation runs counter to observations in other systems, wherein the primary effect of thinning is to add slash or fine litter that inhibits germination and early survival [19,20,21]. Further, thinned plots were yarded by helicopter, minimizing soil disturbance. Second, production of seed, which can persist for 1 to 2 years in the seedbed [33], may have been greater in plots with greater pre-treatment OA. Finally, seedling survival may have been higher in plots with greater pre-treatment OA—a legacy of greater overstory suppression of competing understory vegetation.
Early seedling responses to fire were also positive but, unlike thinning, interactions with overstory structure did not change: these remained negative in unthinned plots and positive in thinned plots. Despite the patchiness and low severity of early fires [46], burning appeared to stimulate recruitment, likely by enhancing conditions for germination (e.g., exposure of mineral soil, mineralization of soil nitrogen, and/or consumption of competing vegetation) [21,22,25,55,56].
By the Late sample, initially positive relationships with thinning and early fire were eclipsed by effects of later, higher-severity fires, which greatly elevated seedling frequencies. Although our Late-fire term does not distinguish between the 2006 prescribed fire and 2012 wildfire, plot data indicate considerably greater colonization after wildfire. Several factors may have contributed to this result. First, prescribed fire and wildfire occurred in different seasons (spring and fall, respectively). Fall burns tend to be more severe and less patchy [57,58,59], resulting in greater exposure of mineral soil, more complete consumption of plant cover, and greater seedling establishment [21,24,25,60]. Second, Late sampling occurred sooner after the wildfire than the prescribed fire (3 vs. 9 years), reducing the temporal window for mortality. Third, annual variation in seed production, temperature, and/or precipitation during these post-fire periods may have given rise to different patterns of germination and survival [28,35]. Future measurements that extend the temporal record on wildfire sites would help elucidate the relative importance of burn severity, time since fire, and weather for seedling establishment and persistence.

4.2. Responses to Thinning and Fire History among Regeneration Height Classes

In contrast to small seedlings, taller height classes of regeneration (large seedlings and saplings, sampled in 2015) have greater potential to influence forest structure and fire behavior in the future. However, it is more difficult to interpret their development relative to the disturbance histories of plots given the absence of pre- and early post-treatment data for these height classes. Small seedlings (<0.3 m tall) likely post-date Late-fire events, but it is less clear when larger seedlings (0.3–1.37 m tall) or saplings (>1.37 m tall) established. Estimates of height growth from the literature [61,62,63,64,65] suggest that large seedlings likely established after Early fire (2004), but saplings may comprise both pre- and post-treatment recruitment.
Large-seedling and sapling responses to thinning varied with overstory abundance (Late OA) and fire. In the absence of late burning, frequency declined with OA in unthinned plots, suggesting that overstory trees continue to suppress seedling establishment and growth. Conversely, frequency increased with OA in thinned plots, suggesting that thinning disturbance benefits establishment (similar to the colonization result), but that retained trees have a facilitative effect (e.g., moderating temperature or drought, or producing seeds) [15,21,54,66,67].
Large seedlings and saplings differed distinctly from small seedlings in their responses to fire. Early fire had a negative effect on small-seedling frequency, whereas higher-severity late fire had a strongly positive effect. In contrast, early fire had little effect on larger regeneration classes, but late fire greatly reduced their frequencies. The loss of larger, established seedlings and saplings to late fire is consistent with past studies of fire effects [21,53,60,68] and is a motivation for the use of repeated burning to achieve ecological and fuels-reduction objectives during restoration [25,69,70].

4.3. Implications of Fuels Treatments and Wildfire for Structural Change and Stand Development

We found little infilling of the overstory (ingrowth) more than a decade after fuels treatments. However, our results suggest that the nature, timing, and frequency of disturbance can affect both the rate and size structure of regeneration, and therefore can influence future trajectories of structural change. Saplings recruited to the overstory at low densities and in only one-third of the plots. In fact, the maximum rate of ingrowth over the 10-year, Early–Late interval was only 70 trees/ha. Tree mortality played a distinctly greater role in structural change, with an order of magnitude more trees dying than entering the overstory. Little of this mortality was expressed as a lagged response to early fire: most death after early burning was immediate and recorded in the Early sample [8]. In contrast, late burning caused significant tree death, particularly in wildfire plots, with rates of loss proportional to pre-fire density (greatest in unthinned, previously unburned plots). Although some mortality may be attributable to factors other than, or in addition to, fire (e.g., post-fire drought or beetle attack), field observations suggest that these factors played a minor role. Basal area increment (BAI) varied widely among plots, but was unaffected by thinning, indicating that greater rates of diameter growth in lower-density thinned plots were balanced by greater densities of slower-growing trees in unthinned plots.
Overall, long-term changes in overstory structure were driven, in large part, by mortality associated with later fires. In the absence of late burning, structural changes were more subtle, reflecting the growth of existing trees rather than recruitment of new stems. Late wildfire also played a key role in the long-term dynamics of understory conifers, shifting the size structure from a relatively sparse layer of taller stems to a denser cohort of newly established seedlings. Left untreated, the near-term consequences for forest structure will hinge on the balance among seedling survival, growth, and wildfire—processes that may be difficult to predict in a rapidly changing climate [40,71,72].

5. Conclusions

Mechanical thinning and prescribed burning reduce fire risk in the short term, but fuels-treatment longevity is a function of subsequent forest development, including regeneration. Long-term experiments are critical to assessing these dynamics and, thus, treatment longevity. In this study, thinning and prescribed fire interacted with overstory structure and wildfire to affect the spatial and temporal dynamics of regenerating conifers. Thinning shifted the relationship with overstory structure from weakly negative (inhibitory) to positive (facilitative) to neutral, although the strength of these relationships varied with time since treatment and subsequent disturbance. Low-severity prescribed fire stimulated regeneration in the short term, presumably by enhancing seedbed conditions for germination. However, the effect was transient. More than a decade after treatment (without subsequent disturbance), seedling and ingrowth densities remained low, suggesting that in this system managers do not need to be overly concerned about rapid regeneration or canopy infilling. Instead, fuels treatments can be tailored to other ecological objectives. However, we caution that additional work is required to determine whether our results can be extrapolated to systems dominated by other regenerating tree species or experiencing more severe prescribed fires.
Wildfires are becoming more prominent as climate change exacerbates summer drought, fuel conditions, and the susceptibility of dry forests to fire. Our results highlight the importance of studying how responses to planned management activities (fuels-reduction treatments) are altered by unplanned disturbances or, conversely, how responses to wildfire are mediated by treatments. In this experiment, low-severity wildfire erased legacies of pre-treatment overstory structure and post-treatment regeneration, slowing forest growth in the short term but triggering abundant recruitment. In the absence of additional disturbance or drought-related mortality of seedlings, wildfire may set the stage for rapid structural change and elevated fire risk in the future.
Although we were able to offer plausible explanations for the relationships of regeneration to fuels treatments and wildfire, our results also raise questions that warrant further study. For example, the possibility that thinning promoted regeneration by exposing mineral soil is not consistent with past studies or with the expectation that helicopter yarding minimizes ground disturbance. Further work is needed to understand this relationship. It is also not clear to what extent responses to prescribed fires (2004 and 2006) and wildfire (2012) reflect variation in fire severity, climatic factors, or time since disturbance. Demographic studies that incorporate quantitative measures of fire severity and climate could distinguish effects of disturbance from post-disturbance processes that affect seedling establishment and survival. Similarly, it is not clear whether regeneration responses to fuels treatment are mediated indirectly through effects on competing vegetation, or through legacies of overstory influence on understory. Incorporating metrics of pre- and post-treatment understory abundance into models of regeneration response may offer insight into the roles of competing vegetation.
In sum, our results suggest that fuels-treatment longevity hinges on complex interactions in space and time among stand-scale treatments, small-scale variation in forest structure, and unplanned disturbances. Managers must plan for and respond to this complexity, including future disturbances that are inevitable but unpredictable in timing and severity. Large-scale, long-term experiments in dry, fire-dependent forests are susceptible to these confounding disturbances but, in the context of adaptive management, offer unique opportunities for learning.

Supplementary Materials

The following are available online at https://www.mdpi.com/1999-4907/11/8/888/s1, R script (.R), data files (.csv), and metadata.

Author Contributions

Conceptualization, A.K.R. and J.D.B.; methodology, A.K.R. and J.D.B.; software, J.D.B.; formal analysis, A.K.R. and J.D.B.; investigation, A.K.R. and D.W.P.; resources, J.D.B., D.W.P., C.B.H.; data curation, A.K.R. and C.B.H.; writing—original draft preparation, A.K.R. and C.B.H.; writing—review and editing, J.D.B. and D.W.P.; visualization, J.D.B.; supervision, A.K.R., J.D.B., D.W.P., and C.B.H.; project administration, A.K.R.; funding acquisition, J.D.B. and C.B.H. All authors have read and agreed to the published version of the manuscript.

Funding

Initial funding for this experiment was provided by the USDA Forest Service Pacific Northwest Research Station and by the Joint Fire Science Program as part of the National Fire and Fire Surrogate Study (FFS). Funding for the current work was provided the Joint Fire Science Program (Project 13-1-04-4) and the National Institute of Food and Agriculture, USDA McIntire Stennis Program under accession number 1009087. A.K.R. acknowledges additional grant support from the Northwest Scientific Association and Sigma Xi.

Acknowledgments

Richy Harrod played a key role in the design and implementation of the Mission Creek Fire and Fire Surrogate Study and in early field measurements. We appreciate the efforts of our Mission Creek field crews who assisted with data collection. We thank Rae Mecka for her contributions to field logistics, review of historical data, and database management. We appreciate the helpful comments of three anonymous reviewers.

Conflicts of Interest

The authors declare no conflict of interest.

Appendix A

This appendix provides background information for the project. First, we illustrate how overstory abundance (OA), our primary measure of overstory structure, relates to the two variables that are combined in its calculation. Next, we demonstrate the variability among plots in pre-treatment vegetation structure and physical environment. Third, we demonstrate how thinning intensity and burn severity varied among plots. Finally, we provide detailed output from the linear and generalized linear models summarized in Table 2 in the main text.

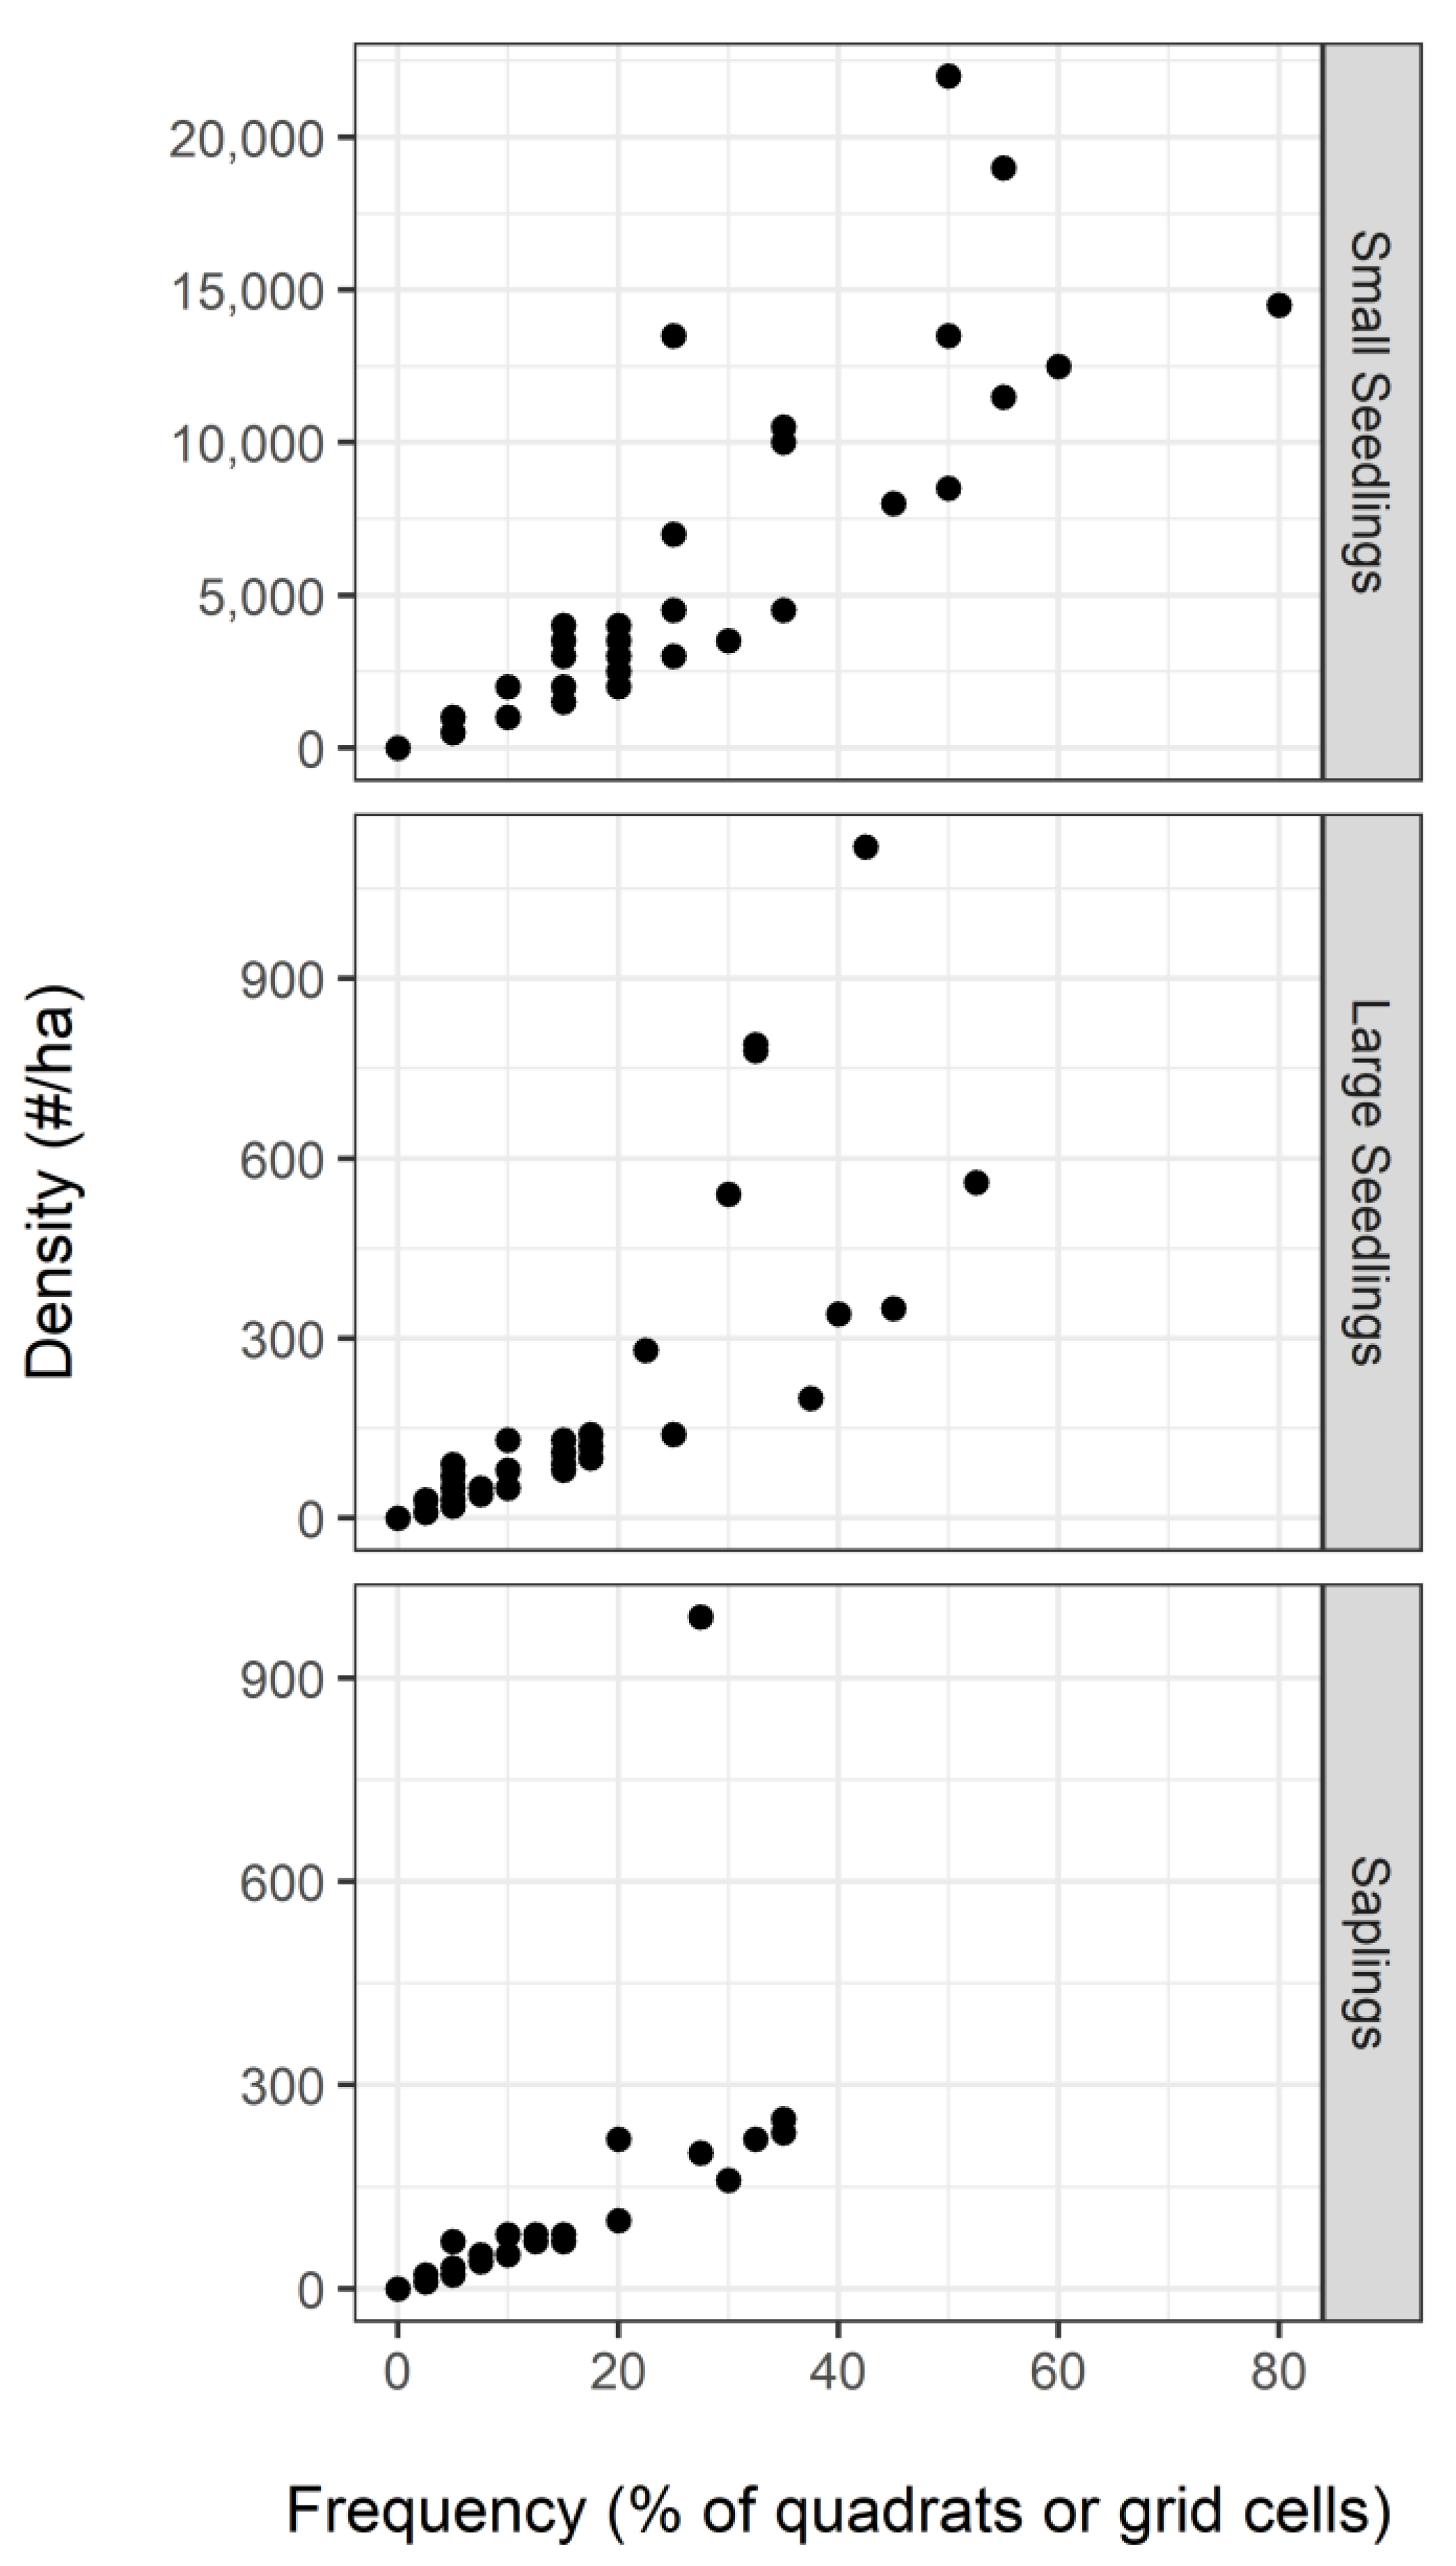
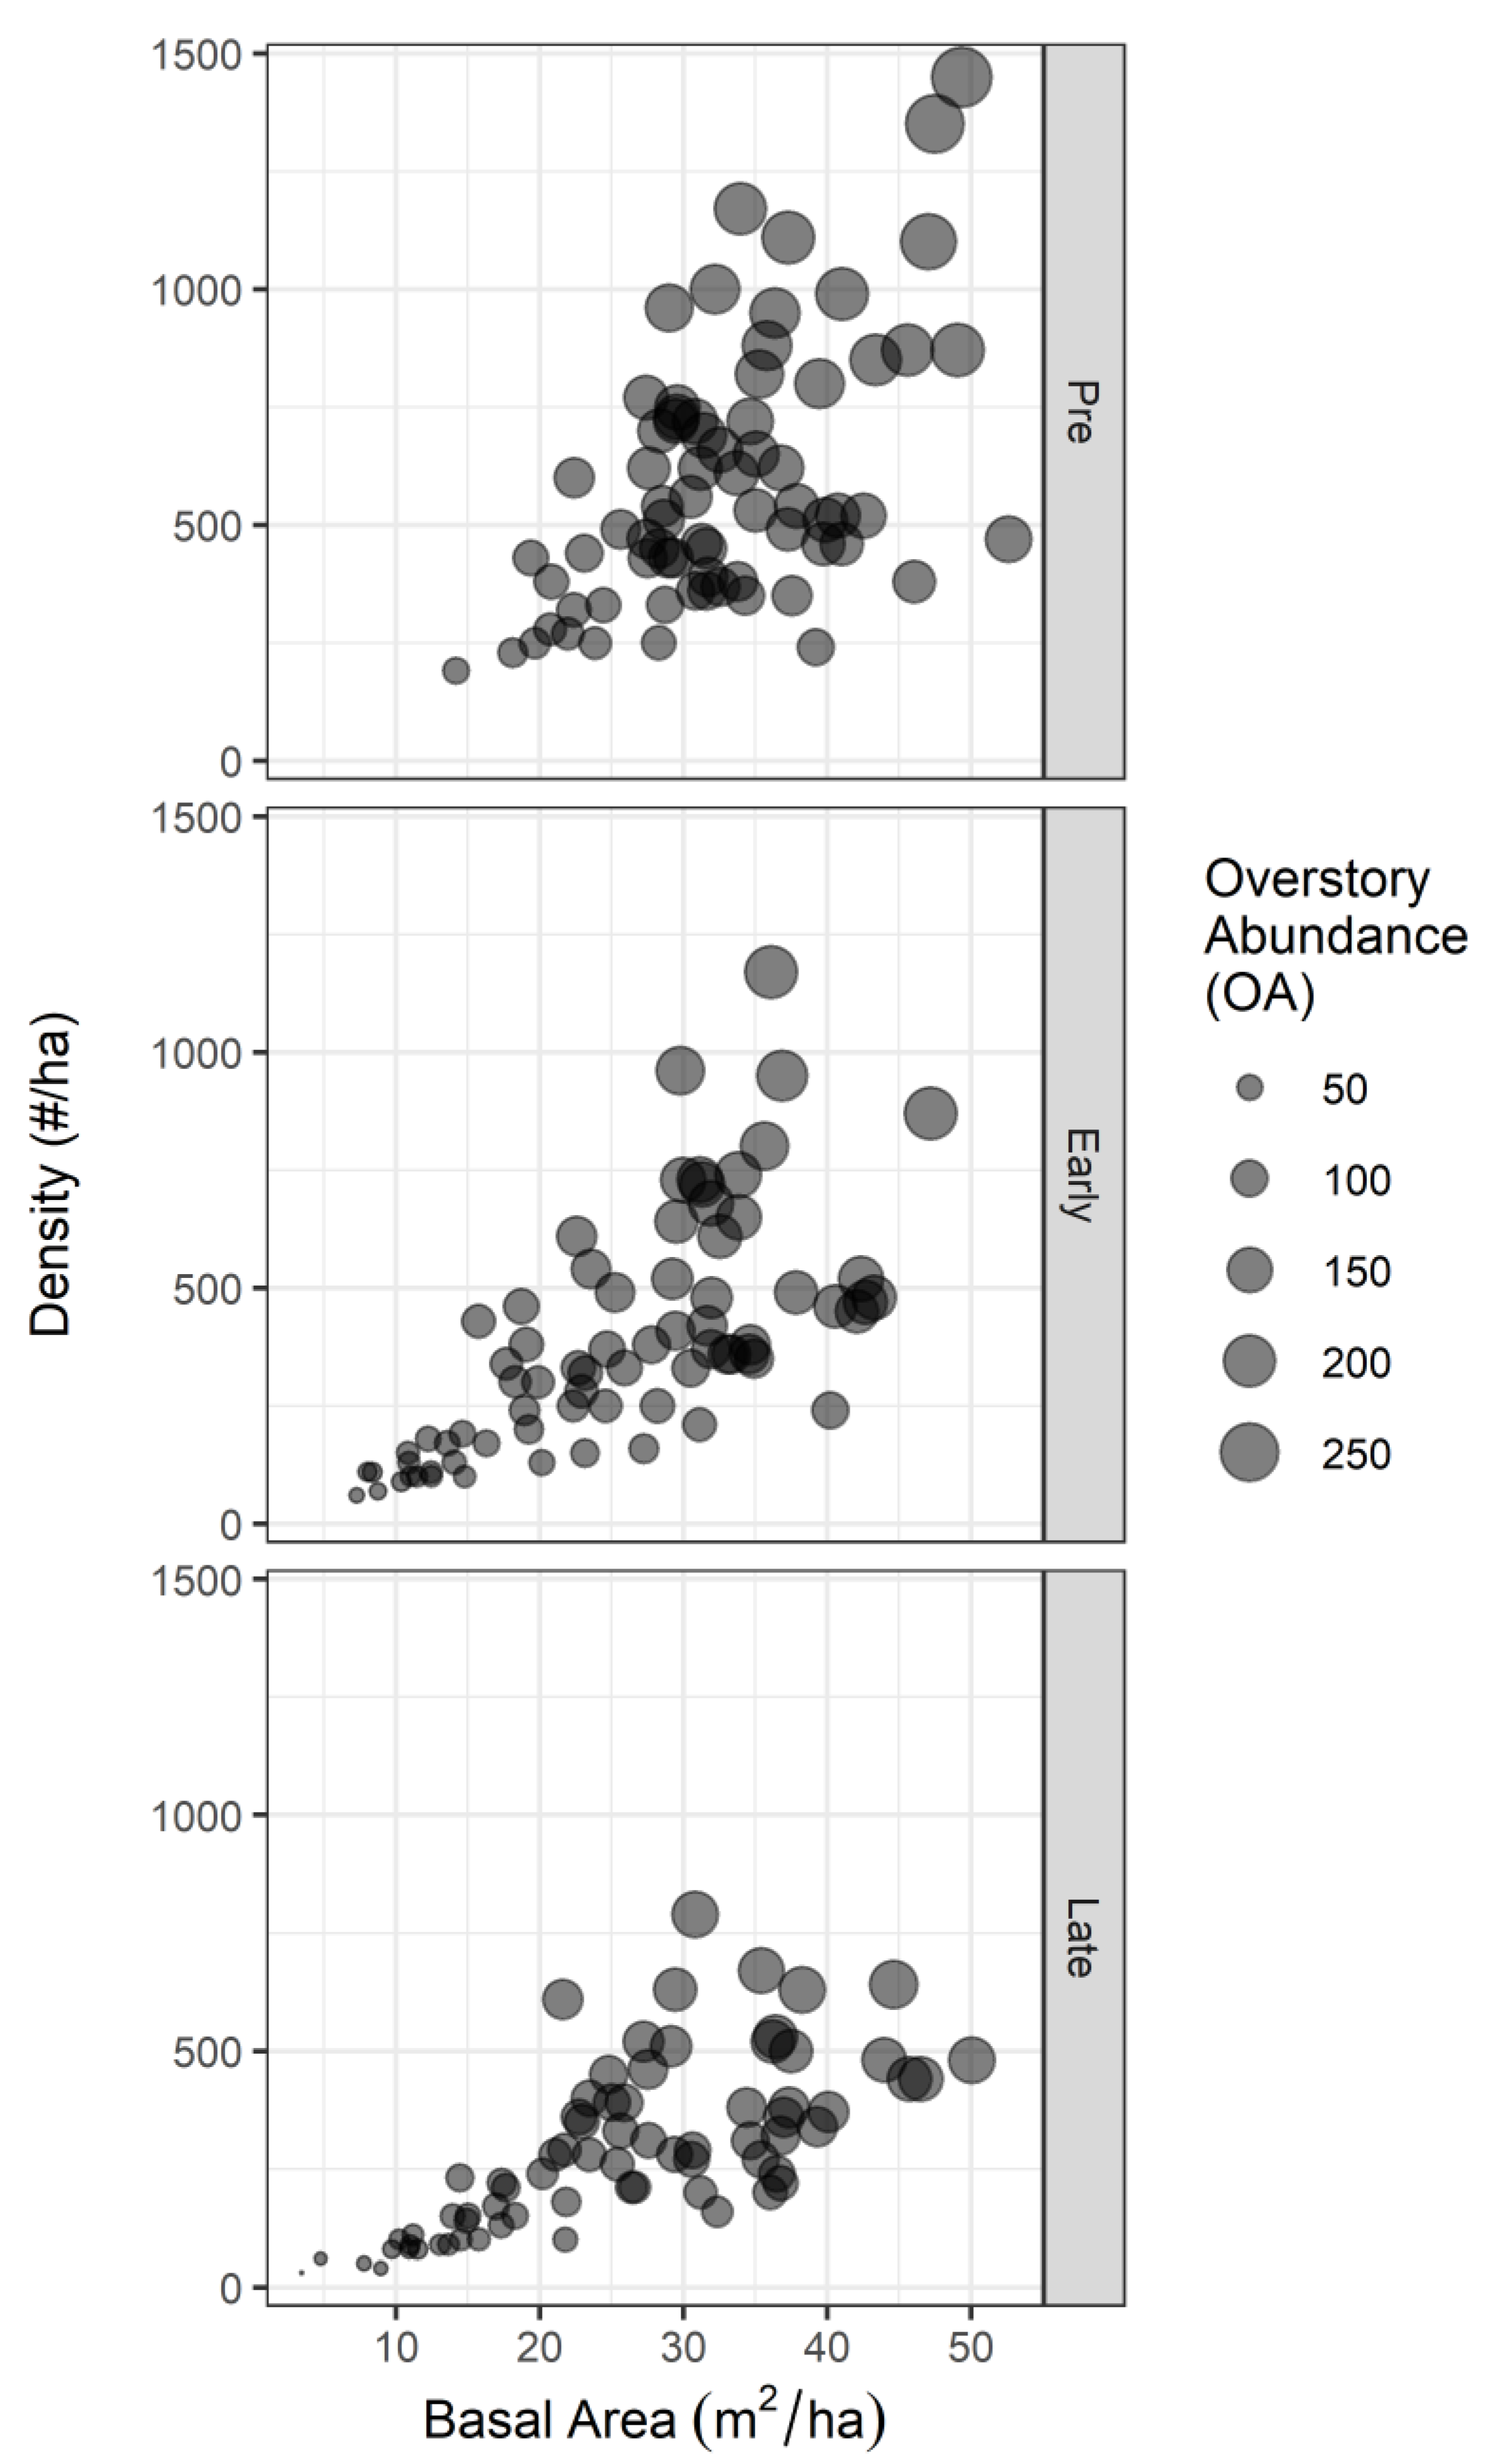
Appendix A.1. Relationships among Overstory Abundance (OA), Density, and Basal Area

Figure A1. Relationships among overstory abundance (OA) and its underlying components—density and basal area—among the 72 sample plots. OA, computed as √(density × basal area), served as our primary measure of overstory structure in models of regeneration response. Rows represent plot values at the three sampling dates: before treatment (Pre, 2000/2001) and the Early (2004) and Late (2015) post-treatment samples. Values of OA are proportional to symbol size (see legend).
Forests 11 00888 g0a1

Appendix A.2. Pre-Treatment Vegetation Structure and Environment

We conducted a Principal Components Analysis (PCA) to assess the variability among plots (n = 72) in pre-treatment vegetation structure and physical environment. Variables included initial tree density, basal area, OA, mean shrub cover, mean herb cover, and adjusted heat load [73]. The analysis revealed considerable spread in ordination space among plots representing the same experimental units (Figure A2).
Figure A2. First two principal components from a PCA of an environmental variables (aHLI; an index of heat load) and five pre-treatment vegetation variables: tree density (dens.plot_pre), basal area (BA.plot_pre), OA (OA.plot_pre), mean herb cover (Herb_pre), and mean shrub cover (Shrub_pre). Plots are color-coded by experimental unit.
Forests 11 00888 g0a2

Appendix A.3. Thinning Intensity and Burn Severity

Although we modeled thinning and burning treatments as categorical variables, thinning intensity and burn severity varied widely among plots.
Thinning intensity, expressed by the percentage change in OA over the Pre–Early interval, had a bimodal distribution, with a relatively narrow range of values in unthinned plots (−7.4% to 5.2%) and a much broader range in thinned plots (−77.1% to −29.5%) (Figure A3).
Figure A3. Histogram of percent change in overstory abundance (OA) from the pre-treatment (2000/2001) to Early post-treatment sample (2004). Plots are color-coded by thinning treatment.
Forests 11 00888 g0a3
Among 21 plots experiencing early fire (i.e., 2004 prescribed fires), burn severity—expressed by the percentage of trees charred within a plot—ranged from 3% to 97% (Figure A4a). Among 36 plots experiencing late fire (2006 prescribed fires or 2012 wildfire), burn severity ranged from 62% to 100% (Figure A4b). Three plots in prescribed-fire units did not experience early fire and were designated as unburned.
Figure A4. Histograms of percentage of live overstory trees within a plot showing charring after (a) Early fire (spring 2004 prescribed fires) and (b) Late fire (spring 2006 prescribed fires or fall 2012 wildfire). Char data were recorded in summer 2004 (Early fire) and summer 2015 (Late fire). Plots are color-coded by burn status (burned/unburned). These binary designations were used for ‘Early fire’ and ‘Late fire’ explanatory variables in applicable models (see Table 2, main text).
Forests 11 00888 g0a4

Appendix A.4. Detailed Model Results

Table A1. Contents of Table A2, Table A3, Table A4, Table A5 and Table A6, which contain detailed results of individual linear or generalized linear models. For a comparative summary of model results, see Table 2 (main text).
CategoryResponseSampling Date or IntervalTable
Overstory dynamicsIngrowthEarly–LateA2
MortalityEarly–LateA2
BAIEarly–LateA3
Seedling frequency (<1 m tall)SeedlingsPreA4
EarlyA4
LateA4
Seedling dynamicsColonizationPre–EarlyA5
Early–LateA5
Pre–LateA5
Regeneration frequency
(by height class)
Small seedlingsLateA6
Large seedlingsLateA6
SaplingsLateA6
Table A2. Model results for ingrowth and mortality, two aspects of overstory dynamics, during the Early to Late interval (n = 72 plots). Each response was analyzed with a GLM with a negative binomial distribution. Total deviance was 73.85 for ingrowth and 209.60 for mortality. Coefficients are not back-transformed to original units. Statistical significance was evaluated using a chi-square test of the deviance explained by the term (df = 1 for all terms).
ResponseTermCoefficientDeviancep
IngrowthIntercept−2.293
Overstory Abundance (OA)0.1460.130.723
Thin1.9995.560.018*
Early Fire (EF)−4.8172.060.151
Late Fire (LF)1.8493.360.067
OA x Thin−0.0591.890.169
OA x EF0.3981.170.28
OA x LF−0.1580.140.704
Thin x EF1.7614.080.043*
Thin x LF−2.4981.130.289
EF x LF−1.1250.420.515
MortalityIntercept0.643
Overstory Abundance (OA)0.09876.33<0.001***
Thin−2.4810.550.459
Early Fire (EF)0.1542.470.116
Late Fire (LF)0.02533.16<0.001***
OA x Thin0.1361.370.241
OA x EF−0.1079.990.002**
OA x LF0.0643.270.071
Thin x EF2.281.020.313
Thin x LF1.9452.950.086
EF x LF1.0292.320.128
* 0.01 < p ≤ 0.05, ** 0.001 < p ≤ 0.01, *** p ≤ 0.001.
Table A3. Model results for basal area increment (BAI), an aspect of overstory dynamics, during the Early to Late interval (n = 72 plots). BAI was analyzed with a LM. The total sums of squares for the model was 19.53.
TermCoefficientSums of SquaresF Valuep
Intercept0.236
Overstory Abundance (OA)−0.0081.226.00.017*
Thin−0.0550.211.00.317
Early Fire (EF)−0.20.864.20.045*
Late Fire (LF)0.0241.849.00.004**
OA x Thin0.0350.653.20.079
OA x EF0.0381.758.60.005**
OA x LF−0.0420.090.40.517
Thin x EF−0.3740.321.60.217
Thin x LF−0.140.070.30.559
EF x LF0.230.080.40.537
* 0.01 < p ≤ 0.05, ** 0.001 < p ≤ 0.01.
Table A4. Model results for seedling (<1 m tall) frequency at each sampling date (n = 72 plots). Each response was analyzed with a GLM with a negative binomial distribution. Total deviance was 73.76, 112.65, and 125.79 for the Pre, Early, and Late sampling dates, respectively. Coefficients are not back-transformed to original units. Statistical significance was evaluated using a chi-square test of the deviance explained by the term (df = 1 for all terms).
Sampling DateTermCoefficientDeviancep
PreIntercept1.339
Overstory Abundance (OA)−0.0955.030.025*
EarlyIntercept1.171
Overstory Abundance (OA)−0.0871.450.228
Thin−2.0531.560.212
Early Fire (EF)0.1664.70.030*
OA x Thin0.24916.68<0.001***
OA x EF0.0411.210.271
Thin x EF−0.4881.040.309
LateIntercept1.287
Overstory Abundance (OA)−0.0890.530.468
Thin−0.343.520.061
Early Fire (EF)−3.7646.060.014*
Late Fire (LF)0.40726.19<0.001***
OA x Thin0.0482.340.126
OA x EF0.1540.170.676
OA x LF0.0732.640.104
Thin x EF2.3110.480.488
Thin x LF0.0130.420.517
EF x LF2.3084.970.026*
* 0.01 < p ≤ 0.05, *** p ≤ 0.001.
Table A5. Model results for colonization, an aspect of seedling dynamics, during each sampling interval (n = 72 plots). Each response was analyzed with a GLM with a negative binomial distribution. Total deviance was 115.4, 132.8, and 139.2, for the Pre-Early, Early-Late, and Pre-Late intervals, respectively. Coefficients are not back-transformed to original units. Statistical significance was evaluated using a chi-square test of the deviance explained by the term (df = 1 for all terms). Results are not shown for persistence (another aspect of seedling dynamics) as those models did not converge.
Sampling IntervalTermCoefficientDeviancep
Pre-EarlyIntercept−2.527
Overstory Abundance (OA)−0.04610.440.001***
Thin−2.7210.630.426
Early Fire (EF)1.157.20.007**
OA x Thin0.19512.25<0.001***
OA x EF−0.022.250.134
Thin x EF−0.6891.450.228
Early-LateIntercept−2.394
Overstory Abundance (OA)−0.0376.220.013*
Thin−0.30700.99
Early Fire (EF)−38.48211.620.001***
Late Fire (LF)0.71229.79<0.001***
OA x Thin0.0952.60.107
OA x EF0.1480.750.387
OA x LF0.0543.580.059
Thin x EF36.5830.430.513
Thin x LF−0.2841.190.275
EF x LF36.8026.810.009**
Pre-LateIntercept−2.138
Overstory Abundance (OA)−0.0432.970.085
Thin−0.5834.870.027*
Early Fire (EF)−36.18512.030.001***
Late Fire (LF)0.61230.73<0.001***
OA x Thin0.0692.540.111
OA x EF0.1371.490.223
OA x LF0.04900.945
Thin x EF33.2670.780.377
Thin x LF−0.5133.970.046*
EF x LF34.6518.350.004**
* 0.01 < p ≤ 0.05, ** 0.001 < p ≤ 0.01, *** p ≤ 0.001.
Table A6. Model results for regeneration frequency by height class on the Late sampling date (n = 72 plots). Each response was analyzed with a GLM with a negative binomial distribution. The total deviance was 129.4 for small seedlings, 112.0 for large seedlings, and 105.6 for saplings. Coefficients are not back-transformed to original units. Statistical significance was evaluated using a chi-square test of the deviance explained by the term (df = 1 for all terms).
Height ClassTermCoefficientDeviancep
Small seedlingsIntercept1.196
Overstory Abundance (OA)−0.0930.540.461
Thin−0.3364.010.045*
Early Fire (EF)−3.5737.690.006**
Late Fire (LF)0.41132.87<0.001***
OA x Thin0.0371.040.307
OA x EF0.1510.090.77
OA x LF0.0922.190.139
Thin x EF2.1340.180.676
Thin x LF0.2340.060.802
EF x LF2.1623.810.051
Large seedlingsIntercept3.577
Overstory Abundance (OA)−0.1872.150.142
Thin−2.9977.630.006**
Early Fire (EF)0.9511.970.161
Late Fire (LF)−0.2218.010.005**
OA x Thin0.36516.65<0.001***
OA x EF−0.0880.350.552
OA x LF−0.2335.580.018*
Thin x EF−0.220.010.928
Thin x LF0.4640.330.568
EF x LF−1.1330.680.409
SaplingsIntercept−1.512
Overstory Abundance (OA)0.20715.76<0.001***
Thin−0.4847.520.006**
Early Fire (EF)0.7960.060.811
Late Fire (LF)1.8599.490.002**
OA x Thin0.2647.90.005**
OA x EF−0.0471.790.181
OA x LF−0.270.110.738
Thin x EF−1.71100.954
Thin x LF−2.6331.710.191
EF x LF−1.4690.80.371
* 0.01 < p ≤ 0.05, ** 0.001 < p ≤ 0.01, *** p ≤ 0.001.

References

  1. Everett, R.L.; Schellhaas, R.; Keenum, D.; Spurbeck, D.; Ohlson, P. Fire history in the ponderosa pine/Douglas-fir forests on the east slope of the Washington Cascades. For. Ecol. Manag. 2000, 129, 207–225. [Google Scholar] [CrossRef]
  2. Hessburg, P.F.; Smith, B.G.; Salter, R.B.; Ottmar, R.D.; Alvarado, E. Recent changes (1930s–1990s) in spatial patterns of interior northwest forests, USA. For. Ecol. Manag. 2000, 136, 53–83. [Google Scholar] [CrossRef]
  3. Hessburg, P.F.; Agee, J.K.; Franklin, J.F. Dry forests and wildland fires of the inland Northwest USA: Contrasting the landscape ecology of the pre-settlement and modern eras. For. Ecol. Manag. 2005, 211, 117–139. [Google Scholar] [CrossRef]
  4. Merschel, A.; Spies, T.; Heyerdahl, E. Mixed-conifer forests of central Oregon: Effects of logging and fire exclusion vary with environment. Ecol. Appl. 2014, 24, 1670–1688. [Google Scholar] [CrossRef] [PubMed]
  5. Haugo, R.; Zanger, C.; DeMeo, T.; Ringo, C.; Shlisky, A.; Blankenship, K.; Simpson, M.; Mellen-McLean, K.; Kertis, J.; Stern, M. A new approach to evaluate forest structure restoration needs across Oregon and Washington, USA. For. Ecol. Manag. 2015, 335, 37–50. [Google Scholar] [CrossRef] [Green Version]
  6. Brown, R.T.; Agee, J.K.; Franklin, J.F. Forest restoration and fire: Principles in the context of place. Conserv. Biol. 2004, 18, 903–912. [Google Scholar] [CrossRef]
  7. Martinson, E.J.; Omi, P.N. Fuel Treatments and Fire Severity: A Meta-Analysis; Res. Pap. RMRS-RP-103WWW; USDA/FS Rocky Mountain Res. Sta.: Fort Collins, CO, USA, 2013.
  8. Harrod, R.J.; Peterson, D.W.; Povak, N.A.; Dodson, E.K. Thinning and prescribed fire effects on overstory tree and snag structure in dry coniferous forests of the interior Pacific Northwest. For. Ecol. Manag. 2009, 258, 712–721. [Google Scholar] [CrossRef]
  9. McIver, J.D.; Stephens, S.L.; Agee, J.K.; Barbour, J.; Boerner, R.E.J.; Edminster, C.B.; Erickson, K.L.; Farris, K.L.; Fettig, C.J.; Fiedler, C.E.; et al. Ecological effects of alternative fuel-reduction treatments: Highlights of the national Fire and Fire Surrogate study (FFS). Int. J. Wildland Fire 2013, 22, 66–82. [Google Scholar] [CrossRef]
  10. Stephens, S.L.; McIver, J.D.M.; Boerner, R.E.J.; Fettig, C.J.; Joseph, B.; Hartsough, B.R.; Kennedy, P.L.; Schwilk, D.W. The effects of forest fuel-reduction treatments in the United States. BioScience 2012, 62, 549–560. [Google Scholar] [CrossRef] [Green Version]
  11. Prichard, S.J.; Povak, N.A.; Kennedy, M.C.; Peterson, D.W. Fuel treatment effectiveness in the context of landform, vegetation, and large, wind-driven wildfires. Ecol. Appl. 2020, 30, e02104. [Google Scholar] [CrossRef] [PubMed]
  12. Agee, J.K.; Skinner, C.N. Basic principles of forest fuel reduction treatments. For. Ecol. Manag. 2005, 211, 83–96. [Google Scholar] [CrossRef]
  13. Yocom, L. Fuel Treatment Longevity; Working Pap. No. 27; Ecological Restoration Institute: Flagstaff, AZ, USA, 2013. [Google Scholar]
  14. Agee, J.K. Fire Ecology of Pacific Northwest Forests; Island Press: Covelo, CA, USA, 1993. [Google Scholar]
  15. Francis, D.; Ex, S.; Hoffman, C. Stand composition and aspect are related to conifer regeneration densities following hazardous fuels treatments in Colorado, USA. For. Ecol. Manag. 2018, 409, 417–424. [Google Scholar] [CrossRef]
  16. Korb, J.E.; Fornwalt, P.J.; Stevens-Rumann, C.S. What drives ponderosa pine regeneration following wildfire in the western United States? For. Ecol. Manag. 2019, 454, 117663. [Google Scholar] [CrossRef]
  17. Stevens-Rumann, C.S.; Morgan, P. Tree regeneration following wildfires in the western US: A review. Fire Ecol. 2019, 15, 15. [Google Scholar] [CrossRef] [Green Version]
  18. Schwilk, D.W.; Keeley, J.E.; Knapp, E.E.; McIver, J.; Bailey, J.D.; Fettig, C.J.; Fiedler, C.E.; Harrod, R.J.; Moghaddas, J.J.; Outcalt, K.W.; et al. The national Fire and Fire Surrogate study: Effects of fuel reduction methods on forest vegetation structure and fuels. Ecol. Appl. 2009, 19, 285–304. [Google Scholar] [CrossRef] [PubMed]
  19. Haig, I.T.; Davis, K.P.; Weidman, R.H. Natural Regeneration in the Western White Pine Type; Tech. Bull. 767; USDA/FS, Northern Rocky Mountain Forest & Range Exp. Sta.: Washington, DC, USA, 1941.
  20. Gray, A.N.; Spies, T.A. Microsite controls on tree seedling establishment in conifer forest canopy gaps. Ecology 1997, 78, 2458–2473. [Google Scholar] [CrossRef]
  21. Zald, H.S.J.; Gray, A.N.; North, M.; Kern, R.A. Initial tree regeneration responses to fire and thinning treatments in a Sierra Nevada mixed-conifer forest, USA. For. Ecol. Manag. 2008, 256, 168–179. [Google Scholar] [CrossRef]
  22. Wan, S.; Hui, D.; Luo, Y. Fire effects on nitrogen pools and dynamics in terrestrial ecosystems: A meta-analysis. Ecol. Appl. 2001, 11, 1349–1365. [Google Scholar] [CrossRef]
  23. Neary, D.G.; Ryan, K.C.; DeBano, L.F. (Eds.) Wildland Fire in Ecosystems: Effects of Fire on Soils and Water; Gen. Tech. Rep. RMRS-GTR-42-vol.4; USDA/FS, Rocky Mountain Res. Sta.: Ogden, UT, USA, 2005; (revised 2008).
  24. Fowells, H.A.; Stark, N.B. Natural Regeneration in Relation to Environment in the Mixed Conifer Forest Type of California; Res. Pap. PSW-24; USDA/FS, Pacific SW Forest & Range Exp. Sta: Berkeley, CA, USA, 1965.
  25. Kilgore, B.M. The ecological role of fire in Sierran conifer forests: Its application to National Park management. Quat. Res. 1973, 3, 496–513. [Google Scholar] [CrossRef]
  26. Krannitz, P.G.; Duralia, T.E. Cone and seed production in Pinus ponderosa: A review. West. N. Am. Nat. 2004, 64, 208–218. [Google Scholar]
  27. Welch, K.R.; Safford, H.D.; Young, T.P. Predicting conifer establishment post wildfire in mixed conifer forests of the North American Mediterranean-climate zone. Ecosphere 2016, 7, e01609. [Google Scholar] [CrossRef]
  28. Littlefield, C.E. Topography and post-fire climatic conditions shape spatio-temporal patterns of conifer establishment and growth. Fire Ecol. 2019, 15, 34. [Google Scholar] [CrossRef]
  29. Tappeiner, J.; Helms, J. Natural regeneration of Douglas fir and white fir on exposed sites in the Sierra Nevada of California. Am. Midland Nat. 1971, 86, 358–370. [Google Scholar]
  30. North, M.; Hurteau, M.; Fiegener, R.; Barbour, M. Influence of fire and El Niño on tree recruitment varies by species in Sierran mixed conifer. For. Sci. 2005, 51, 187–197. [Google Scholar]
  31. Oakley, B.B.; North, M.P.; Franklin, J.F. Facilitative and competitive effects of a N-fixing shrub on white fir saplings. For. Ecol. Manag. 2006, 233, 100–107. [Google Scholar] [CrossRef]
  32. McDonald, P.M. Shelterwood Cutting in a Young-Growth, Mixed Conifer Stand in North Central California; Res. Pap. PSW-117; USDA/FS, Pacific SW Forest & Range Exp. Sta: Berkeley, CA, USA, 1976.
  33. Burns, R.M.; Honkala, B.H. (Eds.) Silvics of North America: Volume 1. Conifers, Agric. Handb. 654; USDA/FS: Washington, DC, USA, 1990.
  34. van Mantgem, P.J.; Stephenson, N.L.; Keeley, J.E. Forest reproduction along a climatic gradient in the Sierra Nevada, California. For. Ecol. Manag. 2006, 225, 391–399. [Google Scholar] [CrossRef]
  35. Povak, N.A.; Churchill, D.J.; Cansler, A.; Hessburg, P.F.; Kane, V.R.; Kane, J.; Lutz, J.A.; Larson, A.J. Wildfire severity and postfire salvage effects on long-term forest regeneration. Ecosphere. in press.
  36. Conard, S.G.; Radosevich, S.R. Growth responses of white fir to decreased shading and root competition by montane chaparral shrubs. For. Sci. 1982, 28, 309–320. [Google Scholar]
  37. Helms, J.A.; Tappeiner, J.C. Silviculture in the Sierras, Chapter 15. In Sierra Nevada Ecosystem Project, Final Report to Congress, Assessments and Scientific Basis for Management Options; Centers for Water and Wildland Resources, University of California: Davis, CA, USA, 1996; Volume 2. [Google Scholar]
  38. Varner, J.M., III; Hiers, J.K.; Ottmar, R.D.; Gordon, D.R.; Putz, F.E.; Wade, D.D. Overstory tree mortality resulting from reintroducing fire to long-unburned longleaf pine forests: The importance of duff moisture. Can. J. For. Res. 2007, 37, 1349–1358. [Google Scholar] [CrossRef]
  39. Hood, S.M. Mitigating Old Tree Mortality in Long-Unburned, Fire-Dependent Forests: A Synthesis; Gen. Tech. Rep. RMRS-GTR-238; USDA/FS, Rocky Mountain Res. Sta.: Fort Collins, CO, USA, 2010.
  40. Gill, N.S.; Jarvis, D.; Veblen, T.T.; Pickett, S.T.A.; Kulakowsky, D. Is initial post-disturbance regeneration indicative of longer-term trajectories? Ecosphere 2017, 8, e01924. [Google Scholar] [CrossRef] [Green Version]
  41. Hessburg, P.F.; Salter, R.B.; Richmond, M.B.; Smith, B.G. Ecological subregions of the interior Columbia basin, USA. Appl. Veg. Sci. 2000, 3, 163–180. [Google Scholar] [CrossRef]
  42. Agee, J.K.; Lehmkuhl, J.F. Dry Forests of the Northeastern Cascades Fire and Fire Surrogate Project Site, Mission Creek, Okanogan-Wenatchee National Forest; Res. Pap. PNW-RP-577; USDA/FS, Pacific Northwest Res. Sta.: Portland, OR, USA, 2009.
  43. Lillybridge, T.R.; Kovalchik, B.L.; Williams, C.K.; Smith, B.G. Field Guide for Forested Plant Association of the Wenatchee National Forest; Gen. Tech. Report PNW-GTR-359; USDA/FS, Pacific Northwest Res. Sta.: Portland, OR, USA, 1995.
  44. Rossman, A.K.; Halpern, C.B.; Harrod, R.J.; Urgenson, L.S.; Peterson, D.W.; Bakker, J.D. Benefits of thinning and burning for understory diversity vary with spatial scale and time since treatment. For. Ecol. Manag. 2018, 419, 58–78. [Google Scholar] [CrossRef]
  45. Harrod, R.J.; McRae, B.H.; Hartl, W.E. Historical stand reconstruction in ponderosa pine forests to guide silvicultural prescriptions. For. Ecol. Manag. 1999, 114, 433–446. [Google Scholar] [CrossRef]
  46. Agee, J.K.; Lolley, M.R. Thinning and prescribed fire effects on fuels and potential fire behavior in an eastern Cascades forest, Washington, USA. Fire Ecol. 2006, 2, 3–19. [Google Scholar] [CrossRef]
  47. R Core Team. R: A Language and Environment for Statistical Computing. R Foundation for Statistical Computing, Vienna, Austria. Available online: https://www.R-project.org (accessed on 12 June 2020).
  48. Venables, W.N.; Ripley, B.D. Modern Applied Statistics with S, 4th ed.; Springer: New York, NY, USA, 2002. [Google Scholar]
  49. Portugués, E.G. MSc in Big Data Analytics at Carlos III University of Madrid. Available online: https://bookdown.org/egarpor/PM-UC3M/ (accessed on 15 May 2020).
  50. Chiono, L.A.; O’Hara, K.L.; De Lasaux, M.J.; Nader, G.A.; Stephens, S.L. Development of vegetation and surface fuels following fire hazard reduction treatment. Forests 2012, 3, 700–722. [Google Scholar] [CrossRef] [Green Version]
  51. Fialko, K. Conifer Regeneration and Fuels Treatment Longevity in Dry Mixed-Conifer Forests of the Colorado Front Range. Master’s Thesis, Colorado State University, Fort Collins, CO, USA, 2018. [Google Scholar]
  52. Korb, J.E.; Stoddard, M.T.; Huffman, D.W. Effectiveness of restoration treatments for reducing fuels and increasing understory diversity in shrubby mixed-conifer forests of the Southern Rocky Mountains, USA. Forests 2020, 11, 508. [Google Scholar] [CrossRef]
  53. Harrod, R.J.; Fonda, R.W.; McGrath, M.K. Vegetation response to thinning and burning in a ponderosa pine forest, Washington. Northwest Sci. 2008, 82, 141–150. [Google Scholar] [CrossRef]
  54. Ryker, R.A. A Survey of Factors Affecting Regeneration of Rocky Mountain Douglas-Fir; Res. Pap. INT-174; USDA/FS: Ogden, UT, USA, 1975.
  55. Shearer, R.C. Silviculture. In Clearcutting and Fire in the Larch/Douglas-Fir Forests of Western Montana—A Multifaceted Research Summary; DeByle, N.V., Ed.; Gen. Tech. Rep. INT-99; USDA/FS, Intermountain Forest & Range Exp. Sta.: Ogden, UT, USA, 1981; pp. 27–31. [Google Scholar]
  56. Bonnet, V.H.; Schoettle, A.W.; Shepperd, W.D. Postfire environmental conditions influence the spatial pattern of regeneration for Pinus ponderosa. Can. J. For. Res. 2005, 35, 37–47. [Google Scholar] [CrossRef] [Green Version]
  57. Kerns, B.K.; Thies, W.G.; Niwa, C.G. Season and severity of prescribed burn in ponderosa pine forests: Implications for understory native and exotic plants. Ecoscience 2006, 13, 44–55. [Google Scholar] [CrossRef]
  58. Knapp, E.E.; Keeley, J.E. Heterogeneity in fire severity within early season and late season prescribed burns in a mixed-conifer forest. Int. J. Wildland Fire 2006, 15, 37–45. [Google Scholar] [CrossRef] [Green Version]
  59. Hatten, J.A.; Zabowski, D.; Ogden, A.; Thies, W. Soil organic matter in a ponderosa pine forest with varying seasons and intervals of prescribed burn. For. Ecol. Manag. 2008, 255, 2555–2565. [Google Scholar] [CrossRef]
  60. Westlind, D.J.; Kerns, B.K. Long-term effects of burn season and frequency on ponderosa pine forest fuels and seedlings. Fire Ecol. 2017, 13, 42–61. [Google Scholar] [CrossRef]
  61. Jones, J.R. Mixed Conifer Seedling Growth in Eastern Arizona; Res. Pap. RM-77; USDA/FS, Rocky Mountain Res. Sta.: Fort Collins, CO, USA, 1971.
  62. Strothman, R.O. Douglas-Fir Seedlings Plants by Four Methods…Results after 10 Years; Res. Note PSW-310; USDA/FS, Pacific SW Forest & Range Exp. Sta.: Berkeley, CA, USA, 1976.
  63. Hermann, R.K.; Lavender, D.P. Pseudotsuga menziesii. In Silvics of North America: Volume 1. Conifers; Burns, R.M., Honkala, B.H., Eds.; Agric. Handb. 654; USDA/FS: Washington, DC, USA, 1990. [Google Scholar]
  64. Schneider, W.G.; Knowe, S.A.; Harrington, T.B. Predicting survival of planted Douglas-fir and ponderosa pine seedlings on dry, low-elevation sites in southwestern Oregon. New For. 1998, 15, 139–159. [Google Scholar] [CrossRef]
  65. Rose, R.; Ketchum, J.S.; Hanson, D.E. Three-year survival and growth of Douglas-fir seedlings under various vegetation-free regimes. For. Sci. 1999, 45, 117–126. [Google Scholar]
  66. Krauch, H. Management of Douglas-Fir Timberland in the Southwest; Pap. 21; USDA/FS, Rocky Mountain Forest & Range Exp. Sta.: Fort Collins, CO, USA, 1956.
  67. Ryker, R.A.; Potter, D.R. Shade Increases First-Year Survival of Douglas-Fir Seedlings; Res. Pap. INT-119; USDA/FS: Ogden, UT, USA, 1970.
  68. Steinberg, P.D. Pseudotsuga menziesii var. glauca. In Fire Effects Information System; [Online]; USDA/FS, Rocky Mountain Res. Sta. Fire Sci. Lab., 2002. Available online: https://www.fs.fed.us/database/feis/plants/tree/psemeng/all.html (accessed on 10 May 2020).
  69. Keifer, M.B.; van Wagtendonk, J.W.; Buhler, M. Long-term surface fuel accumulation in burned and unburned mixed-conifer forests of the central and southern Sierra Nevada, CA, USA. Fire Ecol. 2006, 2, 53–72. [Google Scholar] [CrossRef]
  70. North, M.; Innes, J.; Zald, H. Comparison of thinning and prescribed fire restoration treatments to Sierran mixed-conifer historic conditions. Can. J. For. Res. 2007, 37, 331–342. [Google Scholar] [CrossRef]
  71. Rother, M.T.; Veblen, T.T.; Furman, L.G. A field experiment informs expected patterns of conifer regeneration after disturbance under changing climate conditions. Can. J. For. Res. 2015, 45, 1607–1616. [Google Scholar] [CrossRef]
  72. Rother, M.T.; Veblen, T.T. Limited conifer regeneration following wildfires in dry ponderosa pine forests of the Colorado Front Range. Ecosphere 2016, 7, e01594. [Google Scholar] [CrossRef]
  73. Warren, R.J. A test of temperature estimation from solar irradiation and a simple statistical method to integrate elevation into prediction models. Castanea 2010, 75, 67–77. [Google Scholar] [CrossRef]
Figure 1. Geographical distribution and fuels treatments of the 12 experimental units. Treatments included factorial combinations of thinning and prescribed burning in either 2004 or 2006. Treatments were randomly assigned among units with some re-allocation [42]. ‘Untreated’ refers to units that were neither thinned nor prescribed burned. The stippled polygon is the area affected by the 2012 Wenatchee Complex wildfire. Each unit contains six sample plots.
Forests 11 00888 g001
Figure 2. Schematic illustration of the diverse and changing histories of fuels treatments (thinning and prescribed burning) and wildfire among the 72 sample plots. Values (n) are the numbers of plots sampled ‘Early’ (overstory in 2004, regeneration in 2005) or ‘Late’ (2015). Hatching denotes the history of thinning (unthinned or thinned in 2002/2003). Colors denote the type and timing of fire: no fire, ’Early’ prescribed fire (2004, blue), ‘Late’ prescribed fire (2006, green), and ‘Late’ wildfire (2012, red). Multiple colors in the Late sample indicate repeated burning of some plots.
Forests 11 00888 g002
Figure 3. Measures of overstory dynamics after treatment (Early–Late interval, 2004–2015). Rows differentiate response variables (ingrowth, mortality, and basal area increment [BAI], as defined in Table 1). Points represent plots with different overstory abundance (OA) values in the Early sample and different histories of thinning and fire (columns and symbols). Columns distinguish thinning and Early (2004) prescribed-fire treatments. Symbols represent the most recent fire (′p′ for prescribed fire and ′w′ for wildfire). Dashed and solid lines are modeled relationships for the Late-fire treatment based on statistically significant terms (Table 2). For ingrowth, OA and the Late-fire treatment were not significant, thus single horizontal lines are shown.
Forests 11 00888 g003
Figure 4. Frequency of seedlings (<1 m tall) in the Pre (2000/2001), Early (2005), and Late (2015) samples. Values are % of quadrats per plot. Plot values of OA vary by sampling date; horizontal lines indicate no relationship with OA. See Figure 3 for other details and Table 2 for statistical results.
Forests 11 00888 g004
Figure 5. Percentage of quadrats displaying four types of seedling dynamics (absence, colonization, loss, or persistence) in the (a) Pre–Early and (b) Early–Late and Pre–Late intervals. Each quadrat was assessed for seedling presence/absence at the start and end of the interval. ′Absent′ represents quadrats that had no seedlings at either date. ′Colonization′ represents quadrats lacking seedlings at the start but with one or more seedlings at the end of the interval. ‘Loss’ represents quadrats with one or more seedlings at the start but no seedlings at the end of the interval. ′Persistence′ represents quadrats with one or more seedlings at both dates. See Section 2.3 for additional details. Note that no thinned plots experienced both Early and Late fires.
Forests 11 00888 g005
Figure 6. Colonization of seedlings (<1 m tall) expressed as the number of quadrats per plot into which seedlings recruited during a sampling interval. Rows distinguish Pre–Early, Early–Late, and Pre–Late intervals. For each interval, plot values of OA represent the start of the interval. See Figure 3 for other details and Table 2 for statistical results.
Forests 11 00888 g006
Figure 7. Persistence of seedlings (<1 m tall) expressed as the number of quadrats per plot in which seedlings were present at both the start and end of the sampling interval. Rows distinguish Pre–Early, Early–Late, and Pre–Late intervals. For each interval, plot values of OA represent the start of the interval. See Figure 3 for other details; modeled results are not shown (lack of convergence due to low sample sizes).
Forests 11 00888 g007
Figure 8. Density versus frequency of small seedlings, large seedlings, and saplings in the Late sample (2015). Note the differences in scale of the vertical axes.
Forests 11 00888 g008
Figure 9. Frequency of small seedlings (<0.3 m tall), large seedlings (0.3–1.37 m tall), and saplings (>1.37 m tall, <7.6 cm DBH) in the Late (2015) sample. Values are the percentage of 20 quadrats per plot (small seedlings) or percentage 40 grid cells per plot (large seedlings and saplings). For each interval, plot values of OA represent the start of the interval. See Figure 3 for other details and Table 2 for statistical results. Note the differences in scale of the vertical axes.
Forests 11 00888 g009
Table 1. Details of response variables used to assess relationships with overstory structure, fuels treatments, and wildfire. All responses were analyzed at the plot scale.
CategoryResponseDefinitionSampling Date or IntervalAnalysis Units
Overstory dynamicsIngrowthRecruitment into the overstory: trees reaching 7.6 cm DBH during intervalEarly–Latenumber/ha
MortalityTrees that died during intervalEarly–Latenumber/ha
Basal area increment (BAI)Change in basal area during intervalEarly–Latem2/ha
Seedling frequency (<1 m tall)SeedlingsConifers <1 m tallPre,
Early,
Late
proportion of quadrats
Seedling dynamicsColonizationQuadrats with seedlings (<1 m tall) at the end but not start of intervalPre–Early,
Early–Late,
Pre–Late
number of quadrats 1
PersistenceQuadrats with seedlings (<1 m tall) at the start and end of intervalPre–Early,
Early–Late,
Pre–Late
number of quadrats 1
Regeneration frequency (by height class)Small seedlingsConifers <0.3 m tallLateproportion of quadrats
Large seedlingsConifers 0.3–1.37 m tallLateproportion of grid cells
SaplingsConifers >1.37 m tall and <7.6 cm DBHLateproportion of grid cells
1 The influence of each response (plot) value on the model was weighted by the number of quadrats available for colonization or persistence. Plots without available quadrats—i.e., where all quadrats contained seedlings (colonization model) or all quadrats lacked seedlings (persistence model)—were excluded from those respective analyses.
Table 2. Summary of model results. See Table 1 for explanations of response variables and Table A1, Table A2, Table A3, Table A4, Table A5 and Table A6 (Appendix A.4) for full model output. For the linear model of BAI, R2 is the proportion of the variability explained by the full model. Values for individual terms are percentages of explained variability, summing to 100%. For GLMs (all other responses), R2 is one minus the ratio of the model’s deviance from being the best (perfect) and worst (null, intercept-only) model. Values for individual terms are percentages of deviance improvement with each added term, summing to 100%. Significant terms (p < 0.05) are underlined and bold. Terms that were not tested for a particular response are denoted by a dash, ′–′. Sampling dates are Pre (2000/2001), Early (2004/2005), and Late (2015). Results for persistence are not shown (na) as models did not converge due to low sample size.
Percentage of Explained Variability
CategoryResponseSampling Date or IntervalR2OAThinEarly Fire (EF)Late Fire (LF)OA × ThinOA × EFOA × LFThin × EFThin × LFEF × LF
Overstory dynamicsIngrowthEarly–Late0.2712810179612062
MortalityEarly–Late0.64570225172122
BAIEarly–Late0.3617312269251411
Seedling frequency
(<1 m tall)
SeedlingsPre0.07100
Early0.2456186354
Late0.381713555<161110
Seedling dynamicsColonizationPre–Early0.30312213674
Early–Late0.4710<118474161211
Pre–Late0.4947184542<11612
PersistencePre–Earlyna- - --
Early–Latena
Pre–Latena
Regeneration frequency (by height class)Small seedlingsLate0.411815632<14<1<17
Large seedlingsLate0.3951851838113<112
SaplingsLate0.433517<121184<1<142

