Article

Stocking Diagrams for Silvicultural Guideline in Korean Pines and Japanese Larch

1
Natural Resources Institute Finland (Luke), Latokartanonkaari 9, 00790 Helsinki, Finland
2
Department of Forest Management, College of Forest and Environmental Sciences, Kangwon National University, Chuncheon 24341, Korea
*
Author to whom correspondence should be addressed.
Forests 2020, 11(8), 833; https://doi.org/10.3390/f11080833
Submission received: 30 June 2020 / Revised: 24 July 2020 / Accepted: 30 July 2020 / Published: 31 July 2020
(This article belongs to the Section Forest Ecology and Management)

Abstract

:
Appropriate management of stand density is necessary to avoid wasted growing space and overcrowding-induced self-thinning and therefore to optimize profitability. We developed a Gingrich-style stocking chart for Korean red pine (Pinus densiflora), Korean white pine (P. koraiensis), and Japanese larch (Larix kaempferi) in Korea. Datasets for even-aged stands were categorized into two censored datasets via relative density based on species-specific stand density indices to assign adequate plots for tree allometry. Censored plot data for maximum density on full stocking were used to develop A-level stocking based on mean individual tree area. In censored plot data for minimum density on full stocking, individual trees represented open-grown trees, and a crown competition factor of 100 was proposed as B-level stocking. Based on parameters estimated from allometry, stocking diagrams comprising quadratic mean diameter, number of trees, and basal area were correctly expressed. A-level stocking at the same quadratic mean diameter revealed that Korean white pine had the most trees and largest basal area, while Japanese larch had the fewest trees and smallest basal area. In contrast, B-level stocking disclosed that Japanese larch had the most trees and basal area, whereas Korean white pine had the fewest trees and smallest basal area. The stocking diagrams suggest that silvicultural treatments for these species should be species-specific.

1. Introduction

Stand size–density relationships influence tree crowding and competition for resources such as light, water, and nutrients [1]. In forest management, one objective is to produce utility pole trees as rapidly as possible without wasting limited growing space. Hence, it is necessary to establish the growing space required for each target species. Poorly managed stand density may result in low profitability. The allocation of excessive growing space is a wasteful forest management practice and results in coarse stems and unwanted branches of poor quality. In contrast, competition among trees is extremely high in very dense stands, and the trees therein are prone to self-induced mortality [2].
Forest managers attempt to explain tree size–density relationships in order to control size, growth, and mortality [3,4]. Available tree-growing space is influenced by the degree of crowding within a stand and is usually defined by the number of trees, basal area, and volume per unit area. However, these factors are absolute and quantitative. Further, no single factor adequately defines the tree growing space. Two different stands with the same basal area or number of trees do not necessarily have the same amount of growing space for individual trees when their mean tree diameters differ [5].
A stocking level for stand density effectively compares available tree area across stands and implies that the degree of crowding is guided by references relevant to the management objectives [1]. A Gingrich-style stocking chart comprises the number of trees, the basal area, and the quadratic mean diameter ( D ¯ q ). It calculates the absolute and relative stand densities expressed as stocking percentage and is based on any pair of the number of trees, the basal area, and D ¯ q . Stocking charts representing two types of tree density management may be graphically illustrated and are useful for practical stand density management.
The Gingrich-style chart shows the A-level stocking percentage, which is defined as the maximum number of trees that can grow within a unit area [6]. In A-level stocking, all of the growing space is occupied by trees but self-thinning is minimized [7]. A-level stocking helps quantify the tree size–density relationship and the inter-tree competition under normal stand conditions. In other words, an A-level stocking stand develops over time without any management activity or operation. In an early-stage, understocked stand, stand density increases with individual tree size and the stand progresses towards A-level stocking. At the A-level, the stands are considered to be in equilibrium between the fully stocked and overstocked levels. Additional growth in the stand corresponds to the amount of mortality there [8,9].
The stocking diagram also discloses the B-level stocking percentage, which is defined as a density line indicating the onset of full stocking. Under B-level stocking, individual trees without competition grow to maximum size. At a certain time, the size of the stand area equals the sum of the sizes of the individual trees occupying the maximum growing space under open-grown space. B-level stocking corresponds to the line of minimum density in full stocking and is developed from the data for open-grown stands. Minimum density on full stocking may be used to establish a boundary between the understocked and fully stocked levels and indicates the extent of canopy openness available for tree species regeneration [5].
Stocking charts providing information beneficial for stand density management diagram have been recently developed for major softwood species as well as hardwood species in North America [2,10,11,12,13,14]. However, this approach has not yet been applied for Korean red pine (Pinus densiflora Siebold and Zucc.), Korean white pine (Pinus koraiensis Siebold and Zucc.), or Japanese larch (Larix kaempferi (Lamb.) Carrière), despite the fact that these are major commercial tree species in Korea [15,16,17]. Studies on stand density management were conducted by Kim [18] and Ma [19] using log–log relationships and a maximum stand density line between the tree diameter and the number of trees. Based on the relationships among stand volume, stand density, and self-thinning proposed by Ando [20,21], stand density management diagrams were developed for Korean red pine, Korean white pine, and Japanese larch by Shim et al. [22,23] and Kim et al. [24]. A stand density management diagram was recently developed for Korean red pine based on data from the National Forest Inventory of Korea [25,26]. However, the stand characteristics (including age class) at the time these models were developed were substantially different from those at present. Hence, it is impractical to apply this diagram in the field. Moreover, the diagrams plotted using the data from the National Forest Inventory must be verified as its experimental design differed from the one used to generate growth and yield information for even-aged plantations.
At this time, there is little management information and no Gingrich-style stocking chart for Korean red pine, Korean white pine, or Japanese larch. Thus, it is necessary to demonstrate the value of implementing stand density management diagrams in rational stand management. In the present study, we selected data for maximum and minimum density of full stocking, formulated suitable tree allometry equations, and plotted a Gingrich-style stocking chart based on the allometric relationships. The aims of this study were to adapt a stocking diagram based on previous foreign studies, attempt to apply it towards data from domestic studies on forest stand management, and determine its practicability for field work.

2. Materials and Methods

2.1. Data

2.1.1. Plot and Tree Measurement

The study area comprises pure stands of three major commercial conifers, namely Korean red pine, Korean white pine, and Japanese larch. It was located in Gangwon and North Gyeongsang Provinces of Korea. Permanent monitoring plots were established to develop growth and yield models for thinned stands with a squared plot design ranging in size from 0.04 ha (20 m × 20 m) to 0.09 ha (30 m × 30 m). Each experimental site consisted of three plots differing in size and thinning rate of plantation. The experimental sites varied in terms of tree number and age class. Detailed information is provided in Lee and Choi [27]. The plots have been measured at 3-year intervals since they were established in 2012–2014.
The plots were measured using the same inventory method for all three target species. The diameter at breast height (DBH) was measured at 1.2 m height using a diameter tape and was recorded in centimeters to the first decimal place. All trees ≥6 cm within each plot were measured except for young plantations, wherein the saplings were <6 cm in DBH and/or <1.2 m in height. Tree mortality was also determined and recorded. Crown width (CW) was measured in meters with a measuring tape to the first decimal place using two crown diameters from the second inventory (3 years after plot establishment) perpendicular to the slope direction. Crown data were collected from the longest branch under a normal crown shape in each of the four directions. The branches were approximately repositioned in pre-felling orientation using the overall leaf angles as a guide, according to the method of Choi et al. [28,29]. Unlike DBH, CW was determined for only 1/3 of the trees per plot. Trees were selected for CW measurements by sorting the DBH and by a systematic sampling method. When the number of trees available for CW measurement was <10 because of low density, then the minimum number of trees samples was set to 10.
There were 252 plots for Korean red pine, 342 plots for Korean white pine, and 405 plots for Japanese larch. The numbers of Korean red pine, Korean white pine, and Japanese larch trees measured for DBH and CW were 1541, 2014, and 2921, respectively. After collecting and aggregating all these recurring inventory data, they were filtered for A-level and B-level development. The variables tested in this study were calculated on the basis of unit area or average. The number of trees per plot was converted to number of trees per hectare (TPH). The basal area per plot was converted to the basal area per hectare (BA). D ¯ q was calculated using the basal area as follows:
D ¯ q = B A ¯ π / ( 4 × 10,000 )
where D ¯ q is the quadratic mean diameter (cm), B A ¯ is the mean basal area per tree ( m 2 ), and π is a mathematical constant of ~3.14159. D ¯ q simplified the interpretation of these relationships because yield tables and stand projections are relatively easy to follow [30]. Individual tree CWs were arithmetically calculated by averaging two perpendicular CWs per tree.

2.1.2. Maximum Density in Fully Stocked Stands (A-Level Stocking)

Overstocked stands undergo self-thinning to control their density. They revert to A-level stocking percentage wherein the trees are allocated just enough resources required for minimum growth [9]. A-level stocking is represented by an allometric relationship developed with regression models on normal stand data. Normal stands are undisturbed and even-aged. They have uniform tree area and no overstory canopy space. They nearly attain the maximum basal area and volume for each age and site productivity level [31]. However, the normal stand determinations made by the methods of Gingrich [6] and Chisman and Schumacher [32] for A-level stocking were dubious and difficult to achieve because the stands evaluated for these determinations had exceptionally high or low mortality at each developmental stage [33]. The relative density or ratio of actual: maximum stand density is often used to evaluate the observed stand density and select normal stands. However, the selection criteria varied among studies [34].
Long [35] reported that the conifers in stands with >60% relative density showed the onset of self-thinning. This phenomenon was reported for longleaf pine by Shaw and Long [36]. Solomon and Zhang [37] established that mixed-softwood stands with relative density >0.7 were normal stands and manifested self-thinning. This criterion was recently applied to longleaf pine by Kara et al. [5]. Here, relative density >0.7 was adopted to ensure meticulous selection of normal stands [38]. The maximum stand density line used in the relative density calculations was adapted from Lee and Choi [27]. They used the same stand density indices for the same three species as those tested in the present study (Figure 1a). Based on this criterion, 98, 118, and 128 plots were selected for Korean red pine, Korean white pine, and Japanese larch, respectively. The filtered data were used to develop an allometric equation for A-level stocking (Table 1).

2.1.3. Minimum Density in Fully Stocked Stands (B-Level Stocking)

B-level stocking is represented as the minimum density for full stocking. The entire mean individual tree area is occupied, and no available growing space is wasted. The crown growth of the trees under B-level stocking is not interrupted by competition among trees within the stand. Open-grown trees are commonly used to develop CW–DBH allometry for this level [39]. When these data cannot be measured, however, dominant forest-grown trees are used to evaluate CW–DBH allometry for B-level stocking [40,41]. In another study, allometric equations were also developed by using data for thinned stands [11]. The slope coefficient of the crown area–basal area relationship in forest-grown trees did not significantly differ from that for open-grown trees [2,42,43].
In this study, CW–DBH allometry by species was examined by using < 0.5 relative density. The data were filtered according to the number of tree samples, statistical summary and distribution, similarity of the allometry pattern with those of previous studies, and model fit statistics [38]. The numbers of plots selected for B-level stocking were 67 for Korean red pine, 98 for Korean white pine, and 129 for Japanese larch (Figure 1b). For the CW–DBH measurements within the filtered plots at low relative density, there were 543 trees in 50 plots, 755 trees in 68 plots, and 1128 trees in 105 plots, respectively. Summary statistics of the datasets for A-level and B-level stocking development are listed in Table 1.

2.2. Tree Allometric Equations

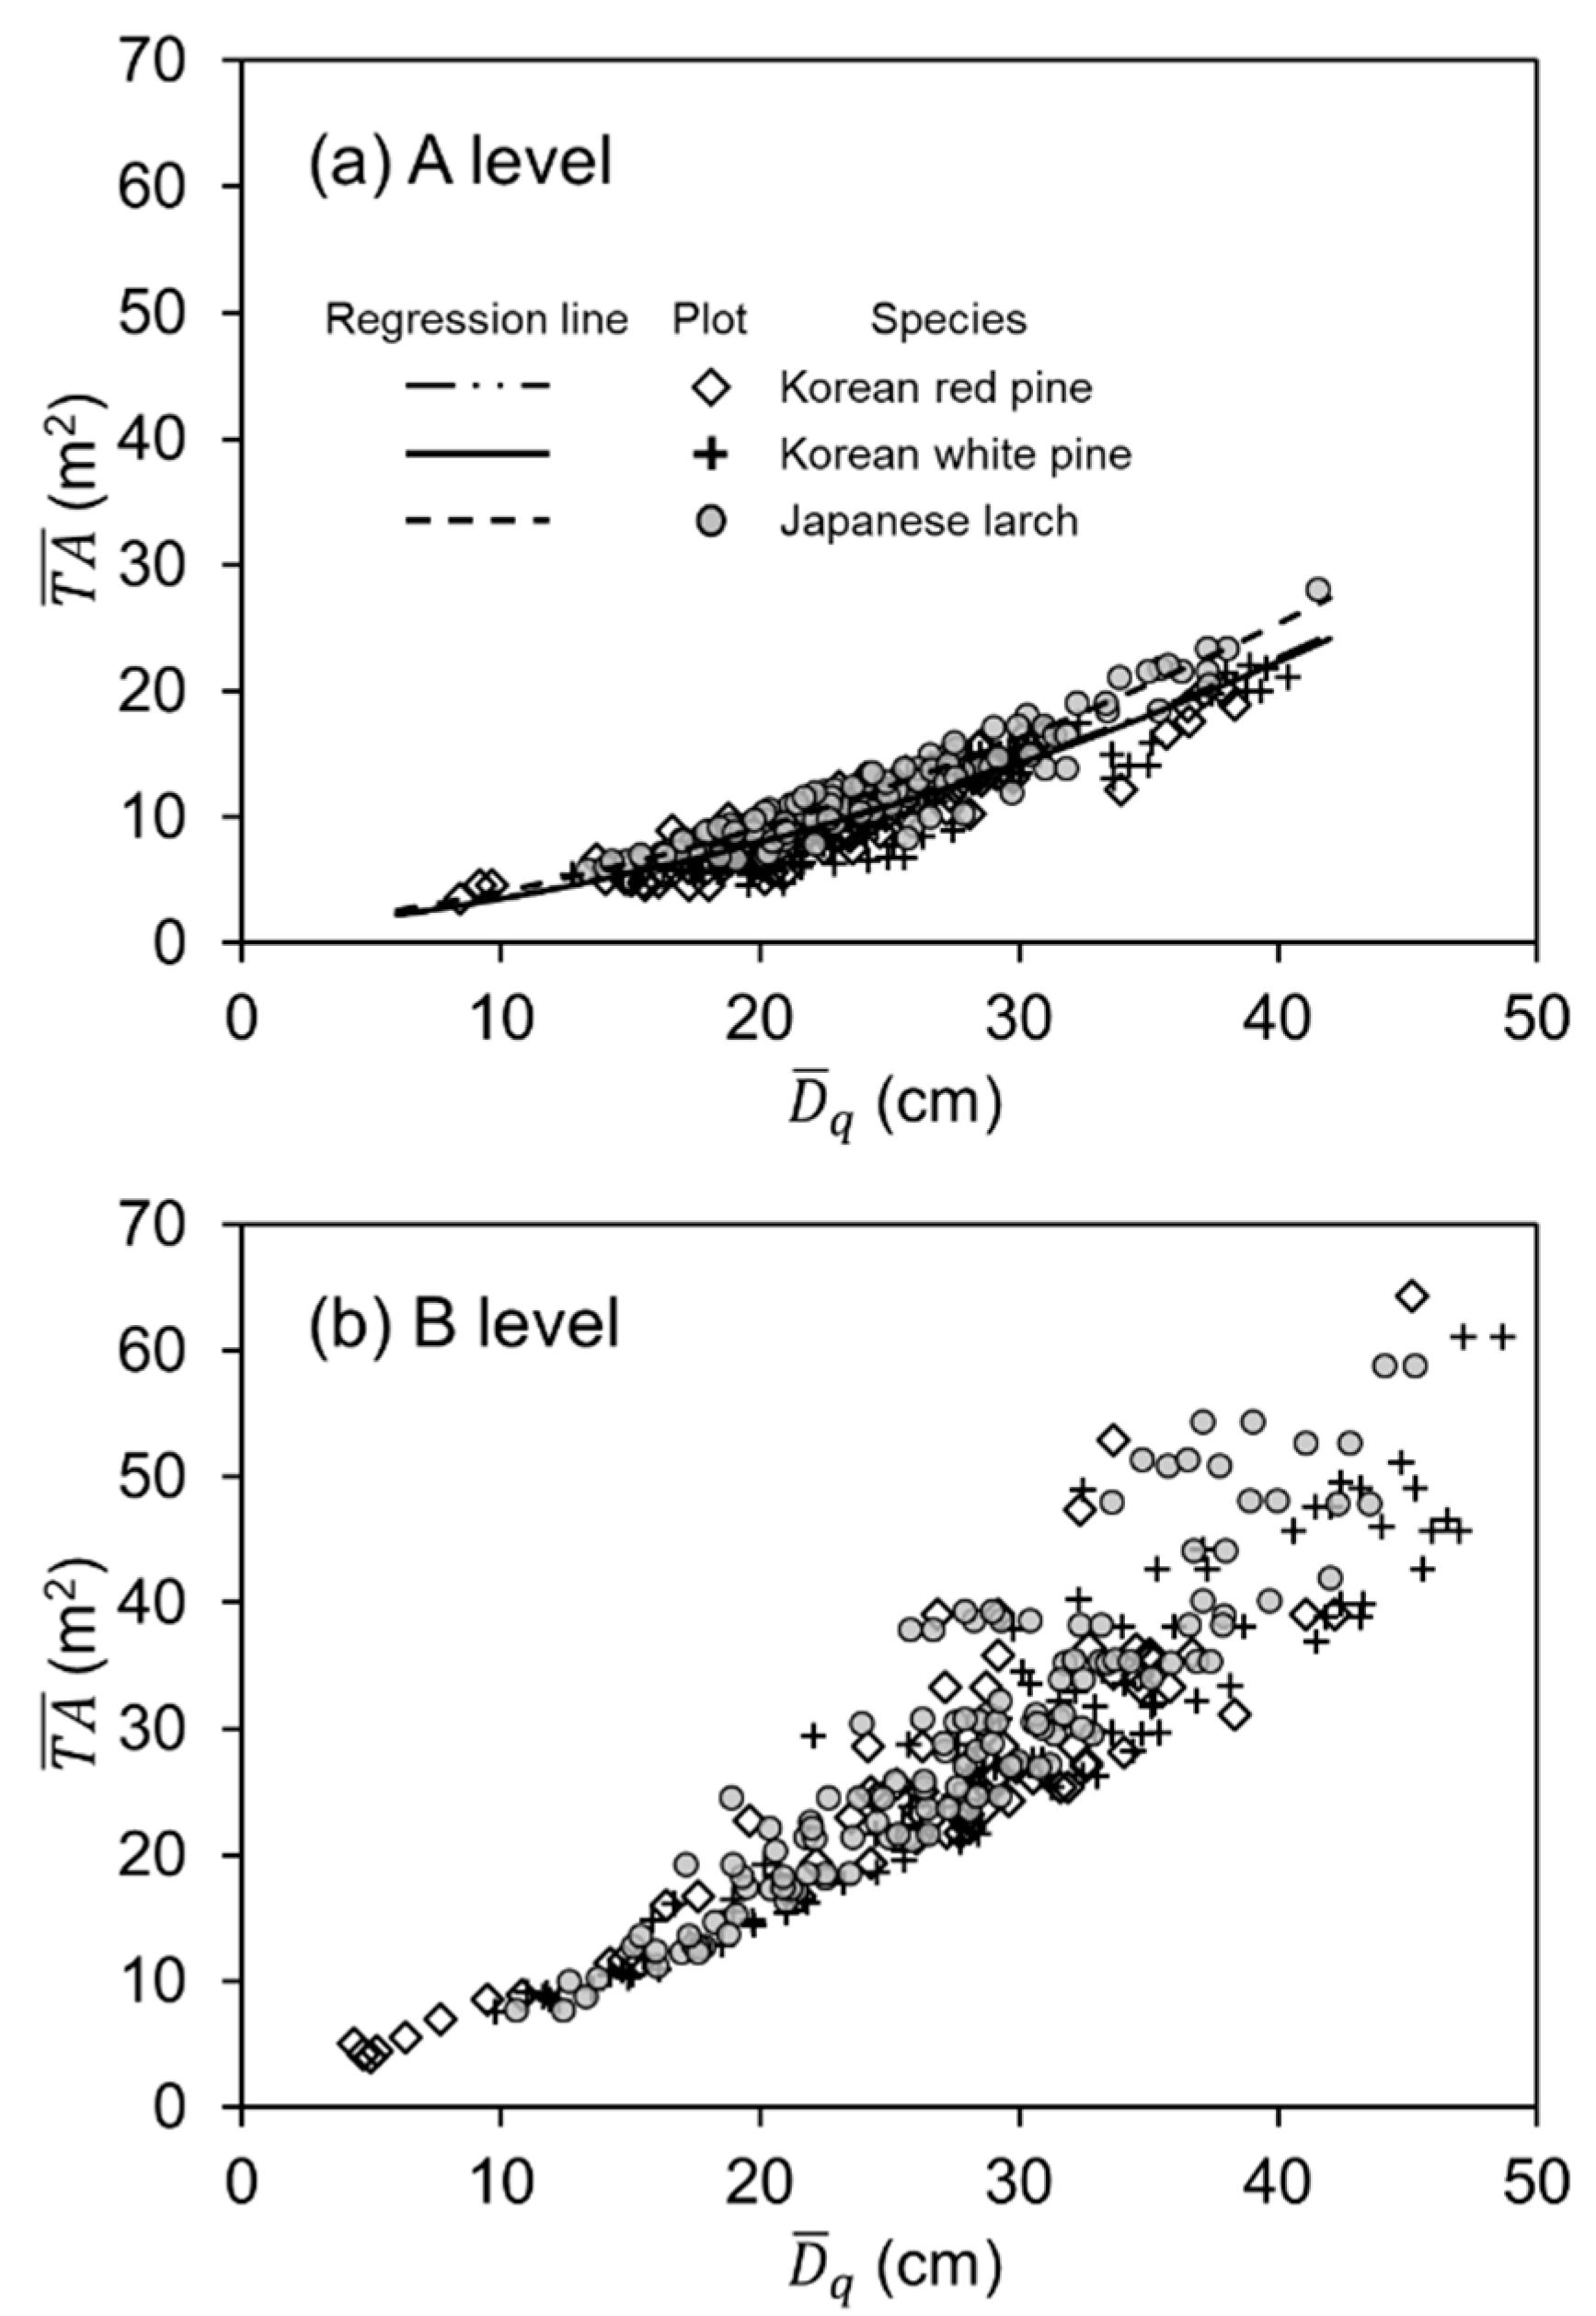
2.2.1. Minimum Tree Area in Fully Stocked Stands (for A-Level Stocking)

Tree area was traditionally used to determine A-level stocking and stocking percentage. This technique was originally developed by Chisman and Schumacher [32]. A certain area is allocated to the trees growing inside the area. The sum of all individual tree areas is converted to a certain area, and the following allometric equation is proposed for numeric interpretation:
T A = β 0 n + β 1 d i + β 2 d i 2
where T A is the tree area (such as 10,000 m 2 ); n is the number of trees per unit area; d i is i th individual tree DBH; and β 0 , β 1 , and β 2 are coefficients. This equation was applied by Gingrich (1967) to determine A-level stocking via regression modeling. However, the response variable was a uniformized constant set to a unit area such as 10,000 m 2 [7]. Hence, both terms in Equation (2) were divided by the number of trees (n), and both the response and explanatory variables were modified as follows:
T A n = β 0 + β 1 d i n + β 2 d i 2 n
where all variables and parameters indicated were previously defined. Using Equation (3), a stocking diagram was developed for an Eastern cottonwood–silver maple–American sycamore forest [7]. To express A-level stocking on the stocking diagram, the allometry was not limited to the type of tree area equation. A log-log relation between TPH and D ¯ q was recently applied for longleaf pine [5].
In the present study, the tree area method was selected for A-level stocking as it directly describes the spatial concept within an area according to the crown area for B-level stocking [38]. The former equation was modified to solve for multicollinearity between independent variables and improve model fitting:
T A ¯ = ( β 0 + β 1 D ¯ q ) 2
where T A ¯ is the mean individual tree area ( m 2 ) equal to T A divided by n . All other variables and coefficients are the same as those previously defined. The allometric equation indicates that T A ¯ is proportional to the square of D ¯ q . In the present study, this equation was applied without any statistical processing or validation issues. Using the estimated coefficients, TPH was explained as follows via D ¯ q determined from T A ¯ :
T P H = ( % S t o c k i n g ) × 100 ( β 0 + β 1 D ¯ q ) 2
where % stocking is the stocking level expressed as a percentage (%). All other variables and coefficients are the same as those previously defined. Equation (5) was applied to the stocking diagram to describe the relationship between the average tree diameter and the TPH as stocking percentage.

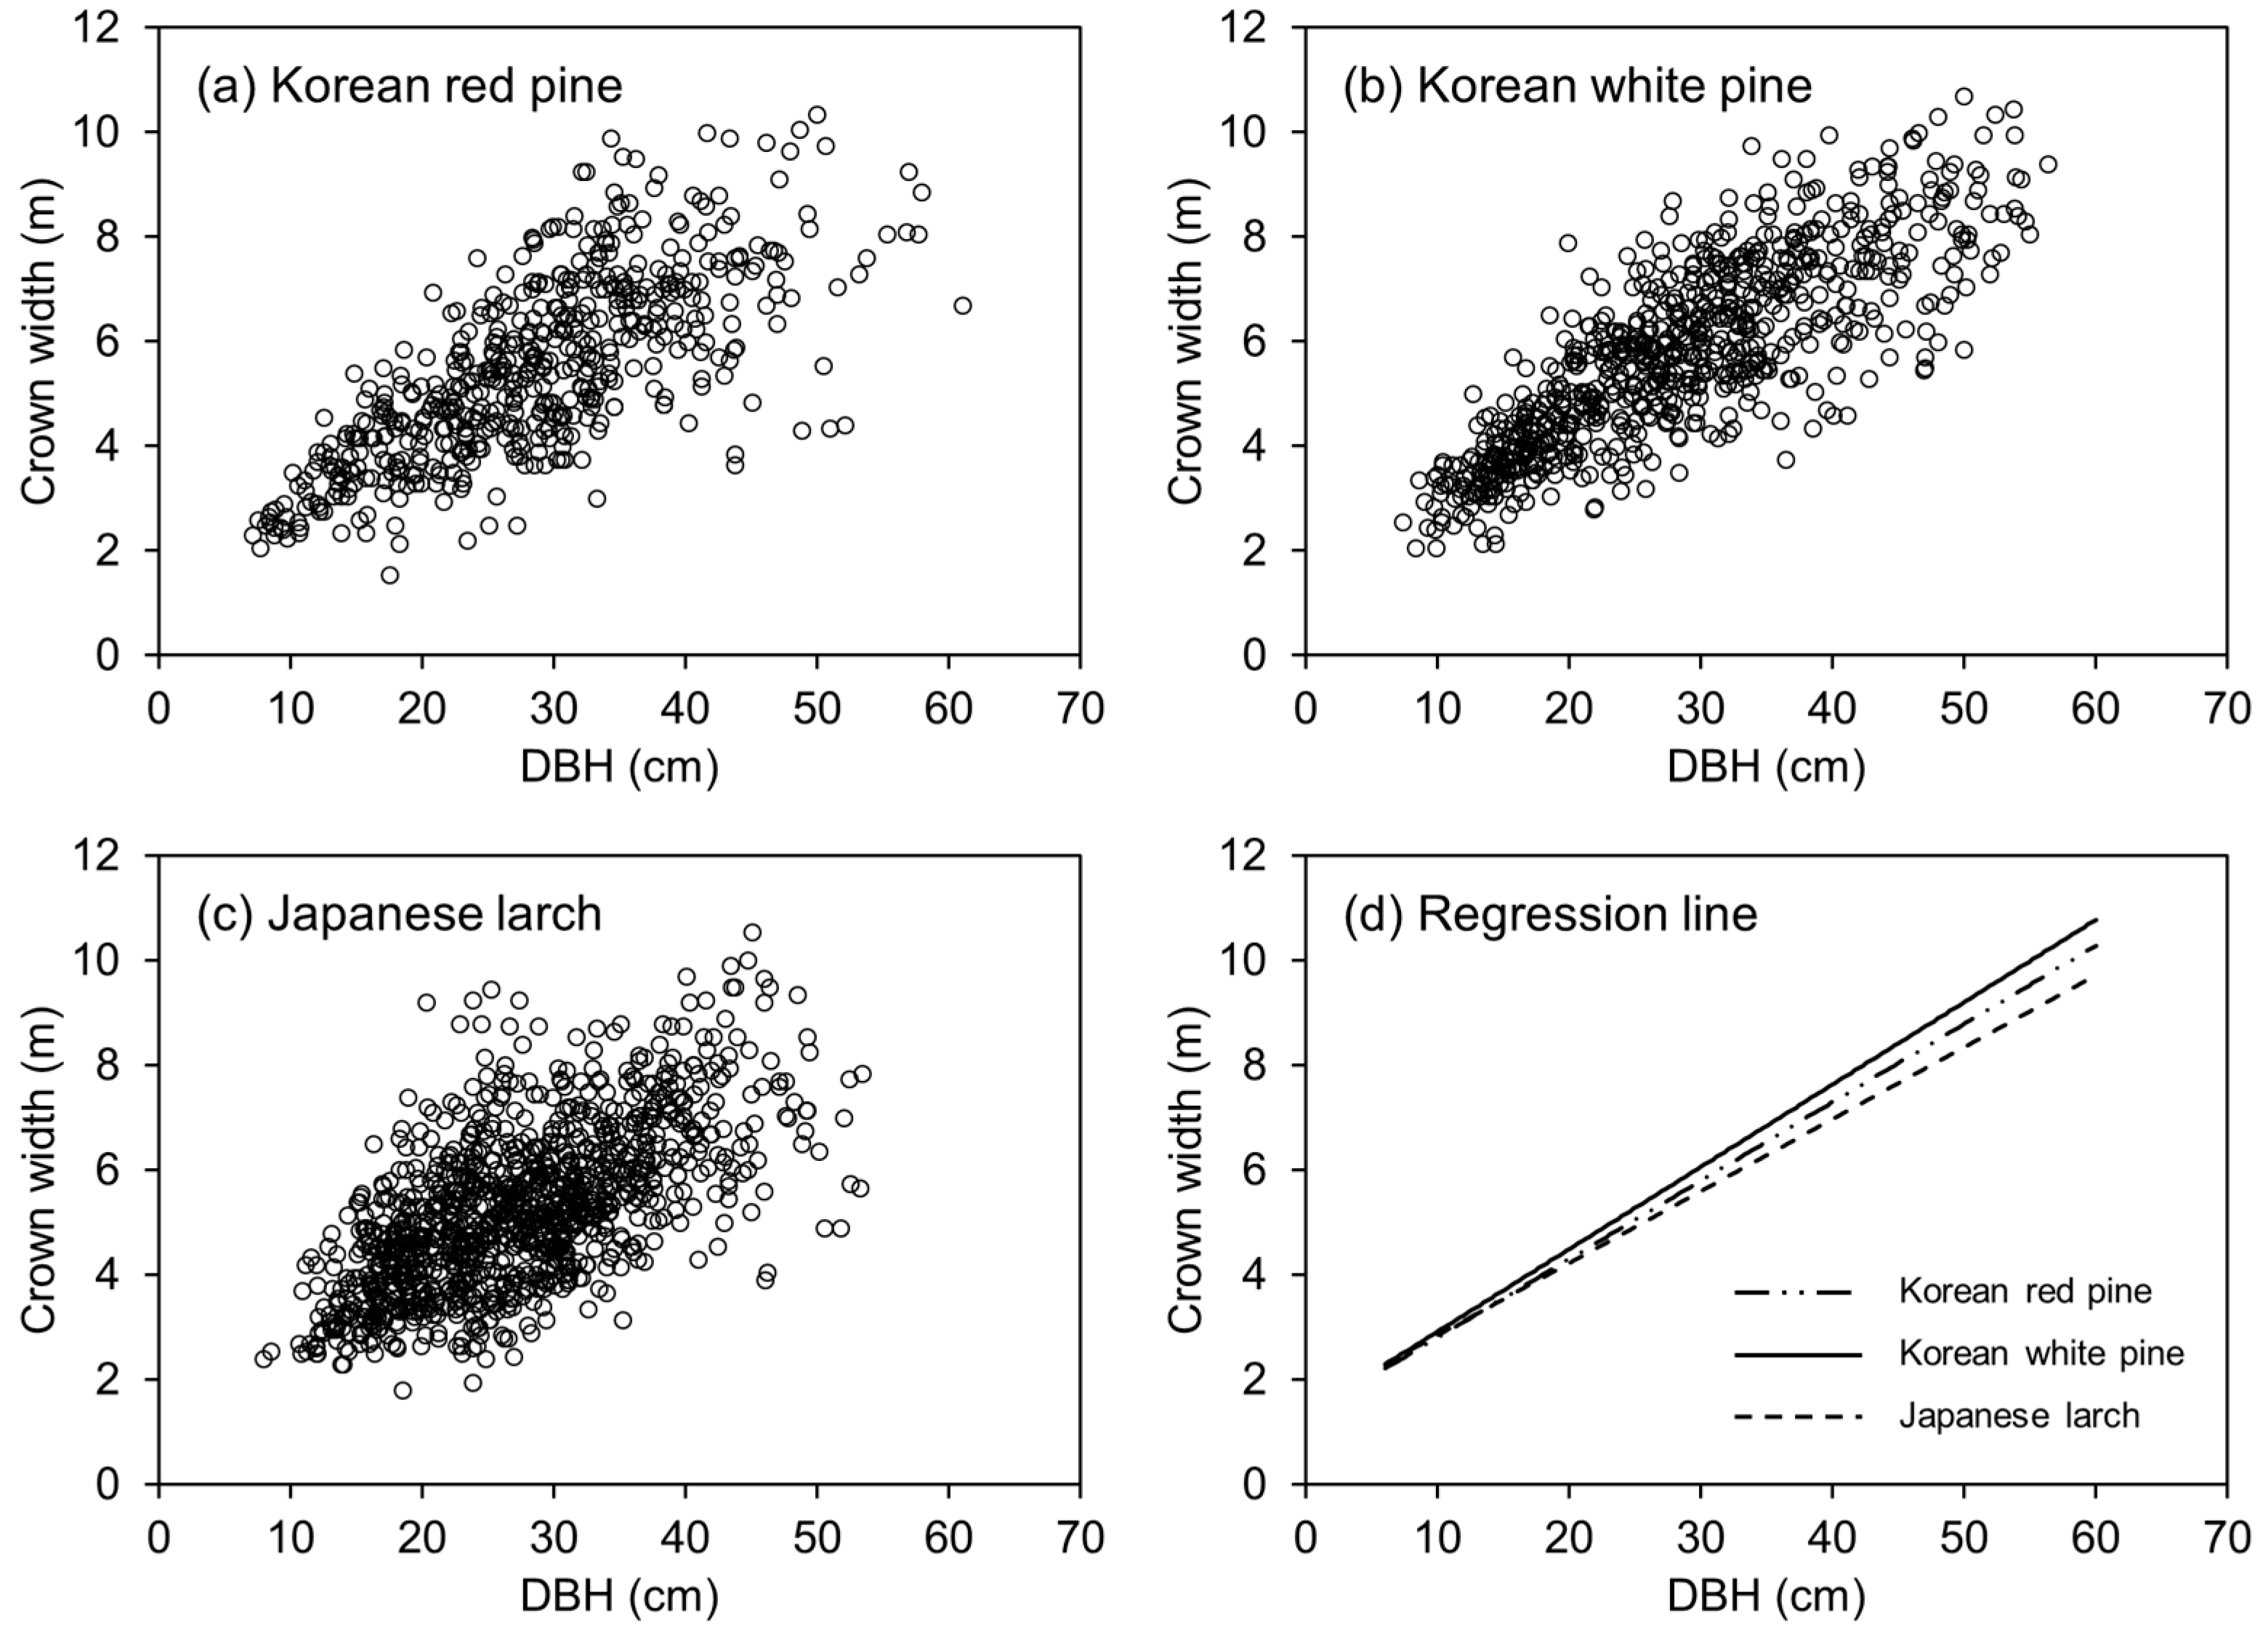
2.2.2. Crown Area on Open-Grown Sites (for B-Level Stocking)

B-level stocking is the minimum TPH estimated from a fully occupied growing space and defined as crown competition factor = 100 [39]. In the plots, the individual trees with these characteristics were used in the CW–DBH allometry model (Table 1). CW–DBH allometry is described by linear, power, logarithmic, and other equations [3,44]. Here, a linear equation was used because it effectively describes open-grown trees [2,5,7]. The following allometric equation was applied to individual open-grown trees for B-level stocking:
C W = β 0 + β 1 D B H
where all variables and coefficients are the same as those previously defined. The equation was successfully fitted without examining any other factors. It was based on the premise that the relationship between DBH and CW for open-grown trees is not influenced by site productivity or stand age [32,44]. Based on the estimated parameters, the allometry of DBH and CW resulted in a relationship between average tree diameter and number of trees at the onset of full stocking:
T P H O = 10,000   ( m 2 ) π ( ( β 0 + β 1 D B H ) 2 ) 2
where T P H O is the number of trees per hectare at the onset of full stocking that reaches the limit of the open-growing condition (trees·ha−1). All other variables and coefficients are the same as those previously defined. T P H O was computed from the crown area and represents B-level stocking consisting of open-grown trees. It can also be defined as crown competition factor = 100. Equation (7) was applied to determine the B-level stocking percentage in the stocking diagram.

2.3. Statistical Analysis

The model parameters were estimated by linear regression for Equation (4) (square root-transformed), and for Equation (6) (original arithmetic form). Each experimental site had a nested design because there were three plots per site, and they were measured thrice after establishment. Linear or nonlinear mixed-effects models were developed for the forest trees and stands to account for multivariate multilevel random plot effects and covariances among repeated measurements [45,46]. By regarding these factors as random effects, a linear mixed-effect model was formulated as follows:
T A ¯ = b 0 + b 1 D ¯ q + u e i + u e i . p j + ε e i . p j . m l
C W = b 0 + b 1 D B H + u e i + u e i . p j + u e i . p j . t k + ε e i . p j . t k . m l
where T A ¯ is the square root of the mean individual tree area, b 0   and   b 1 are fixed-effect parameters, u e i ,   u e i . p j ,   u e i . p j . t k are random-effect parameters, and ε e i . p j . m l and ε e i . p j . t k . m l are the measurement errors for each equation that were not explained by fixed-effect or random-effect parameters. In Equation (8) for the plot-level analysis, u e i was incorporated because of the nested plot design and u e i . p j was incorporated because of the longitudinal data structure. In Equation (9) for the tree-level analysis, u e i and u e i . p j accounted for the spatial correlations among the individual trees within the same area, while u e i . p j . t k explained the longitudinal data structure [47].
All parameters were estimated with the PROC MIXED module in SAS v. 9.4 [48]. Parameter signs and values were checked, and the significance level was determined from the p-value to validate the model. The coefficient of determination (R2) was calculated to evaluate the percentage variation explained by the linear mixed-effects model; R2 = 1 − (sum of squared errors/Total sum of squares). The root mean squared error (RMSE) and standard deviation (SD) of the residuals were calculated to evaluate their spread. Scatterplots of the residuals (differences between the measured and predicted values) were made to identify and discriminate undesirable and abnormal distributions such as biased trends and heteroscedasticity.

3. Results

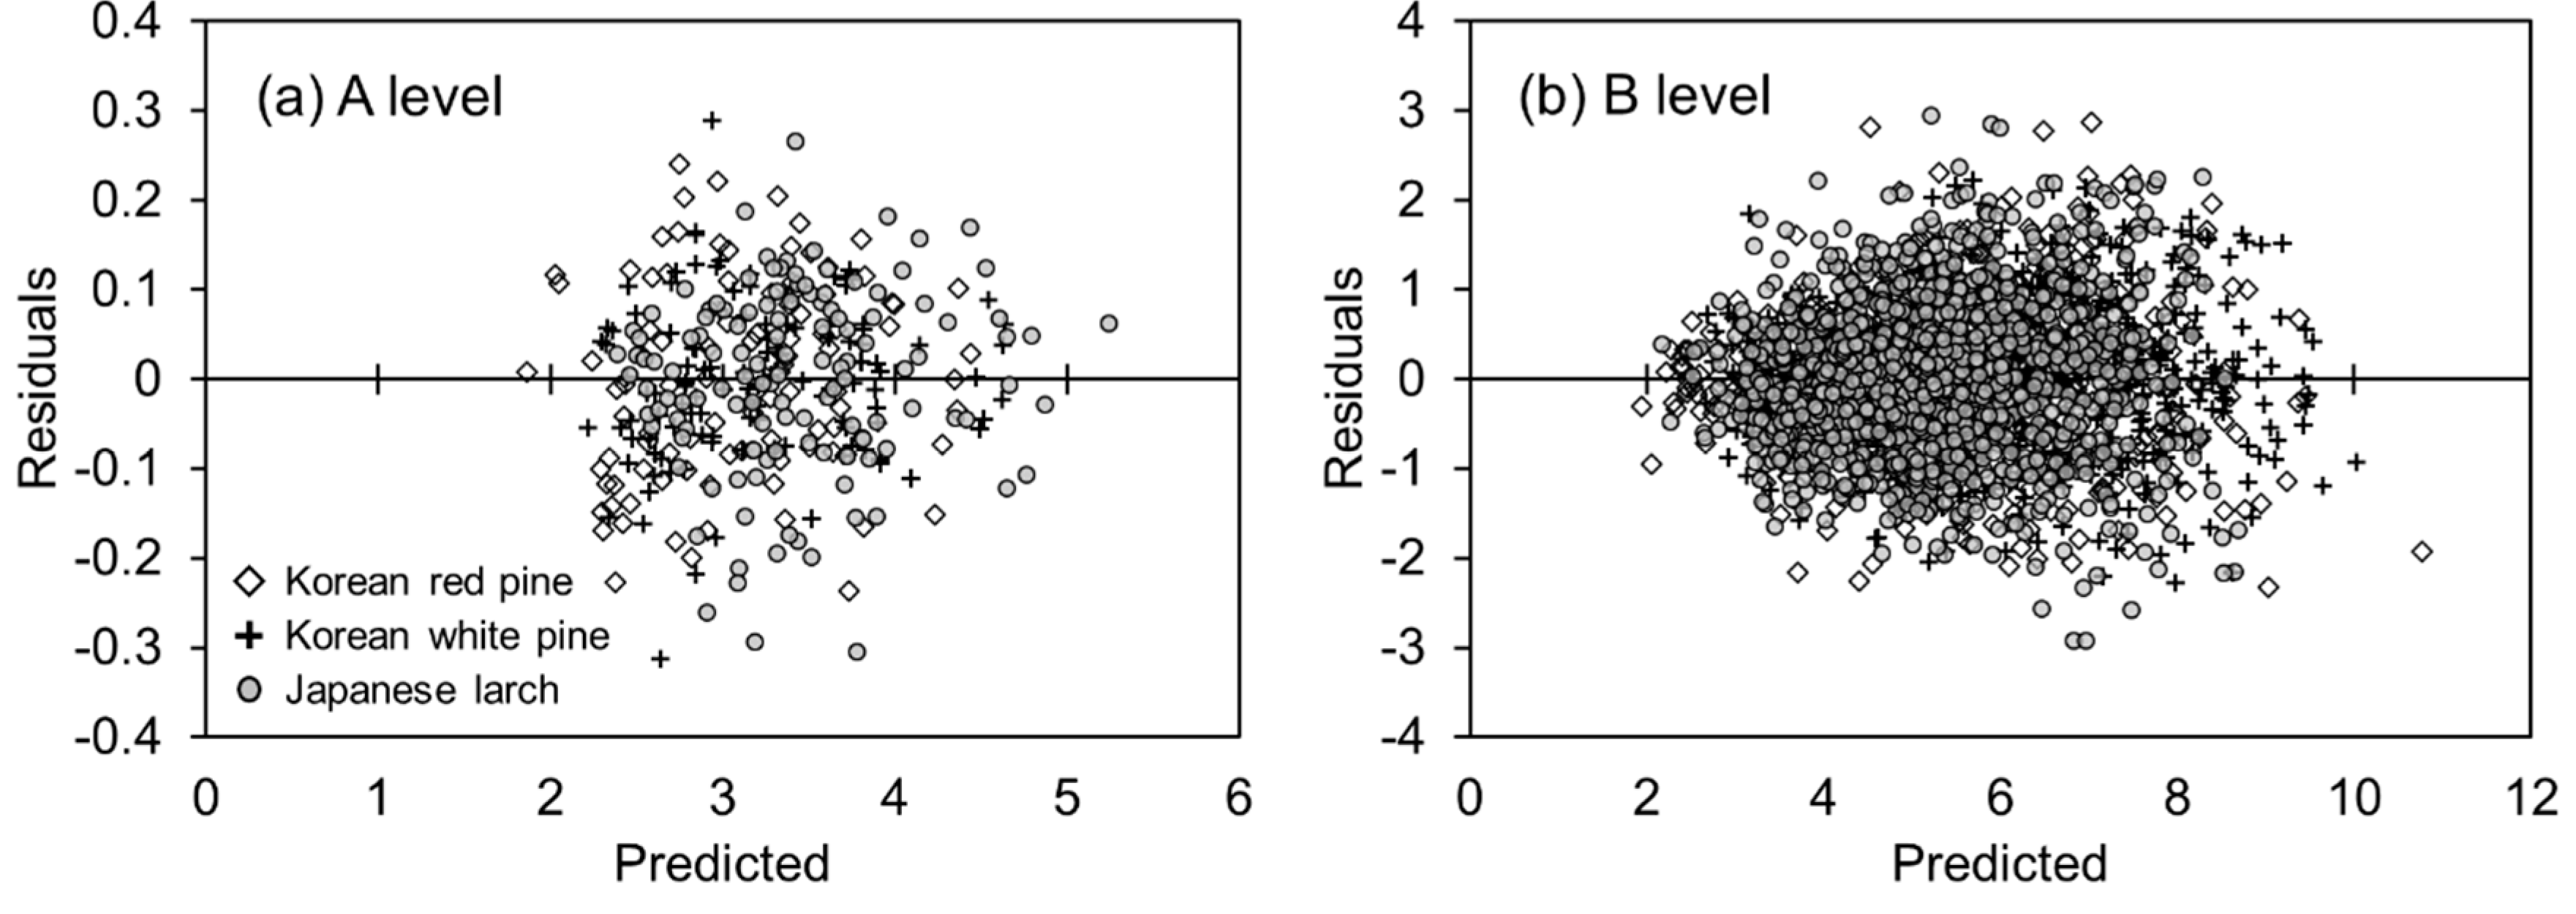
3.1. Parameter Estimates and Tree Allometric Descriptions

The parameters of Equations (8) and (9) fit well with the range of suitable allometric relationships. All fixed-effect slope parameters were statistically significant (p < 0.01). In Equation (8), the slope and intercept parameters were highest for Japanese larch. As the slope parameter was larger for Japanese larch, T A ¯ increased more with D ¯ q , and TPH decreased more than other species in A-level stocking in Equation (5). The relatively large T A ¯ for Japanese larch caused its TPH to be lower than that of Korean red pine or Korean white pine at the same stocking percent. The variance of the residuals by species not explained by the fixed and random effects were in the range of 0.013–0.022, and there were no marked differences among them. R 2 > 0.968 and RMSE < 0.110 for all three species.
The slope parameter in the CW–DBH model was largest for Korean white pine and smallest for Japanese larch (Equation (9)). At the same DBH, then, the crown area was larger for Korean white pine and smaller for Japanese larch. For B-level stocking, there were relatively fewer T P H O for Korean white pine and relatively more T P H O for Japanese larch, as calculated using Equation (7) with the fixed-effect parameters in Table 2. The relationship between DBH and CW influenced both the crown area and TPH O for B-level stocking. The observed random effects in the CW–DBH model varied with species. The residual variances were 0.840 for Korean red pine, 0.603 for Korean white pine, and 0.789 for Japanese larch. R 2 was highest and RMSE were lowest for Korean white pine. All RMSE values were lower than the SD for each species with a meaningful model fitting (Table 1). In the residual plots of both models (Equations (8) and (9)), the residuals were symmetrically distributed, and undesirable patterns such as heteroscedasticity were not detected within the random distribution (Figure 2).
The scatterplots of D ¯ q and T A ¯ used for modeling are displayed with regression lines developed for A-level stocking (Figure 3a). The original distribution for the data used in A-level stocking corresponded well to the squared values of the predicted values by regression (Equations (4) and (8)). T A ¯ were 3.5 m2 for Korean red pine, 3.5 m2 for Korean white pine, and 4.1 m2 for Japanese larch at 10 cm D ¯ q . At 40 cm D ¯ q , they were 22.7 m2, 22.3 m2, and 25.3 m2, respectively. The calculated T A ¯ resulted in the maximum TPH for the fully stocked stand (Equation (5)). The order of TPH by species for the A-level stocking was the opposite of the order by species for T A ¯ . This finding was consistent with the carrying capacity sequence by species for the stand density index [27]. This TPH discrepancy amongst species is explained by the differences in slope parameter estimated from T A ¯ D ¯ q for each species (Table 2).
The T A ¯ used in B-level stocking was larger than that used for the A-level stocking at the same D ¯ q because the former represented open-grown trees (Figure 3b). The T A ¯ were 7.6–8.7 m2 at 10 cm D ¯ q and 35.1–44.2 m2 at 40 cm D ¯ q . These T A ¯ were larger than those used in A-level stocking. T A ¯ for B-level stocking were exponentially higher than that for A-level stocking. A similar pattern was reported for a previous study, but the absolute sizes differed [7].
We used the individual tree data with CW–DBH measurements for the plots shown in Figure 3b to display species-specific tree allometry between DBH and CW with scatterplots and regression lines for B-level stocking (Figure 4). There was a positive linear correlation between DBH and CW (Table 2). The linearity was strongest for Korean white pine and weakest for Japanese larch. Neither the slopes nor the intercept parameters noticeably differed among species. The predicted CW were 2.8 for Korean red pine, 2.9 m for Korean white pine, and 2.8 m for Japanese larch in 10 cm DBH and 7.3 m, 7.6 m, and 7.0 m, respectively, in 40 cm DBH (Figure 4d). CW increased with DBH and influenced the TPH O developed for B-level stocking on the stocking diagram structure.

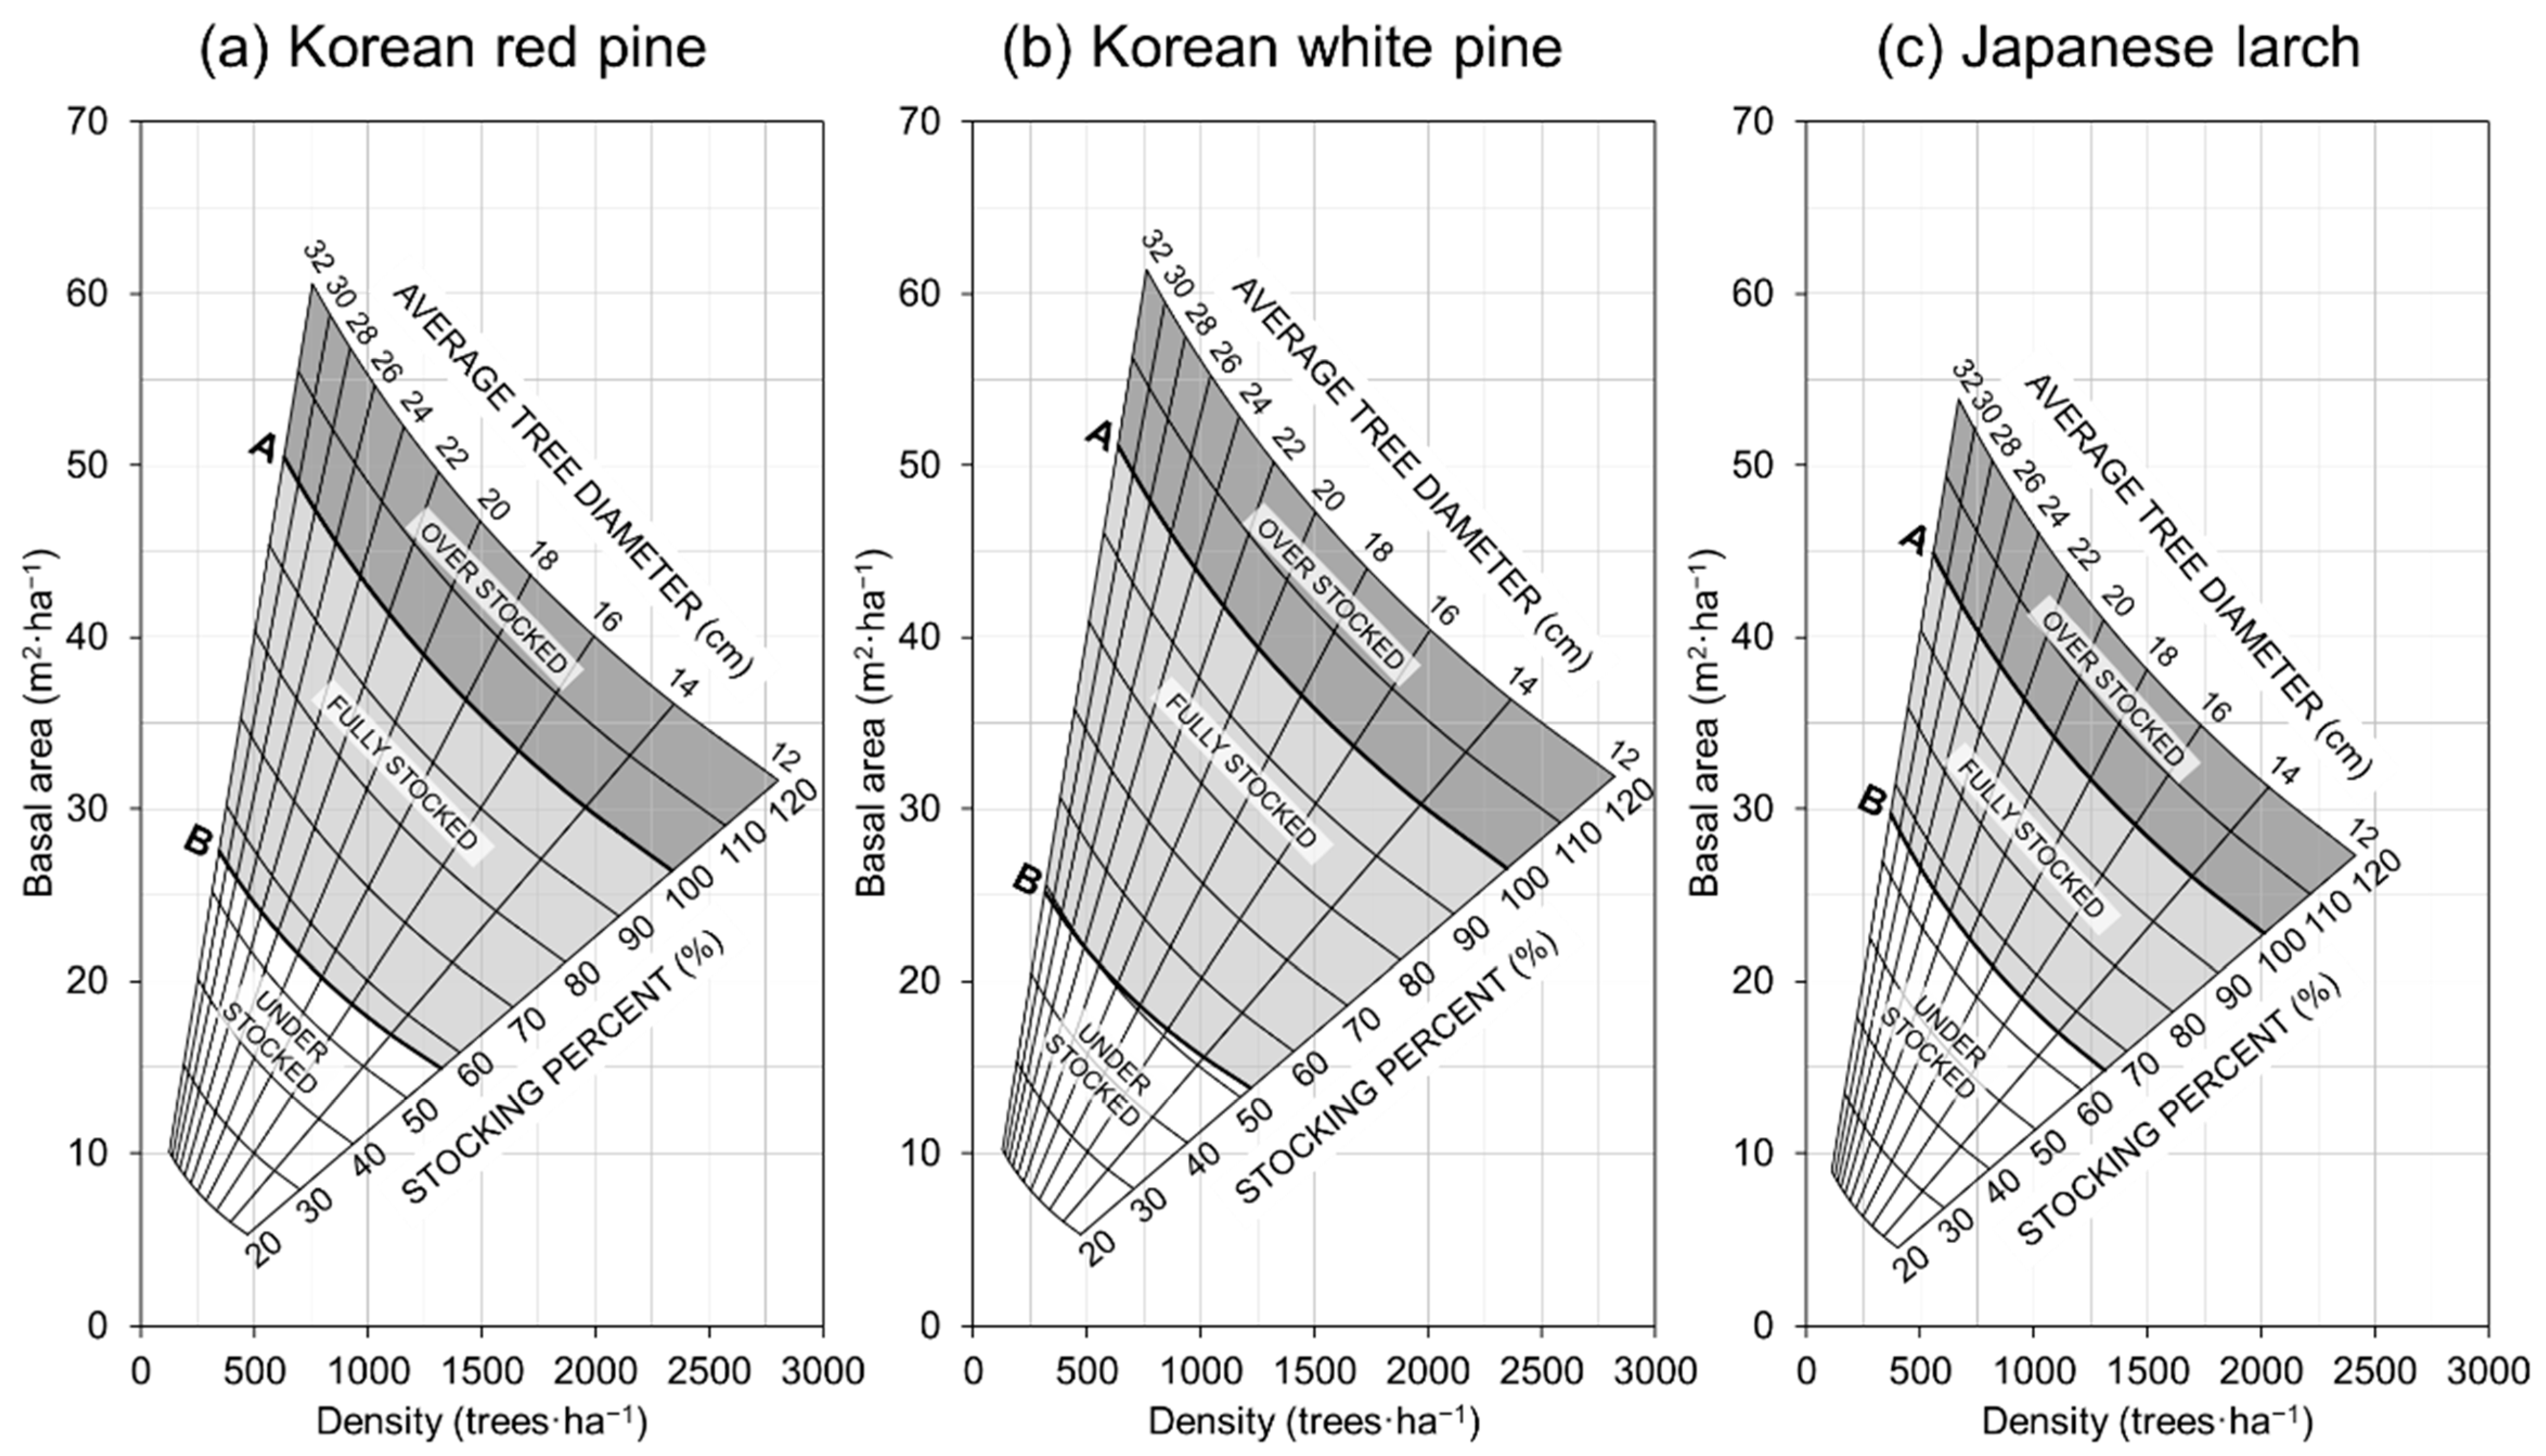
3.2. Illustration and Comparison of Stocking Diagram Applications

The stocking diagram was plotted from the allometric relationship and its estimated parameters in the fitting dataset. The average tree diameter and TPH for the A-level and B-level stockings were calculated using Equations (5) and (7) and the fixed-effect parameters of Table 2. The relationships between BA and the other variables were calculated using Equation (1). The final stocking diagram by species consisted of D ¯ q , TPH, and BA with A-level and B-level stocking (Figure 5). The stocking percentage was calculated from the ratio of the A-level stocking percentage to the relative percentage range of 20–120% (Equation (5)). The average tree diameter was in the range of 12–32 cm so that it could encompass the Korean small and large tree diameter criteria of 16 cm and 30 cm, respectively [49].
The stocking diagram was categorized as overstocked and fully stocked stand conditions based on the A-level stocking percentage and as fully stocked and understocked stand conditions based on the B-level stocking percentage and the allometric equations (Figure 5). The stocking diagram for Japanese larch differed from that for Korean red pine and Korean white pine in terms of general shape. The two pine species had different absolute densities (TPH and BA) at the same D ¯ q . In terms of 100% stocking of 32 cm D ¯ q , the quantitative absolute densities for Korean white pine were 636 trees·ha−1 TPH and 51.1 m2·ha−1 BA, and for Japanese larch they were 558 trees·ha−1 TPH and 44.9 m2·ha−1 BA. Japanese larch had a lower quantitative absolute density than either Korean red pine or Korean white pine. In 12 cm D ¯ q , the 100% stockings of Japanese larch were 2013 trees·ha−1 TPH and 22.8 m2·ha−1 BA. This carrying capacity was lower than that for the other two species. This discrepancy originated from the differences among the species in terms of their slope parameters for the T A ¯ allometry model (Table 2).
The A-level stocking and stocking percentage were affected by the T A ¯ and, by extension, the relationships among the variables. Similarly, the B-level stocking percentage was influenced by the CW–DBH allometry model. Korean red pine and Korean white pine had large CW and, therefore, large crown areas (Figure 4). The B-level stockings (crown competition factor = 100) in 32 cm D ¯ q were 343 trees·ha−1 and 313 trees·ha−1 TPH O , respectively (Figure 5a,b). In contrast, the Japanese larch had a relatively smaller CW and, by extension, a smaller crown area. Its B-level stocking in 32 cm D ¯ q was 370 trees·ha−1 TPH O (Figure 5c). This characteristic slightly differed across the D ¯ q range in the stocking diagram because each species had a different intercept and slope parameters (Table 2). In 12 cm D ¯ q , the TPH O of B-level stocking were 1321 trees·ha−1 for Korean red pine, 1219 trees·ha−1 for Korean white pine, and 1311 trees·ha−1 for Japanese larch. The relationship between TPH O and D ¯ q affected the differences in BA among species in the B-level stocking. The ranges of BA in 12–32 cm D ¯ q were 14.9–27.5 m2·ha−1 for Korean red pine, 13.8–25.2 m2·ha−1 for Korean white pine, and 14.8–29.7 m2·ha−1 for Japanese larch. The B-level stocking % across D ¯ q were in the ranges of 55–57%, 49–52%, and 65–66% for Korean red pine, Korean white pine, and Japanese larch, respectively (Figure 5). The stocking diagrams for the three species were generally well represented and had similar shapes. Nevertheless, the stocking levels based on D ¯ q , TPH, and BA clearly differed among the three species.

4. Discussion

4.1. Suitability of Gingrich-Style Stocking Chart

We compared several Gingrich-style stocking charts developed in North America against that which was prepared in the present study. We validated the form and suitability of the stocking diagram designed here because this type of chart has not yet been implemented for the same species in Korea. Here, the overall shapes of D ¯ q , TPH, and BA resembled those reported in Gingrich [6]. Our absolute TPH for A-level stocking was 200 trees·ha−1 lower than that of the previous study. Hence, a relatively lower BA was shown in the present study. However, this discrepancy was attributed to the presence of hardwoods in the upland regions of the United States. Although these regions might substantially differ from those of the present study in terms of species, geography, climate, and stand origin and structure, our stocking diagrams generally presented a similar stocking level to that of other studies with reference to general plant ecology or silvicultural practices. The A-level stocking reported in Larsen et al. [7] for midwestern U.S. bottomland forests was similar to that reported in the current study, especially for Japanese larch and especially in the quadratic mean diameter range 8–12 inches D ¯ q (~20–30 cm D ¯ q ). For the A-level stocking in this D ¯ q   range for Japanese larch, there were 1089 trees·ha−1 TPH and 34.2 m2·ha−1 BA at 20 cm D ¯ q , and 615 trees·ha−1 TPH and 43.5 m2·ha−1 BA at 30 cm D ¯ q (Figure 5c).
The highest comparability was determined for a recently plotted stocking diagram for longleaf pine (Pinus palustris Mill.) forest [5]. The stocking charts for the Korean pines were analogous to the stocking chart for longleaf pine after direct comparison of the metric unit charts of the previous study (Figure 5a,b). The stocking diagram of Korean red pine was highly similar to that of longleaf pine (693 trees·ha−1 TPH and 49.0 m2·ha−1 BA at 30 cm D ¯ q on A-level stocking in the current study). As there was high comparability even at the lower D ¯ q (≤20 cm) despite the differences in species and region, the stocking diagrams for the pine species in the present study can provide feasible stocking ranges for practical application.
On the other hand, the B-level stocking of Larsen et al. [7] was as low as 30%, while the B-level stocking calculated in the present study was 55–57% for Korean red pine, 49–52% for Korean white pine, and 65–66% for Japanese larch. The B-level stocking of longleaf pine was <40% and markedly differed from that of the present study [5]. However, it was analogous to the result of Gingrich [6], whose B-level stocking was ~60%. In this way, B-level stocking either resembled or differed from the stocking of the current work depending on the species and stand condition. The allometric equation for CW–DBH of young Japanese larch stands provided similar estimates for relatively smaller DBH [50]. Hence, B-level stocking was deemed appropriate for the present study considering that it serves as the marginal density level after thinning. Thus, absolute quantitative comparisons are undesirable in situations where the regions, species, data characteristics, and management objectives differ [7].
The stand density management diagram enables accurate density management via allometry and is suitable for practical field applications [12]. It allows forest managers to compute the remaining variable based on the other two variables and to plan silvicultural operations such as thinning by interpolating the amount of thinned BA from the y-axis. Moreover, combinations of any two of the three variables ( D ¯ q , TPH, and BA) facilitates designation of the relative stocking as a major feature.

4.2. Practicability and Applicability of the Stand Density Management Diagram

In the attempt to plot a stand density management diagram for Korea, an allometric line of Korean red pine in the Gangwon area was proposed by using the maximum stand density line [18]. Relative to the present study, similar stocking and maximum TPH were suggested at 30 cm D ¯ q ; however, compared to our study, the maximum TPH was lower as the D ¯ q decreased at <30 cm D ¯ q . This approach was also tested on Japanese larch stand density management [19]. The density chart for that study resembled that of the present study. It indicated 100% stocking of 22 cm D ¯ q in 1000 trees·ha−1 (TPH). In general, the density charts developed in the past [18,19] were similar to those plotted here. Nevertheless, the stand structures of the previous studies markedly differed from those of the present time in terms of age class, mean diameter, stand volume, and other variables. Stand density management diagrams calculated for our study reflect current stand condition characteristics. The diagrams used in the present study were evaluated to be feasible and practicable for field application. In contrast, those used in the previous study were plotted on a log scale and lacked B-level stocking; therefore, they can be difficult to interpret.
The maximum stand density lines used in previous stand density management diagrams [22,23,24] developed using the methodology proposed by Ando (1968) were slightly lower than the A-level stocking for the species in the present study. This method was recently applied to propose a Korean red pine density guideline based on National Forest Inventory data [25,26]. TPH corresponded to a relative yield index of unity (1) and referred to maximum stand density. The TPH in the previous study resembled that of the A-level stocking in the present study. The adequate relative yield index of 0.84 recommended for density management by Park et al. [26] corresponded to 550 trees·ha−1 (TPH) at 30 cm DBH and was contained within the fully stocked density area of the present study. Stocking diagrams for density management are nonetheless required because the previous study differed from the current work in terms of National Forest Inventory data sources and the stocking diagram approach used. Moreover, considering that the seed tree method is used for the natural regeneration of Korean red pine in Korea, both the B-level stocking percentage and the stocking level may be implemented under this guideline for silvicultural practices or recruitment [5].
Empirical yield tables for each species were provided by the National Institute of Forest Science (NIFoS) and were consulted to validate stocking diagrams developed in our study. The DBH, TPH, and BA in the empirical yield table provided by NIFoS all fell within the range of the fully stocked densities by species in the stocking diagram of the present study. Hence, the stocking diagrams effectively represented the stocking level characteristics of the empirical stands [51,52]. The stocking diagrams for all three species were effective and easily applicable as they corresponded to those of the previous studies. In earlier studies on longleaf pine and upland hardwoods, it was reported that 70–80% stocking caused density-induced self-thinning [36,53]. The stocking percentage was ~70% for all three species after the empirical yield table data were plotted [51,52]. In the present study, <70% stocking based on the consideration of the stocking level of density-induced mortality and post-thinning stand growth was recommended following the silvicultural treatments such as pre-commercial thinning or commercial thinning.
The difference in TPH by D ¯ q on the x-axis increased with decreasing D ¯ q for all three species. Thus, variation in maximum TPH on the stocking level increased with decreasing D ¯ q . In other words, the carrying capacity at higher density increases with decreasing tree diameter [5]. In cases of equal stand density such as BA, large trees are less prone to crowding than small trees [2]. Thus, when stocking is not considered, silvicultural treatments such as thinning may waste growing space in a stand. When stocking meets the stand management objectives, it may effectively control density in the field because it accounts for the ratio of relative crowding (based on the observed growing space) to the maximum density criterion line. In terms of percentage stocking, although the stocking diagrams of Korean red pine and Korean white pine seemed to be similar to each other, they must be provided separately for each species. This is not only because of the obvious difference in B-level stocking, but also based on the characteristics of each species such as tree physiology, shade tolerance, and afforestation method [22,24,49,51,52]. The models developed in the present study were validated against other models reported for species in Korea. Cross-checking of the datasets from the other reports and the trajectories of stand density should be verified in future work. However, based on our models and comparisons against models for species inside and outside of Korea, the recommended stocking percentage is to be higher than B-level stocking by species and lower than 70% stocking in general after thinning. For this reason, the type of stocking chart developed in the present study was evaluated for use as a practical stand density management diagram.

5. Conclusions

To develop A-level and B-level stocking with a Gingrich-style stocking chart, we used data from permanent plots for three species and applied the relative density based on the maximum stand density line. A-level stocking was calculated from the allometric relationship of T A ¯   D ¯ q . B-level stocking was calculated from the allometric relationship of CW–DBH. According to the estimated parameters, T A ¯ was largest for Japanese larch and smallest for Korean white pine. Hence, the descending order of maximum allowable fully stocked density (TPH and BA) was Korean white pine, Korean red pine, and Japanese larch. In contrast, the crown area determined from CW–DBH was largest for Korean white pine and smallest for Japanese larch. Therefore, the B-level stocking, generated by a crown competition factor of 100, resulted in the lowest T P H O for Korean white pine and the highest T P H O for Japanese larch.
In our stocking diagrams, the ranges of overstocked, fully stocked, and understocked densities differed among the species. TPH and BA for the A-level stocking were Korean white pine, Korean red pine, and Japanese larch in the order across all D ¯ q . In view of the references and other guidelines for Korea and the results of the present study, the recommended post-thinning stocking percentage is <70%. B-level stocking resulted in the highest T P H O and BA for Japanese larch followed by Korean red pine and Korean white pine. The B-level stocking was also assessed as a reference line for the creation of open-grown canopy space because Korean red pine stands may be established in Korea by the seed tree method. Based on the stocking diagrams developed in our study, forest managers are encouraged to manage the stand density by generally keeping the stocking percentage less than 70% after silvicultural treatments. The graphic illustrations provided by the stocking diagrams are useful and convenient diagnostic tools for the practical management of stand density.

Author Contributions

Conceptualization, D.L. and J.C.; methodology, D.L. and J.C.; software, D.L.; validation, D.L. and J.C.; formal analysis, D.L.; investigation, D.L.; resources, D.L.; data curation, D.L.; writing—original draft preparation, D.L.; writing—review and editing, D.L. and J.C.; visualization, D.L.; supervision, J.C.; project administration, D.L. and J.C.; funding acquisition, D.L. and J.C. All authors have read and agreed to the published version of the manuscript.

Funding

This research was supported by the Basic Science Research Program through the National Research Foundation of Korea (NRF) funded by the Korean Ministry of Education (Grant No. NRF-2019R1A6A3A03032912 in 2019 and Grant No. NRF-2016R1D1A1B02011648 in 2020).

Acknowledgments

Support for data collection was provided by the National Forest Management Division of the Korea Forest Service. The Forest Resource Monitoring Center on Climate Change (FRMCCC) at Kangwon National University provided data maintenance support. The many contributions of Yeongwan Seo, Researcher with the FRMCCC, in establishing permanent plots and collecting field data are gratefully acknowledged.

Conflicts of Interest

The authors declare no conflicts of interest.

References

  1. Ernst, R.L.; Warren, P.A. Forest Stand Density and Stocking: Concepts, Terms, and the Use of Stocking Guides; WO GTR-44; US Forest Service: Washington, DC, USA, 1985; p. 8.
  2. McGill, D.W.; Rogers, R.; Martin, A.J.; Johnson, P.S. Measuring stocking in northern red oak stands in Wisconsin. North. J. Appl. For. 1999, 16, 144–150. [Google Scholar] [CrossRef] [Green Version]
  3. Lhotka, J.M.; Loewenstein, E.F. An examination of species-specific growing space utilization. Can. J. For. Res. 2008, 38, 470–479. [Google Scholar] [CrossRef]
  4. Puettmann, K.J.; Hann, D.W.; Hibbs, D.E. Evaluation of the size-density relationships for pure red alder and Douglas-fir stands. For. Sci. 1993, 39, 7–27. [Google Scholar] [CrossRef]
  5. Kara, F.; Loewenstein, E.F.; Lhotka, J.M.; Kush, J.S. A gingrich-style stocking chart for longleaf pine (Pinus palustris Mill.) forests. For. Sci. 2018, 64, 307–315. [Google Scholar] [CrossRef]
  6. Gingrich, S.F. Measuring and evaluating stocking and stand density in upland hardwood forests in the Central States. For. Sci. 1967, 13, 38–53. [Google Scholar] [CrossRef]
  7. Larsen, D.R.; Dey, D.C.; Faust, T. A stocking diagram for midwestern eastern cottonwood-silver maple-American sycamore bottomland forests. North. J. Appl. For. 2010, 27, 132–139. [Google Scholar] [CrossRef] [Green Version]
  8. Zeide, B. How to measure stand density. Trees 2005, 19, 1–14. [Google Scholar] [CrossRef]
  9. Zeide, B. Comparison of self-thinning models: An exercise in reasoning. Trees 2010, 24, 1117–1126. [Google Scholar] [CrossRef]
  10. Goelz, J. A stocking guide for southern bottomland hardwoods. South. J. Appl. For. 1995, 19, 103–104. [Google Scholar] [CrossRef]
  11. Goelz, J. Stocking guides for water tupelo and baldcypress. South. J. Appl. For. 1995, 19, 105–108. [Google Scholar] [CrossRef]
  12. Larsen, D.R. Spreadsheet stocking diagrams for the central hardwoods. North. J. Appl. For. 2002, 19, 93–94. [Google Scholar] [CrossRef] [Green Version]
  13. Newton, P.F. Stand density management diagrams: Review of their development and utility in stand-level management planning. For. Ecol. Manag. 1997, 98, 251–265. [Google Scholar] [CrossRef]
  14. Seymour, R.S. Low-Density management of white pine crop trees: A primer and early research results. North. J. Appl. For. 2007, 24, 301–306. [Google Scholar] [CrossRef] [Green Version]
  15. Korea Forest Research Institute. Commercial Tree Species 1 Korean Red Pine (Pinus densiflora Siebold & Zucc.); Korea Forest Research Institute: Seoul, Korea, 2012; p. 250. (In Korean) [Google Scholar]
  16. Korea Forest Research Institute. Commercial Tree Species 3 Korean white Pine (Pinus koraiensis Siebold & Zucc.); Korea Forest Research Institute: Seoul, Korea, 2012; p. 168. (In Korean) [Google Scholar]
  17. Korea Forest Research Institute. Commercial Tree Species 4 Japanese Larch (Larix kaempferi (Lamb.) Carriere); Korea Forest Research Institute: Seoul, Korea, 2012; p. 180. (In Korean) [Google Scholar]
  18. Kim, D.C. Stand density and optimum growing stock of Korean red pine forest in Kwangwon district. J. Korean For. Soc. 1963, 3, 47–51. (In Korean) [Google Scholar]
  19. Ma, S.K. Productivity and density control of stands of Japanese larch. J. Korean For. Soc. 1977, 34, 21–30. [Google Scholar]
  20. Ando, T. Growth analysis on the natural stands of Japanese red pine (Pinus densiflora Sidb Et Zucc). II. Analysis of stand density and growth. Bull. Gov. For. Exp. Stn. 1962, 147, 1–77, (In Japanese with English Summary). [Google Scholar]
  21. Ando, T. Ecological growth analysis on the natural stands of Japanese red pine (Pinus densiflora Sidb Et Zucc). II. Analysis of stand density and growth. Bull. Gov. For. Exp. Stn. 1968, 210, 1–153, (In Japanese with English Summary). [Google Scholar]
  22. Shim, D.S.; Park, C.W.; Lee, H.K.; Kim, S.I. A study on stand density management diagram of Korean white pine (Pinus koraiensis) stands. Res. Rep. For. Res. Inst. Korea 1985, 32, 38–48, (In Korean with English Summary). [Google Scholar]
  23. Shim, D.S.; Park, C.W.; Lee, H.K.; Kim, S.I. A study on stand density management diagram of Japanese larch (Larix leptolepis) stand. Res. Rep. For. Res. Inst. Korea 1986, 33, 1–12, (In Korean with English Summary). [Google Scholar]
  24. Kim, D.K.; Kim, J.W.; Park, S.K.; Oh, M.Y.; Yoo, J.H. Growth analysis of natural pure young stand of red pine in Korea and study on the determination of reasonable density. Res. Rep. For. Res. Inst. Korea 1987, 34, 32–40, (In Korean with English Summary). [Google Scholar]
  25. Park, J.H.; Lee, K.S.; Yoo, B.O.; Park, Y.B.; Jung, S.Y. Development and validation of the stand density management diagram for Pinus densiflora forests in Korea. J. Korean For. Soc. 2016, 105, 342–350. [Google Scholar] [CrossRef]
  26. Park, J.; Jung, S.; Yoo, B.; Lee, K.; Park, Y.; Kim, H. The production objectives and optimal standard of density control using stand density management diagram for Pinus densiflora forests in Korea. J. Korean For. Soc. 2017, 106, 457–464. [Google Scholar] [CrossRef]
  27. Lee, D.; Choi, J. Evaluating maximum stand density and size–density relationships based on the competition density rule in Korean pines and Japanese larch. For. Ecol. Manag. 2019, 446, 204–213. [Google Scholar] [CrossRef]
  28. Choi, J.; Lorimer, C.G.; Vanderwerker, J.; Cole, W.G.; Martin, G.L. A crown model for simulating long-term stand and gap dynamics in northern hardwood forests. For. Ecol. Manag. 2001, 152, 235–258. [Google Scholar] [CrossRef]
  29. Choi, J.; Lorimer, C.G.; Vanderwerker, J.M. A simulation of the development and restoration of old-growth structural features in northern hardwoods. For. Ecol. Manag. 2007, 249, 204–220. [Google Scholar] [CrossRef]
  30. Curtis, R.O.; Marshall, D.D. Why quadratic mean diameter? West. J. Appl. For. 2000, 15, 137–139. [Google Scholar] [CrossRef] [Green Version]
  31. Johnson, P.S.; Shifley, S.R.; Rogers, R. The Ecology and Silviculture of Oaks; CABI Publishing: New York, NY, USA, 2002; p. 503. [Google Scholar]
  32. Chisman, H.H.; Schumacher, F.X. On the tree-area ratio and certain of its applications. J. For. 1940, 38, 311–317. [Google Scholar] [CrossRef]
  33. Avery, T.E.; Burkhart, H.E. Forest Measurements, 5th ed.; McGraw-Hill: New York, NY, USA, 2002; p. 456. [Google Scholar]
  34. Stout, S.L.; Larson, B.C. Relative Stand Density: Why do we Need to Know? USDA Forest Service General Technical Report INT-243: USDA Forest Service; Intermountain Forest and Range Experiment Station: Ogden, UT, USA, 1988; pp. 73–79. [Google Scholar]
  35. Long, J.N. A practical approach to density management. For. Chron. 1985, 61, 23–27. [Google Scholar] [CrossRef] [Green Version]
  36. Shaw, J.D.; Long, J.N. A density management diagram for longleaf pine stands with application to red-cockaded woodpecker habitat. South. J. Appl. For. 2007, 31, 28–38. [Google Scholar] [CrossRef] [Green Version]
  37. Solomon, D.S.; Zhang, L. Maximum size–density relationships for mixed softwoods in the northeastern USA. For. Ecol. Manag. 2002, 155, 163–170. [Google Scholar] [CrossRef]
  38. Lee, D.S. Integrated Growth and Yield Models of Pinus densiflora, Pinus koraiensis, and Larix kaempferi Stands in Korea. Ph.D. Thesis, Kangwon National University, Chuncheon, Korea, 2018; p. 155. [Google Scholar]
  39. Krajicek, J.E.; Brinkman, K.A.; Gingrich, S.F. Crown competition—A measure of density. For. Sci. 1961, 7, 35–42. [Google Scholar]
  40. Sampson, T.L. A Stocking Guide for Northern Red Oak in New England. Master’s Thesis, University of New Hampshire, Durham, UK, 1983; p. 98. [Google Scholar]
  41. Sampson, T.L.; Barret, J.P.; Leak, W.B. A Stocking Chart for Northern Red Oak in New England; University of New Hampshire, New Hampshire Agricultural Experiment Station Report no. 100: Durham, NH, USA, 1983; p. 14. [Google Scholar]
  42. Stout, B.B. Crown-Stem Relationships in Forest Trees; Rutgers University: New Brunswick, NJ, USA, 1963; Unpublished work. [Google Scholar]
  43. Stout, B.B. Stem-Crown relationships in scots pine. In Proceedings of the Northeastern Forest Tree Improvement Conference, New Brunswick, NJ, USA, 6–7 August 1963; Volume 11. [Google Scholar]
  44. Kara, F.; Topaçoğlu, O. Onset of canopy closure for black pine, Turkish red pine and Scots pine forests. J. For. Sci. 2018, 64, 224–229. [Google Scholar] [CrossRef] [Green Version]
  45. Grégoire, T.G.; Schabenberger, O.; Barrett, J.P. Linear modelling of irregularly spaced, unbalanced, longitudinal data from permanent-plot measurements. Can. J. For. Res. 1995, 25, 137–156. [Google Scholar] [CrossRef]
  46. Hall, D.B.; Clutter, M. Multivariate multilevel nonlinear mixed effects models for timber yield predictions. Biometrics 2004, 60, 16–24. [Google Scholar] [CrossRef]
  47. Bianchi, S.; Siipilehto, J.; Hynynen, J. How structural diversity affects Norway spruce crown characteristics. For. Ecol. Manag. 2020, 461, 117–932. [Google Scholar] [CrossRef]
  48. SAS Institute Inc. SAS/STAT 14.1 User’s Guide; SAS Institute Inc.: Cary, NC, USA, 2015. [Google Scholar]
  49. Korea Forest Research Institute. Standard Manual of Sustainable Forest Resources Management; Korea Forest Research Institute: Seoul, Korea, 2005; p. 291. (In Korean) [Google Scholar]
  50. Chang, C.S. Relationship between growth of individual trees and surrounding density in larch stands (Larix leptolepis). J. Korean For. Soc. 1985, 71, 27–32, (In Korean with English Summary). [Google Scholar]
  51. Korea Forest Research Institute. Stem Volume, Biomass, and Yield Table; Korea Forest Research Institute: Seoul, Korea, 2012; p. 261. (In Korean) [Google Scholar]
  52. National Institute of Forest Science. Empirical Yield Table; National Institute of Forest Science: Seoul, Korea, 2016; p. 64. (In Korean) [Google Scholar]
  53. Williams, R.A. Use of stand density index as an alternative to stocking percent in upland hardwoods. North. J. Appl. For. 2003, 20, 137–142. [Google Scholar] [CrossRef] [Green Version]
Figure 1. Sample data used to develop (a) A-level and (b) B-level stocking for Korean red pine, Korean white pine, and Japanese larch with maximum stand density lines by species. Sample data were constrained by plots with relative density > 0.7 for A-level and relative density < 0.5 for B-level. Calculations were made using maximum stand density lines derived from stand density indices in Lee and Choi [27]. D ¯ q is the quadratic mean diameter.
Forests 11 00833 g001
Figure 2. Residual plots of allometric models for (a) A-level and (b) B-level stocking by species. The residuals are derived from the model fitting of Equations (8) and (9) in Table 2.
Forests 11 00833 g002
Figure 3. Scatterplots of mean individual tree area ( T A ¯ ) over quadratic mean diameter ( D ¯ q ) used for modeling (a) A-level stocking and (b) B-level stocking by species. Regression lines of T A ¯ D ¯ q via Equation (4) for A-level stocking displayed using fixed effects of Equation (8) developed in Table 2.
Forests 11 00833 g003
Figure 4. Scatterplots of crown width (CW) over diameter at breast height (DBH) for (a) Korean red pine, (b) Korean white pine, and (c) Japanese larch used for modeling B-level stocking. CW-DBH (d) regression lines by species via Equation (6) displayed using fixed effects of Equation (9) developed in Table 2.
Forests 11 00833 g004
Figure 5. Stand density management diagrams showing relationships among average tree diameter, number of trees per hectare, and basal area per hectare for (a) Korean red pine, (b) Korean white pine, and (c) Japanese larch. A-level stocking represents maximum density on fully stocked stand as boundary line between overstocked and fully stocked. B-level stocking represents minimum density on fully stocked stand as boundary line between fully stocked and understocked. Average tree diameter is quadratic mean diameter and covers range of small to large tree diameters in Korea.
Forests 11 00833 g005
Table 1. Summary statistics of each sample data used for A-level and B-level stocking by species. DBH (The diameter at breast height); SD (standard deviation).
Dataset UseCriterion for Selecting Data SourcesSpeciesSample SizeVariablesMeanSDMinimumMaximum
Maximum density on full stocking (A-level stocking)Relative density >0.7Korean red pine98 plotsStand age (year)511812105
Average DBH (m)22.06.18.237.2
Quadratic mean diameter (cm)23.26.28.438.4
Stand density (trees·ha−1)11704995002860
Basal area (m2·ha−1)43.410.314.574.0
Korean white pine118 plotsStand age (year)43131883
Average DBH (m)23.95.812.539.5
Quadratic mean diameter (cm)24.65.912.740.4
Stand density (trees·ha−1)10743964532144
Basal area (m2·ha−1)46.310.823.476.4
Japanese larch128 plotsStand age (year)42121966
Average DBH (m)23.66.013.041.0
Quadratic mean diameter (cm)24.26.113.341.5
Stand density (trees·ha−1)9313173561714
Basal area (m2·ha−1)38.78.023.961.7
Minimum density on full stocking (B-level stocking)Relative density <0.5Korean red pine543 trees in 50 plotsAge (year)482112105
DBH (cm)28.310.45.361
Crown width (m)5.41.81.110.4
Korean white pine755 trees in 68 plotsAge (year)41181882
DBH (cm)28.510.87.356.3
Crown width (m)5.81.82.110.7
Japanese larch1118 trees in 105 plotsAge (year)41132265
DBH (cm)27.18.67.953.4
Crown width (m)5.21.51.810.6
Table 2. Parameter estimates and fit statistics through tree allometric equations for A-level and B-level stocking by species.
Model TypeEquationSpeciesSample SizeFixed EffectsRandom EffectsResidualFit Statistics
b 0 b 1 var ( u ei ) var ( u ei . pj ) var ( u ei . pj . tk ) var ( ε ) R 2 RMSE
T A ¯ D ¯ q
(for A-level stocking)
Equation (8)Korean red pine98 plots0.9153 (0.1183)0.0962 (0.0048)0.02300.0178-0.02170.96800.1101
Korean white pine118 plots0.9221 (0.1364)0.0951 (0.0052)0.03850.0111-0.01290.97980.0857
Japanese larch128 plots1.0262 (0.0851)0.1002 (0.0034)0.00470.0151-0.01620.97130.1025
CW – DBH
(for B-level stocking)
Equation (9)Korean red pine543 trees1.3099 (0.2269)0.1496 (0.0057)0.39100.00000.25720.83980.75370.8794
Korean white pine755 trees1.3452 (0.1968)0.1572 (0.0054)0.27610.00000.23290.60270.82080.7451
Japanese larch1118 trees1.4669 (0.1928)0.1375 (0.0054)0.49280.09260.11080.78890.68620.8555
Note: T A ¯ is mean individual tree area (m2). D ¯ q is quadratic mean diameter (cm). CW is crown width (m). DBH is diameter at breast height (cm). b 0 and b 1 are fixed effects with p-values provided in parentheses. v a r ( u e i ) is variance of random effect at experiment level. v a r ( u e i . p j ) is variance of random effect at plot level. v a r ( u e i . p j . t k ) is variance of random effect at tree level. v a r ( ε ) is variance of residual in model performance. R 2 is coefficient of determination. RMSE is root mean square error.

