Article

Physiological Characterization and Transcriptome Analysis of Camellia oleifera Abel. during Leaf Senescence

1
Key Laboratory of Forest Silviculture and Conservation of the Ministry of Education, The College of Forestry, Beijing Forestry University, 35 Qinghua East Road, Beijing 100083, China
2
Jiangxi Environmental Engineering Vocational College, Ganzhou 341000, China
*
Author to whom correspondence should be addressed.
Forests 2020, 11(8), 812; https://doi.org/10.3390/f11080812
Submission received: 10 July 2020 / Revised: 24 July 2020 / Accepted: 25 July 2020 / Published: 28 July 2020
(This article belongs to the Special Issue Genetics and Improvement of Forest Trees)

Abstract

:
Camellia (C.) oleifera Abel. is an evergreen small arbor with high economic value for producing edible oil that is well known for its high level of unsaturated fatty acids. The yield formation of tea oil extracted from fruit originates from the leaves, so leaf senescence, the final stage of leaf development, is an important agronomic trait affecting the production and quality of tea oil. However, the physiological characteristics and molecular mechanism underlying leaf senescence of C. oleifera are poorly understood. In this study, we performed physiological observation and de novo transcriptome assembly for annual leaves and biennial leaves of C. oleifera. The physiological assays showed that the content of chlorophyll (Chl), soluble protein, and antioxidant enzymes including superoxide dismutase, peroxide dismutase, and catalase in senescing leaves decreased significantly, while the proline and malondialdehyde concentration increased. By analyzing RNA-Seq data, we identified 4645 significantly differentially expressed unigenes (DEGs) in biennial leaves with most associated with flavonoid and phenylpropanoid biosynthesis and phenylalanine metabolism pathways. Among these DEGs, 77 senescence-associated genes (SAGs) including NOL, ATAF1, MDAR, and SAG12 were classified to be related to Chl degradation, plant hormone, and oxidation pathways. The further analysis of the 77 SAGs based on the Spearman correlation algorithm showed that there was a significant expression correlation between these SAGs, suggesting the potential connections between SAGs in jointly regulating leaf senescence. A total of 162 differentially expressed transcription factors (TFs) identified during leaf senescence were mostly distributed in MYB (myeloblastosis), ERF (Ethylene-responsive factor), WRKY, and NAC (NAM, ATAF1/2 and CUCU2) families. In addition, qRT-PCR analysis of 19 putative SAGs were in accordance with the RNA-Seq data, further confirming the reliability and accuracy of the RNA-Seq. Collectively, we provide the first report of the transcriptome analysis of C. oleifera leaves of two kinds of age and a basis for understanding the molecular mechanism of leaf senescence.

1. Introduction

Camellia (C.) oleifera Abel. is an evergreen small arbor within the genus Camellia of the family Theaceae. It has been cultivated and utilized in China for more than 2000 years and is one of the four major woody oil plants in the world [1]. The tea oil extracted from C. oleifera is mainly composed of unsaturated fatty acids including oleic acid and linoleic acid, which can improve the antioxidant capacity and protect the liver, among other benefits [2,3,4]. Moreover, the United Nations Food and Agriculture Organization recommended the tea oil as a high-quality, healthy vegetable oil due to its nutritional value and excellent storage quality [5]. However, with the growing demand for high-quality edible oil, the low production of tea oil can no longer meet the market demand, so increasing the output of C. oleifera has always been one of the most urgent problems to be solved in the research of this species [6].
Many researches have shown that leaf senescence is crucial to limit the yield and quality of tree species [7]. This process is tightly regulated by both endogenous factors such as leaf age, the state of plant hormones, and the stages of growth and development as well as external factors mainly including diverse environmental conditions like drought and salinity [8]. During the process of leaf senescence, some synergetic changes occurred at the leaf physiological, biochemical, and molecular processes including chlorophyll (Chl) degradation, hydrolysis of macromolecules, accumulation of malondialdehyde (MDA), phytohormone changes, some redox processes, and the responses of senescence-associated genes (SAGs) [9]. To date, many advancements have been made in the research on leaf senescence at the molecular level, and a large number of SAGs have been identified including SAG family genes, PAO, S40, ATAF1, GBF1, etc. [10,11,12,13,14,15,16,17]. These genes participate in the process of leaf senescence through a complex regulatory network.
Chl degradation is one of the most significant characteristics and the genes related to it can be induced during leaf senescence [18]. For example, in rice (Oryza sativa L.), NOL and SGR (STAY GREEN), the key genes responsible for catalyzing Chl degradation, are significantly induced in older leaves [19,20]. Phytohormones are also involved in response to leaf senescence, with abscisic acid (ABA), ethylene, jasmonic acid (JA), and salicylic acid (SA) promoting leaf senescence, auxin, and cytokinin delaying senescence [21]. In arabidopsis, ABA receptor PYL9 (promoter-pyrabactin resistance 1-like) transcripts are obviously more abundant in older leaves, and PYL9 accelerates leaf senescence of the ABA pathway [22]. AHK2, known as a cytokinin receptor, mediates cytokinin-dependent Chl retention; in the leaves of ahk2 mutant, Chl content reduced and the precocious senescence phenotype was observed [23]. In addition, recent studies have demonstrated that redox signaling in leaf changes accordingly during leaf senescence including a reduction of antioxidant enzyme activity, accumulation of reactive oxygen species (ROS), and expression changes in relevant genes [24]. In kiwifruit (Actinidia chinensis), the accumulation of monodehydroascorbate reductase (MDAR) reduces H2O2 content, thus delaying leaf senescence [25]. These studies indicate that leaf senescence is a very complicated life process, and involved in multiple layers and signaling pathways. In addition to these functional genes or key enzymes, more recently, there has been considerable progress in understanding the importance of transcription factors (TFs), which could be responsible for the onset of leaf senescence [26]. In arabidopsis, WRKY75 acts as a positive regulator of leaf senescence, and overexpression of WRKY75 increases the expression of SID2 (SA INDUCTION-DEFICIENT2), thus promoting SA production; moreover, WRKY75 suppresses H2O2 scavenging, and can form three interlinking positive feedback loops with SA and ROS [27]. ORE1, a member of NAC TF family, is involved in the direct regulation of Chl catabolic genes, and can accelerate ethylene production by inducing the expression of ACS2, a vital ethylene biosynthesis gene, thus positively regulating leaf senescence in arabidopsis [28].
The mechanism of senescence has been intensively studied in model plants and crops such as arabidopsis and rice, however, the genes involved in the molecular mechanism driving leaf senescence in C. oleifera remain elusive. Therefore, the main objective of this study was to determine the physiological changes and gene expression profiling between C. oleifera leaves of two types of ages. In the present study, physiological analysis of two leaf types was performed measuring Chl content, soluble protein concentration, antioxidant enzyme activity, and accumulation of MDA and proline. The gene expression profiles were determined by RNA-Seq and qRT-PCR (Quantitative Real-time PCR). The putative SAGs and pathways associated with leaf senescence were identified and analyzed by means of multiple bioinformatics tools. Our study provides an initial analysis for understanding the underlying molecular mechanisms of leaf senescence and is a valuable resource for further identification of genes related to leaf senescence in C. oleifera.

2. Materials and Methods

2.1. Plant Materials and Growth Conditions

The plant material used in this study was 6-year-old C. oleifera ‘Cenxiruanzhi No. 3′. Trees were originally grown in the Fengsheng seedling field in Cenxi City, Guangxi Zhuang Autonomous Region, and transplanted into the greenhouse at Sanqingyuan, Beijing Forestry University, Beijing, with the maximum air temperature of 28 °C in the daytime and a minimum of 21 °C at night, and the humidity of 72%–85%. All plants were watered and fertilized under the same conditions. Seedlings displaying uniform growth and with no signs of disease or insects were selected for further research. The intact annual leaves (AL) and biennial leaves (BL) in the same position on the sunny side were collected in August 2019. All samples were immediately frozen in liquid nitrogen and stored at −80 °C for further analysis. More than three seedlings were pooled as one biological replicate, and three biological replicates were included for our collection. The samples were marked with serial numbers: AL_1, AL_2, AL_3, BL_1, BL_2, and BL_3.

2.2. Physiological Analysis of C. oleifera Leaves

The physiological changes differing between the two leaf types C. oleifera were determined before RNA-Seq. The total Chl content was determined by the ethanol–acetone method, with minor modifications [29]. The soluble protein content was measured by using the Coomassie brilliant blue G250 dye method [30]. Malondialdehyde (MDA) concentration was measured by the thiobarbituric acid method, as proposed by a previous study [31]. The proline content was determined according to the sulfosalicylic acid–acid ninhydrin method, with slight modifications [32]. The activities of superoxide dismutase (SOD) was measured by the Total Superoxide Dismutase Assay Kit (hydroxylamine method) and the activity of peroxidase (POD) was determined by the Peroxidase Assay Kit. The activity of catalase (CAT) was measured by the CATalase Assay Kit (Visible light). These assay kits were provided by the Jiancheng Bioengineering Institute (Nanjing, China).

2.3. Total RNA Extraction

C. oleifera leaves were ground into powder in liquid nitrogen with a sterilized mortar and pestle for RNA extraction. The total RNA was extracted from the leaves using FastPure Plant Total RNA Isolation Kits (polysaccharides and polyphenolics-rich) (Vazyme, Nanjing, China) according to the manufacturer’s instructions. Agilent 2100 and NanoDrop were used to quantify and evaluate the purified RNA. Each assay included three biological replicates.

2.4. Construction of the cDNA Library and RNA Sequencing

The extracted RNA was sent to the Beijing Genomics Institute (BGI) (Shenzhen, China), where the library was constructed and sequenced. The mRNA was purified using magnetic beads attached to Oligo (dT) and then purified mRNA was fragmented into small pieces. The first-strand cDNA was synthesized by random hexamer-primed reverse transcription, and subsequently, second strand cDNA was generated. Afterward, the A-tail adaptor was added through incubation, the cDNA fragments obtained after end repair were amplified by PCR, and then were purified by Ampure XP Beads. The purified product was tested on an Agilent Technologies 2100 bioanalyzer. Subsequently, the double-stranded PCR products were denatured and circularized to obtain the final library. The constructed library was finally sequenced on the BGIseq500 platform (BGI, Shenzhen, China).

2.5. Transcriptome Assembly and Annotation

SeqPrep (https://github.com/jstjohn/SeqPrep) and Sickle (https://github.com/najoshi/sickle) software were used to filter the raw sequencing reads. After filtering, the remaining reads were considered as clean reads and used for further bioinformatics analysis. Afterward, the clean reads were used for de novo assembly using Trinity (https://github.com/trinityrnaseq/trinityrnaseq) [33]. TransRate (http://hibberdlab.com/transrate/) [34] and CD-HIT (http://weizhongli-lab.org/cd-hit/) [35] were utilized to optimize and filter the initial assembly sequence, and BUSCO (Benchmarking Universal Single-Copy Orthologs, http://busco.ezlab.org) [36] was used to evaluate the assembly results. After assembly, all unigenes were aligned to the public protein databases including NR (NCBI non-redundant) (ftp://ftp.ncbi.nlm.nih.gov/blast/db/) [37], Swiss-Prot (http://web.expasy.org/docs/swiss-prot_guideline.html) [38], Pfam (http://pfam.xfam.org/) [39], COG (Clusters of Orthologous Groups of proteins, http://www.ncbi.nlm.nih.gov/COG/) [40], GO (Gene Ontology, http://www.geneontology.org) [41] and KEGG (Kyoto Encyclopedia of Genes and Genomes, http://www.genome.jp/kegg/) [42] databases.

2.6. Analysis and Enrichment of Differentially Expressed Genes (DEGs)

The data were analyzed on the free online platform of Majorbio Cloud Platform (www.majorbio.com). RSEM (RNA-Seq by Expectation Maximization) was utilized to calculate gene expression, and TPM (Transcripts Per Million reads) was used to quantify the expression level of genes [43]. DESwq2 (http://bioconductor.org/packages/stats/bioc/DESeq2/) [44] was used for statistical analysis of raw counts, and the DEGs were defined with p-adjust < 0.05 and |log2FC| ≥ 1, p-adjust is the p-value after multiple test correction using BH (fdr correction with Benjamini/Hochberg). GO enrichment analysis of DEGs were performed by using Goatools (https//github.com/tanghaibao/GOatools) [45]. When the corrected p-value < 0.05, the DEGs were defined to be significantly enriched. The KEGG pathway enrichment analysis of DEGs was performed by KOBAS (http://kobas.cbi.pku.edu.cn/home.do) [46]. The DEGs were considered to be significantly enriched when the corrected p-value < 0.05.

2.7. Screening of Key Senescence-Associated Genes (SAGs)

We initially screened 77 SAGs on the Majorbio Cloud Platform. By using the BLAST (Basic Local Alignment Search Tool) program of the NCBI (National Center for Biotechnology Information) and LSD 3.0 (Leaf Senescence Database, https://bigd.big.ac.cn/lsd/index.php) [47], we selected some SAGs with high homology to important SAGs in other species for further analysis.

2.8. Analysis of Expression Correlation

The Spearman algorithm was used to obtain the correlation coefficient between genes, and the expression correlation was defined with a correlation coefficient ≥ 0.5 and p-adjust < 0.05 [48]. According to the expression correlation between genes, the visual network diagram was constructed.

2.9. Quantitative Real-Time PCR (qRT-PCR) Analysis of Gene Expression

To evaluate the quality of RNA-Seq data, 19 unigenes were selected for qRT-PCR analysis. The extracted RNA was used to synthesize first-strand cDNAs using a FastQuant cDNA First-Strand Synthesis Kit (Tiangen Biotechnology, Beijing, China). We used the StepOne Plus Real-Time PCR System (ABI, Vernon, CA, USA) for qRT-PCR, according to the manufacturer’s instructions of 2 × Fast SYBR Green qPCR Master Mix (High ROX) (Servicebio, Wuhan, China). GAPDH was used as a reference gene. The primer sequences of selected genes are shown in Table S4. All qRT-PCR assays were performed for three biological replicates and three technical repeats.

3. Results

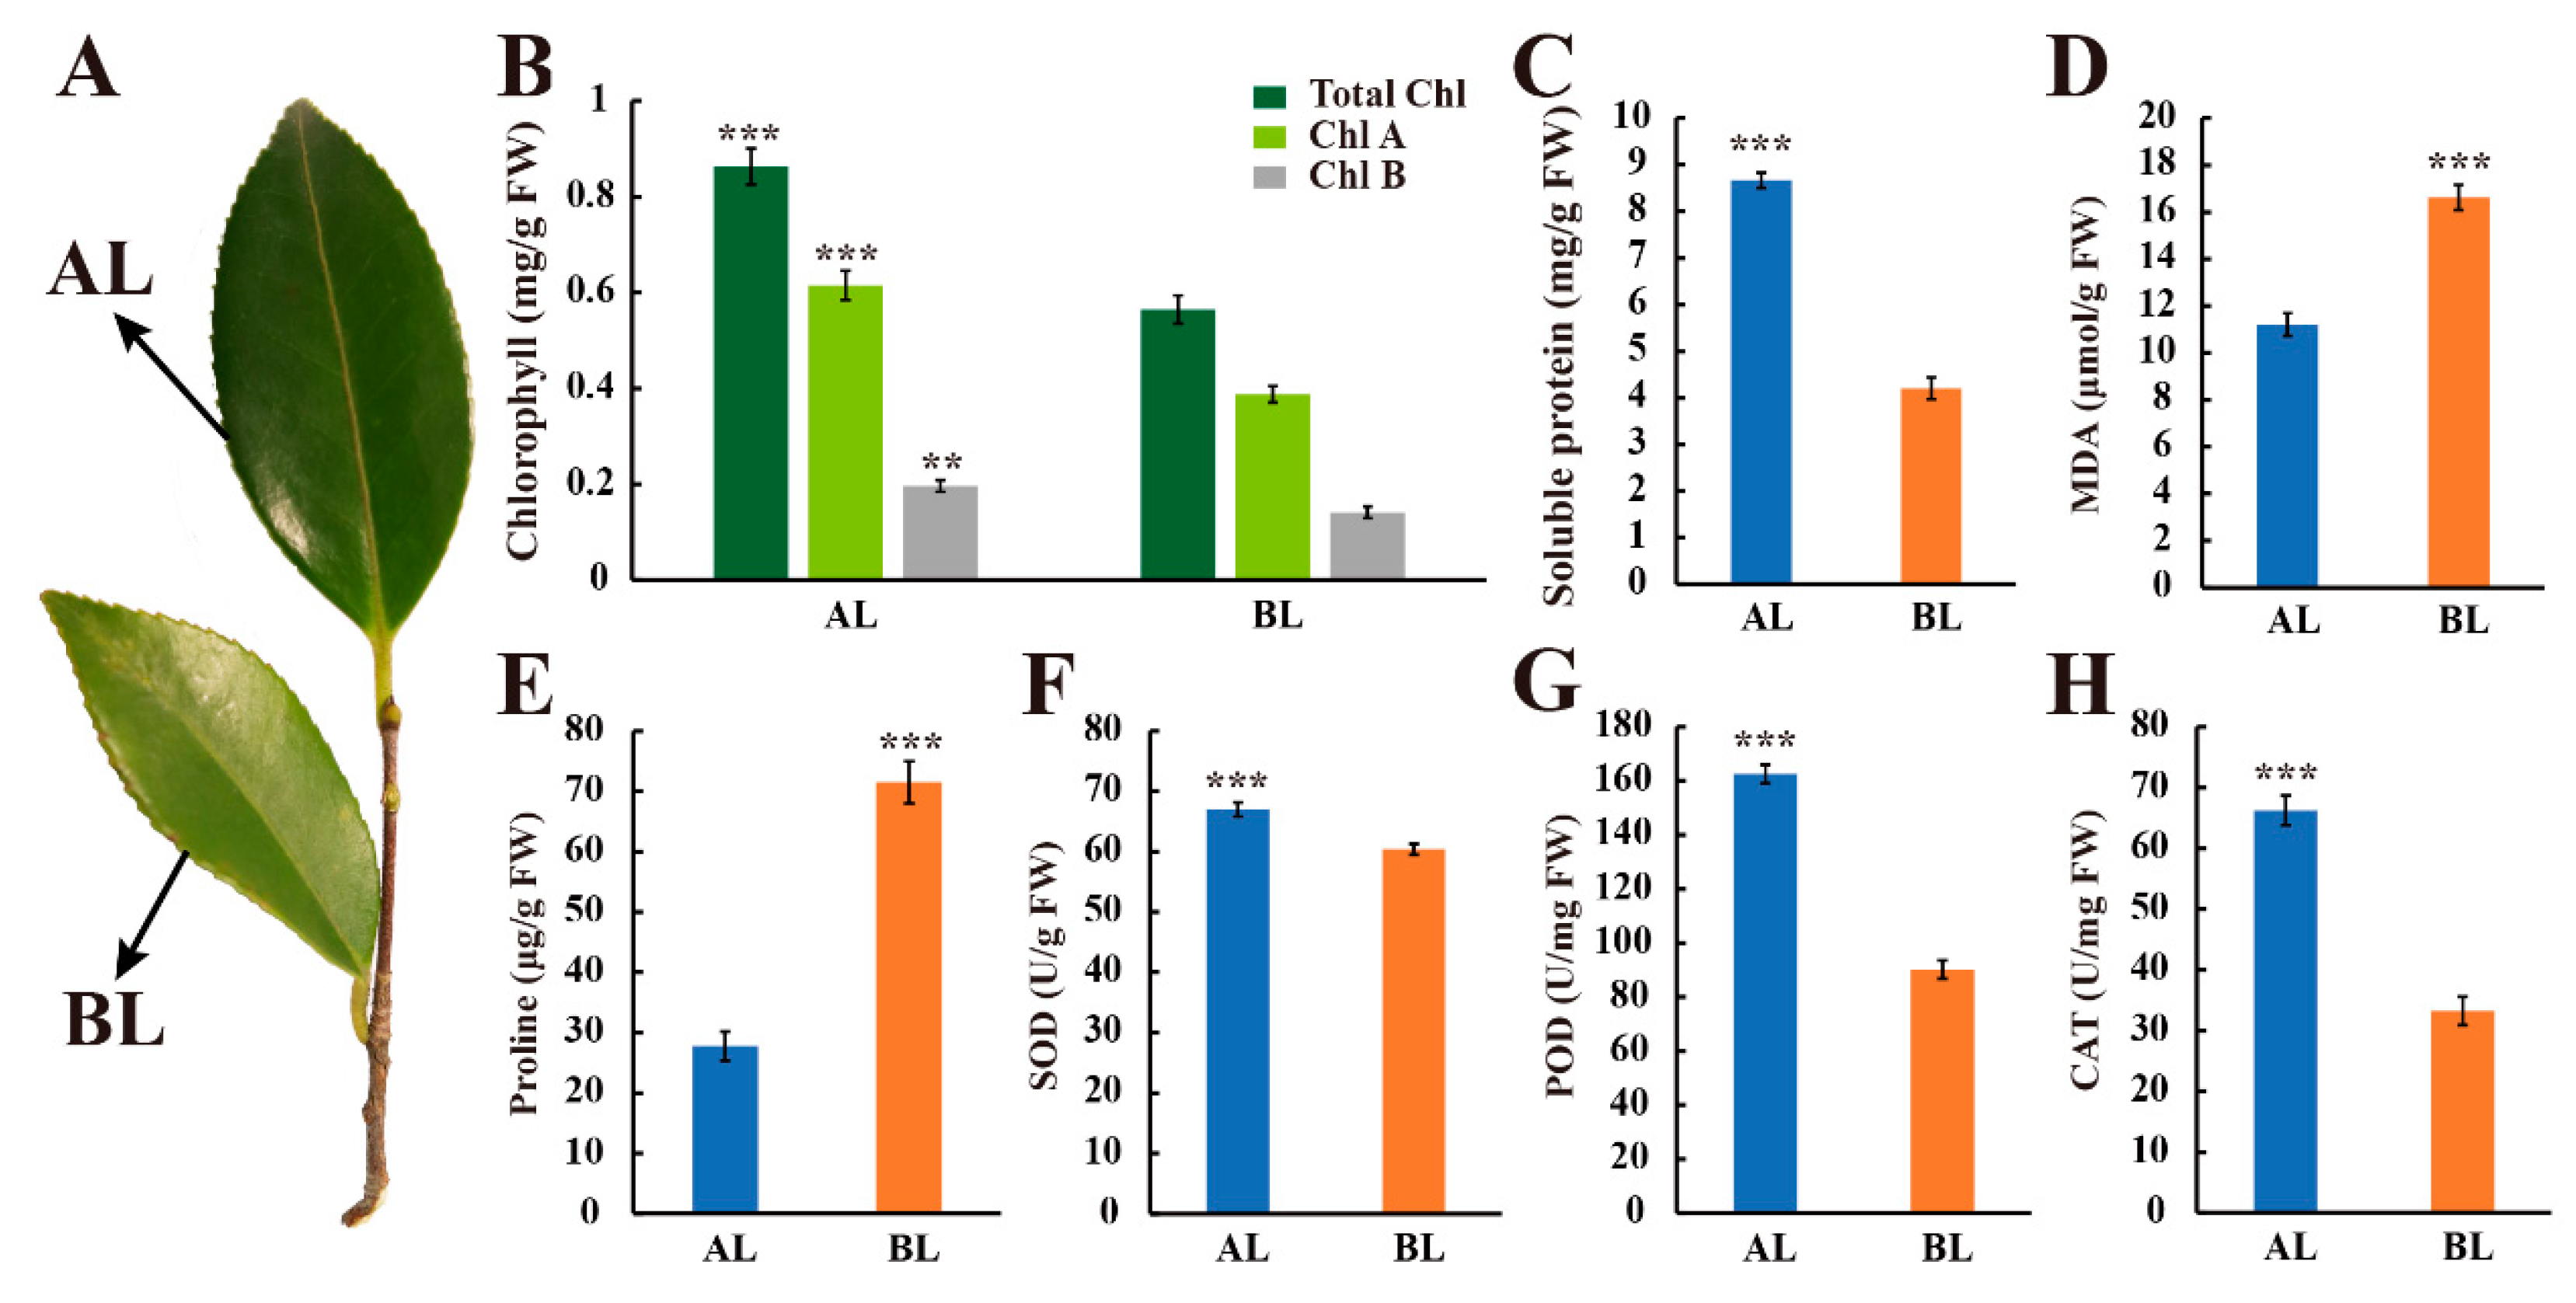
3.1. Morphological and Physiological Observation of Leaves at Different Leaf Age

We observed the phenotype and measured physiological changes of two different kinds of C. oleifera leaves in the rapid fruit growth period. Our results showed that biennial leaves were significantly yellower than annual leaves (Figure 1A). The visible morphological changes we observed are consistent with previous reports [49] where yellowing due to Chl degradation is one of the most obvious characteristics of leaf senescence. Accordingly, in contrast to annual leaves, the Chl content in biennial leaves was significantly reduced (by 34.6%), suggesting that the degradation rate of Chl in biennial C. oleifera leaves was higher than the synthesis rate (Figure 1B). Additionally, the soluble protein content of biennial leaves was only 48.5% of that in annual leaves (Figure 1C), suggesting that the hydrolysis of soluble protein dominates during the senescence process of C. oleifera. In addition, we also examined the accumulation of MDA and proline and found that the contents of MDA and proline in biennial leaves were 1.48-fold higher and 2.57-fold higher than that in annual leaves, respectively (Figure 1D,E). Moreover, compared with annual leaves, the activity of SOD, POD, and CAT in senescent leaves decreased by 9.8%, 44.5%, and 49.8% (Figure 1F–H), respectively, indicating that the activities of antioxidant enzymes were reduced in C. oleifera biennial leaves, thus repressing the scavenging ability of ROS (reactive oxygen species).

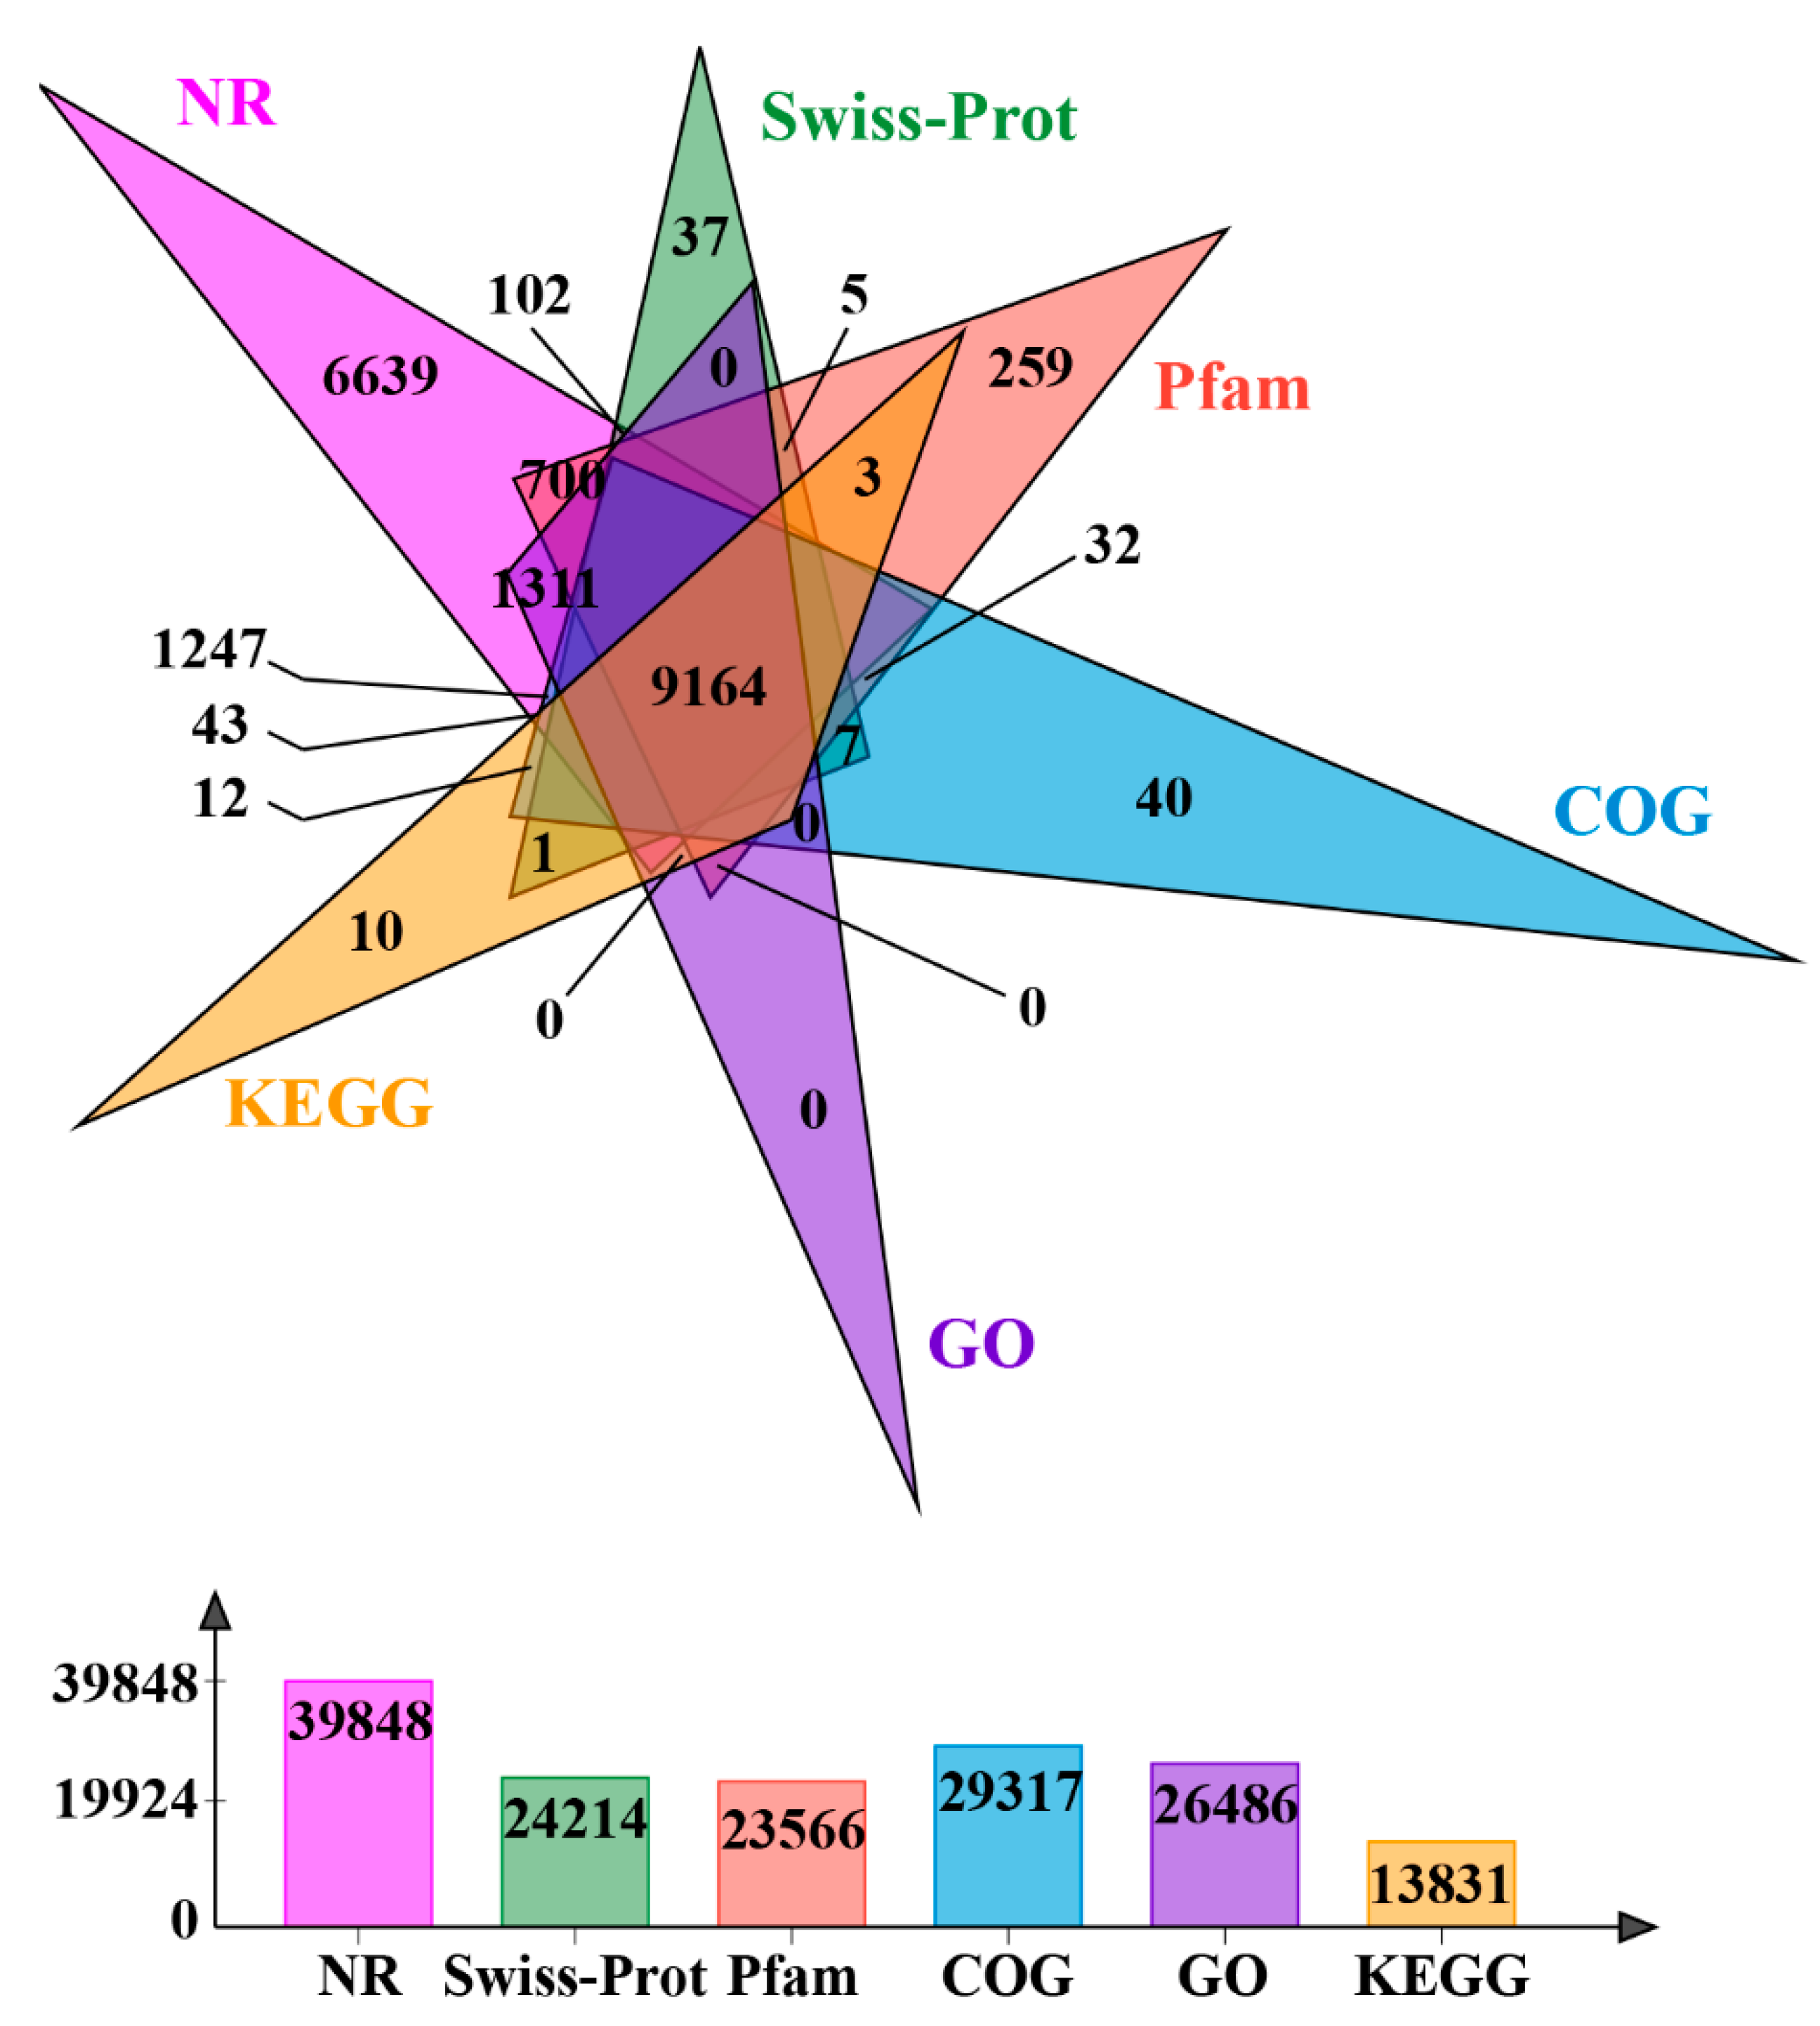
3.2. RNA Sequencing, De Novo Assembly, and Annotation

In order to explore the molecular mechanisms underlying the leaf senescence of C. oleifera at the transcriptomic level, six RNA libraries from C. oleifera leaves (AL1, AL2, AL3; BL1, BL2, and BL3) were sequenced and 37.16 Gb high-quality clean data were obtained. The clean data of each sample reached more than 6.08 Gb, and the clean reads of each sample ranged from 40,602,122 to 41,859,058 with the Q30 percentage over 90.32% (Table S1). After de novo assembly of the C. oleifera transcriptome, a total of 78,860 unigenes were generated with an N50 length of 1374 bp and an average length of 865.96 bp. The GC content was approximately 39.19% (Table 1).
The assembled unigenes were searched against the NR (NCBI non-redundant protein sequences), Swiss-Prot (Annotated protein sequence database), Pfam (Protein family), COG (Clusters of Genes), GO (Gene Ontology), and KEGG (Kyoto Encyclopedia of Genes and Genomes) databases, with 51.3% (40,425 of 78,860) of unigenes annotated. Among them, 26,486, 13,831, 29,317, 39,848, 24,214, and 23,566 annotated unigenes were obtained from the GO, KEGG, COG, NR, Swiss-Prot, and Pfam databases, respectively (Figure 2). The results indicated that the NR database had the highest proportion of annotation and 39,848 unigenes were annotated. Due to the lack of a reference genome for C. oleifera, the NR database can provide us with information about the most similar matches to gene sequences from other species, and according to the NR database, the species with the greatest number of C. oleifera unigenes are Camellia sinensis (87.70%), followed by Actinidia chinensis (2.02%) and Vitis vinifera (1.22%) (Figure S1). These results provide a basis for the future research of the potential function of these annotated unigenes.

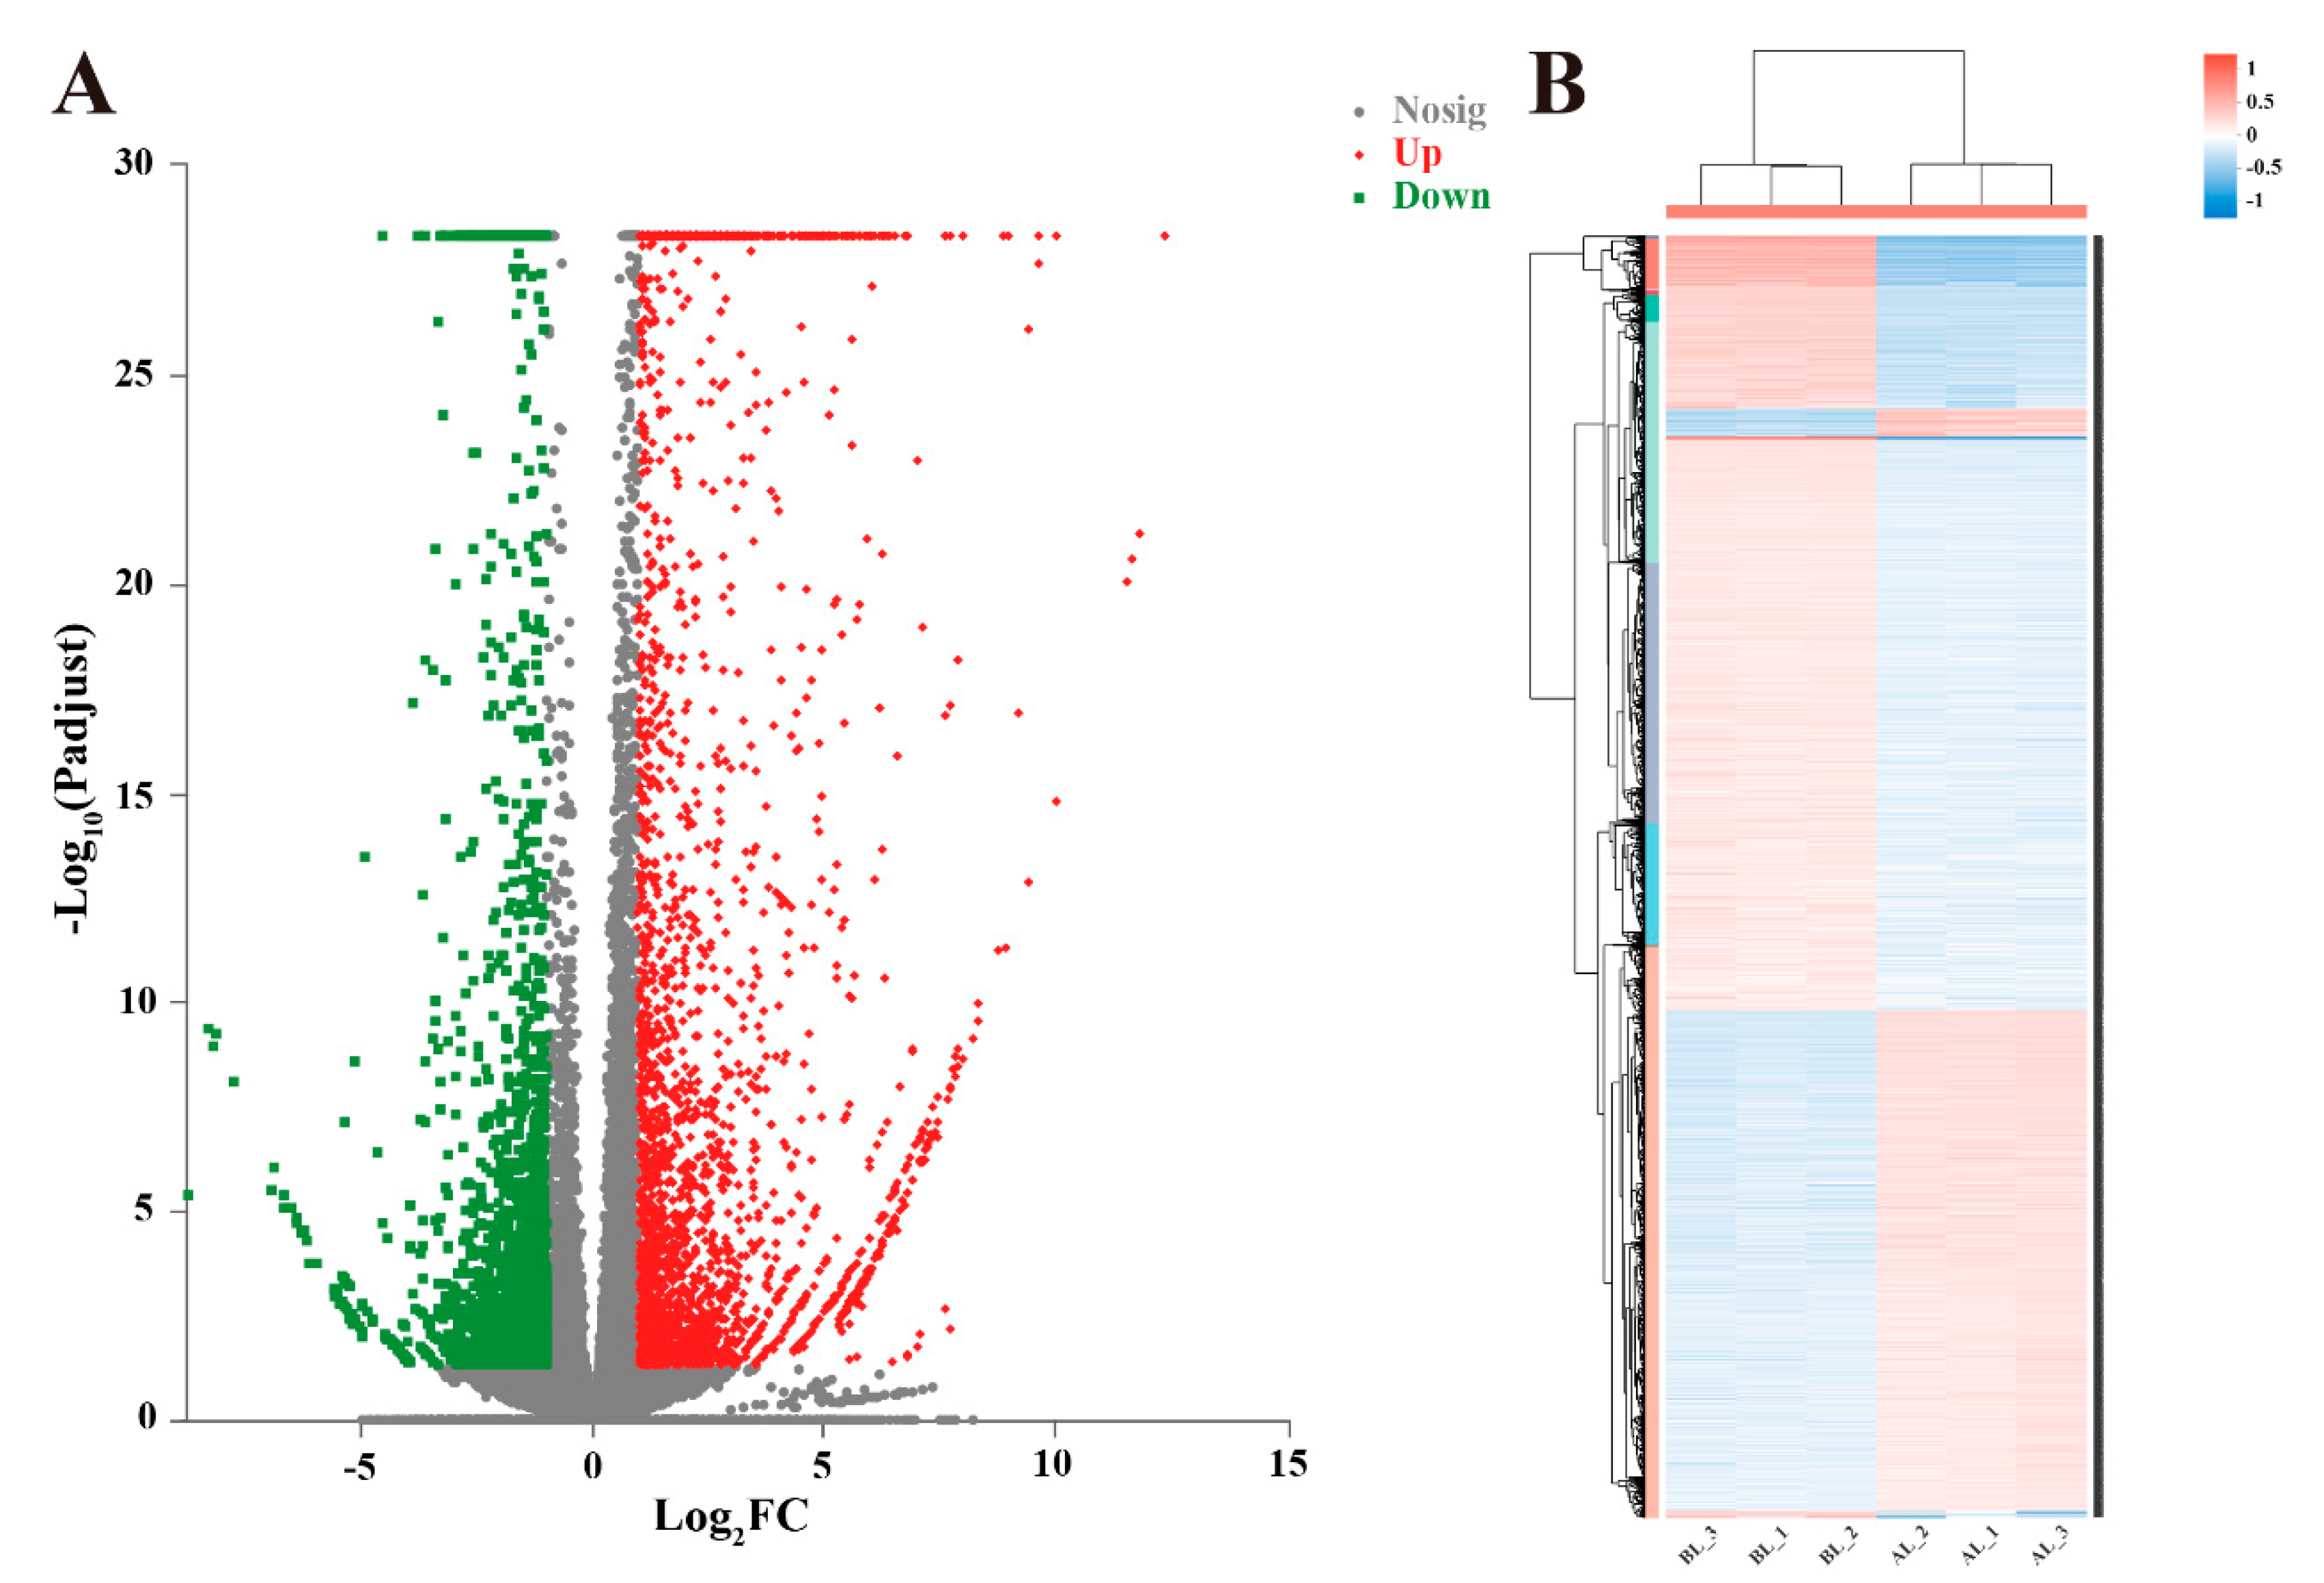
3.3. Analyses of Gene Expression and Identification of Differentially Expressed Genes (DEGs)

The TPM values were used to calculate the expression level of unigenes in each tissue, and unigenes with TPM ≥1 were defined as expressed [50]. The number of unigense expressed in annual leaves was 59,212, and that in biennial leaves was 47,700. In addition, 40,421 unigenes were co-expressed in both leaves (Figure S2). Moreover, correlation analyses were performed to verify the consistency among the samples, and our results demonstrated that the correlation among three biological replicates was very high (Figure S3). The DEGs were defined with the adjusted p-value < 0.05 and fold-change ≥ 2, and our results showed that there were 4645 DEGs between C. oleifera leaves of two types of ages. Taking the annual leaves as a control group, the number of upregulated genes and downregulated genes in biennial leaves were 2729 and 1916, respectively (Figure 3A). To facilitate the visualization, a heatmap was produced on the basis of the clustering analysis of expression patterns for all DEGs (Figure 3B). These findings demonstrate that a large number of genes are responsive to the senescence process.

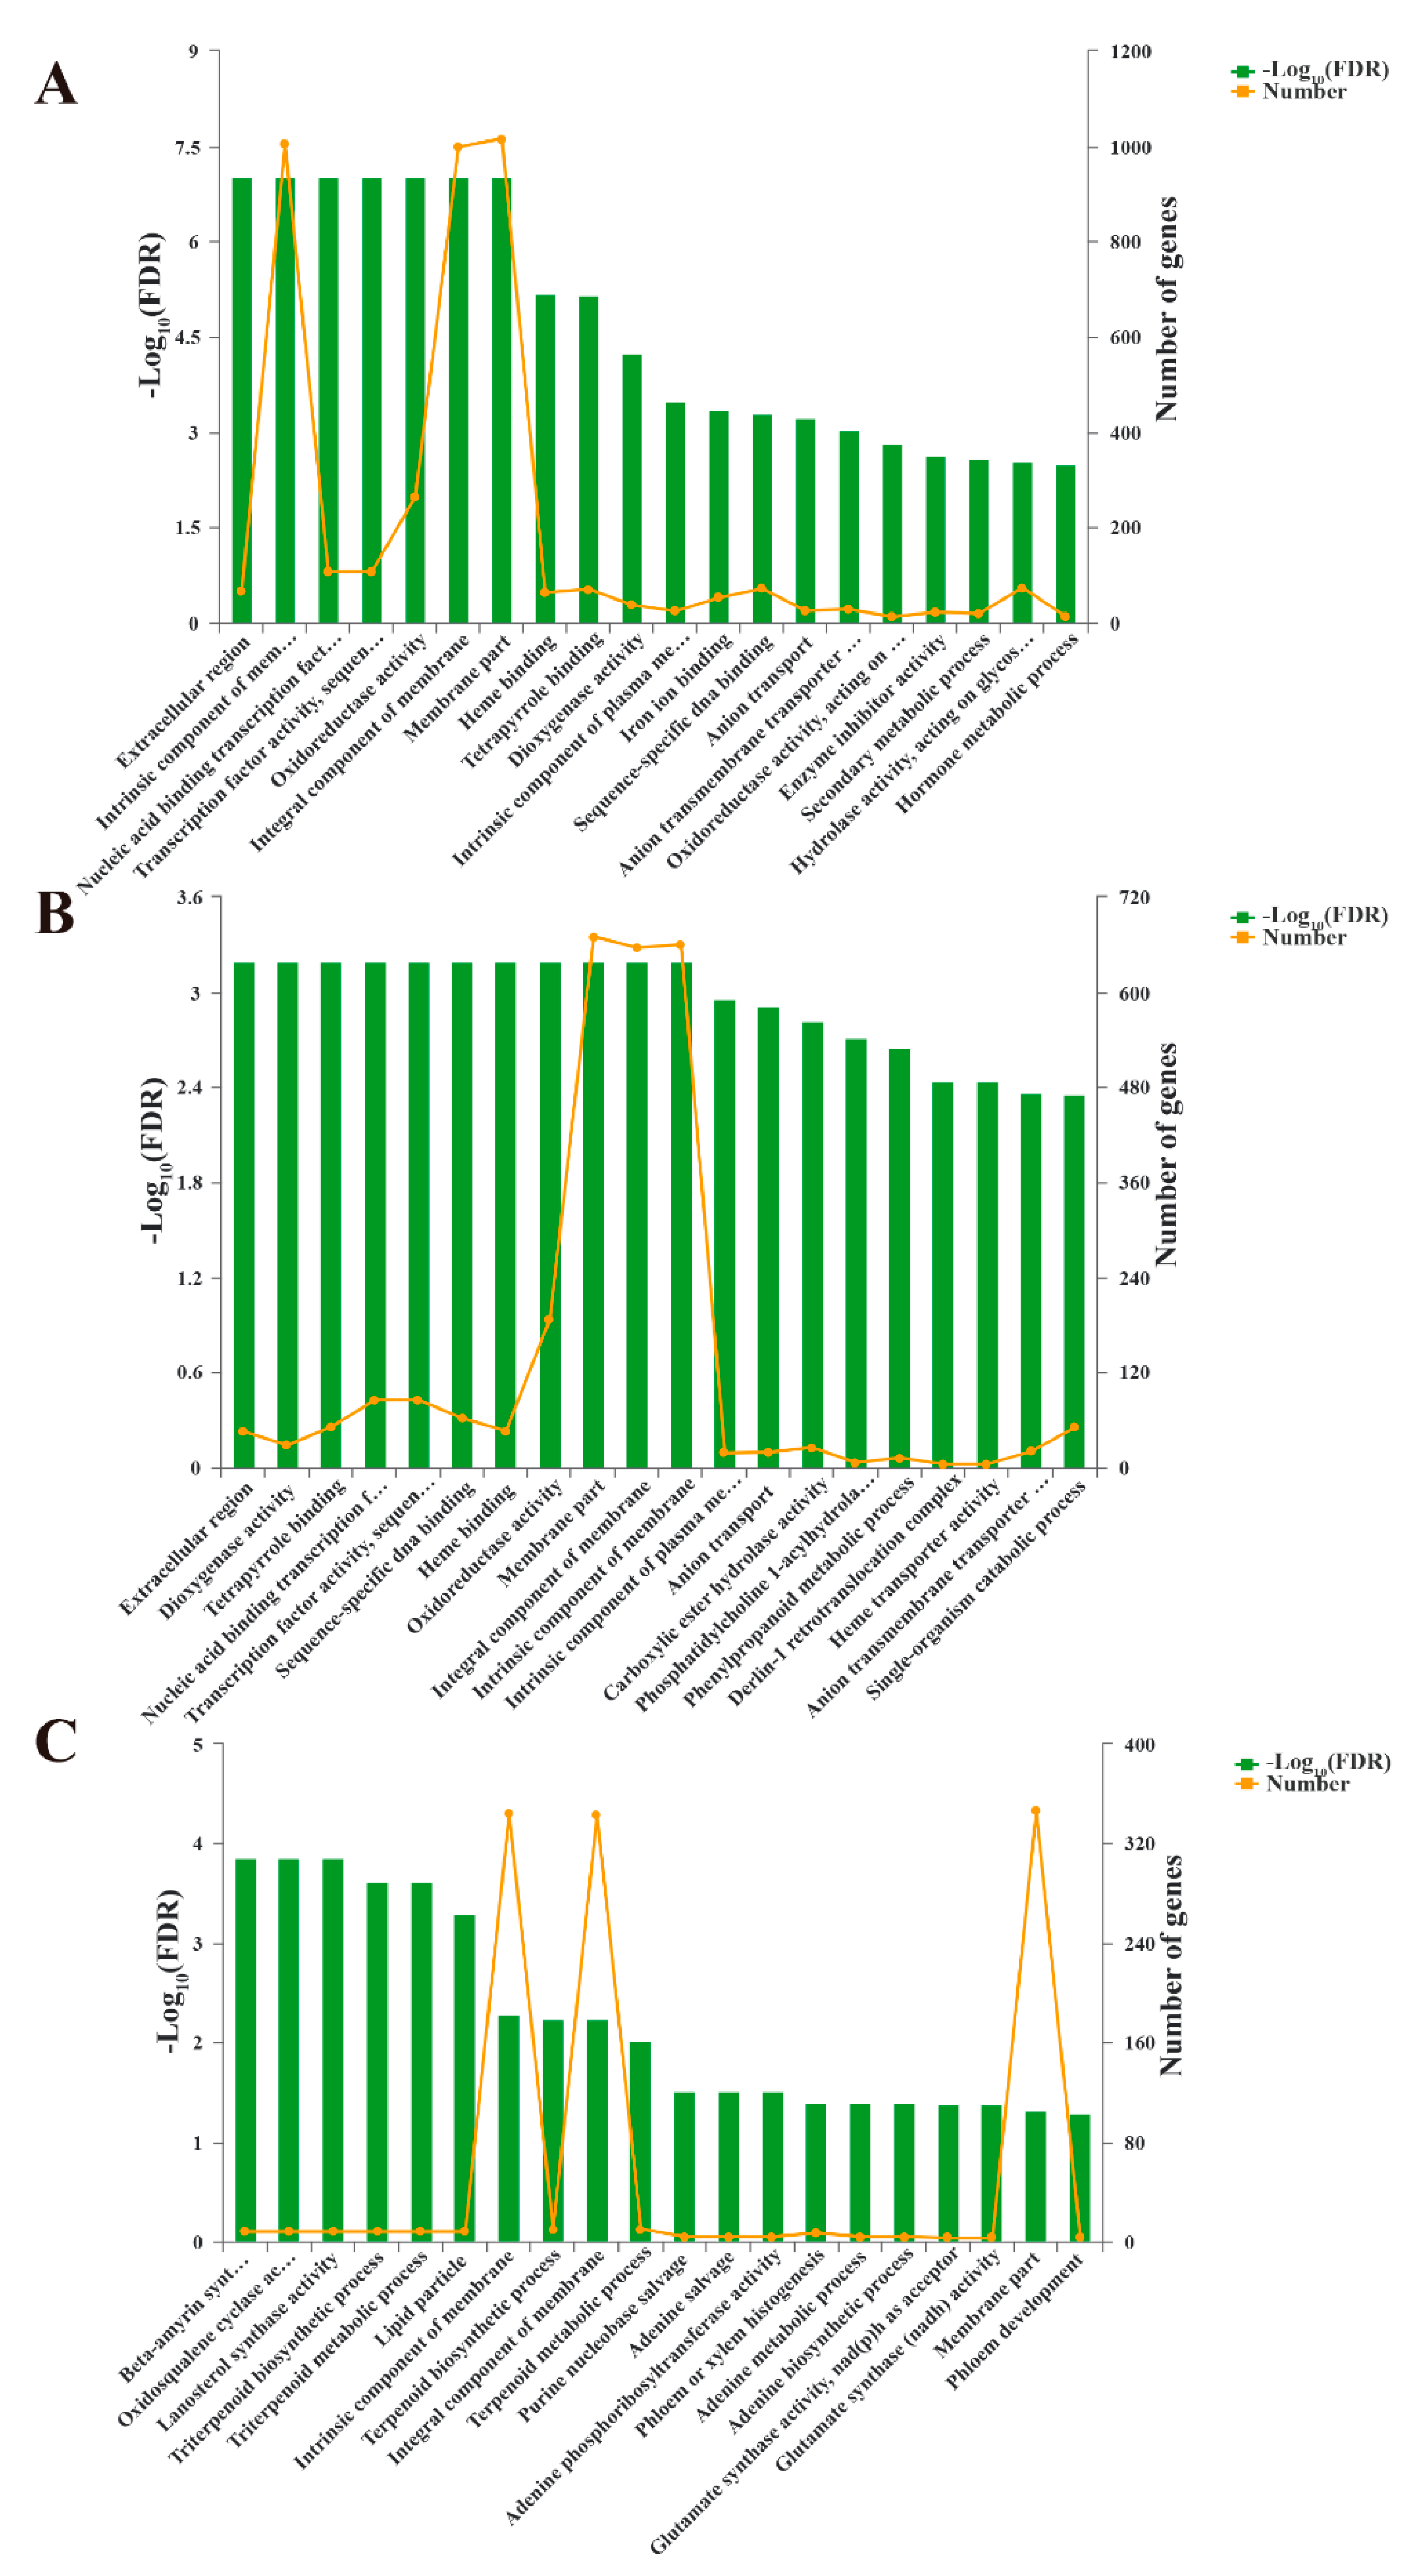
3.4. Gene Ontology (GO) Enrichment Analysis of DEGs

To further elucidate the function of DEGs, a GO enrichment analysis was performed. In terms of all DEGs, there were 298 enriched GO terms (p-value ≤ 0.05). The most significantly enriched GO category was the extracellular region (GO ID: 0005576), followed by the intrinsic component of the membrane (GO ID: 0031224), nucleic acid binding transcription (GO ID: 0001071), transcription factor activity, sequence-specific DNA binding (GO ID: 0003700), and oxidoreductase activity (GO ID: 0016491) (Figure 4A). In terms of upregulated DEGs, there were 292 significantly enriched GO terms including the extracellular region (GO ID: 0005576), dioxygenase activity (GO ID: 0051213), membrane part (GO ID: 0044425), etc (Figure 4B). As for downregulated DEGs, there were 219 terms such as beta-amyrin synthase activity (GO ID: 0042300), oxidosqualene cyclase activity (GO ID: 0031559), and lanosterol synthase activity (GO ID: 0000250) (Figure 4C).

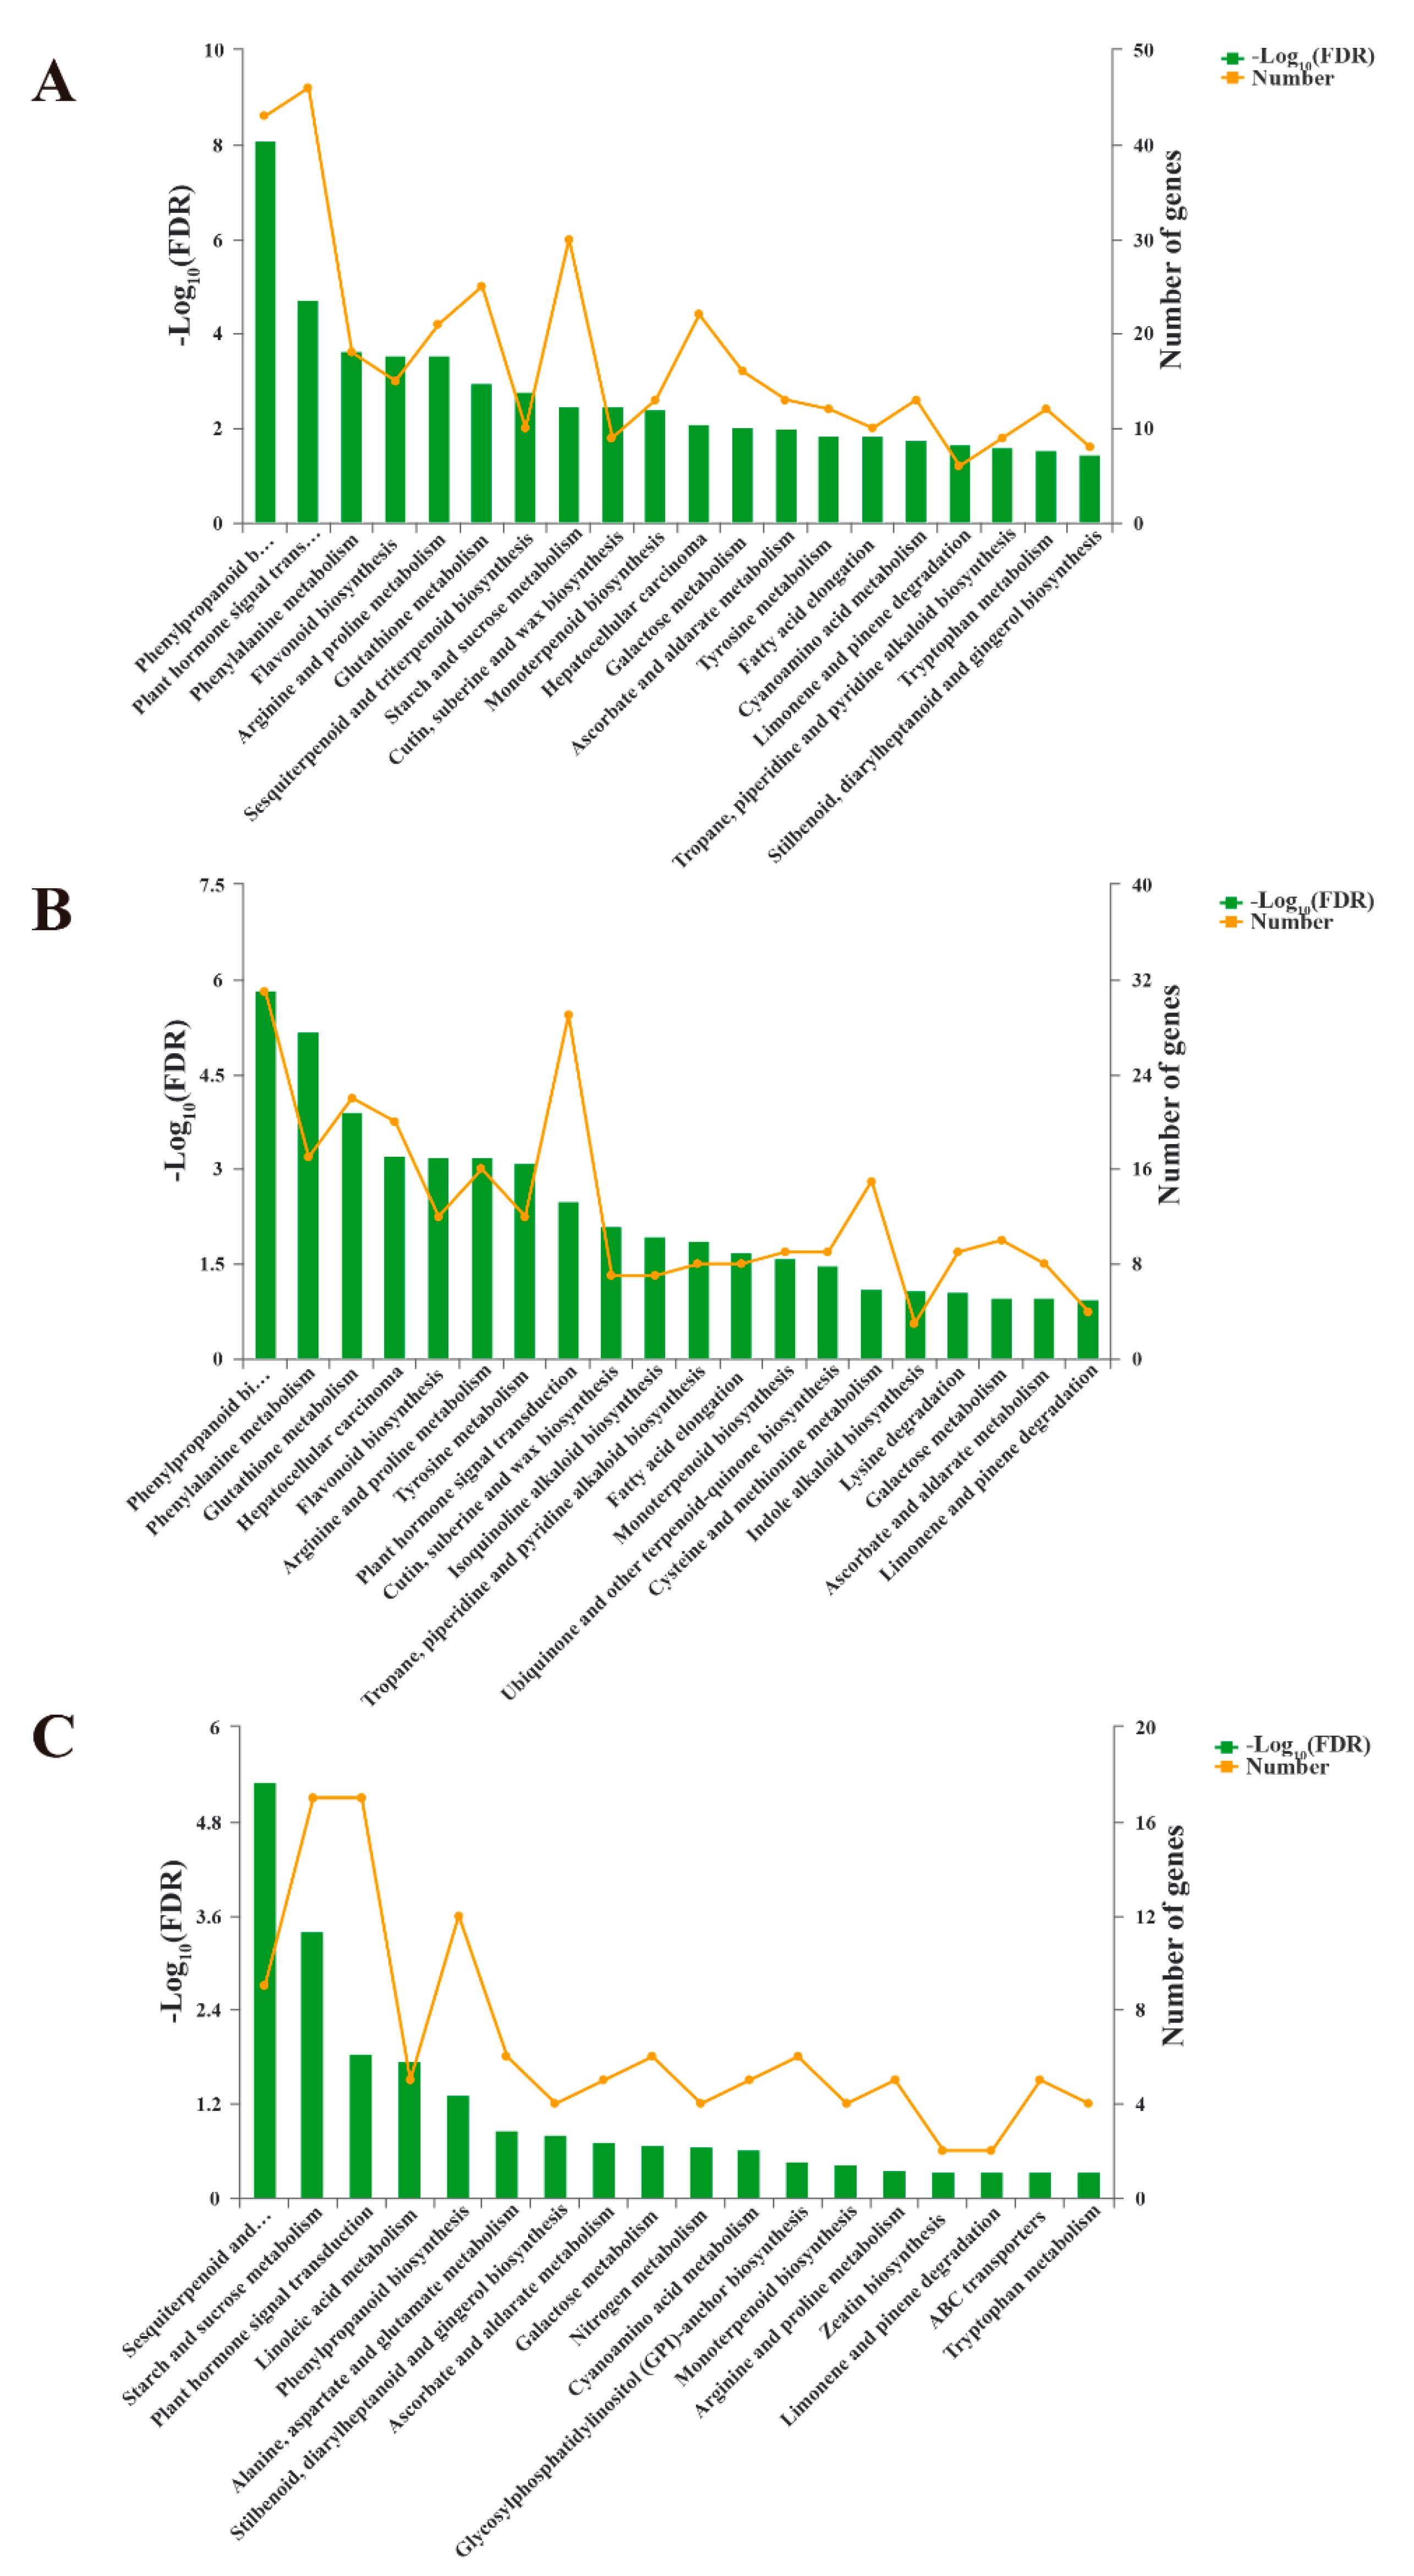
3.5. Kyoto Encyclopedia of Genes and Genomes (KEGG) Pathway Analysis of DEGs

To further discover the leaf senescence pathway of C. oleifera leaves, KEGG analysis of DEGs was performed. A total of 126 KEGG pathways were significantly enriched, among which the phenylpropanoid biosynthesis (Pathway id: map00940), plant hormone signal transduction (Pathway id: map04075), and phenylalanine metabolism (Pathway id: map00360) pathways were the most obviously enriched pathways (Figure 5A). The upregulated DEGs were assigned to the KEGG pathways involved in 125 pathways, among them, phenylpropanoid biosynthesis (Pathway id: map00940), phenylalanine metabolism (Pathway id: map00360), and arginine and proline metabolism (Pathway id: map00330) were the most highly represented (Figure 5B). The downregulated DEGs were assigned to 90 KEGG pathways, among which the sesquiterpenoid and triterpenoid biosynthesis (Pathway id: map00909), plant hormone signal transduction (Pathway id: map04075), and ascorbate and aldarate metabolism (Pathway id: map00053) pathways were the most significantly enriched pathways (Figure 5C).

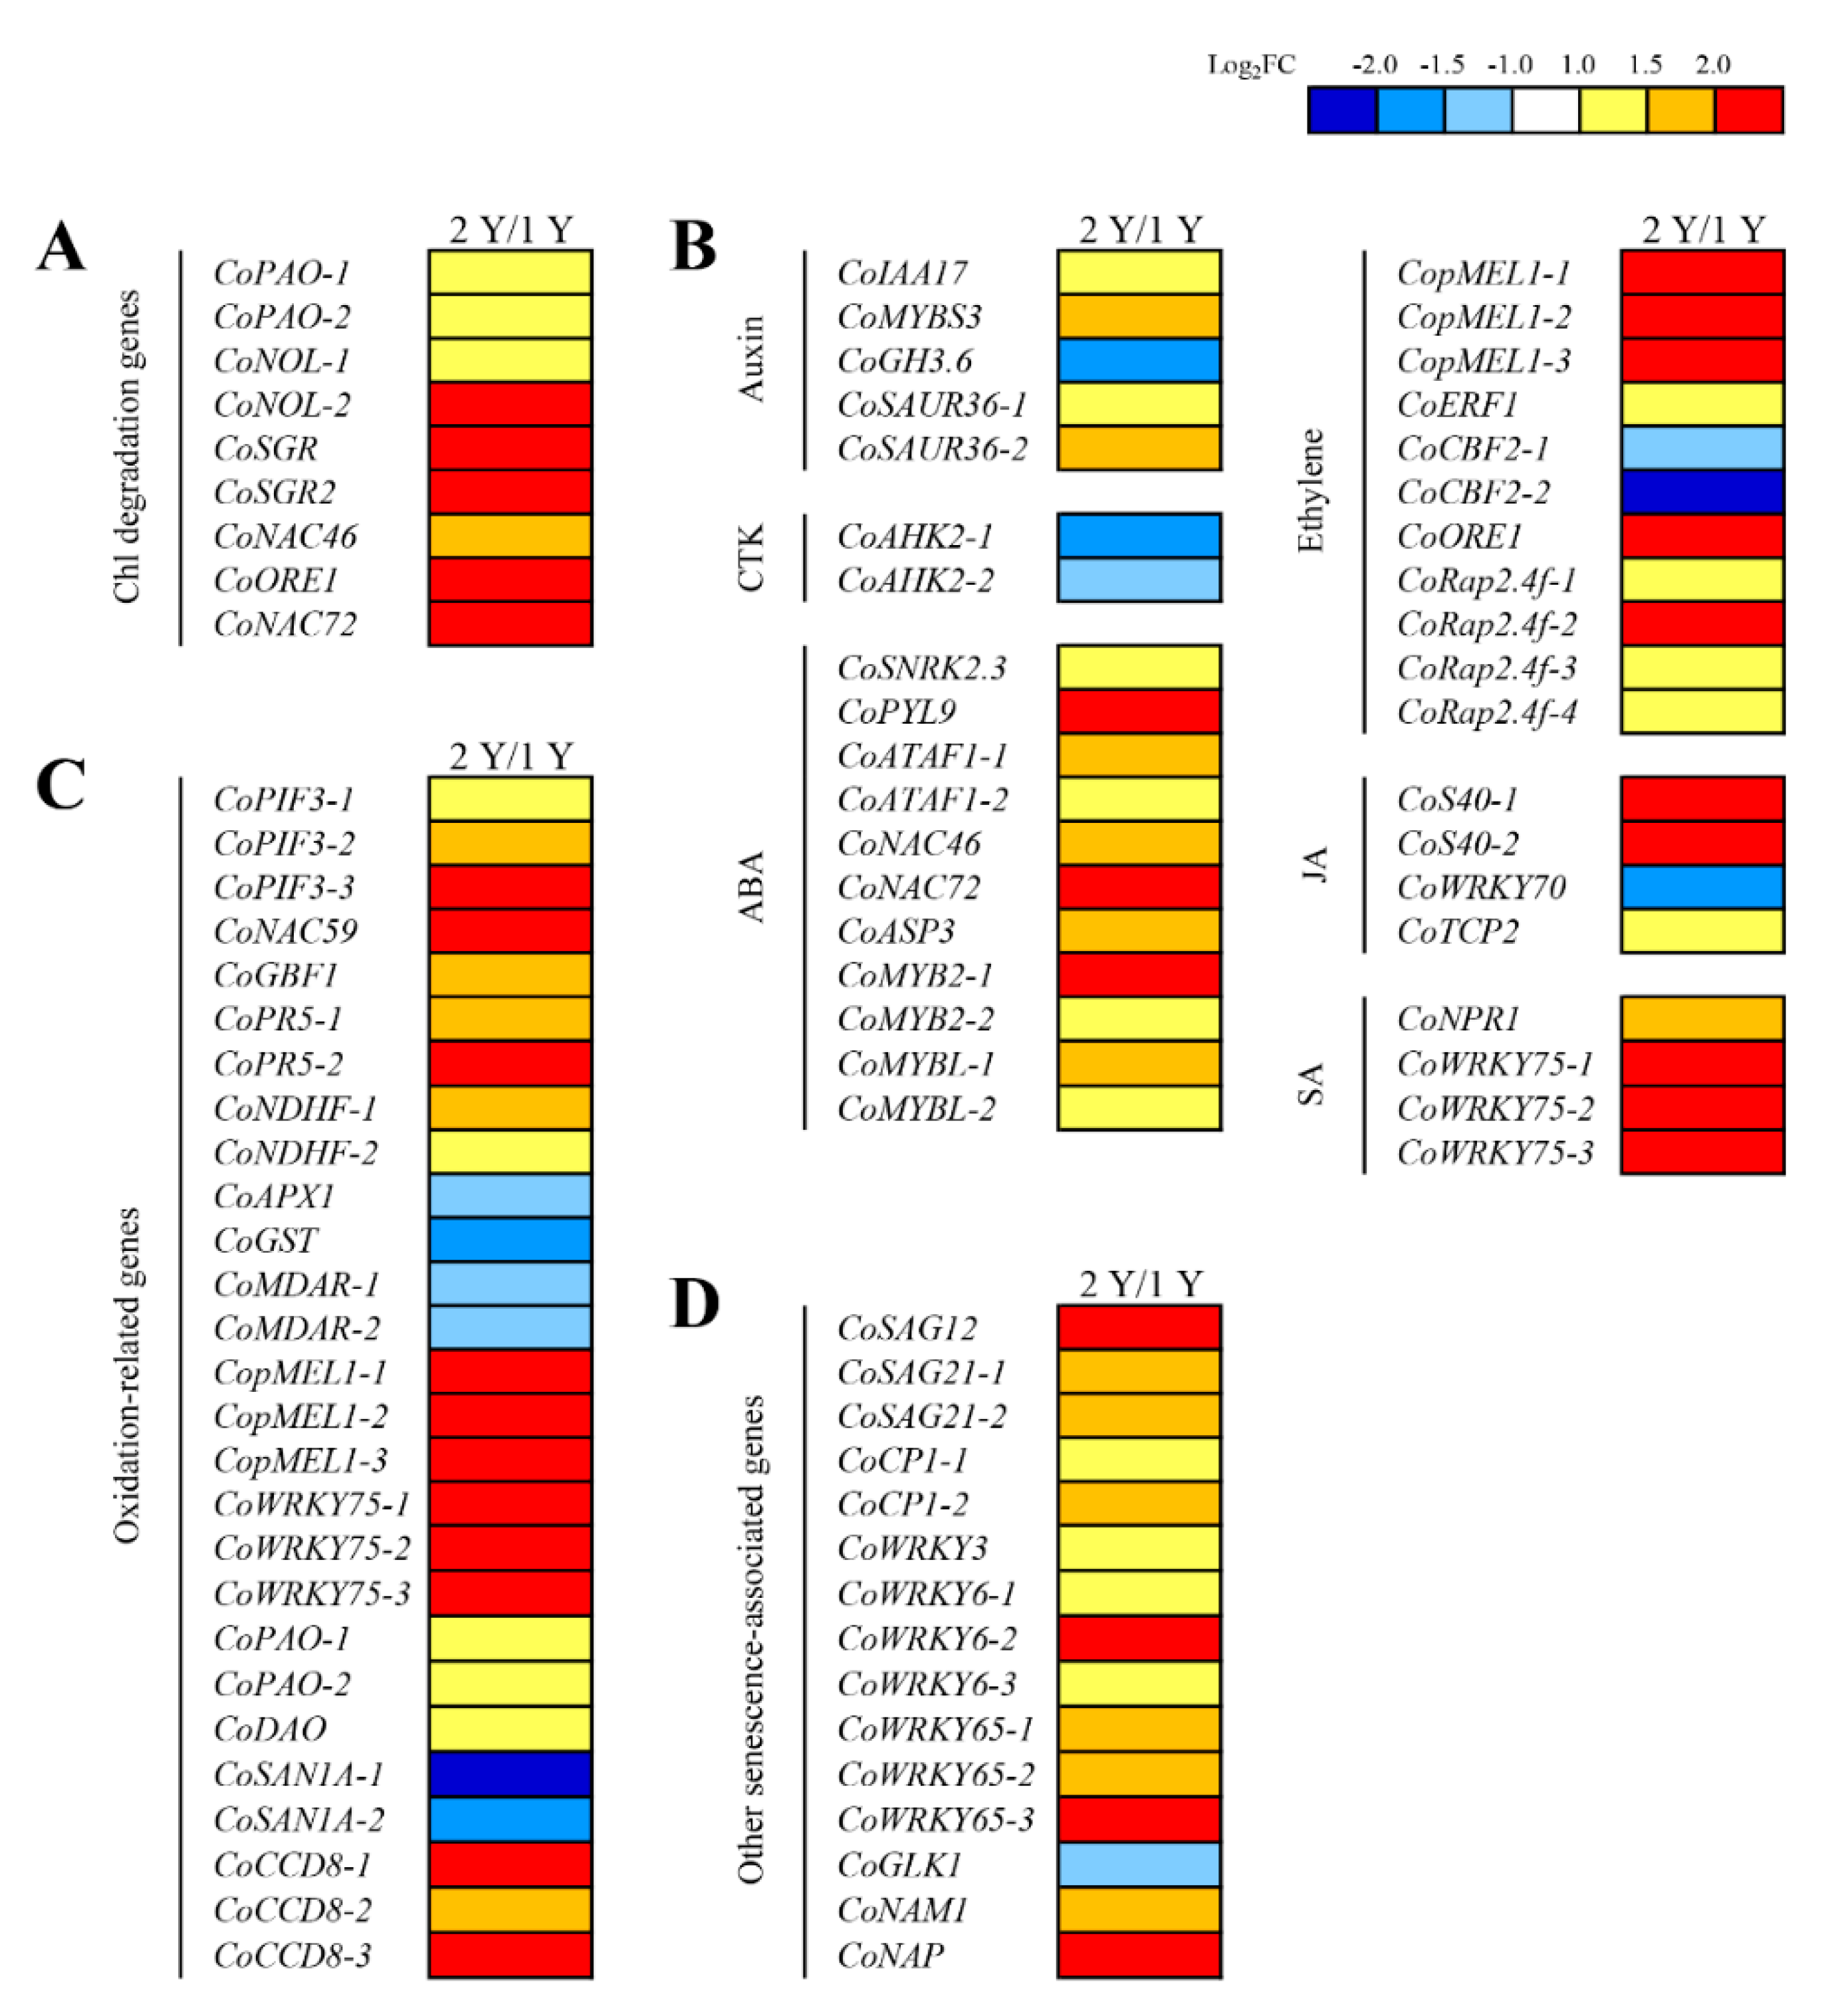
3.6. SAGs Differentially Expressed in Two Kinds of Leaves

To identify the important gene expressions of C. oleifera leaves during leaf senescence, we analyzed DEGs associated with Chl degradation, plant hormones, oxidation pathways, and found 77 unigenes homologous to the key SAGs that have been reported in other species (Table S2). Many genes involved in the Chl degradation pathway were upregulated in biennial leaves including PAO, NOL, SGR, etc. (Figure 6A, Figure S4A). In addition, genes related to ABA, ethylene, JA, and SA were mostly upregulated in biennial leaves such as MYBL, ATAF1, and PYL9 (Figure S4B). Genes associated with auxin and cytokinin were also differentially expressed during leaf senescence. For example, the gene homologous to cytokinin receptor gene AHK2 in arabidopsis was downregulated, and the gene homologous to auxin-related gene SAUR36 was upregulated. During foliar senescence, evident changes for oxidation-related genes have been observed, for instance, WRKY75, encoding a transcription factor inhibiting the elimination of ROS, was upregulated, whereas MDAR, encoding a monodehydroascorbate reductase, was downregulated (Figure 6C, Figure S4C). Furthermore, we found some other SAGs were also responsive to the senescence of C. oleifera leaves such as SAG12, which was evidently upregulated in biennial leaves (Figure 6D). These findings suggest that there are multiple signaling pathways involved in the regulation of C. oleifera leaf senescence.

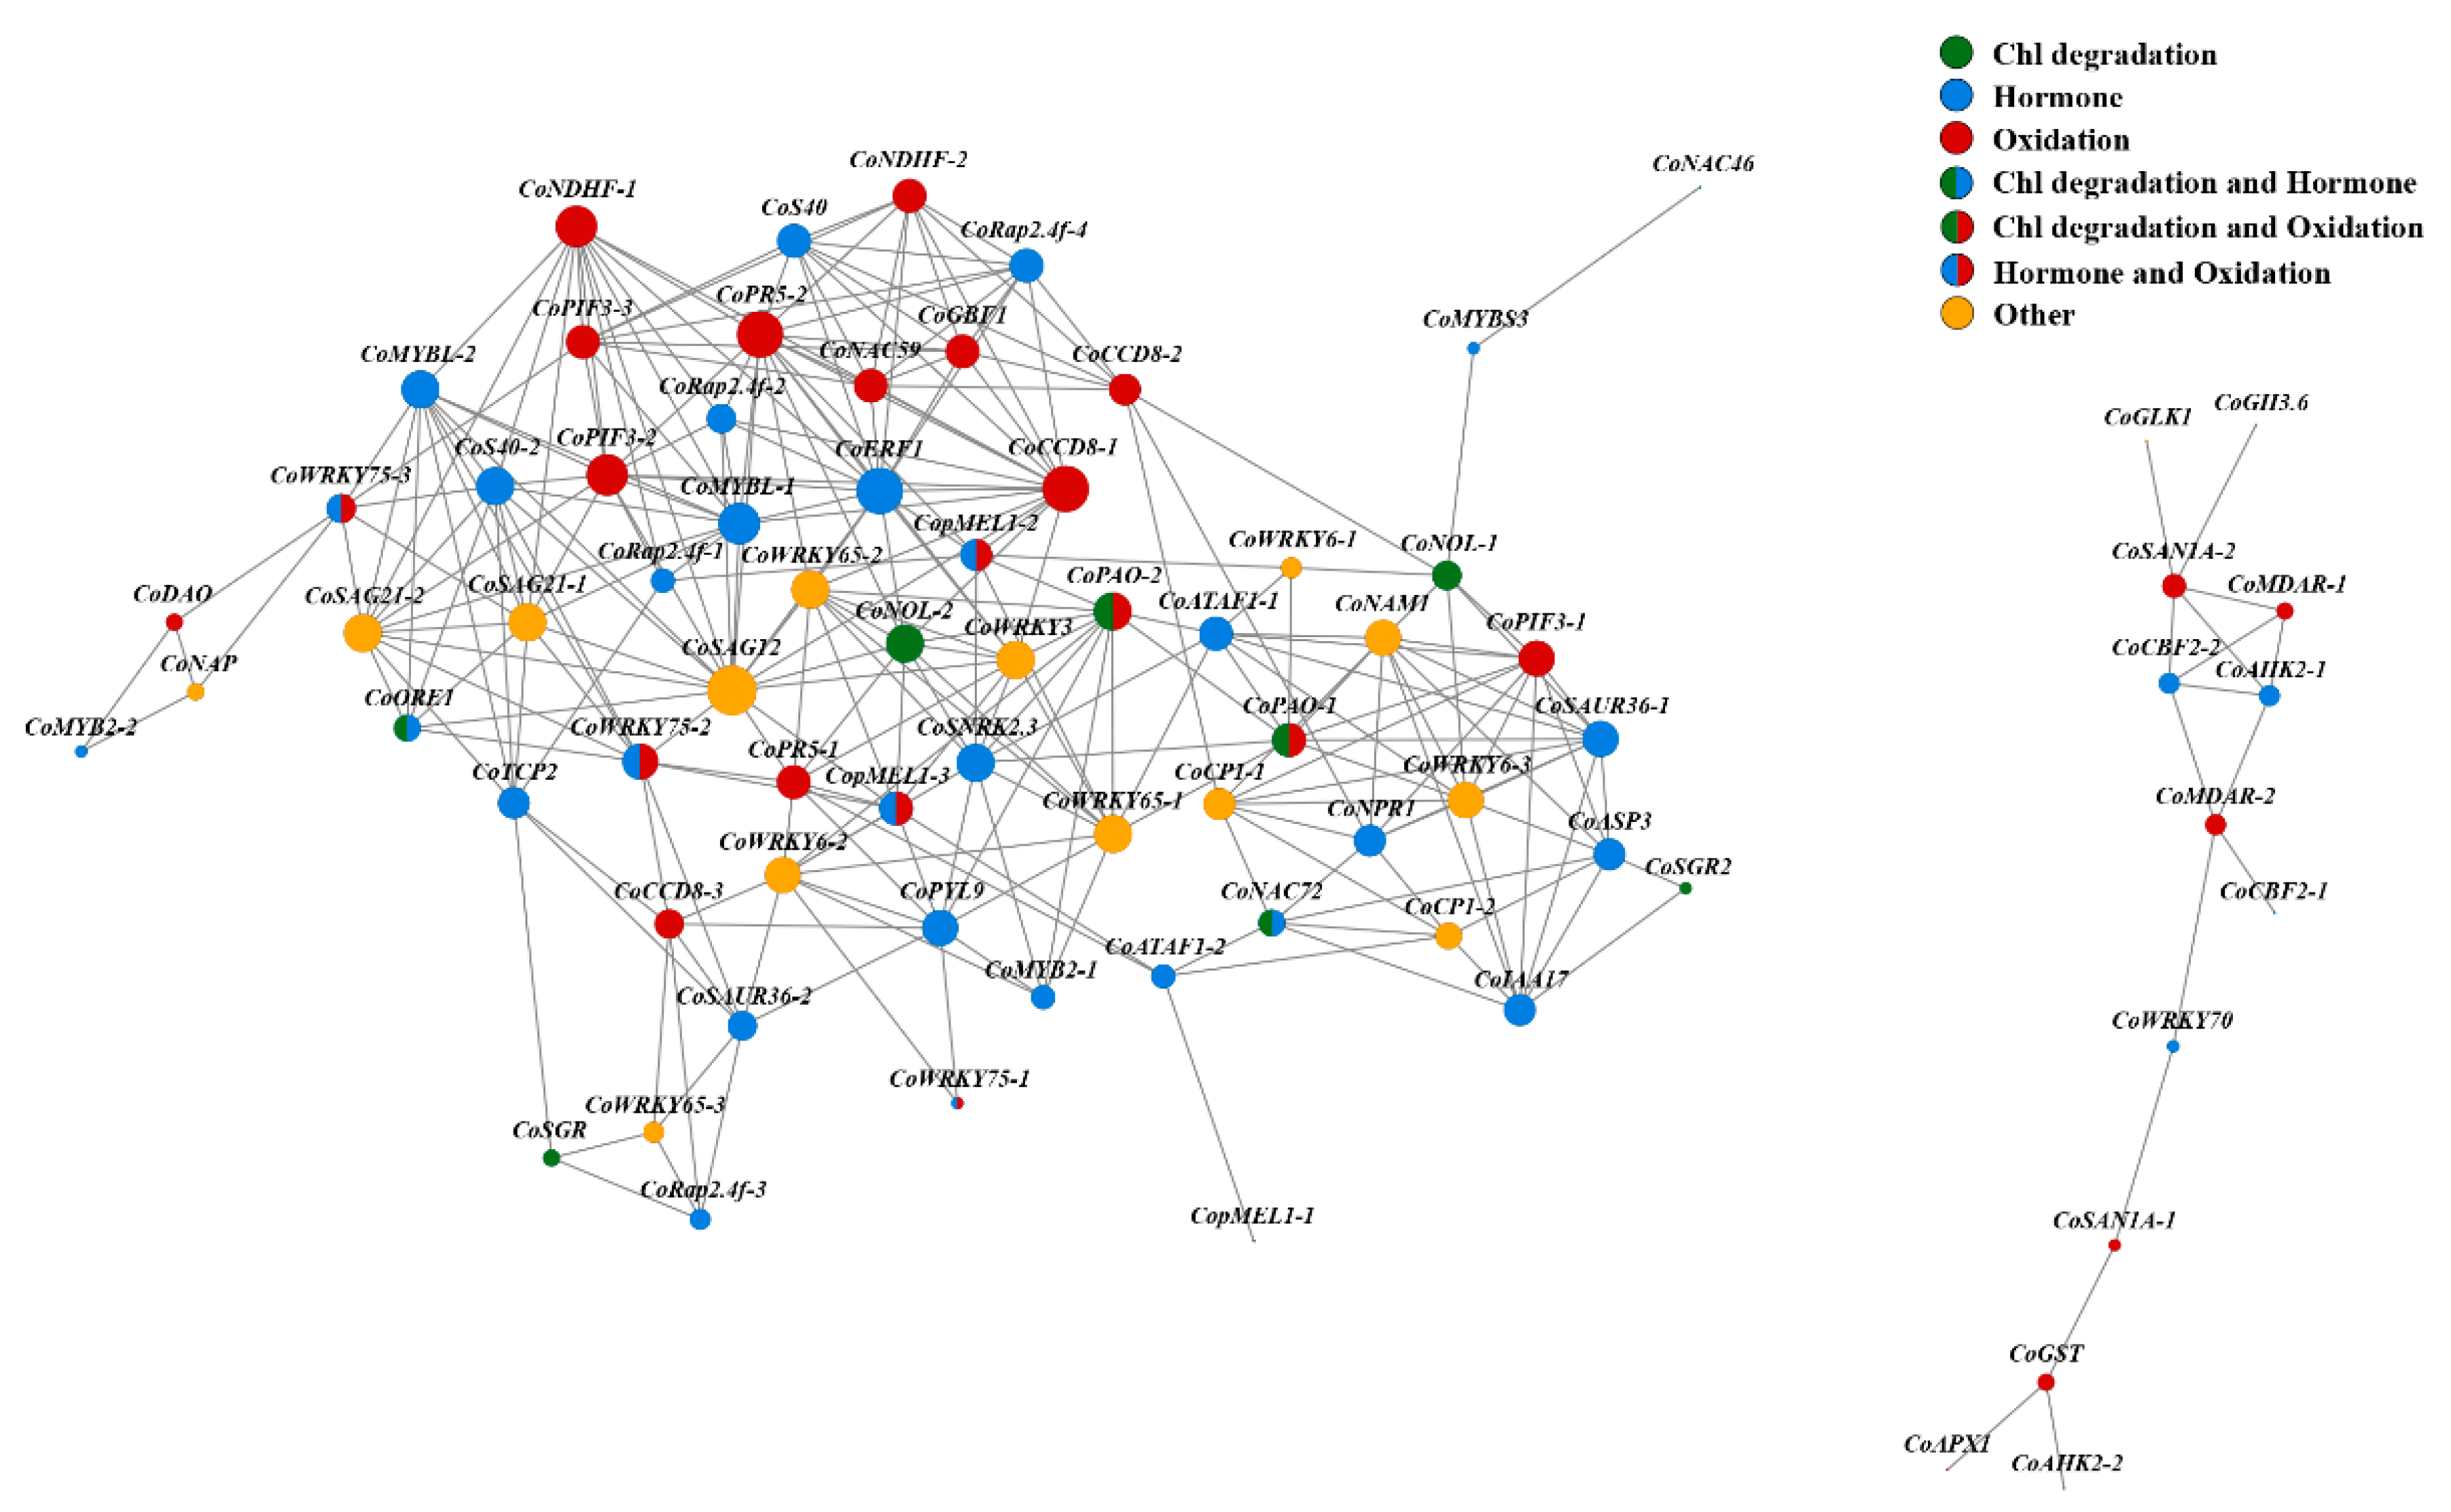
3.7. Correlation Analysis of SAGs

Previous studies have shown that leaf senescence is a complicated physiological process regulated by multiple signal pathways. To better reveal the potential co-expression relationship between genes, we constructed an expression correlation network of the 77 SAGs on the basis of the Spearman correlation algorithm. The results indicated that there was a possible correlation among genes involved in different pathways such as Chl degradation, phytohormones, and oxidation pathways. Among these SAGs, CoWRKY75-2, CoPAO-2, CoSAG12, CoWRKY65-2, CoMYBL-1, CoSAUR36-1, CoNOL-1, CoNAC59, CoGBF1, and CoS40-2 were significantly correlated with the expression of other SAGs (Figure 7). For instance, there is a significant expression correlation between CoSAG12 and many other SAGs such as CoNOL-2, CoORE1, CoMYBL-1, CoS40-2, and CoWRKY75-2, and these genes probably play important roles in Chl degradation, hormones, and oxidation pathways.

3.8. Transcription Factors (TFs) Responding to Leaf Senescence

Transcription factors (TFs) exert vital function in the process of leaf senescence. Therefore, we analyzed the expression levels of TFs in C. oleifera leaves of two types of ages. Among all the DEGs, we identified 162 TFs (123 upregulated TFs and 39 downregulated TFs) (Table S3). Among these different TF families, the genes encoding MYB proteins (16.67%) accounted for the largest proportion of these genes, followed by the genes encoding AP2/ERF proteins (16.05%), WRKY (12.35%), and NAC proteins (9.3%) (Figure 8). Notably, many TFs we have identified are homologous to SAGs in other species genome such as MYBL, ERF1, WRKY75, ATAF1, etc. Among these potential SAGs in C. oleifera, the genes that exhibited the most significant changes were selected for further qRT-PCR analysis.

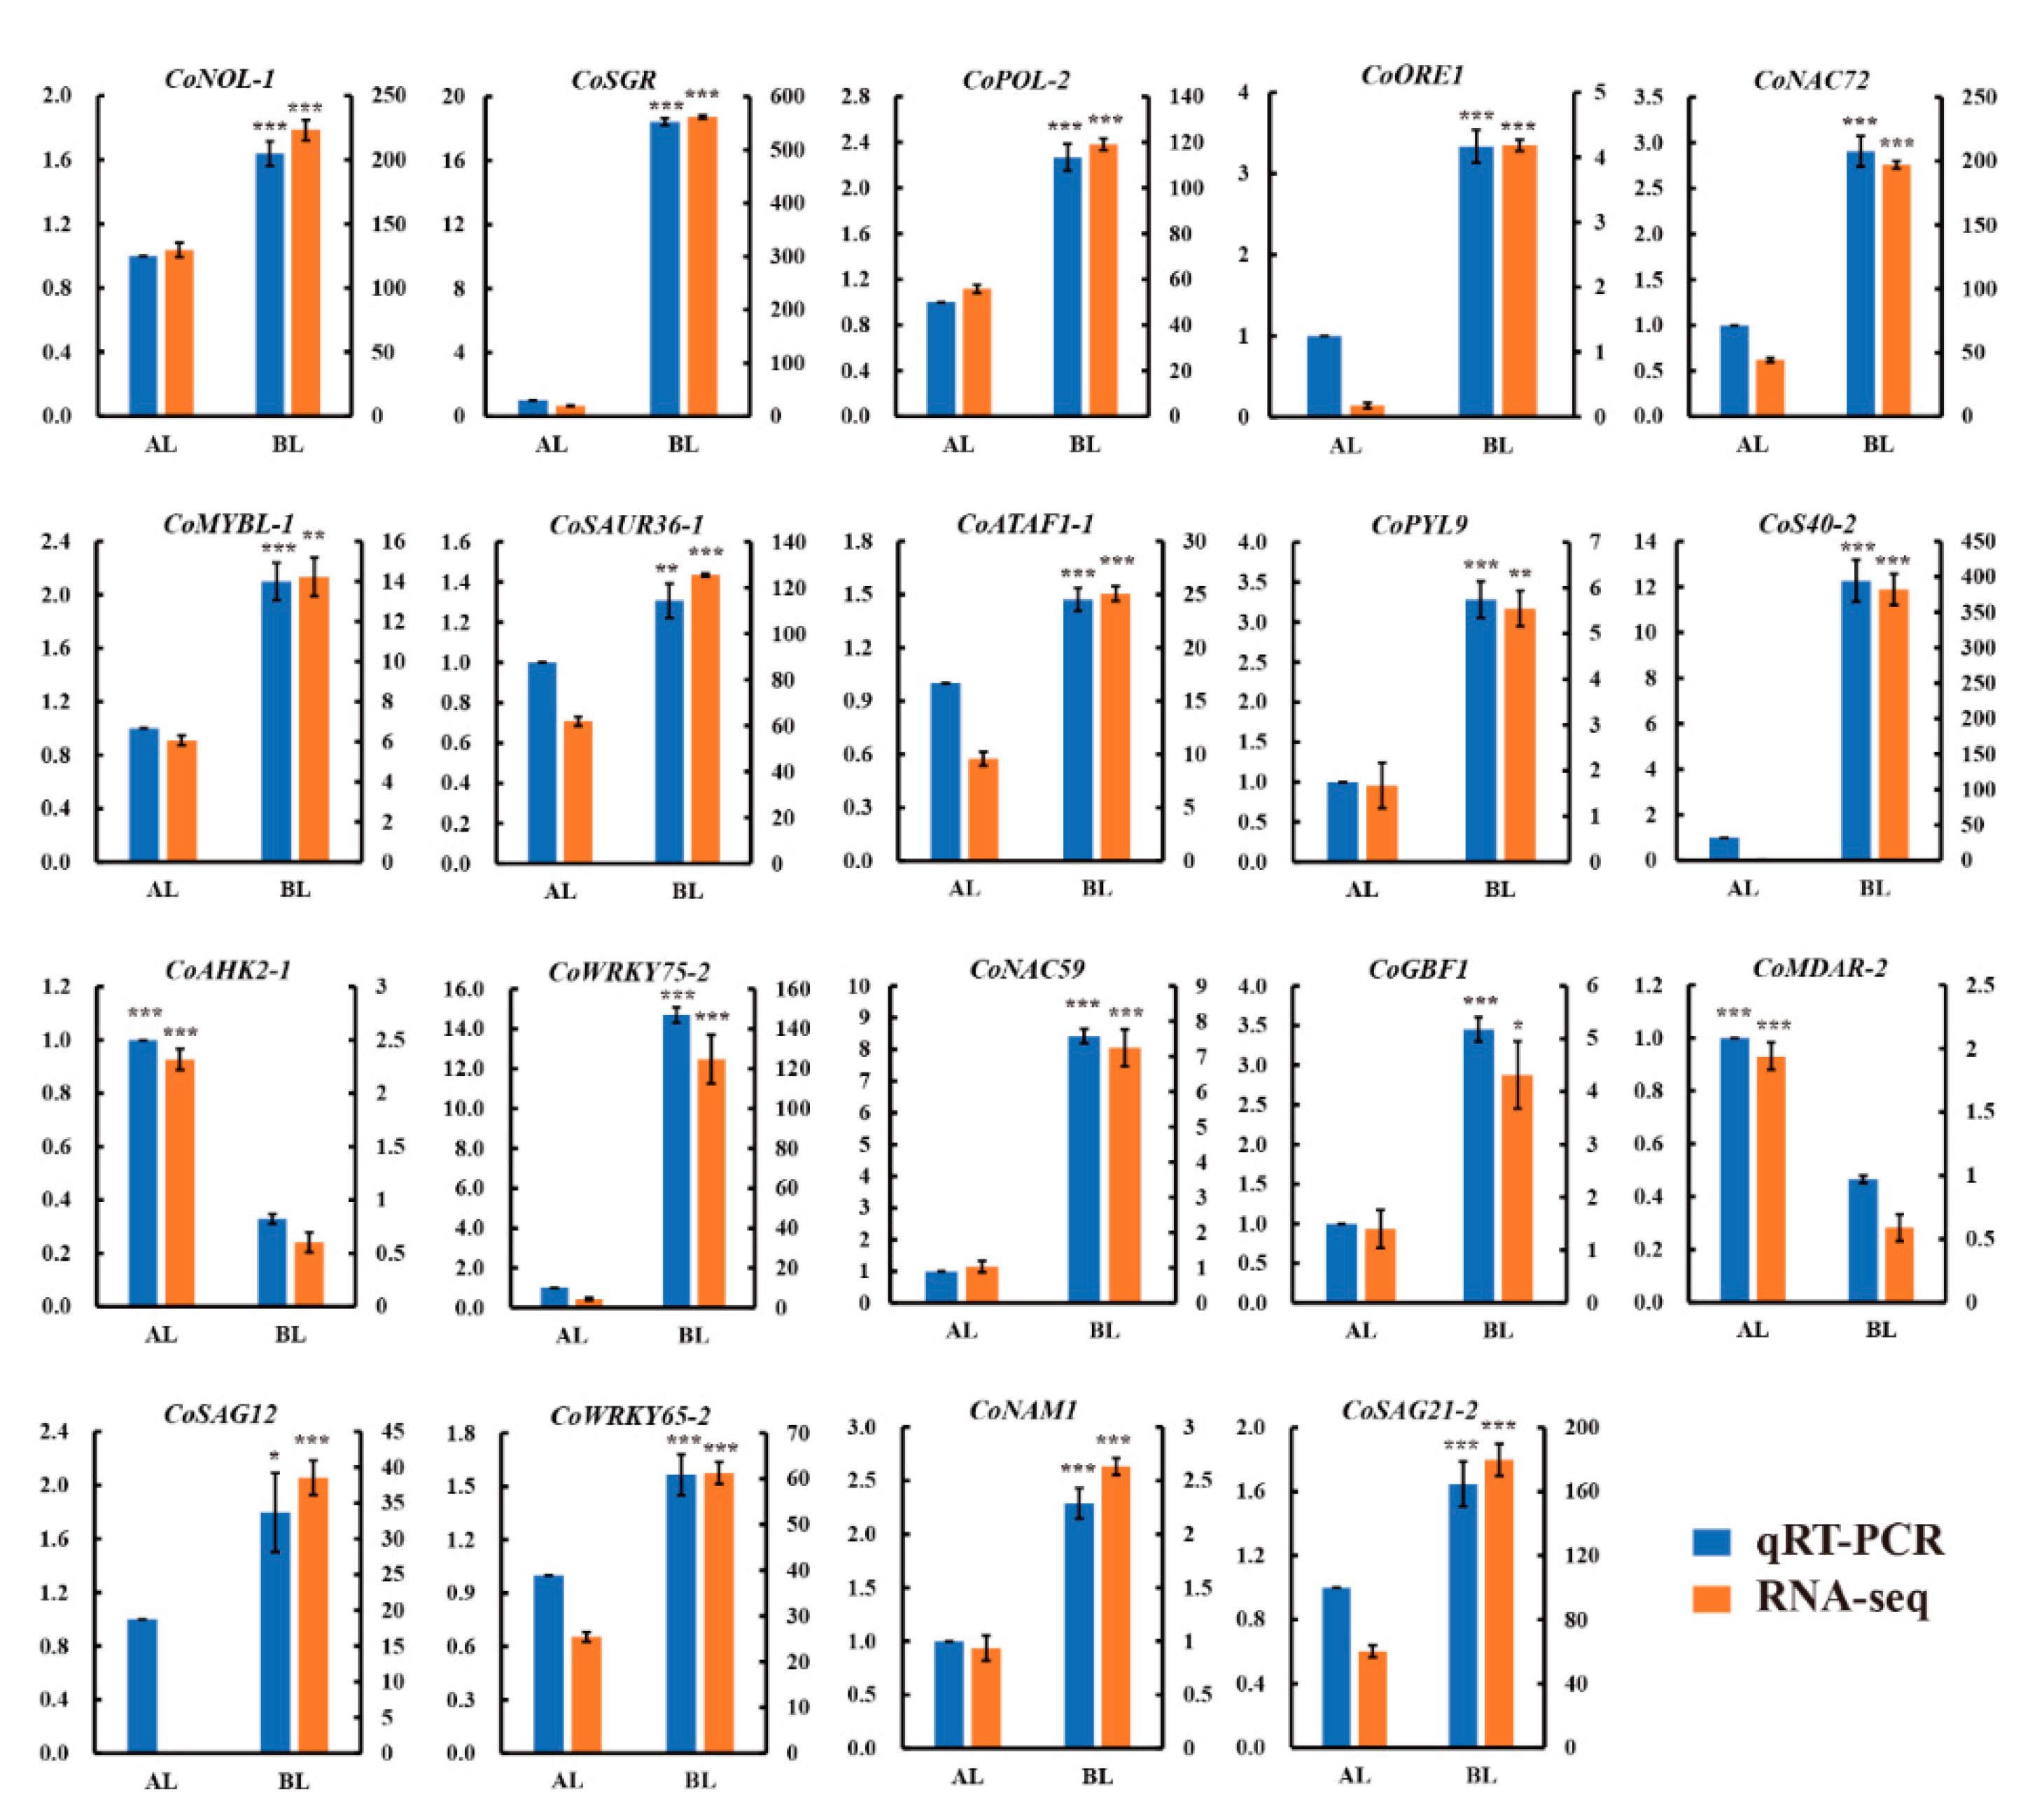
3.9. Validation of RNA-Seq Data by qRT-PCR

To verify the accuracy and reliability of the transcriptome data, 19 putative SAGs, which were speculated to be highly correlated with other SAGs by expression correlation analysis, were selected for further analysis using qRT-PCR. Our findings indicated that the results of qRT-PCR analysis were in accordance with the RNA-Seq data. Compared with annual leaves, the expression level of all predicted upregulated SAGs was significantly increased in biennial leaves, and two downregulated SAGs were correspondingly inhibited in senescent leaves (Figure 9). Therefore, these results suggest that our RNA-Seq data were reliable and consistent with the qRT-PCR analysis.

4. Discussion

In this study, we demonstrated that some important physiological differences occurred between younger and older leaves of C. oleifera. For example, compared with the younger annual leaves, the older biennial leaves showed less Chl concentration and antioxidant enzyme activities, and more accumulation of MDA. In fact, similar phenomena were also observed in other species. For instance, Gossypium hirsutum displays Chl breakdown and increased production of MDA during leaf senescence [51]. In Triticum aestivum, the activities of antioxidant enzymes such as SOD and CAT were inhibited in the process of leaf senescence, suggesting that the leaf senescence of the plant is generally accompanied by physiological changes such as the degradation of Chl and some macromolecules, and the reduction of antioxidant enzyme activity [52]. Our findings indicated that compared with the annual leaves, the biennial leaves showed obvious senescence phenotypes and physiological change, suggesting that these two kinds of leaves are suitable for the study of C. oleifera leaf senescence.
To gain more insight into the mechanism of leaf senescence in C. oleifera, a transcriptomic analysis was performed in both annual leaves and biennial leaves. In our study, a total of 4645 DEGs were identified, and we further interpreted the potential biological functions of DEGs from the gene function and signaling pathway through GO enrichment analysis and KEGG enrichment analysis, respectively. The results of GO enrichment showed that with the duration of leaf senescence of C. oleifera, ‘extracellular region’, ‘intrinsic component of membrane’, and ‘oxidoreductase activity’ were significantly enriched, which were consistent with the physiological changes we measured. During leaf senescence of C. oleifera, the activity of antioxidant enzyme and MDA concentration changed, and MDA is one of the most important products associated with membrane lipid peroxidation, and can further cause damage to cell membranes [53]. Therefore, on one hand, our results suggest that ROS plays a vital role in the process of C. oleifera leaf senescence, and on the other hand, these findings demonstrate that the physiological changes we determined and the analysis of transcriptome are reliable. Furthermore, based on KEGG enrichment, we found that ‘phenylpropanoid biosynthesis’ and ‘plant hormone signal transduction’ were significantly enriched. In fact, previous study also showed that during the leaf senescence of Sorghum bicolor, ‘phenylpropanoid biosynthesis’ and ‘plant hormone signal transduction’ exhibited the most DEGs [54].
Leaf senescence is a highly complex process, which is controlled by multiple pathways [49]. Based on previous studies and our findings on the physiological changes and transcriptomic analysis of C. oleifera, we speculated that leaf senescence may cause changes in pathways such as Chl degradation, plant hormones, and oxidation, etc. In order to reveal these changes, we performed differential expression statistics on the paramount pathways and found 77 essential SAGs in the process of C. oleifera leaf senescence, many of which are associated with Chl degradation, phytohormone signaling, and oxidation. For instance, compared with annual leaves, CoNOL and other Chl degradation related genes, ABA receptor gene CoPYL9 and senescence-related SAG12 were upregulated in biennial leaves, while cytokinin receptor CoAHK2 and antioxidant enzyme gene CoMDAR-2 were downregulated. Similar results were also observed in other species. For example, in Brassica napus, the SAG12 transcript evidently accumulates in older leaves [17]. In addition, in arabidopsis, during dark-induced senescence, the expression of SGR, NOL, and PAO also significantly increased to degrade Chl [55]. These results indicate that a similar senescence mechanism exists in the process of leaf senescence induced by environmental factor or age.
Notably, in this study, based on the analysis of these SAGs, we found that CoORE1 is simultaneously involved in Chl degradation and plant hormone signaling pathways, suggesting that SAGs may participate in more than one pathway to regulate leaf senescence. In fact, previous study in Brassica rapa demonstrated that BrNAC055 accelerates leaf senescence by activating the transcription of RBOH (ROS-producing enzymes respiratory burse oxidase homologue) and two Chl catabolic genes (BrNYC1 and BrNYE1), indicating that BrNAC055 is involved in Chl degradation and oxidation pathways [56]. To identify the potential correlation between these important pathways, we further constructed an expression correlation network for the 77 SAGs identified and found that there is an expression correlation between genes in different pathways. For example, CoORE1, which is involved in both Chl degradation and plant hormone pathways, correlated with CoWRKY75-2, a WRKY transcription factor that participates in both oxidation and hormone pathways. Furthermore, CoORE1 also correlated with other key SAGs such as CoSAG21-2 and CoSAG12. Expression correlation implies, to a certain extent, potential connections between genes. For instance, there is an expression correlation between senescence-related gene ONAC054 and ABA signaling associated gene OsABI5, and further experimental results indicated that ONAC054 directly upregulates the expression of OsABI5, thus regulating leaf senescence of rice [57]. Therefore, by constructing the expression correlation network, we predicted the possible connection between SAGs from a bioinformatics perspective. Nevertheless, the accurate regulatory relationship needs further experimental verification in future research.
TFs have important functions in transmitting and amplifying leaf senescence signals, thus activating a cascade of downstream genes [9]. Overexpression of Cucumis melo TF CmNAC60 in arabidopsis can promote leaf senescence of transgenic plants [58]. In this study, we performed statistical analysis on TFs and found that the differentially expressed TFs were mostly distributed in the MYB, WRKY, NAC families, etc. Expression correlation analysis showed that the functions of these senescence-associated TFs are complex. For instance, CoWRKY75-2 is highly correlated with the expression of several significant senescence-associated genes such as CoSAG12 and CoSAG21-1. CoNAC72 not only participates in Chl degradation, but also plays an important role in the hormone pathway. Notably, there is an expression correlation between CoNAC72 and CoATAF1-2. It is reported that homodimerization and heterodimerization among NAC TFs are crucial mechanisms in controlling NAC transcription factor mediated plant developmental processes [59,60], suggesting that these NAC TFs may form homodimers or heterodimers to function in regulating leaf senescence of C. oleifera. This phenomenon can also be found in rice, in which ONAC020 and ONAC026 share similar expression patterns during seed development, and ONAC020 can interact with ONAC026 [61]. In fact, in addition to NAC TFs, there have been similar reports on the study of WRKY TFs. In arabidopsis, WRKY54 and WRKY70 have been identified as important in leaf senescence, and they share a similar expression pattern during leaf senescence and co-operate as negative regulators [62]. Furthermore, in the present study, by using qRT-PCR, we found that the expression levels of key transcription factors such as CoMYBL-1 and CoNAC59 changed significantly, which was in good accordance with the transcriptome data, suggesting that TFs play important roles in C. oleifera leaf senescence based on the transcriptional level. In future research, CoMYBL-1, CoNAC72, CoWRKY75-2, and other TFs can be chosen as important candidates for the potential association between TFs and other SAGs to elucidate the leaf senescence mechanism. In addition to participating in senescence, TFs such as NAC72, ATAF1, and WRKY75 have also been widely reported to play important roles in the process of abiotic stress response in plants such as drought and salinity [63,64,65]. Our physiological results demonstrated that the accumulation of ROS in the annual leaves and biennial leaves was significantly different. Previous reports have shown that it is a common function of TFs to participate in the regulation of plants in response to abiotic stress through ROS pathways. Our qRT-PCR analysis indicated that the stress-responsive genes were differentially expressed between the two leaf types. Therefore, we speculated that beyond senescence, the two types of leaves also have tolerance differences in response to drought and other abiotic stresses, and TFs such as CoNAC72 and CoATAF1 may also be involved in the process of C. oleifera in response to abiotic stress. However, future research should acquire more data to verify this information.

5. Conclusions

To summarize, our results present a transcriptome analysis that combined physiological data and phenotypic observation, which contributes to the understanding of gene expression profiling underlying leaf senescence of C. oleifera. Compared with the annual leaves, a large number of DEGs were identified in the biennial leaves including 162 differentially expressed TFs. The present study explored 77 putative SAGs, which may be involved in the regulation of leaf senescence through Chl degradation, plant hormones, and oxidation pathways. There was a significant expression correlation between these SAGs, suggesting that these SAGs may jointly regulate leaf senescence. qRT-PCR analysis of 19 putative SAGs were in accordance with the RNA-Seq data, and in future research, these SAGs may serve as candidate genes for delaying leaf senescence in molecular breeding programs, thus increasing the yield of C. oleifera.

Supplementary Materials

The following are available online at https://www.mdpi.com/1999-4907/11/8/812/s1, Figure S1: NR annotated homologous species distribution map, Figure S2: Number of expressed unigenes in two kinds of C. oleifera leaves, Figure S3: Correlation analysis between different samples, Figure S4: Heat map of SAGs associated with important pathways, Table S1: Summary of sequencing data, Table S2: The details of putative SAGs, Table S3: The detail of differentially expressed TFs, Table S4: Primer sequences used in the qRT-PCR experiment.

Author Contributions

Conceptualization, S.Y. and L.Z.; Methodology, S.Y. and K.L.; Software, S.Y. and K.L.; Validation, S.Y. and L.Z.; Formal analysis, S.Y. and K.L.; Investigation, S.Y., M.Z., A.W., and J.Q.; Resources, L.Z.; Data curation, S.Y. and K.L.; Writing—original draft preparation, S.Y. and K.L.; Writing—review and editing, L.Z.; Visualization, S.Y.; Supervision, L.Z.; Project administration, L.Z.; Funding acquisition, L.Z. All authors have read and agreed to the published version of the manuscript.

Funding

This research was funded by a grant from the National Key R&D Program Project, grant number 2018YFD1000603 to Lingyun Zhang.

Conflicts of Interest

The authors declare no conflicts of interest.

References

  1. Zhuang, R. Camellia Oleifera in China; China Forestry Press: Beijing, China, 2008; p. 366. [Google Scholar]
  2. Yang, C.; Liu, X.; Chen, Z.; Lin, Y.; Wang, S. Comparison of Oil Content and Fatty Acid Profile of Ten New Camellia oleifera Cultivars. J. Lipids 2016, 2016, 3982486. [Google Scholar] [CrossRef] [Green Version]
  3. Lee, C.P.; Yen, G.C. Antioxidant activity and bioactive compounds of tea seed (Camellia oleifera Abel.) oil. J. Agric. Food Chem. 2006, 54, 779–784. [Google Scholar] [CrossRef]
  4. Lee, C.P.; Shih, P.H.; Hsu, C.L.; Yen, G.C. Hepatoprotection of tea seed oil (Camellia oleifera Abel.) against CCl4-induced oxidative damage in rats. Food Chem. Toxicol. 2007, 45, 888–895. [Google Scholar] [CrossRef]
  5. Chen, Y.; Deng, S.; Chen, L.; Ma, L.; He, H.; Wang, X.; Peng, S.; Liu, C.; Wang, R.; Xu, Y.; et al. A new view on the development of oil tea camellia industry. J. Nanjing For. Univ. Nat. Sci. Edit. 2020, 44, 1–10. [Google Scholar] [CrossRef]
  6. Lin, P.; Wang, K.; Zhou, C.; Xie, Y.; Yao, X.; Yin, H. Seed Transcriptomics Analysis in Camellia oleifera Uncovers Genes Associated with Oil Content and Fatty Acid Composition. Int. J. Mol. Sci. 2018, 19, 118. [Google Scholar] [CrossRef] [Green Version]
  7. Guo, Y.; Gan, S.S. Translational researches on leaf senescence for enhancing plant productivity and quality. J. Exp. Bot. 2014, 65, 3901–3913. [Google Scholar] [CrossRef] [PubMed] [Green Version]
  8. Lim, P.O.; Kim, H.J.; Nam, H.G. Leaf senescence. Annu. Rev. Plant Biol. 2007, 58, 115–136. [Google Scholar] [CrossRef] [PubMed] [Green Version]
  9. Podzimska-Sroka, D.; O’Shea, C.; Gregersen, P.L.; Skriver, K. NAC Transcription Factors in Senescence: From Molecular Structure to Function in Crops. Plants (Basel) 2015, 4, 412–448. [Google Scholar] [CrossRef] [PubMed] [Green Version]
  10. Woo, H.R.; Kim, H.J.; Lim, P.O.; Nam, H.G. Leaf Senescence: Systems and Dynamics Aspects. Annu. Rev. Plant Biol. 2019, 70, 347–376. [Google Scholar] [CrossRef] [Green Version]
  11. Miller, J.D.; Arteca, R.N.; Pell, E.J. Senescence-associated gene expression during ozone-induced leaf senescence in Arabidopsis. Plant Physiol. 1999, 120, 1015–1024. [Google Scholar] [CrossRef] [Green Version]
  12. Pruzinska, A.; Tanner, G.; Anders, I.; Roca, M.; Hortensteiner, S. Chlorophyll breakdown: Pheophorbide a oxygenase is a Rieske-type iron-sulfur protein, encoded by the accelerated cell death 1 gene. Proc. Natl. Acad. Sci. USA 2003, 100, 15259–15264. [Google Scholar] [CrossRef] [PubMed] [Green Version]
  13. Jehanzeb, M.; Zheng, X.; Miao, Y. The Role of the S40 Gene Family in Leaf Senescence. Int. J. Mol. Sci. 2017, 18, 2152. [Google Scholar] [CrossRef] [PubMed] [Green Version]
  14. Garapati, P.; Xue, G.P.; Munne-Bosch, S.; Balazadeh, S. Transcription Factor ATAF1 in Arabidopsis Promotes Senescence by Direct Regulation of Key Chloroplast Maintenance and Senescence Transcriptional Cascades. Plant Physiol. 2015, 168, 1122–1139. [Google Scholar] [CrossRef] [PubMed] [Green Version]
  15. Smykowski, A.; Zimmermann, P.; Zentgraf, U. G-Box binding factor1 reduces CATALASE2 expression and regulates the onset of leaf senescence in Arabidopsis. Plant Physiol. 2010, 153, 1321–1331. [Google Scholar] [CrossRef] [PubMed] [Green Version]
  16. Zheng, X.; Jehanzeb, M.; Habiba; Zhang, Y.; Li, L.; Miao, Y. Characterization of S40-like proteins and their roles in response to environmental cues and leaf senescence in rice. BMC Plant Biol. 2019, 19, 174. [Google Scholar] [CrossRef]
  17. Gombert, J.; Etienne, P.; Ourry, A.; Le Dily, F. The expression patterns of SAG12/Cab genes reveal the spatial and temporal progression of leaf senescence in Brassica napus L. with sensitivity to the environment. J. Exp. Bot. 2006, 57, 1949–1956. [Google Scholar] [CrossRef] [Green Version]
  18. Kuai, B.; Chen, J.; Hortensteiner, S. The biochemistry and molecular biology of chlorophyll breakdown. J. Exp. Bot. 2018, 69, 751–767. [Google Scholar] [CrossRef]
  19. Ramkumar, M.K.; Senthil Kumar, S.; Gaikwad, K.; Pandey, R.; Chinnusamy, V.; Singh, N.K.; Singh, A.K.; Mohapatra, T.; Sevanthi, A.M. A Novel Stay-Green Mutant of Rice with Delayed Leaf Senescence and Better Harvest Index Confers Drought Tolerance. Plants (Basel) 2019, 8, 375. [Google Scholar] [CrossRef] [Green Version]
  20. Sato, Y.; Morita, R.; Katsuma, S.; Nishimura, M.; Tanaka, A.; Kusaba, M. Two short-chain dehydrogenase/reductases, NON-YELLOW COLORING 1 and NYC1-LIKE, are required for chlorophyll b and light-harvesting complex II degradation during senescence in rice. Plant J. 2009, 57, 120–131. [Google Scholar] [CrossRef]
  21. Jan, S.; Abbas, N.; Ashraf, M.; Ahmad, P. Roles of potential plant hormones and transcription factors in controlling leaf senescence and drought tolerance. Protoplasma 2019, 256, 313–329. [Google Scholar] [CrossRef]
  22. Zhao, Y.; Chan, Z.; Gao, J.; Xing, L.; Cao, M.; Yu, C.; Hu, Y.; You, J.; Shi, H.; Zhu, Y.; et al. ABA receptor PYL9 promotes drought resistance and leaf senescence. Proc. Natl. Acad. Sci. USA 2016, 113, 1949–1954. [Google Scholar] [CrossRef] [PubMed] [Green Version]
  23. Riefler, M.; Novak, O.; Strnad, M.; Schmulling, T. Arabidopsis cytokinin receptor mutants reveal functions in shoot growth, leaf senescence, seed size, germination, root development, and cytokinin metabolism. Plant Cell 2006, 18, 40–54. [Google Scholar] [CrossRef] [PubMed] [Green Version]
  24. Rogers, H.; Munne-Bosch, S. Production and Scavenging of Reactive Oxygen Species and Redox Signaling during Leaf and Flower Senescence: Similar but Different. Plant Physiol. 2016, 171, 1560–1568. [Google Scholar] [CrossRef] [PubMed] [Green Version]
  25. Liang, D.; Shen, Y.; Ni, Z.; Wang, Q.; Lei, Z.; Xu, N.; Deng, Q.; Lin, L.; Wang, J.; Lv, X.; et al. Exogenous Melatonin Application Delays Senescence of Kiwifruit Leaves by Regulating the Antioxidant Capacity and Biosynthesis of Flavonoids. Front Plant Sci. 2018, 9, 426. [Google Scholar] [CrossRef]
  26. Bengoa Luoni, S.; Astigueta, F.H.; Nicosia, S.; Moschen, S.; Fernandez, P.; Heinz, R. Transcription Factors Associated with Leaf Senescence in Crops. Plants (Basel) 2019, 8, 411. [Google Scholar] [CrossRef] [Green Version]
  27. Guo, P.; Li, Z.; Huang, P.; Li, B.; Fang, S.; Chu, J.; Guo, H. A Tripartite Amplification Loop Involving the Transcription Factor WRKY75, Salicylic Acid, and Reactive Oxygen Species Accelerates Leaf Senescence. Plant Cell 2017, 29, 2854–2870. [Google Scholar] [CrossRef]
  28. Qiu, K.; Li, Z.; Yang, Z.; Chen, J.; Wu, S.; Zhu, X.; Gao, S.; Gao, J.; Ren, G.; Kuai, B.; et al. EIN3 and ORE1 Accelerate Degreening during Ethylene-Mediated Leaf Senescence by Directly Activating Chlorophyll Catabolic Genes in Arabidopsis. PLoS Genet. 2015, 11, e1005399. [Google Scholar] [CrossRef]
  29. Zhang, X. Determination of chlorophyll content in plants -- Acetone ethanol mixture method. Liaoning Agric. Sci. 1986, 3, 28–30. [Google Scholar]
  30. Sedmak, J.J.; Grossberg, S.E. A rapid, sensitive, and versatile assay for protein using Coomassie brilliant blue G250. Anal. Biochem. 1977, 79, 544–552. [Google Scholar] [CrossRef]
  31. Dhindsa, R.S.; Plumb-Dhindsa, P.; Thorpe, T.A. Leaf senescence: Correlation with increased levels of membrane permeability and lipid peroxidation and increased levels of superoxide dismutase and catalase. J. Exp. Bot. 1981, 32, 93–101. [Google Scholar] [CrossRef]
  32. Bates, L.S.; Waldren, R.P.; Teare, I.D. Rapid Determination of Free Proline for Water-Stress Studies. Plant & Soil 1973, 39, 205–207. [Google Scholar]
  33. Grabherr, M.G.; Haas, B.J.; Yassour, M.; Levin, J.Z.; Thompson, D.A.; Amit, I.; Xian, A.; Lin, F.; Raychowdhury, R.; Zeng, Q.; et al. Full-length transcriptome assembly from RNA-Seq data without a reference genome. Nat. Biotech. 2011, 29, 644–652. [Google Scholar] [CrossRef] [PubMed] [Green Version]
  34. Smith-Unna, R.; Boursnell, C.; Patro, R.; Hibberd, J.M.; Kelly, S. TransRate: Reference-free quality assessment of de novo transcriptome assemblies. Genome Res. 2016, 26, 1134–1144. [Google Scholar] [CrossRef] [PubMed] [Green Version]
  35. Fu, L.; Niu, B.; Zhu, Z.; Wu, S.; Li, W. CD-HIT: Accelerated for clustering the next-generation sequencing data. Bioinformatics 2012, 28, 3150–3152. [Google Scholar] [CrossRef]
  36. Seppey, M.; Manni, M.; Zdobnov, E.M. BUSCO: Assessing Genome Assembly and Annotation Completeness. Methods Mol. Biol. 2019, 1962, 227. [Google Scholar]
  37. Deng, Y.Y.; Li, J.Q.; Wu, S.F.; Zhu, Y.P.; He, F.C. Integrated nr Database in Protein Annotation System and Its Localization. Comput. Eng. 2006, 32, 71–72. [Google Scholar]
  38. Rolf, A.; Amos, B.; Wu, C.H.; Barker, W.C.; Brigitte, B.; Serenella, F.; Elisabeth, G.; Huang, H.; Rodrigo, L.; Michele, M. UniProt: The Universal Protein knowledgebase. Nucleic Acids Res. 2004, 32, D115–D119. [Google Scholar]
  39. Finn, R.D. Pfam: The Protein Families Database; American Cancer Society: Atlanta, GA, USA, 2005. [Google Scholar]
  40. Tatusov, R.L.; Galperin, M.Y.; Natale, D.A.; Koonin, E.V. The COG database: A tool for genome-scale analysis of protein functions and evolution. Nucleic Acids Res. 2000, 28, 33. [Google Scholar] [CrossRef] [Green Version]
  41. Ashburner, M.; Ball, C.A.; Blake, J.A.; Botstein, D.; Butler, H.; Cherry, J.M.; Davis, A.P.; Dolinski, K.; Dwight, S.S.; Eppig, J.T.; et al. Gene Ontology: Tool for the unification of biology. Nat. Genet. 2000, 25, 25–29. [Google Scholar] [CrossRef] [Green Version]
  42. Minoru, K.; Yoko, S.; Masayuki, K.; Miho, F.; Mao, T. KEGG as a reference resource for gene and protein annotation. Nuclc Acids Res. 2016, 44, D457–D462. [Google Scholar]
  43. Wagner, G.P.; Kin, K.; Lynch, V.J. Measurement of mRNA abundance using RNA-seq data: RPKM measure is inconsistent among samples. Theory Biosci. 2012, 131, 281–285. [Google Scholar] [CrossRef] [PubMed]
  44. Love, M.I.; Huber, W.; Anders, S. Moderated estimation of fold change and dispersion for RNA-seq data with DESeq2. Genome Biol. 2014, 15, 550. [Google Scholar] [CrossRef] [PubMed] [Green Version]
  45. Klopfenstein, D.V.; Zhang, L.; Pedersen, B.S.; Fidel, R.; Alex, W.V.; Aurélien, N.; Mungall, C.J.; Yunes, J.M.; Olga, B.; Mark, W. GOATOOLS: A Python library for Gene Ontology analyses. Sci. Rep. 2018, 8, 10872. [Google Scholar] [CrossRef] [PubMed]
  46. Xie, C.; Mao, X.; Huang, J.; Ding, Y.; Wu, J.; Dong, S.; Kong, L.; Gao, G.; Li, C.Y.; Wei, L. KOBAS 2.0: A web server for annotation and identification of enriched pathways and diseases. Nuclc Acids Res. 2011, 39, 316–322. [Google Scholar] [CrossRef] [Green Version]
  47. Li, Z.; Zhang, Y.; Zou, D.; Zhao, Y.; Wang, H.; Zhang, Y.; Xia, X.; Luo, J.; Guo, H.; Zhang, Z. LSD 3.0: A comprehensive resource for the leaf senescence research community. Nucleic Acids Res. 2019, 48, D1069–D1075. [Google Scholar] [CrossRef]
  48. Liang, K.; Wang, A.; Sun, Y.; Yu, M.; Zhang, L. Identification and Expression of NAC Transcription Factors of Vaccinium corymbosum L. in Response to Drought Stress. Forests 2019, 10, 1088. [Google Scholar] [CrossRef] [Green Version]
  49. Jeongsik, K.; Hee, K.J.; Il, L.J.; Ryun, W.H.; Ok, L.P. New insights into the regulation of leaf senescence in Arabidopsis. J. Exp. Bot. 2017, 4, 787–799. [Google Scholar]
  50. Landis, J.B.; Soltis, D.E.; Soltis, P.S. Comparative transcriptomic analysis of the evolution and development of flower size in Saltugilia (Polemoniaceae). BMC Genom. 2017, 18, 475. [Google Scholar] [CrossRef] [Green Version]
  51. Lin, M.; Pang, C.; Fan, S.; Song, M.; Wei, H.; Yu, S. Global analysis of the Gossypium hirsutum L. Transcriptome during leaf senescence by RNA-Seq. BMC Plant Biol. 2015, 15, 43. [Google Scholar] [CrossRef] [Green Version]
  52. Srivalli, S.; Khanna-Chopra, R. Delayed wheat flag leaf senescence due to removal of spikelets is associated with increased activities of leaf antioxidant enzymes, reduced glutathione/oxidized glutathione ratio and oxidative damage to mitochondrial proteins. Plant Physiol. Biochem. 2009, 47, 663–670. [Google Scholar] [CrossRef]
  53. Moore, K.; Roberts, L.J. Measurement of Lipid Peroxidation. Free Radic. Res. Commun. 1998, 28, 659–671. [Google Scholar] [CrossRef]
  54. Wu, X.; Hu, W.; Luo, H.; Xia, Y.; Zhao, Y.; Wang, L.; Zhang, L.; Luo, J.; Jing, H. Transcriptome profiling of developmental leaf senescence in sorghum (Sorghum bicolor). Plant Mol. Biol. 2016, 92, 555–580. [Google Scholar] [CrossRef] [PubMed]
  55. Zhang, Y.; Liu, Z.; Chen, Y.; He, J.; Bi, Y. PHYTOCHROME-INTERACTING FACTOR 5 (PIF5) positively regulates dark-induced senescence and chlorophyll degradation in Arabidopsis. Plant Sci. 2015, 237, 57–68. [Google Scholar] [CrossRef] [PubMed]
  56. Fan, Z.Q.; Tan, X.L.; Chen, J.W.; Liu, Z.L.; Kuang, J.F.; Lu, W.J.; Shan, W.; Chen, J.Y. BrNAC055, a Novel Transcriptional Activator, Regulates Leaf Senescence in Chinese Flowering Cabbage by Modulating Reactive Oxygen Species Production and Chlorophyll Degradation. J. Agric. Food Chem. 2018, 66, 9399–9408. [Google Scholar] [CrossRef]
  57. Sakuraba, Y.; Kim, D.; Han, S.-H.; Kim, S.-H.; Paek, N.-C. Multilayered Regulation of Membrane-Bound ONAC054 Is Essential for Abscisic Acid-Induced Leaf Senescence in Rice. Plant Cell 2020, 32, 630–649. [Google Scholar] [CrossRef] [PubMed]
  58. Cao, S.; Zhang, Z.; Wang, C.; Li, X.; Guo, C.; Yang, L.; Guo, Y. Identification of a Novel Melon Transcription Factor CmNAC60 as a Potential Regulator of Leaf Senescence. Genes 2019, 10, 584. [Google Scholar] [CrossRef] [Green Version]
  59. Jin, S.J.; Park, Y.T.; Jung, H.; Park, S.H.; Kim, J.K. Rice NAC proteins act as homodimers and heterodimers. Plant Biotechnol. Rep. 2009, 3, 127–134. [Google Scholar]
  60. Wang, X.; Culver, J.N. DNA binding specificity of ATAF2, a NAC domain transcription factor targeted for degradation by Tobacco mosaic virus. BMC Plant Biol. 2012, 12, 1–14. [Google Scholar] [CrossRef] [Green Version]
  61. Mathew, I.E.; Das, S.; Mahto, A.; Agarwal, P. Three Rice NAC Transcription Factors Heteromerize and Are Associated with Seed Size. Front Plant Sci. 2016, 7, 1638. [Google Scholar] [CrossRef] [Green Version]
  62. Besseau, S.; Li, J.; Palva, E.T. WRKY54 and WRKY70 co-operate as negative regulators of leaf senescence in Arabidopsis thaliana. J. Exp. Bot. 2012, 63, 2667–2679. [Google Scholar] [CrossRef]
  63. Liu, C.; Sun, Q.; Zhao, L.; Li, Z.; Peng, Z.; Zhang, J. Heterologous Expression of the Transcription Factor EsNAC1 in Arabidopsis Enhances Abiotic Stress Resistance and Retards Growth by Regulating the Expression of Different Target Genes. Front Plant Sci. 2018, 9, 1495. [Google Scholar] [CrossRef] [PubMed] [Green Version]
  64. Lopez-Galiano, M.J.; Gonzalez-Hernandez, A.I.; Crespo-Salvador, O.; Rausell, C.; Real, M.D.; Escamilla, M.; Camanes, G.; Garcia-Agustin, P.; Gonzalez-Bosch, C.; Garcia-Robles, I. Epigenetic regulation of the expression of WRKY75 transcription factor in response to biotic and abiotic stresses in Solanaceae plants. Plant Cell Rep. 2018, 37, 167–176. [Google Scholar] [CrossRef] [PubMed]
  65. Wu, Y.; Deng, Z.; Lai, J.; Zhang, Y.; Yang, C.; Yin, B.; Zhao, Q.; Zhang, L.; Li, Y.; Yang, C.; et al. Dual function of Arabidopsis ATAF1 in abiotic and biotic stress responses. Cell Res. 2009, 19, 1279–1290. [Google Scholar] [CrossRef]
Figure 1. Morphological and physiological observation of different leaves of Camellia Oleifera Abel. (A) The phenotype of annual leaves and biennial leaves (AL: annual leaves; BL: biennial leaves). (B) Chl (chlorophyll) content. (C) Soluble protein content. (D) MDA (malondialdehyde) content. (E) Proline content. (F) SOD (superoxide dismutase) activity. (G) POD (peroxidase) activity. (H) CAT (catalase) activity. *: 0.01 ≤ p < 0.05, **: 0.001 ≤ p < 0.01, ***: p < 0.001.
Forests 11 00812 g001
Figure 2. Venn diagram of unigenes annotated in NR (NCBI non-redundant), Swiss-Prot, Pram (Protein family), COG (Clusters of Genes), GO (Gene Ontology), and KEGG (Kyoto Encyclopedia of Genes and Genomes) protein databases.
Forests 11 00812 g002
Figure 3. Analysis of gene expression in two kinds of leaves. (A) Volcanic map of differentially expressed gene. Each point represents an expressed unigene, the abscissa represents the fold change value of gene expression difference in the two samples, the vertical axis represents the statistical test value of the difference in gene expression, p-value. Compared with annual leaves, red shows that the gene expression was upregulated in biennial leaves, green represents the gene expression that was downregulated in biennial leaves, and grey represents non-differentially expressed genes. (B) Heat map of differentially expressed genes. AL_1, AL_2 and AL_3 represent three biological replicates of annual leaves. BL_1, BL_2, and BL_3 represent three biological replicates of biennial leaves.
Forests 11 00812 g003
Figure 4. GO (Gene Ontology) enrichment analysis of DEGs (differentially expressed unigenes). (A) GO enrichment of all DEGs. (B) GO enrichment of upregulated DEGs. (C) GO enrichment of downregulated DEGs. The abscissa represents different GO terms, the vertical axis on the left represents the significance level of enrichment, corresponding to the height of the column, and the vertical axis on the right represents the number of unigenes of each GO term, corresponding to different points on the polyline.
Forests 11 00812 g004
Figure 5. Enriched KEGG (Kyoto Encyclopedia of Genes and Genomes) pathway analysis of DEGs (differentially expressed unigenes). (A) KEGG pathway analysis of all DEGs. (B) KEGG pathway analysis of upregulated DEGs. (C) KEGG pathway analysis of downregulated DEGs. The abscissa represents different KEGG pathways, the vertical axis on the left represents significance level of enrichment, corresponding to the height of the column, and the vertical axis on the right represents the number of unigenes of each KEGG pathway, corresponding to different points on the polyline.
Forests 11 00812 g005
Figure 6. The ratios of expression levels (biennial leaves/annual leaves) for putative SAGs. (A) The genes involved in the Chl (chlorophyll) degradation pathway. (B) Genes associated with plant hormone pathway. (C) Genes associated with oxidation pathway. (D) Other senescence-associated genes. The relative expression value was normalized to the annual leaf expression level.
Forests 11 00812 g006
Figure 7. Expression correlation analysis of putative SAGs. Each node represents a unigene, and the connection between nodes represents the expression correlation of genes. Large node suggests that this gene has expression correlation with a large number of other genes.
Forests 11 00812 g007
Figure 8. Distribution of differentially expressed transcription factors (TFs). Compared with annual leaves, red represents up-regulated TFs in biennial leaves, blue represents down-regulated TFs in biennial leaves.
Forests 11 00812 g008
Figure 9. The validation of transcriptome by qRT-PCR (Quantitative Real-time PCR). The vertical axis on the left represents the relative expression level of genes by qRT-PCR analysis, and the vertical axis on the right represents the TPM (Transcripts Per Million reads) value analyzed by RNA-Seq. *: 0.01 ≤ p < 0.05, **: 0.001 ≤ p < 0.01, ***: p < 0.001.
Forests 11 00812 g009
Table 1. Summary of sequence assembly.
ItemUnigene
Total number78,860
Total base68,289,653
Average length (bp)865.96
N50 length (bp)1374
GC percent (%)39.19

