Abstract
The distribution of karst landscapes over the Earth’s surface, to a large extent, follows the distribution of carbonate (limestone and dolomite) and gypsum rocks and together these make up about 12% of the Earth’s land area, and the largest karst region in to world is in Southwestern China. Characterized by a unique set of landforms, these geographical areas also differ from other geomorphic regions by the presence of cave systems in the subsurface. Unfortunately, due to human disturbances, such as deforestation, agricultural expansion, livestock overgrazing and fire, these regions have been affected by varying degrees of degradation, which could also be worsened if water and soil erosion phenomena typical of these areas are considered. Therefore, there is a need to implement measures and strategies to protect these karst areas and develop plans to restore vegetation in this region. To support local and national authorities to achieve this goal, this study aims to characterize nutrient deficiencies in degraded areas and estimate what could be the thresholds required to facilitate the restoration of vegetation in karst areas in southwest China. The results obtained confirm that the total element concentrations for Soil Organic Carbon (SOC), N, K, Ca, P, S and Mg were relatively high in the study karst area in southwest China. However, the total amounts of soil nutrients stored were very low due to the limited amount of soil identified as a consequence of previous deforestation processes undertaken within this study area and this aspect needs to be taken into consideration if aiming at a positive success of future restoration processes.
1. Introduction
Karst topography is a type of special landform that develops on carbonate rocks such as limestone or dolomite due to the action of water [1,2]. Karst areas are widely distributed around the world, cover a total area of approximately 22 million km2, accounting for about 12% of the total world land area [3,4,5,6,7]. These areas are inhabited by nearly 1 billion people [3]. Southwestern China is the largest karst region in the world with a total area of approximately 540,000 km2, and its ecosystems and environments are affected by the natural and hydrological processes typical of karst regions. Guizhou Province (0.12 million km2, with 61.17% of the region’s total land area [7]) is the largest contribution, followed by Yunnan Province and Guangxi Zhuang Autonomous Region. Due to continuous urbanization during the last decade in these regions, the request for land and wood has increased and this has led to land change use and intense deforestation, which has consequently caused huge soil losses [8]. Additionally, many karst forests have been damaged to varying degrees over the past few decades due to increasing human disturbance, which is reflected in logging issues, agricultural expansion, overgrazing, and human induced fires. Unfortunately, recent studies have also confirmed how these soil losses have caused a serious environmental threat to the sustainability of these regions [9,10,11] and models have been developed to estimate the spatial and temporal patterns of soil loss [12,13,14].
To aggravate the situation, due to the lack of soil, fertilizer and evenly distributed access to water for the plants, the vegetation typical of this karst area is broad-leaved mixed forest even if it should be characterized by evergreen broad-leaved forests and seasonal rain forests being affected by a subtropical climate and thus influenced by abundant rainfall and high temperatures [15].
The results obtained by these developed models have been provided to local and national authorities to assist them with the stipulation and implementation of strategic guidelines to improve the management of these karst areas and enhance the conservation of soil and water resources [14,16,17]. However, despite the continuous progress, due to the challenging habitat under consideration and the constraints on developing efficient plans for vegetation restoration, most actions have been unsuccessful.
Due to its nature, karst land is characterized by rocks that contain acid-insoluble material, which makes the soil formation an extremely low process. Wang and Zhang (1999) [18] found that the formation of 1 cm of soil in the limestone area of southwest China required 4000 to 5000 years. Another example is associated with the rockiness rate of the Maolan Karst forest. In this forest, the level of rocks can be 70–80%, and only a small amount of soil exists in the rock crevice. In parallel, soil erosion is quite consistent, leading to extremely shallow soil in the karst area [19]. It was reported that the mean depth of topsoil on the karst hills was only about 2–9 cm [20,21], and therefore the lack of soil reflects on the lack of water and hence less nutrients available. The droughts caused by karst landforms have also been considered to be the most important factors limiting plant growth and vegetation restoration in this karst region [22].
It is well known that plants require various nutrients, some in large quantities and others in small amounts, that can generally be acquired from the soil solution [23,24,25,26,27,28,29,30,31,32,33,34]. Karst soils are generally considered to be fertile due to higher organic matter content in lime soils, and nutrient restriction necessary for continuous vegetation growth is often overlooked. Nutrient availability is one of the most important drivers for the growth of ecosystems [35,36]. Considering the entire globe, the phenomenon of nutrient-restricted primary productivity and other biological processes is strongly combined in each ecosystem [37,38]. It is essential to maintain sufficient contents and stable proportions of different nutrients in plant tissues for healthy growth. Studies have in face demonstrated that especially the deficiency of plant-available phosphorus (P) was considered to be one of the most important factors limiting plant productivity in karst habitats due to lowered mobility of P bound to calcium phosphates in calcareous soils [39]. This phenomenon was investigated within other karst areas in different countries. For example, it was also found that the limestone grassland in the UK was mainly limited by P [40]. Moreover, the overall productivity of calcareous grassland in northwestern Switzerland was limited by nitrogen (N) and legume growth was limited by P [41,42]. The wooded meadow on calcareous soils in Estonia [39], the calcareous grasslands in the Peak District of the UK [43] and in northern Switzerland [44] and Germany [45] were all co-limited by N and P. To date, only a few studies on the stoichiometry of karst plants indicated that plant growth in the karst region of southwestern China was mainly limited by P or co-limited by N and P [24,30,46,47]. Studies identified in literature have shown that the lack of nutrients caused by the extremely low amount of soil may be a key limiting factor in vegetation restoration in karst areas [15,20,48].
Seasons play a significant role in the concentrations of phosphorus (P) and nitrogen (N) in plant leaves, characterizing nutrient availability, environmental conditions, annual physiological cycle, and the extent of maturity [49,50,51,52,53]. It has been demonstrated that the uptake of P from soils and its allocation into leaves mainly occur in spring (from mid-March to late May) [54], while the deficiency of P in plants may occur across growing seasons, especially for newly established vegetation [55]. Similarly, N uptake changes across chemical species and growing stages, depending on environmental conditions and ion proportions [56]. Seasonal changes of leaf N content reflect plant physiology and environmental impacts [57]. Considering all these important concepts, it becomes essential to understand nutrient dynamics to be able to achieve the knowledge required to improve the management of fertilizers in order to optimize the growth of vegetation using efficient fertilization based on the plant uptake capacity of specific nutrients required [56,58,59]. Additionally, other nutrients have been considered important for the conservation of plants because directly related with the species composition and the dynamics of the native vegetation, such as calcium (Ca), magnesium (Mg), sulfur (S), potassium (K) and carbon (C) [47].
Human activities, such as deforestation processes, natural disasters and the effects of climate change [60,61], such as heavy rainfall and consequent soil erosion, are altering the availability of these nutrients present in the soil, initiating conditions that may be lethal for the environments and its general growth. Thus, it is of primary importance to investigate the necessary quantities of these nutrients to deliver plans for an efficient restoration of these natural areas. To the authors’ knowledge, there is very limited research on soil nutrient reserves and nutrient requirements for the restoration of vegetation in karst areas and it is still unknown whether the total nutrient content in the extremely shallow soil typical of karst areas can meet the targets required.
To fill this gap, the purpose of this study is to quantify the nutrient reserves and their allocation in karst ecosystems in southwestern China, and determine whether nutrient deficiencies caused by the very low amount of soil are the restrictive factors for the restoration of vegetation in karst areas. This study focused on two different types of vegetation, arbor forest (F) and shrub–arbor forest transition (FS), and the parameters collected in the field were values of the biomass, the soil volume and the soil nutrient reserves (carbon (C), nitrogen (N), potassium (K), calcium (Ca), phosphorus (P), sulfur (S) and magnesium (Mg)). All these parameters were essential to calculate the nutrient requirements for the restoration of vegetation typical for the passage from shrub–arbor forest to arbor forest.
2. Materials and Methods
2.1. Study Area
The study area was located in a Karst area of Puding County, Guizhou province, southwestern China (E: 105°27′49″–105°58′51″, N: 26°9′36″–26°31′42″) as displayed in Figure 1. The elevation of the site ranges from 1100 to 1600 m above sea level. This area is affected by the north subtropical humid monsoon climate and the mean annual precipitation and temperature of this region are 1390 mm and 15.1 °C, respectively.
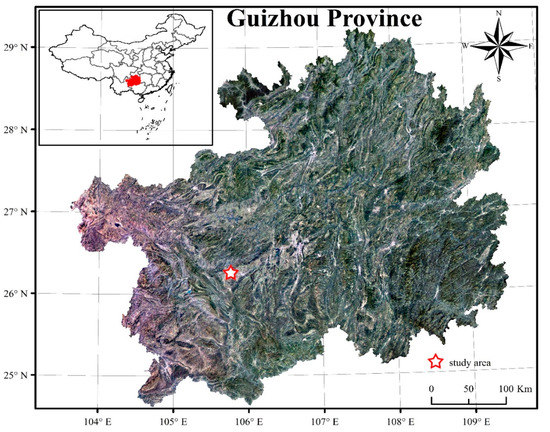
Figure 1.
Location of the study area in China.
As previously mentioned, calcareous soil (Chinese soil genetic classification or United States Department of Agriculture (USDA) soil taxonomy) and yellow soils (Chinese soil genetic classification) are the main soil types found in this region. Over the last decade, this area has been in direct contact with expansion due to human activities and wide deforestation processes have significantly modified it. After field observation, it was found that within this area of study there were two typical vegetation types, which could be related to F and FS (Figure 2 and Figure 3).
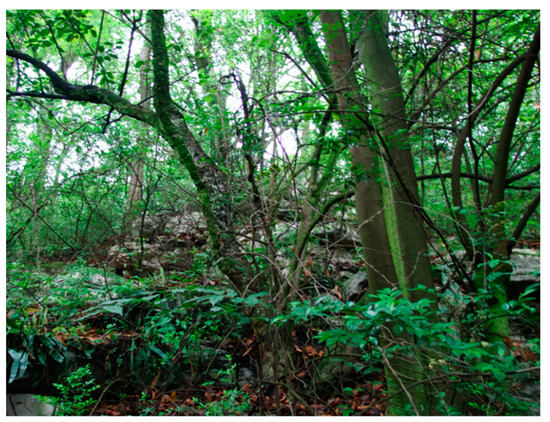
Figure 2.
Example of an arbor forest (F) investigated in this study.
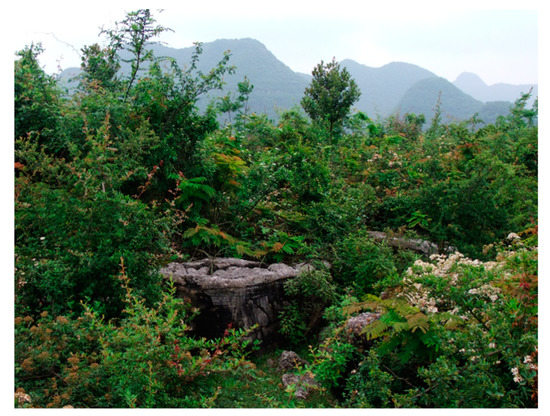
Figure 3.
Example of a shrub–arbor forest transition (FS) investigated in this study.
As it is possible to notice from Figure 2, deciduous and evergreen trees higher than 10 m dominated the arbor forest (F). On the other side, the shrub–arbor forest mainly consisted of trees and shrubs with a small diameter at breast height (DBH). The shrub arbor forest (FS) was the vegetation generated due to deforestation processes within the study area. On the other side, the arbor forest (F) was a natural forest characterized by a relatively small amount of damage induced by deforestation processes. The F and FS plots studied in this work were chosen very close together; hence, they are affected by the same lithology and climate conditions. FS was not the climax vegetation in our study area.
Studies have identified that there is a complex and interactive role between forest and forest soils within the environment [62,63]. The second category is vital for ecosystem processes such as nutrient uptake, decomposition, and water availability but it also provides a structural support because it works as an anchorage for the trees. Nevertheless, trees are essential for the creation of new soil due to the continuous decomposition of rot leaves they lose.
Thus, if the vegetation is restored from FS to F within the area of study it will correspond to a higher consume of soil elements needed by the trees to grow, but it is essential to protect trees and forests because both of these vital resources play pivotal roles in food security and a healthy environment.
For this study, a total of 10 representative plots were established in the area selected within Guizhou Province. The characteristics and specific details of these plots and their correspondent vegetation are presented in Table 1 (Supplementary datasets can be found online within this manuscript).

Table 1.
Description of the two types of vegetation.
2.2. Vegetation Sampling
The field data collection was conducted in January, June, August 2009 and January, June 2010. In the F and FS stands, all woody plants with height ≥ 1.5 m were measured inside each plot. Height, DBH, basal diameter (BD) (only for shrubs) were recorded for each plant using measure tapes. The human errors in recording height, DHB and BD were quantified between 1–3% of the measurement taken. Woody plants with height below 1.5 m were measured in 3 subplots of 25 m2 size (5 m × 5 m). BD instead of DBH was recorded for all individuals. Four herbaceous subplots (2 m × 2 m) were set up in each plot.
2.3. Biomass Determination
The aboveground biomass of the woody plants in all plots was estimated from plot-level filed surveys of species composition, DBH (for trees higher than 1.5 m) and BD (for shrub species groups) using allometric regression equations. The method and these equations were introduced in detail in our previous study [21,47,64]. In all study plots, allometric equations were used to estimating woody parts and foliar materials. All herbaceous plants were harvested in 2 m × 2 m subplots. Fresh weights were determined in the field while oven-dried weights were determined in the laboratory. The ratios of belowground biomass to aboveground biomass for FS and F are 0.57 and 0.53, respectively, in line with those identified in another karst area in Guizhou [65]. Table 2 and Table 3 display the allometric regression equations for most typical species identified within the area for foliage and wood.
Table 2.
Allometric regression equations (foliage) for the most typical biomass in the karst study area, southwest China [21]. DT (Dedicous tree); ET (Evergreen tree); DS (Deciduous Shrub). WL, WW, DBH, BD, H are biomass of leaf (g), diameter at breast height (mm), basal diameter (mm) and height (m), respectively.
Table 3.
Allometric regression equations (wood) for the most typical biomass in the karst study area, southwest China [21]. DT (Dedicous tree); ET (Evergreen tree); DS (Deciduous Shrub). WL, WW, DBH, BD, H are biomass of woody material (g), diameter at breast height (mm), basal diameter (mm) and height (m), respectively.
2.4. Soil Sampling
Karst habitat is a very special and different from all the other existing ones across the world. Within this study area, soil and litter distribution was patchy. The depth and cover area of the soil were uneven. As a result, the general methods to determine soil quantities were not completely suitable in this habitat. Therefore, the microhabitats inventory method was preferred to determine the total soil amount in each plot under investigation. Based on topography and whether there was soil or not, the whole habitat was divided into many microhabitats. A steel driller (diameter, 1 cm; length, 1.2 m) was used to measure the depth of soil and this was repeated at three locations within typical microhabitats. For each of these positions, the soil cover area was recorded. Furthermore, soil samples were collected by a cylindrical soil sampler at three points within each plot. Organic layer on top of the soil was removed before sampling. Soil samples were taken at three depths (0–10 cm, 10–20 cm, >20 cm) for each measurement location. There was very little soil below 20 cm, and the depth was uneven. Some places were only a little more than 20 cm, while some places tcould be 50 cm deep or more. Therefore, soil samples of the last level were collected at 20–40 cm depth for places deeper than 50 cm. Soil samples were air-dried and then sieved with a 2-mm sieve and homogenized for further chemical analysis. The bulk density in the soil cores (volume, 100 cm3) was measured from the three layers, with three replicates for four plots. Each soil core was carefully checked to determine whether it contained rock skeletons. If there were rock skeletons, they were then weighed and their volume was measured with a graduated cylinder. By completing this step, the influence of the rock skeletons was removed when calculating the bulk density. The stocks of soil (SS) (Mg/ha), where (1 Mg = 106 g), could be calculated as follows:
where parameters SAi, SDi, B, A are the soil area of the i microhabitat (m2), the average depth of the i soil microhabitat (m), the bulk density (g/cm3) and the plot area (m2), respectively. To calculate the nutrients’ reserves, the soil reserves were multiplied by the nutrient concentrations of each layer.
2.5. Chemical Analysis
The methods adopted for the chemical analysis were introduced in detail in our previous study [21,64]. Total C was determined using the oil-bath potassium dichromate titration method. Total N concentration was analyzed using the Kjeldahl method. The other nutrients (K, P, S, Ca and Mg) were determined by microwave digestion using the inductively coupled plasma optical emission spectrometer (Thermo 6300, Thermo Fisher Scientific, USA). Soil alkali-hydrolysable N (available N, or AN) was determined by titration with a dilute solution of H2SO4 after extraction with a mixture of ferrous sulfate and sodium hydroxide. Available phosphorus (AP) was determined by molybdate blue colorimetry after extraction with sodium bicarbonate. Available K (AK) was determined with ICP after extraction with ammonium acetate.
2.6. Statistical Analysis
The content of biomass elements and the content of soil elements were analyzed by t-test. ANOVA was used to compare the content of different levels of soil. All effects were considered significant at p < 0.05. Statistical analyses were performed using SPSS (v20.0, International Business Machines Corporation (IBM); New York, NY, USA).
3. Results
3.1. Biomass Nutrients Concentrations and Stocks
The results displayed in Figure 4 show that no significant difference was recorded in the mean content of all elements for aboveground biomass, trunk, leaf, grass, coarse woody debris (CWD) and litter between the two vegetation types (t-test, p > 0.05). Similarly, the leaf nutrient contents of the same species were not significantly different in the two vegetation types (Table 4). Despite a mean annual precipitation of 1390 mm in this site, the two stands had low total biomass measured (210.89 Mg/ha recorded for F and 70.53 Mg/ha recorded for FS) (Figure 5). In the F stand, the total recorded biomass stocks of C, N, K, Ca, P, S and Mg were 98.17, 1.19, 0.49, 1.99, 0.14, 0.17 and 0.18 Mg/ha, respectively, (Figure 4) while in the FS stand, the total recorded biomass stocks of C, N, K, Ca, P, S and Mg were 32.97, 0.40, 0.17, 0.61, 0.048, 0.059 and 0.064 Mg/ha, respectively (Figure 4). It is clear that the highest content collected in all the cases always refers to C, while the lowest quantities identified are specific to the nutrient P.
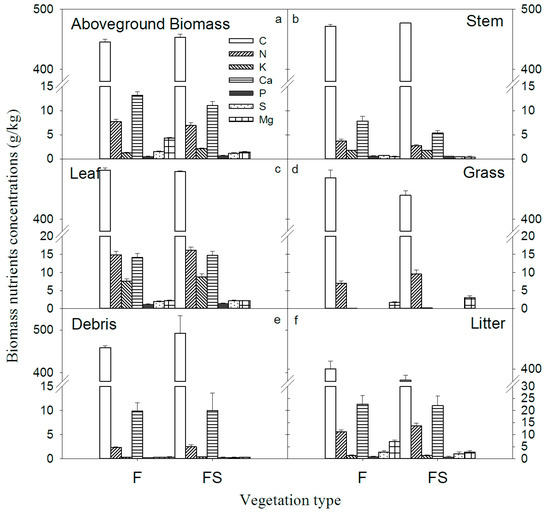
Figure 4.
Plant nutrient concentrations of two different vegetation types in southwest China.
Table 4.
Leaf nutrient concentrations of typical species in the karst study area, southwest China. F (abor forest); FS (shrub–arbor forest).
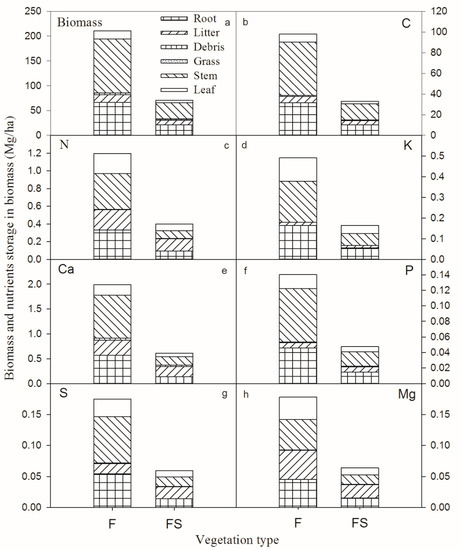
Figure 5.
Biomass and nutrient storage in the biomass of two different vegetation types in southwestern China.
Comparing the results displayed in Figure 5, it is possible to notice that if there was a plan to restore the vegetation from FS to F, the total biomass required should be higher. In more detail, the required amount of C, N, K, Ca, P, S and Mg should be 65.20, 0.79, 0.33, 1.38, 0.093, 0.12 and 0.11 Mg/ha, respectively (Figure 5).
3.2. Soil Total Nutrients Concentrations and Stocks
As shown in Figure 6, no significant difference was noticed in soil bulk density and the content of total soil elements between the two types (F and FS) except Total P (TP) in the top 20-cm layer (t-test, p < 0.05). Soil Organic Carbon (SOC) and Total N (TN) concentrations considerably reduced with the increase in soil depth (one-way ANOVA, p < 0.05). Ca nutrients were only significantly reduced in the F stand, and this behavior was not notice with the same magnitude for the FS stand. Overall, the other nutrients and the soil bulk density did not change significantly with an increasing soil depth.
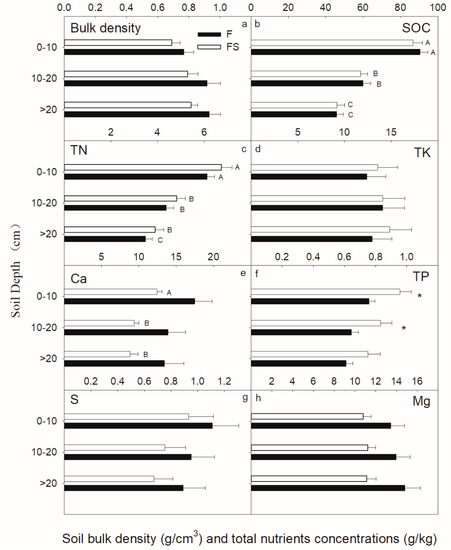
Figure 6.
Soil nutrient concentrations of two different vegetation types in southwestern China.
Figure 6 also confirms that most of the corresponding nutrients were stored at 0–10 cm of depth. The soil content in the FS stand was only 47.78% of the F. Moreover, the soil volume and nutrient content of the soil layer below 10 cm was extremely small. In the F stand, total soil mass, SOC, N, K, Ca, P, S and Mg stocks were 618.86, 56.31, 3.68, 6.55, 15.52, 0.53, 1.39 and 12.41 Mg/ha, respectively (Figure 7). In the FS stand, total soil mass, SOC, N, K, Ca, P, S and Mg stocks were 295.69, 24.18, 1.85, 2.90, 4.20, 0.26, 0.56 and 3.35 Mg/ha, respectively (Figure 7). The nutrient demand associated with the restoration of vegetation (R) was lower than the total amount of elements in the FS.
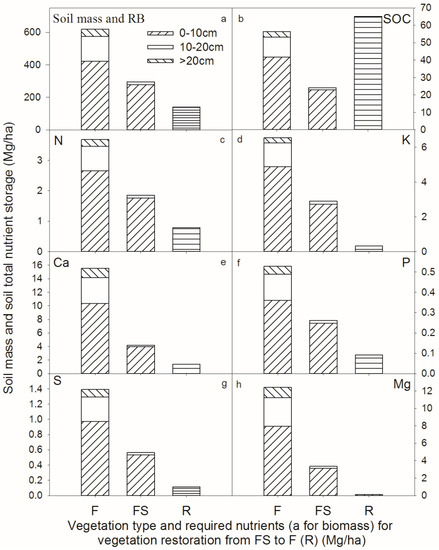
Figure 7.
Soil mass and nutrient storage required for the restoration of the vegetation from FS to F.
3.3. Soil Plant-Available Nutrients Concentrations and Stocks
F and FS soil plant-available N, K and P concentrations showed no significant difference (t-test, p > 0.05). Soil plant-available nutrient content was very low, only between 0.26%–2.55% of the total element content. In the F stand, soil AN, AK, and AP stocks were 0.20, 0.094 and 0.0014 Mg/ha, respectively (Figure 8). In the FS stand, soil AN, AK, and AP stocks were 0.12, 0.048 and 0.00073 Mg/ha, respectively (Figure 8). They were far below the nutrient requirements for vegetation restoration.
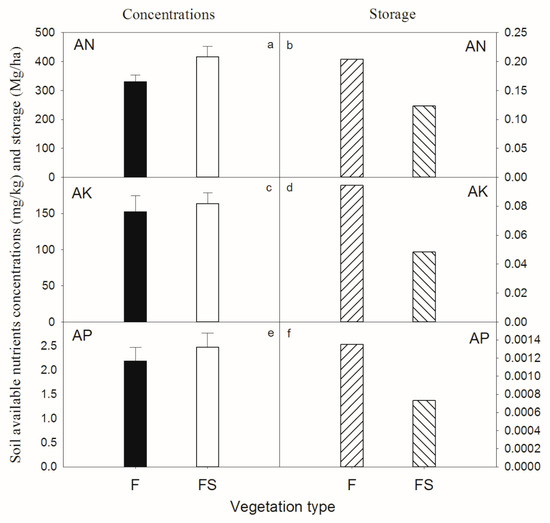
Figure 8.
Soil plant-available nutrient concentrations and stocks of two different vegetation types in southwestern China.
4. Discussion and Implications of the Restoration of Vegetation in Karst Areas
Since calcareous soil is based on carbonate rock development, the soil is fertile and rich in organic matter. In this study, soil SOC concentrations of the two vegetation types were very high, twice as much as other non-karst soils in this region [21]; therefore, the soil total nutrient content recorded was high. In addition, the soil total nutrients content was higher than that of other non-karst forests in southwest China (0.87–1.86 g/kg) [51]. However, unlike the values recorded for the soil nutrient content, the soil available nutrient content was low, especially if we consider the soil AP content, which was clearly lower than most of the other forest soils present in the literature [66]. Due to very slow rates of soil formation and the intense magnitude of soil erosion in karst areas, very little soil values were found in both F (618.86 Mg/ha) and FS (295.69 Mg/ha). Therefore, reserves of soil nutrients under the two vegetation types were considered low, especially plant available nutrients. Probably due to the soil erosion caused by the vegetation damage, soil reserve in the FS stand was less than half of the value found in F.
In this study, the F stand was considered as the next stage of the succession or restoration of the FS stand. The differences between the two stages FS and F in terms of biomass and nutrient reserves were defined as the biomass and nutrient content required for vegetation restoration. The biomass in this study included all plant organisms, including plant live parts and other plant residues, including CWD and litter. FS biomass and its nutrient reserves were only 1/3 of F. Therefore, to achieve vegetation restoration, a large amount of biomass and elements would be required. However, reserves of soil total nutrients in FS stand were all higher than the amounts of nutrients required for vegetation restoration. This indicated that the total elemental reserves in the soil of the FS stand could then aid the recovery of vegetation. In more detail, the N and P element requirements were close to half of the TN and TP reserves, and the K requirement was 1/8 of the soil TK in the FS stand. Another outcome of the field campaign and the analysis of the dataset refers to the fact that most of the total element reserves in the soil were difficult to be absorbed by plants. As a matter of fact, the reserves of soil AN, AP and AK in the FS stand were only 7.2%, 0.3% and 1.7% of the TN, total TP and TK reserves, respectively; therefore, they were much lower than the nutrient requirements for the transition from FS to F. Although the form of soil elements was constantly changing, the total amount of elements available to plants was very low relative to the total reserves of the soil elements. In conclusion, the reserves of elements that could be utilized by the plants in FS were insufficient to maintain the development of vegetation to F.
It is also fundamental to highlight that the shrub arbor forest (FS) was the vegetation generated due to deforestation processes within the study area while the arbor forest (F) was a natural forest characterized by a relatively little damage induced by deforestation processes. The F and FS plots studied in this work were chosen very close together; hence, they are characterized by the same lithology and climate conditions. However, there were certain minor differences within both environments (e.g., slope angles), and, in mountainous areas, the total nutrient reserves (potentially available for vegetation) do not have to be equal to the amount of soil nutrients. On the slope, some of the resources can be transported through mid-slope waters flowing down from higher areas; additionally, there is deposition with precipitation and the amount of ingredients released as a result of weathering from the rocks. This aspect was not considered in this study because the main focus was the analysis of soil samples at specific locations.
In the Karst area of southwest China, soil water stress due to shallow soil had been considered as a limiting factor for plant growth [22]. However, due to its location in subtropical and tropical regions, where rainfall is abundant, water stress for plant growth is often temporary [22]. In addition, caves and fissures can store water for plant use and these can alleviate the pressure of water stress in Karst areas. However, except the fact that nitrogen can be fixed by organisms via nitrogen deposition, the total reserves of most nutrients in soil and plant banks were almost constant. The destruction of vegetation, especially felling, had resulted in a significant reduction in biomass and a serious loss of nutrients. Moreover, according to the statistical fact that this region receives almost 1400 mm of annual precipitation, most of this water content is concentrated during the growing season. Hence, nutrient leaching is an additional issue because, due to the high porosity of the underlying carbonate rock characteristic of these karst areas, the low soil formation rate and high permeability of carbonate rocks create a fragile and vulnerable environment that is susceptible to continuous soil erosion. Soil loss, both from surface soil loss and subsurface soil leakage, in the karst regions of southwestern China is then a serious environmental problem that threatens sustainability. Vegetation restoration requires the transfer of nutrients from the soil bank to the plant bank. Then, with the restoration of vegetation, the nutrient reserves in the soil would start to lack or be limited, while, at the same time, the nutrient restrictions would become stronger. This phenomenon could consequently make the possibility to achieve a full restoration of the vegetation more difficult.
Based on the results obtained in this study, to deliver promising and valuable plans for vegetation restoration in the karst area of southwest China, authorities not only need to pay attention to water restrictions due to the environmental conditions but also need to focus on the restricted availability of nutrient available. This study confirms that there is a link between available nutrients and vegetation biomass and this justifies the fact that, to achieve a full restoration of the area, there is a strong need to achieve the required soil nutrients. Local and national authorities will also have to consider the fact that due to the nature of the soil in these areas, mainly characterized by carbonate bedrock, the soil formation would be extremely slow [67] and there could also be a very limited support of nutrients from the surrounding environment [20]. Therefore, strengthening protection to prevent vegetation from damaging, reducing soil erosion and nutrient loss and at the same time adding exogenous elements to promote vegetation restoration are good ways to restore degraded ecosystems in karst areas in southwest China.
5. Conclusions
This study was conducted to quantify the nutrient reserves and their allocation in karst ecosystems in southwestern China to determine whether nutrient deficiencies caused by the very low amount of soil are the restrictive factors for the restoration of vegetation in karst areas recently affected by climate change and negative impacts induced by human activities. This study focused on two different types of vegetation, arbor forest (F) and shrub–arbor forest transition (FS), and the parameters required were collected in the study area located in Puding County, Guizhou province, southwestern China. In more detail, values of the biomass, soil volume and soil nutrient reserves (carbon (C), nitrogen (N), potassium (K), calcium (Ca), phosphorus (P), sulfur (S) and magnesium (Mg)) were gathered between January 2009 and June 2010. All these parameters were essential to calculate the nutrient requirements for the restoration of vegetation typical for the passage from shrub–arbor forest to arbor forest.
The key results obtained by this study can be summarized as follows:
- The total element (SOC, N, K, Ca, P, S and Mg) concentrations were relatively high in the study karst area in southwest China. However, the total amounts of soil nutrients stored were very low due to the very small amount of soil as a consequence to deforestation processes;
- Vegetation recovery from FS to F requires large amounts of nutrients. The total soil elements measured in FS stands could meet the nutrient weight needed for vegetation restoration. However, the total amounts of plant available nutrients were not reaching the targets indicated for restoration, especially AP.
This study highlighted how complex the process of vegetation restoration is and how its success is related to the optimization of multiple natural requirements, such as the nutrients in the soil as well as the nutrients in the plants. Local and national authorities should then consider the spatio-temporal variability of these nutrients during the implementation of restoration programs. Hence, this study aids decision making for the effective and sustainable management of large-scale restoration programs, which should also identify financial incentives, education, and the professional training of farmers, that are all key elements to implement the suggested restoration action.
Supplementary Materials
The following are available online at https://www.mdpi.com/1999-4907/11/8/797/s1.
Author Contributions
Conceptualization, Y.L., K.G. and M.C.; methodology, Y.L., C.L.; software, Y.L.; formal analysis, Y.L. and M.R.; investigation, Y.L., C.L. and M.R.; resources, Y.L.; data curation, Y.L., M.R.; writing—original draft preparation, Y.L., M.R., J.Z.; writing—review and editing, Y.L., J.Z. and M.R.; visualization, Y.L.; project administration, M.C.; funding acquisition, Y.L., K.G. and K.M. All authors have read and agreed to the published version of the manuscript.
Funding
This study was supported by the National Key Research and Development Program of China (2016YFC0502504) and by the National Natural Science Foundation of China (31860045, 31870707).
Acknowledgments
Authors want to thank Jun Yang, Shichun Fu, Shijie Xiao for their help associated with fieldwork.
Conflicts of Interest
The authors declare no conflict of interest.
References
- Wang, L.; Wang, P.; Sheng, M.; Tian, J. Ecological stoichiometry and environmental influencing factors of soil nutrients in the karst rocky desertification ecosystem, southwest China. Glob. Ecol. Conserv. 2018, 16, e00449. [Google Scholar] [CrossRef]
- Sheng, M.; Xiong, K.; Cui, G.; Liu, Y. Plant diversity and soil physical-chemical properties in karst rocky desertification ecosystem of Guizhou, China. Acta Ecol. Sin. 2015, 35, 434–448, (In Chinese with English abstract). [Google Scholar] [CrossRef]
- Jiang, Z.; Lian, Y.; Qin, X. Rocky desertification in Southwest China Impacts, causes, and restoration. Earth-Sci. Rev. 2014, 132, 1–12. [Google Scholar] [CrossRef]
- Wang, S.J.; Liu, Q.M.; Zhang, D.F. Karst rocky desertification in southwestern China: Geomorphology, landuse, impact and rehabilitation. Land Degrad. Dev. 2004, 15, 115–121. [Google Scholar] [CrossRef]
- Jones, W.K.; White, W.B. Chapter 72—Karst. In Encyclopedia of Caves, 3rd ed.; Academic Press: London, UK, 2019; pp. 609–618. [Google Scholar] [CrossRef]
- Dai, Q.; Peng, X.; Yang, Z.; Zhao, L. Runoff and erosion processes on bare slopes in the Karst Rocky Desertification Area. Catena 2017, 152, 218–226. [Google Scholar] [CrossRef]
- Zhou, L.; Wang, X.; Wang, Z.; Zhang, X.; Chen, C.; Liu, H. The challenge of soil loss control and vegetation restoration in the karst area of southwestern China. Int. Soil Water Conserv. Res. 2020, 8, 26–34. [Google Scholar] [CrossRef]
- Brandt, M.; Yue, Y.; Wigneron, J.P.; Tong, X.; Tian, F.; Jepsen, M.R.; Xiao, X.; Verger, A.; Mialon, A.; Al-Yaari, A.; et al. Satellite-observed major greening and biomass increase in south china karst during recent decade. Earth’s Future 2018, 6, 1017–1028. [Google Scholar] [CrossRef]
- Gao, J.; Wang, H. Temporal analysis on quantitative attribution of karst soil erosion: A case study of a peak-cluster depression basin in southwest China. Catena 2019, 172, 369–377. [Google Scholar] [CrossRef]
- Li, P.; Mu, X.; Holden, J.; Wu, Y.; Irvine, B.; Wang, F.; Gao, P.; Zhao, G.; Sun, W. Comparison of soil erosion models used to study the Chinese Loess Plateau. Earth Sci. Rev. 2017, 170, 17–30. [Google Scholar] [CrossRef]
- Zhao, L.; Hou, R. Human causes of soil loss in rural karst environments: A case study of Guizhou, China. Sci. Rep. 2019, 9, 3225. [Google Scholar] [CrossRef]
- Li, Y.; Bai, X.; Zhou, Y.; Qin, L.; Tian, X.; Tian, Y. Spatial-temporal evolution of soil erosion in a typical mountainous karst basin in SW China, based on GIS and RUSLE. Arab. J. Sci. Eng. 2015, 41, 209–221. [Google Scholar] [CrossRef]
- Teng, H.-F.; Hu, J.; Zhou, Y.; Zhou, L.-Q.; Shi, Z. Modelling and mapping soil erosion potential in China. J. Integr. Agric. 2019, 18, 251–264. [Google Scholar] [CrossRef]
- Phinzi, K.; Ngetar, N.S. The assessment of water-borne erosion at catchment level using GIS-based RUSLE and remote sensing: A review. Int. Soil Water Conserv. Res. 2019, 7, 27–46. [Google Scholar] [CrossRef]
- Guo, K.; Liu, C.C.; Dong, M. Ecological adaptation of plants and control of rocky-desertification on karst region of Southwest China. Chin. J. Plant Ecolology 2011, 35, 991–999. [Google Scholar] [CrossRef]
- Brinkmann, R.; Parise, M. Karst environments: Problems, management, human impacts, and sustainability: An introduction to the special issue. J. Cave Karst Stud. 2012, 74, 135–136. [Google Scholar] [CrossRef]
- Peng, T.; Wang, S.-J. Effects of land use, land cover and rainfall regimes on the surface runoff and soil loss on karst slopes in southwest China. Catena 2012, 90, 53–62. [Google Scholar] [CrossRef]
- Wang, K.L.; Zhang, C.H. Vulnerable characteristics of ecosystem, environmental problems and comprehensive strategies for ecological construction in the karst mountainous region of west Hunan. J. Montain Res. 1999, 17, 30–35. [Google Scholar]
- Zhang, X.B.; Liu, X.M.; Bai, X.Y. Application of a 137Cs fingerprinting technique for interpreting responses of sediment deposition of a karst depression to deforestation in the Guizhou Plateau, China. Sci. China Earth Sci. 2011, 54, 431–437. [Google Scholar] [CrossRef]
- Zhang, X.B.; Wang, K.L. Ponderation on the shortage of mineral nutrients in the soil-vegetation ecosystem in carbonate rock-distributed mountain regions in southwest China. Earth Environ. 2009, 37, 337–341, (In Chinese with English abstract). [Google Scholar]
- Liu, Y.G.; Liu, C.C.; Wang, S.J.; Guo, K.; Yang, J.; Zhang, X.S.; Li, G.Q. Organic carbon storage in four ecosystem types in the karst region of southwestern China. PLoS ONE 2013, 8, e56443. [Google Scholar] [CrossRef]
- Liu, C.C.; Liu, Y.G.; Guo, K.; Fan, D.Y.; Li, G.W.; Zheng, Y.R.; Yu, L.F.; Yang, R. Effect of drought on pigments, osmotic adjustment and antioxidant enzymes in six woody plant species in karst habitats of southwestern China. Environ. Exp. Bot. 2011, 71, 174–183. [Google Scholar] [CrossRef]
- Agren, G.I. Stoichiometry and nutrition of plant growth in natural communities. Annu. Rev. Ecol. Evol. Syst. 2008, 39, 153–170. [Google Scholar] [CrossRef]
- Song, M.; Peng, W.; Du, H.; Xu, Q. Responses of Soil and Microbial C:N:P Stoichiometry to Vegetation Succession in a Karst Region of Southwest China. Forests 2019, 10, 755. [Google Scholar] [CrossRef]
- Liu, L.; Zeng, F.; Song, T.; Wang, K. Stand structure and abiotic factors modulate karst forest biomass in Southwest China. Forests 2020, 11, 443. [Google Scholar] [CrossRef]
- Zhang, H.; Wang, K.; Zeng, Z.; Du, H.; Zeng, F. Biomass and Carbon Sequestration by Juglans regia Plantations in the Karst Regions of Southwest China. Forests 2017, 8, 103. [Google Scholar] [CrossRef]
- Medina, E.; Cuevas, E.; Lugo, A.E. Substrate Chemistry and Rainfall Regime Regulate Elemental Composition of Tree Leaves in Karst Forests. Forests 2017, 8, 182. [Google Scholar] [CrossRef]
- Yates, C.J.; Norton, D.A.; Hobbs, R.J. Grazing effects on plant cover, soil and microclimate in fragmented south-western Australia: Implications for restoration. Austral Ecol. 2000, 25, 36–47. [Google Scholar] [CrossRef]
- Pan, F.; Liang, Y.; Wang, K.; Zhang, W. Responses of Fine Root Functional Traits to Soil Nutrient Limitations in a Karst Ecosystem of Southwest China. Forests 2018, 9, 743. [Google Scholar] [CrossRef]
- Pang, D.; Wang, G.; Li, G.; Sun, Y.; Liu, Y.; Zhou, J. Ecological Stoichiometric Characteristics of Two Typical Plantations in the Karst Ecosystem of Southwestern China. Forests 2018, 9, 56. [Google Scholar] [CrossRef]
- Luo, J.; Zhou, X.; Rubinato, M.; Li, G.; Tian, Y.; Zhou, J. Impact of multiple vegetation covers on surface runoff and sediment yield in the small basin of Nverzhai, Hunan Province, China. Forests 2020, 11, 329. [Google Scholar] [CrossRef]
- Knust, C.; Schua, K.; Feger, K.H. Estimation of Nutrient Exports Resulting from Thinning and Intensive Biomass Extraction in Medium-Aged Spruce and Pine Stands in Saxony, Northeast Germany. Forests 2016, 7, 302. [Google Scholar] [CrossRef]
- Gonzales de Andres, E. Interactions between Climate and Nutrient Cycles on Forest Response to Global Change: The Role of Mixed Forests. Forests 2019, 10, 609. [Google Scholar] [CrossRef]
- Jiang, D.; Geng, Q.; Li, Q.; Luo, Y.; Vogel, J.; Shi, Z.; Ruan, H.; Xu, X. Nitrogen and Phosphorus Resorption in Planted Forests Worldwide. Forests 2019, 10, 201. [Google Scholar] [CrossRef]
- Koerselman, W.; Meuleman, A.F.M. The vegetation N:P ratio: A new tool to detect the nature of nutrient limitation. J. Appl. Ecol. 1996, 33, 1441–1450. [Google Scholar] [CrossRef]
- Zou, Z.; Zeng, F.; Wang, K.; Zeng, Z.; Tang, H.; Zhang, H. Evaluation and Tradeoff Analysis of Ecosystem Service for Typical Land-Use Patterns in the Karst Region of Southwest China. Forests 2020, 11, 451. [Google Scholar] [CrossRef]
- Vitousek, P.M.; Howarth, R.W. Nitrogen limitation on land and in the sea: How can it occur? Biogeochemistry 1991, 13, 87–115. [Google Scholar] [CrossRef]
- Vitousek, P.M.; Porder, S.; Houlton, B.Z.; Chadwick, O.A. Terrestrial phosphorus limitation: Mechanisms, implications, and nitrogen-phosphorus interactions. Ecol. Appl. 2010, 20, 5–15. [Google Scholar] [CrossRef]
- Niinemets, U.; Kull, K. Co-limitation of plant primary productivity by nitrogen and phosphorus in a species-rich wooded meadow on calcareous soils. Acta Oecologica 2005, 28, 345–356. [Google Scholar] [CrossRef]
- Wilson, J.B.; Sykes, M.T.; Peet, R.K. Time and space in the community structure of a species-rich grassland. J. Veg. Sci. 1995, 6, 729–740. [Google Scholar] [CrossRef]
- Niklas, K.J. Plant allometry, leaf nitrogen and phosphorus stoichiometry, and interspecific trends in annual growth rates. Ann. Bot. 2006, 97, 155–163. [Google Scholar] [CrossRef]
- Korner, S.C. Interactive effects of elevated CO2, P availability and legume presence on calcareous grassland: Results of a glasshouse experiment. Funct. Ecol. 1999, 13, 200–209. [Google Scholar] [CrossRef]
- Morecroft, M.D.; Sellers, E.K.; Lee, J.A. An experimental investigation into the effects of atmospheric nitrogen deposition on two semi-natural grasslands. J. Ecol. 1994, 82, 475–483. [Google Scholar] [CrossRef]
- Köhler, B.; Ryser, P.; Güsewell, S.; Gigon, A. Nutrient availability and limitation in traditionally mown and in abandoned limestone grasslands: A bioassay experiment. Plant Soil 2001, 230, 323–332. [Google Scholar] [CrossRef]
- Storm, C.; Suss, K. Are low-productive plant communities responsive to nutrient addition? Evidence from sand pioneer grassland. J. Veg. Sci. 2008, 19, 343–354. [Google Scholar] [CrossRef]
- Du, Y.; Pan, G.; Li, L.; Hu, Z.; Wang, X. Leaf N/P ratio and nutrient reuse between dominant species and stands: Predicting phosphorus deficiencies in Karst ecosystems, southwestern China. Environ. Earth Sci. 2011, 64, 299–309. [Google Scholar] [CrossRef]
- Liu, C.C.; Liu, Y.G.; Guo, K.; Wang, S.J.; Yang, Y. Concentrations and resorption patterns of 13 nutrients in different plant functional types in the karst region of south-western China. Ann. Bot. 2014, 113, 873e885m. [Google Scholar] [CrossRef]
- Güsewell, S. N:P ratios in terrestrial plants: Variation and functional significance. New Phytol. 2004, 164, 243–266. [Google Scholar] [CrossRef]
- Regina, S.; Rico, M.; Rapp, M.; Gallego, H.A. Seasonal variation in nutrient concentration in leaves and branches of Quercus pyrenaica. J. Veg. Sci. 1997, 8, 651–654. [Google Scholar] [CrossRef]
- Kandylis, K.; Hadjigeorgiou, I.; Harizanis, P. The nutritive value of mulberry leaves (Morus alba) as a feed supplement for sheep. Trop. Anim. Health Prod. 2009, 41, 17–24. [Google Scholar] [CrossRef]
- Zhang, W.; Zhao, J.; Pan, F.; Li, D.; Chen, H.; Wang, K. Changes in nitrogen and phosphorus limitation during secondary succession in a karst region in southwest China. Plant Soil 2015, 391, 77–91. [Google Scholar] [CrossRef]
- Okada, K.-I.; Aiba, S.-I.; Kitayama, K. Influence of temperature and soil nitrogen and phosphorus availabilities on fine-root productivity in tropical rainforests on Mount Kinabalu. Ecol. Res. 2017, 32, 145–156. [Google Scholar] [CrossRef]
- Ren, C.; Chen, J.; Deng, J.; Zhao, F.; Han, X.; Yang, G.; Tong, X.; Feng, Y.; Shelton, S.; Ren, G. Response of microbial diversity to C:N:P stoichiometry in fine root and microbial biomass following afforestation. Biol. Fertity Soils 2017, 53, 457–468. [Google Scholar] [CrossRef]
- Rosecrance, R.C.; Weinbaum, S.A.; Brown, P.H. Assessment of nitrogen, phosphorus, and potassium uptake capacity and root growth in mature alternate-bearing pistachio (Pistacia vera) trees. Tree Physiol. 1996, 16, 949–956. [Google Scholar] [CrossRef] [PubMed]
- Goloran, J.B.; Phillips, I.R.; Chen, C. Forms of nitrogen alter plant phosphorus uptake and pathways in rehabilitated highly alkaline bauxite processing residue sand. Land Degrad. Dev. 2016, 28, 628–637. [Google Scholar] [CrossRef]
- Silva, J.G.; França, M.G.C.; Gomide, F.T.F.; Magalhaes, J.R. Different nitrogen sources affect biomass partitioning and quality of potato production in a hydroponic system. Am. J. Potato Res. 2013, 90, 179–185. [Google Scholar] [CrossRef]
- Chen, Z.-H.; Zha, T.; Jia, X.; Wu, Y.; Wu, B.; Zhang, Y.; Guoa, J.B.; Qin, S.G.; Chen, G.; Peltola, H. Leaf nitrogen is closely coupled to phenophases in a desert shrub ecosystem in China. J. Arid. Environ. 2015, 122, 124–131. [Google Scholar] [CrossRef]
- Khan, A.; Lu, G.; Ayaz, M.; Zhang, H.; Wang, R.; Lv, F.; Yang, X.; Sun, B.; Zhang, S. Phosphorus efficiency, soil phosphorus dynamics and critical phosphorus level under long-term fertilization for single and double cropping systems. Agriculure Ecosyst. Environ. 2018, 256, 1–11. [Google Scholar] [CrossRef]
- Sun, X.; Shen, Y.; Schuster, M.J.; Searle, E.B.; Chen, J.; Yang, G.; Zhang, Y.G. Initial responses of grass litter tissue chemistry and N:P stoichiometry to varied N and P input rates and ratios in inner mongolia. Agriculure Ecosyst. Environ. 2018, 252, 114–125. [Google Scholar] [CrossRef]
- Rubinato, M.; Nichols, A.; Peng, Y.; Zhang, J.; Lashford, C.; Cai, Y.; Lin, P.; Tait, S. Urban and river flooding: Comparison of flood risk management approaches in the UK and China and an assessment of future knowledge needs. Water Sci. Eng. 2019, 12, 274–283. [Google Scholar] [CrossRef]
- Rubinato, M.; Luo, M.; Zheng, X.; Shao, S. Advances in modelling and prediction on the impact of human activities and extreme events on environments. Water 2020, 12, 1768. [Google Scholar] [CrossRef]
- Teng, M.; Huang, C.; Wang, P.; Liziong, Z.; Zhou, Z.; Xiao, W.; Huang, Z.; Liu, C. Impacts of forest restoration on soil erosion in the Three Gorges Reservoir area, China. Sci. Total. Environ. 2019, 697, 134164. [Google Scholar] [CrossRef] [PubMed]
- Blanco-Canqui, H.; Lal, R. Soil Erosion Under Forests. In Principles of Soil Conservation and Management; Springer: Dordrecht, The Netherlands, 2010. [Google Scholar] [CrossRef]
- Liu, C.C.; Wei, Y.F.; Liu, Y.G.; Guo, K. Biomass of canopy and shurb layers of karst forests in Puding, Guizhou, China. Chin. J. Plant Ecol. 2009, 33, 698–705. [Google Scholar]
- Luo, D.H.; Xia, J.; Yuan, J.W.; Zhang, Z.H.; Zhu, J.D. Root biomass of karst vegetation in a mountainous area of Southwestern China. Chin. J. Plant Ecol. 2010, 34, 611–618. [Google Scholar]
- Chen, L.Z.; Huang, J.H.; Yan, C.R. Nutrient Cycling in Forestecosystem in China; China Meteorological Press: Beijing, China, 1997. [Google Scholar]
- Wei, Q.F. Soil erosion in karst region of South China and its control. Int. Soil Water Conserv. Res. 1996, 3, 72–76. [Google Scholar]
© 2020 by the authors. Licensee MDPI, Basel, Switzerland. This article is an open access article distributed under the terms and conditions of the Creative Commons Attribution (CC BY) license (http://creativecommons.org/licenses/by/4.0/).