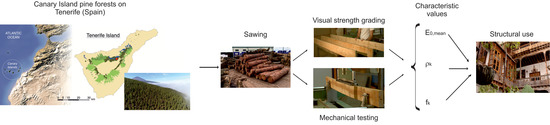
Characterisation of Pinus canariensis C.Sm. ex DC. Sawn Timber from Reforested Trees on the Island of Tenerife, Spain

 ,
,  ,
,  ,
,  ,
, 
Abstract
1. Introduction
2. Materials and Methods
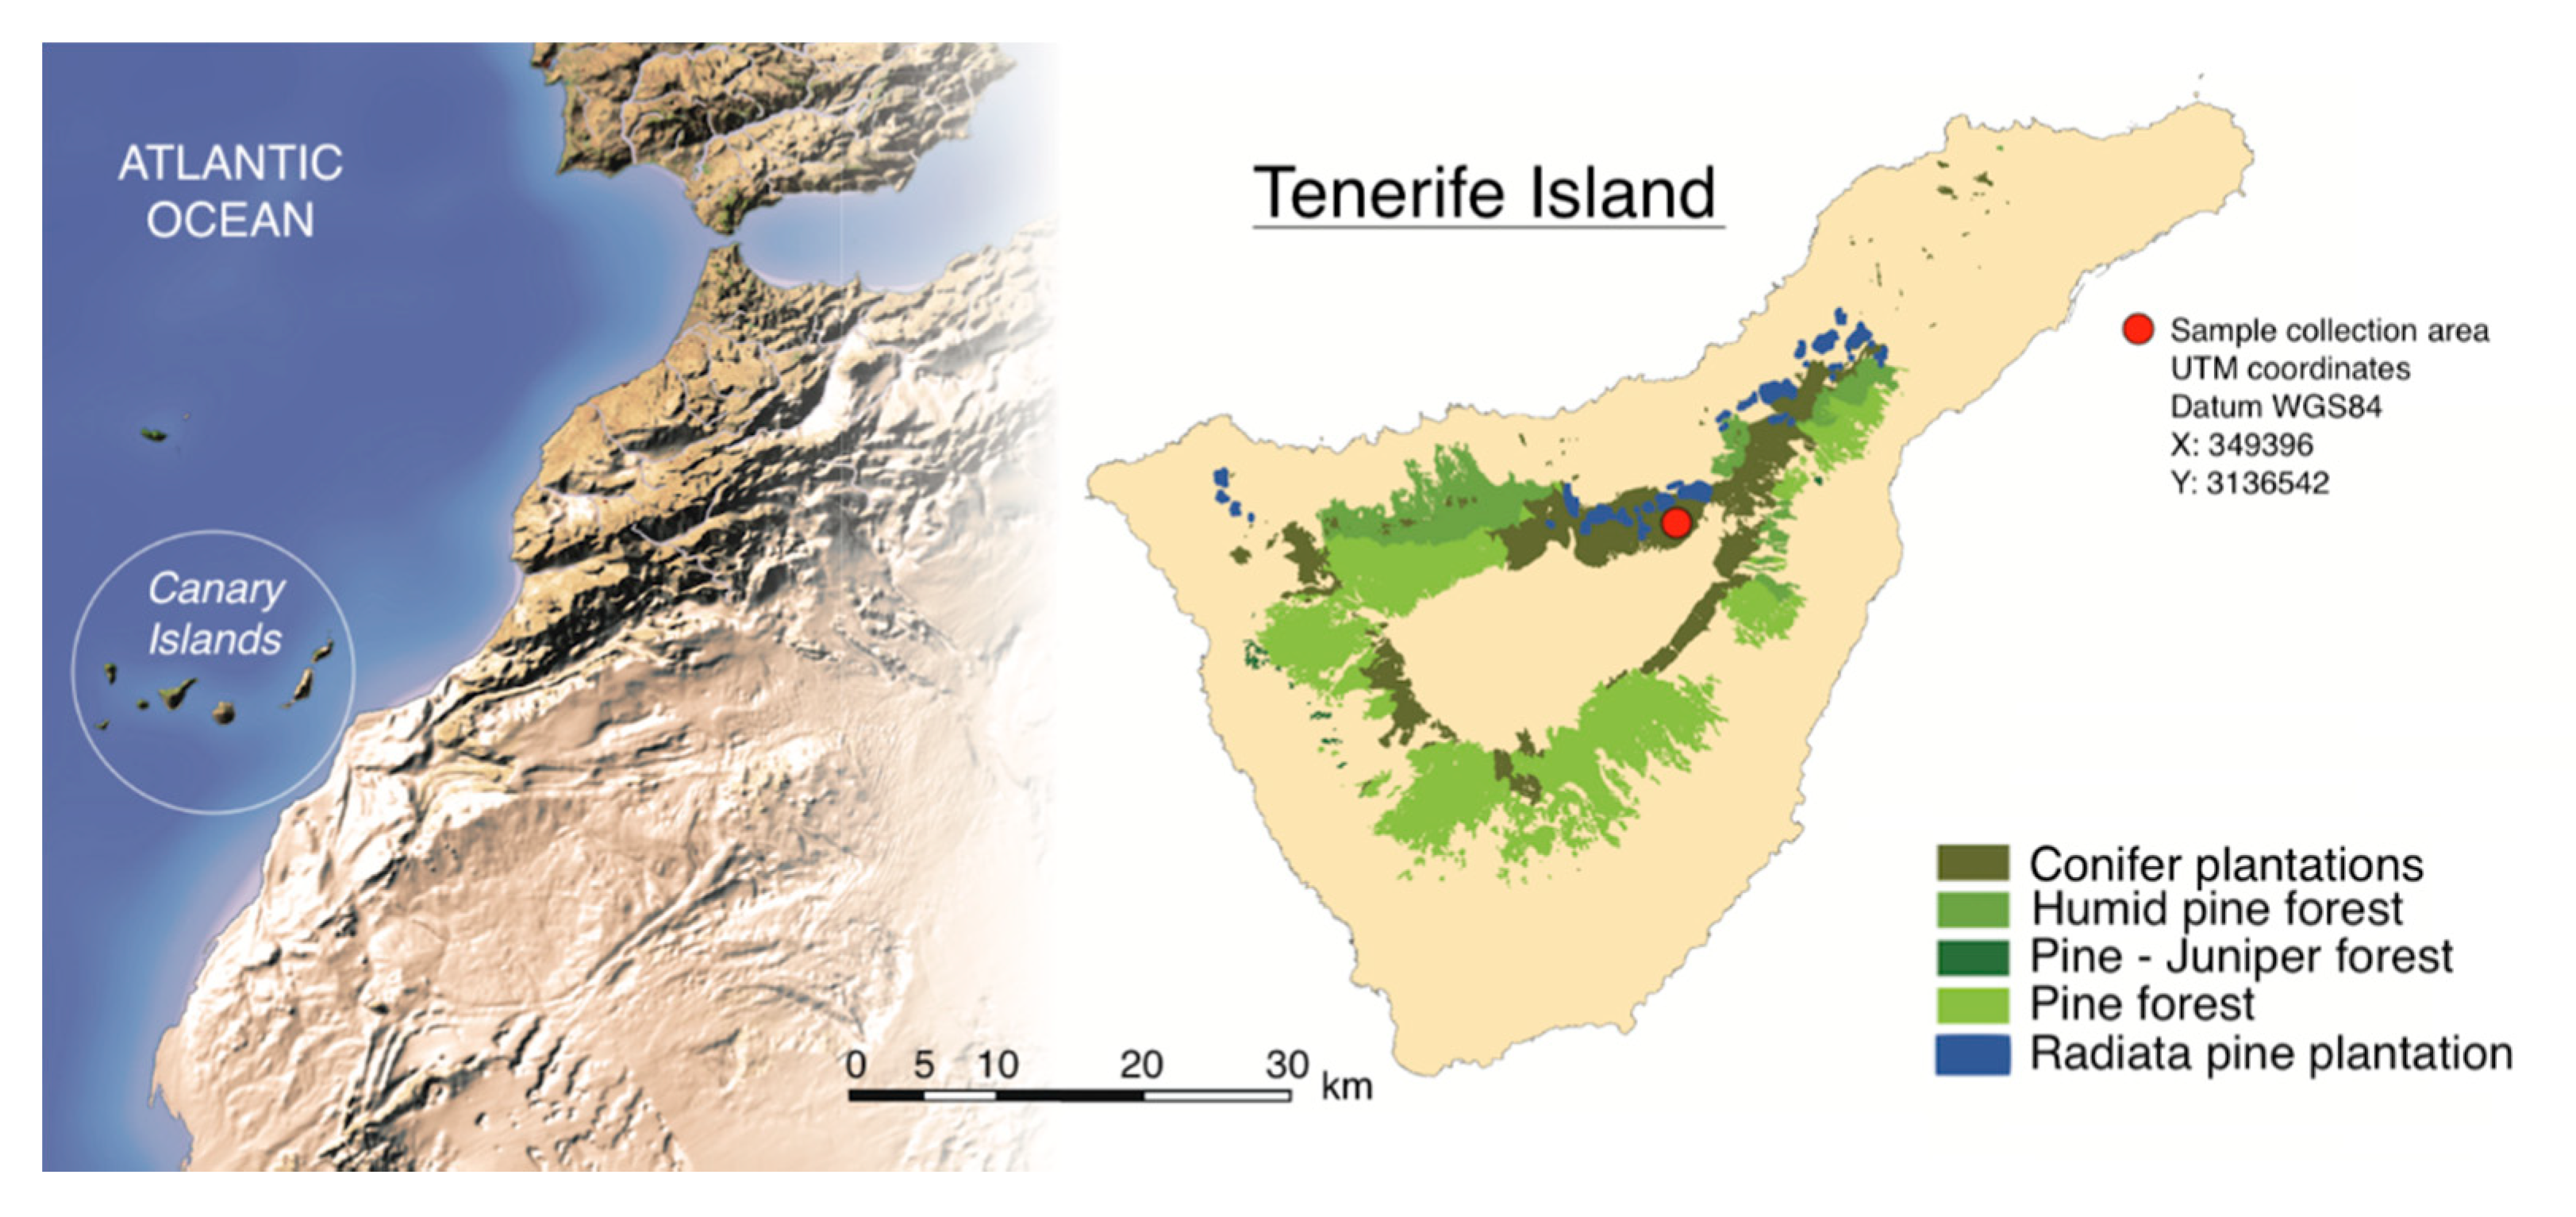
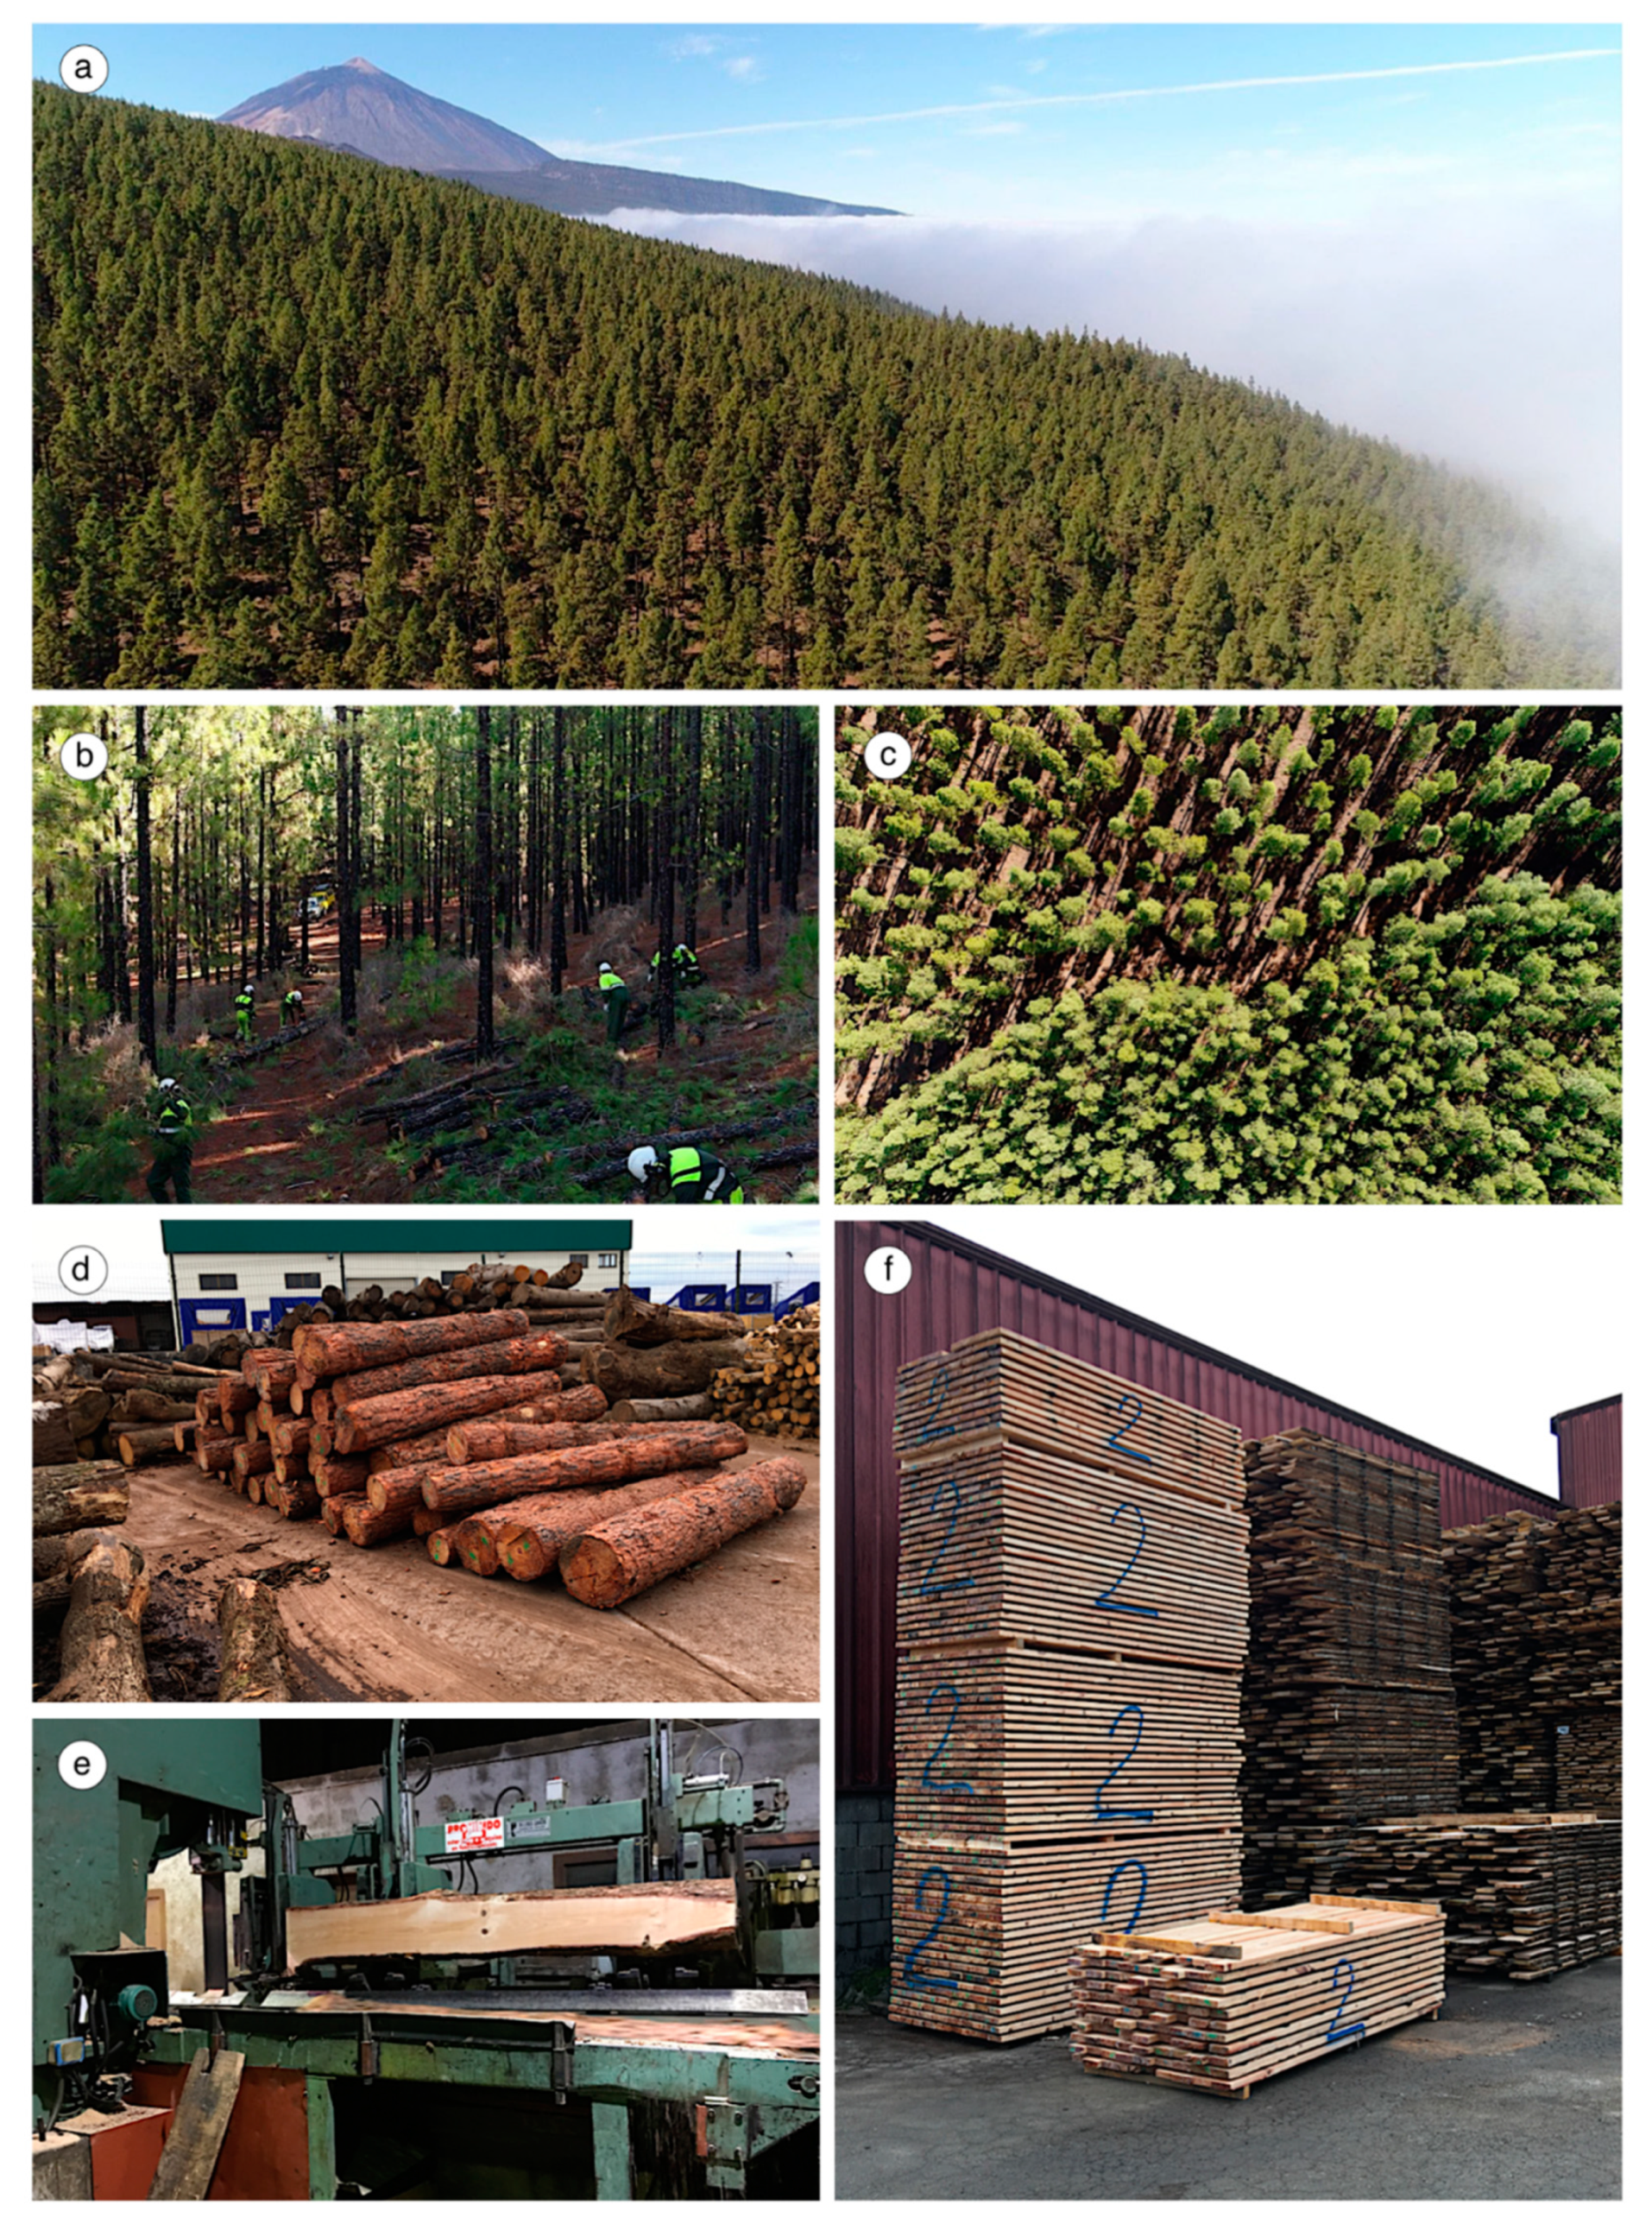
2.1. Sample Collection and Preparation
2.2. Visual Strength Grading
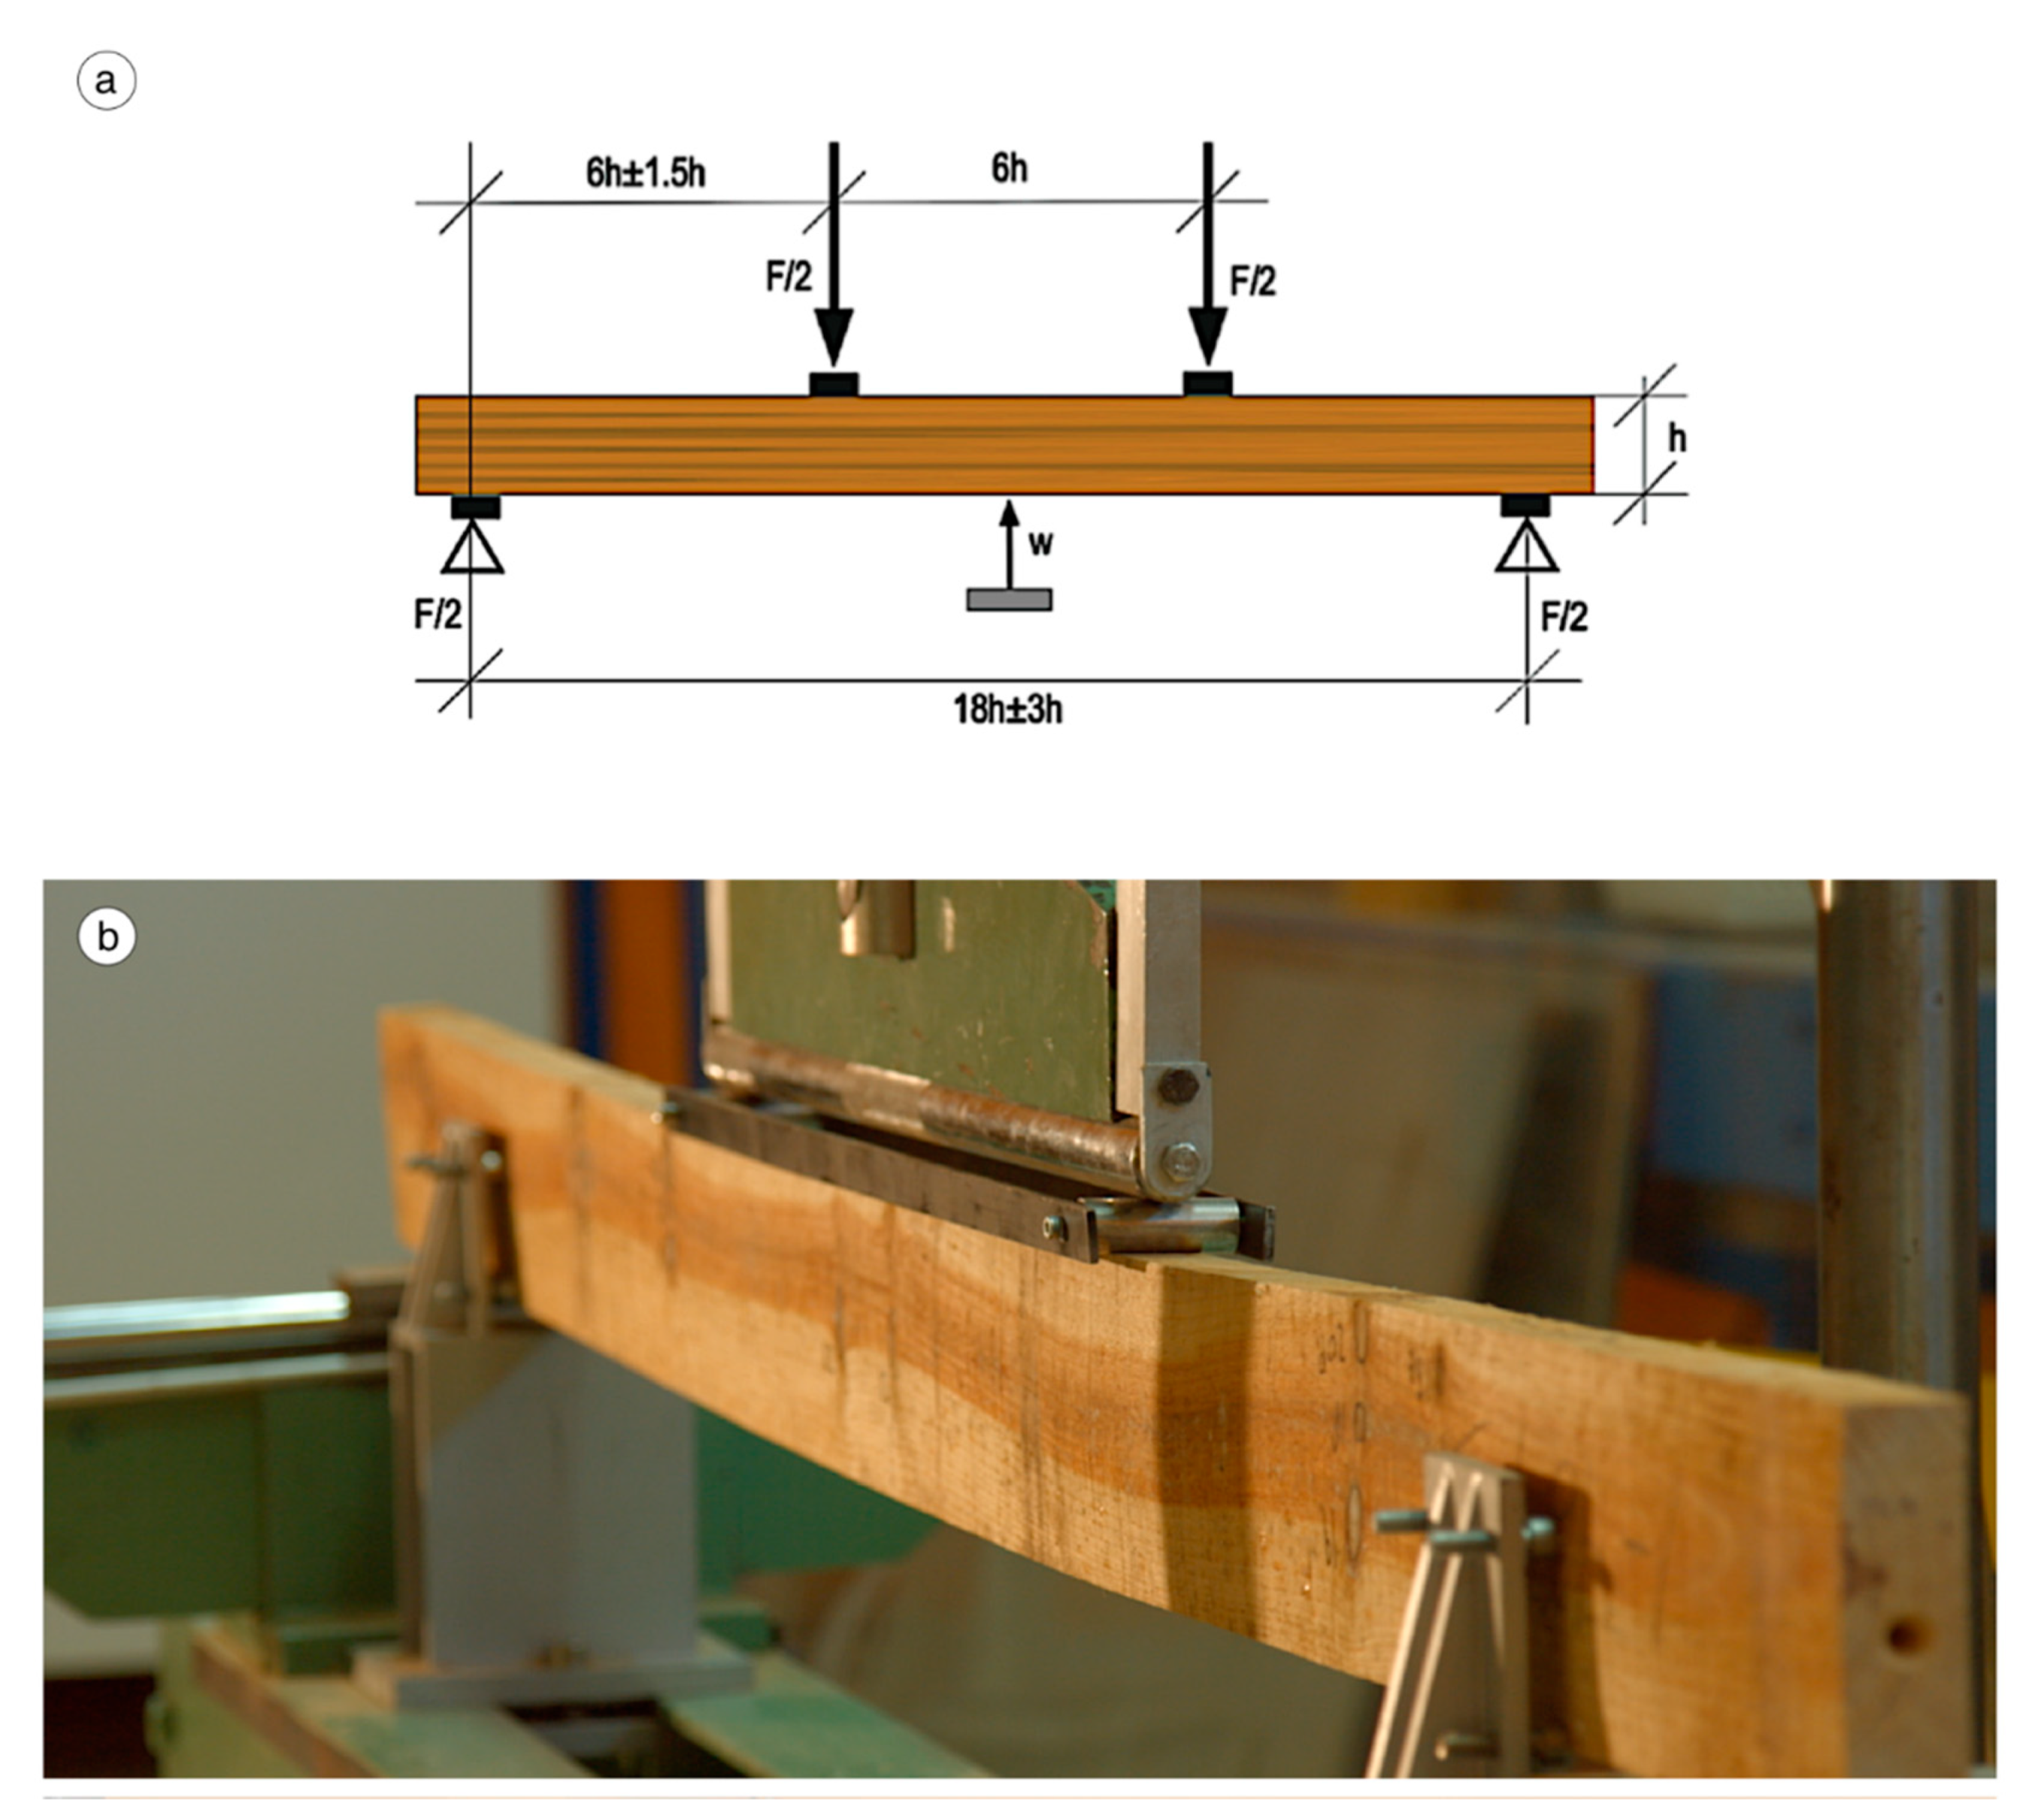
2.3. Physical and Mechanical Properties
2.4. Reference Conditions and Adjustment Factors
2.5. Characteristic Values
2.6. Data Analysis
3. Results
3.1. Visual Strength Grading and Characteristic Values
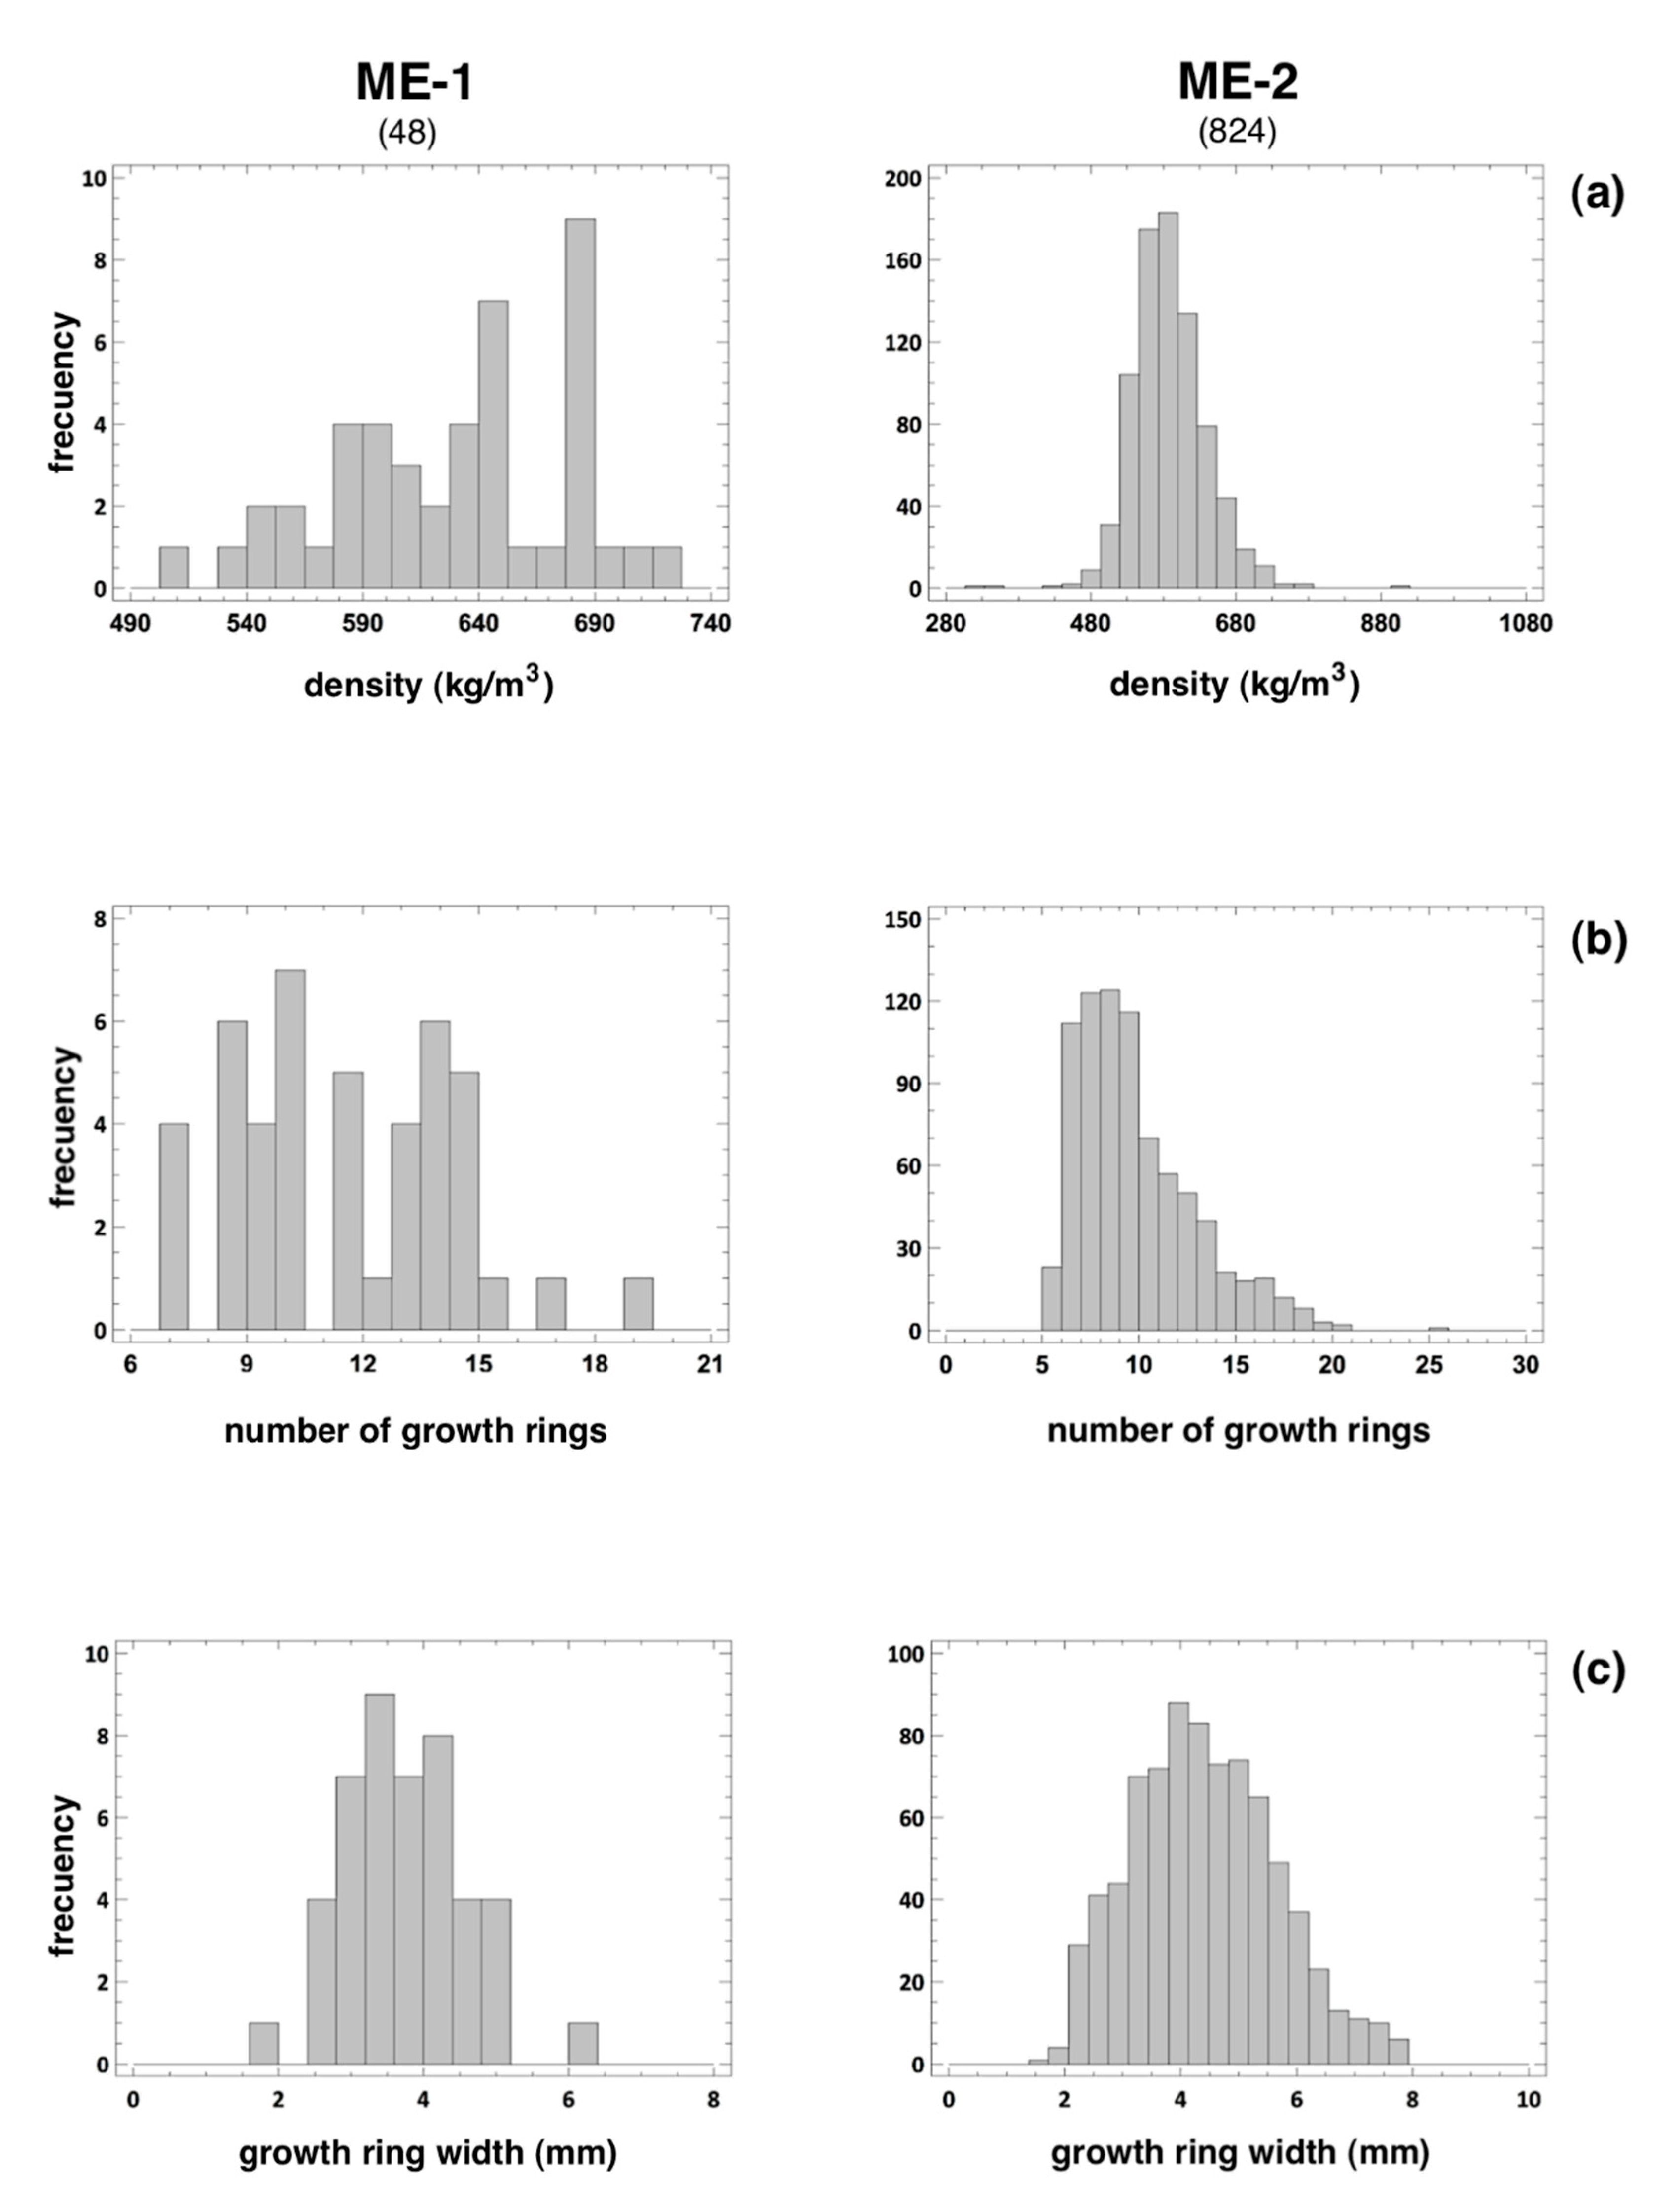
3.2. Density, Number of Growth Rings, Growth Ring Width and Presence of Resinous Wood
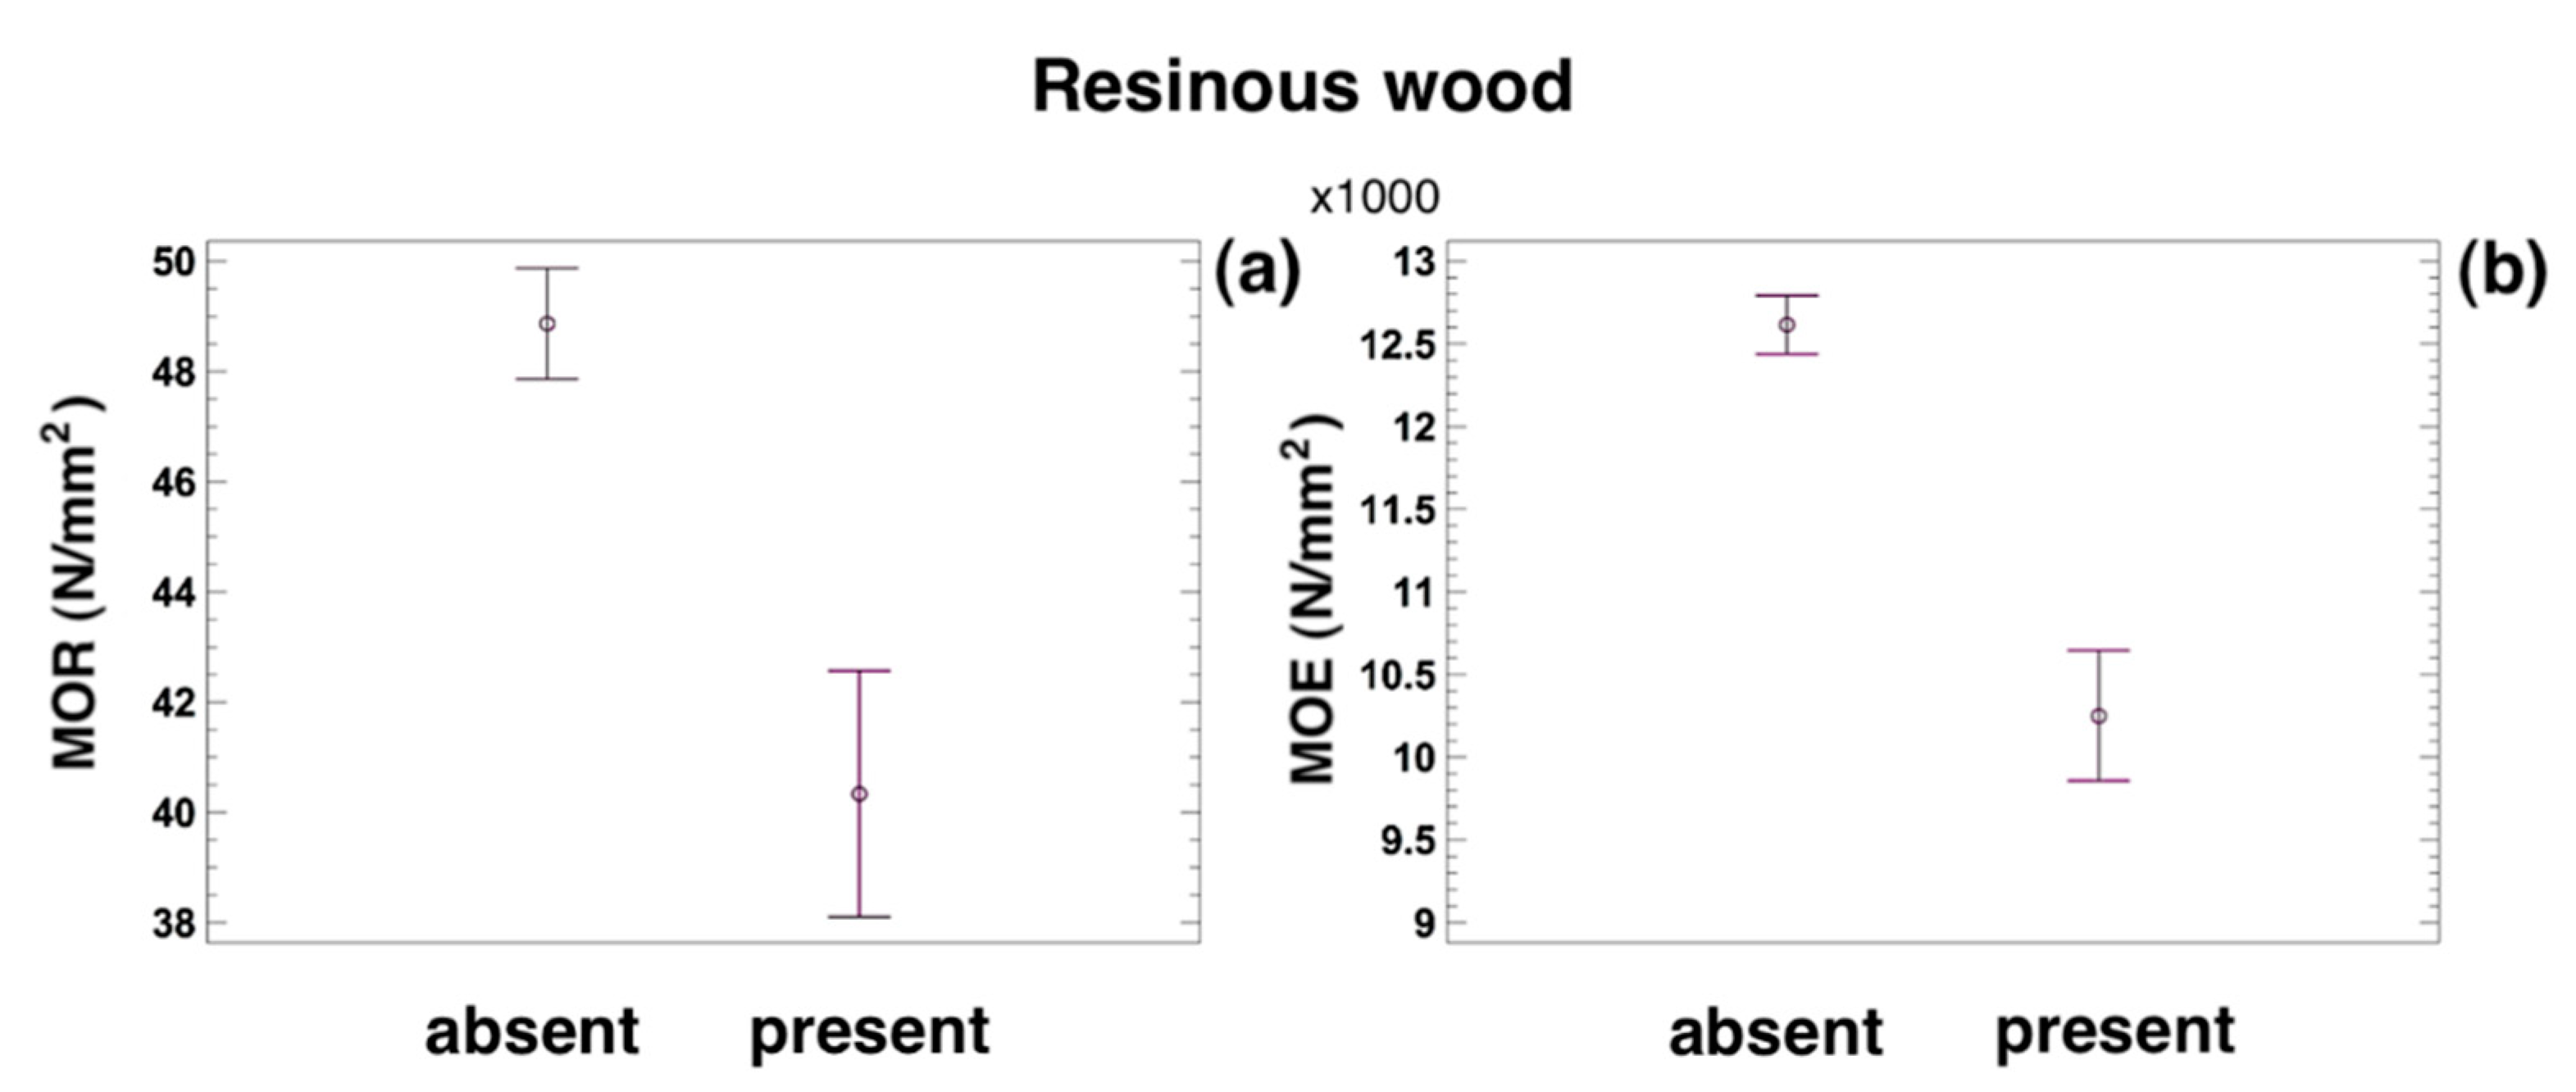
3.3. Influence of the Variables on MOR and MOE
4. Discussion
5. Conclusions
Author Contributions
Funding
Acknowledgments
Conflicts of Interest
References
- Esteban, L.G.; Gasson, P.; Climent, J.M.; de Palacios, P.; Guindeo, A. The wood of Pinus canariensis and its resinous heartwood. IAWA J. 2005, 26, 69–77. [Google Scholar] [CrossRef]
- Esteban, L.G. Serie Documental El Bosque Protector: Tenerife—Corona Forestal. 2019. Available online: https://www.rtve.es/alacarta/videos/el-bosque-protector/bosque-protector-tenerife-corona-forestal/5387738/ (accessed on 16 April 2020).
- Oliva, A.G.; Pulgar, F.P. Características Físico-Mecánícas de las Maderas Españolas; Instituto Forestal de Investigaciones y Experiencia (IFIE): Madrid, Spain, 1967. [Google Scholar]
- Rodríguez, C.; Vergara, E. Propiedades físicas y mecánicas de la madera de Pinus canariensis crecido en el secano de la Región del Maule, Chile. Bosque (Valdivia) 2008, 29, 192–196. [Google Scholar] [CrossRef]
- Guindeo, A.; Esteban, L.G.; Peraza, F.; Arriaga, F.; Kasner, C.; Medina, G.; de Palacios, P.; Touza, M. Especies de Madera Para Carpintería, Construcción y Mobiliario; AITIM: Madrid, Spain, 1997. [Google Scholar]
- Montero, G.; Vallejo, R.; Ruiz-Peinado, R. Fototeca Forestal Española INIA. 2007. Available online: http://www.inia.es/fototeca (accessed on 16 April 2020).
- Spanish Standard. UNE 56544. Visual Grading for Structural Sawn Timber. Coniferous Timber; Asociación Española de Normalización (AENOR): Madrid, Spain, 2011. [Google Scholar]
- European Standard. EN 338. Structural Timber. Strength Classes; European Committee of Standardization (CEN): Brussels, Belgium, 2016. [Google Scholar]
- European Standard. EN 384+A1:2018. Structural Timber—Determination of Characteristic Values of Mechanical Properties and Density; European Committee of Standardization (CEN): Brussels, Belgium, 2016. [Google Scholar]
- European Standard. EN 1309-1. Round and Sawn Timber. Method of Measurement of Dimensions. Part 1: Sawn Timber; European Committee of Standardization (CEN): Brussels, Belgium, 1997. [Google Scholar]
- European Standard. EN 1309-3. Round and Sawn Timber. Methods of Measurements. Part 3: Features and Biological Degradations; European Committee of Standardization (CEN): Brussels, Belgium, 2018. [Google Scholar]
- European Standard. EN 13183-1. Moisture Content of a Piece of Sawn Timber. Part 1: Determination by Oven Dry Method; European Committee of Standardization (CEN): Brussels, Belgium, 2002. [Google Scholar]
- European Standard. EN 13183-1/AC. Moisture Content of a Piece of Sawn Timber. Part 1: Determination by Oven Dry Method; European Committee of Standardization (CEN): Brussels, Belgium, 2003. [Google Scholar]
- European Standard. EN 408+A1:2012. Timber Structures. Structural Timber and Glued Laminated Timber. Determination of Some Physical and Mechanical Properties; European Committee of Standardization (CEN): Brussels, Belgium, 2010. [Google Scholar]
- European Standard. EN 14358. Timber Structures. Calculation and Verification of Characteristic Values; European Committee of Standardization (CEN): Brussels, Belgium, 2016. [Google Scholar]
- European Standard. EN 1912. Structural Timber. Strength Classes. Assignment of Visual Grades and Species; European Committee of Standardization (CEN): Brussels, Belgium, 2012. [Google Scholar]
- European Standard. EN 1912/AC. Structural Timber. Strength Classes. Assignment of Visual Grades and Species; European Committee of Standardization (CEN): Brussels, Belgium, 2013. [Google Scholar]
- Zhang, S.Y. Mechanical properties in relation to specific gravity in 342 Chinese woods. Wood Fiber Sci. 1994, 26, 512–526. [Google Scholar]
- Zhang, S.Y. Wood specific gravity mechanical property relationship at species level. Wood Sci. Technol. 1997, 31, 181–191. [Google Scholar] [CrossRef]
- Forest Products Laboratory (FPL). Wood Handbook. Wood as an Engineering Material. General Technical Report FPL-GTR-113; Forest Products Laboratory, USDA Forest Service: Madison, WI, USA, 1999. [Google Scholar]
- Kiaei, M. Anatomical, physical and mechanical properties of eldar pine (Pinus eldarica Medw.) grown in the Kelardasht region. Turk. J. Agric. For. 2011, 35, 31–42. [Google Scholar] [CrossRef]
- Zhou, C.; Chiu, Y.H.; Gong, M. Within-stem variation in wood properties of red pine (Pinus resinosa Ait.). Wood Fiber Sci. 2012, 44, 412–421. [Google Scholar]
- Miyoshi, Y.; Kojiro, K.; Furuta, Y. Effects of density and anatomical feature on mechanical properties of various wood species in lateral tension. J. Wood Sci. 2018, 64, 509–514. [Google Scholar] [CrossRef]
- Pamerleau-Couture, E.; Rossi, S.; Pothier, D.; Krause, C. Wood properties of black spruce (Picea mariana (Mill.) BSP) in relation to ring width and tree height in even- and uneven-aged boreal stands. Ann. For. Sci. 2019, 76, 43. [Google Scholar] [CrossRef]
- Fernández-Golfín, J.I.; Díez, M.R. Influencia de la anchura del anillo de crecimiento en la densidad y otras propiedades físico-mecánicas de la madera estructural de diversas especies. Investig. Agrar. Sist. Recur. For. 1994, 3, 211–219. [Google Scholar]
- Gonçalez, J.C.; Santos, N.; da Silva, F.G.; Souza, R.S.; de Paula, M.H. Growth ring width of Pinus caribaea and its relationship with wood properties. Sci. For. 2018, 46, 670–678. [Google Scholar] [CrossRef]
- Hautamaki, S.; Kilpelainen, H.; Verkasalo, E. Factors and models for the bending properties of sawn timber from Finland and North-Western Russia. Part I: Norway spruce. Balt. For. 2013, 19, 106–119. [Google Scholar]
- Hautamaki, S.; Kilpelainen, H.; Verkasalo, E. Factors and models for the bending properties of sawn timber from Finland and North-Western Russia. Part I: Scots pine. Balt. For. 2014, 20, 142–156. [Google Scholar]
- Hanhijarvi, A.; Ranta-Maunus, A.; Turk, G. Potential of Strength Grading of Timber with Combined Measurement Techniques. Report of the Combigrade—Project—Phase 1; VTT Publications: Espoo, Finland, 2005. [Google Scholar]
- Hanhijarvi, A.; Ranta-Maunus, A. Development of Strength Grading of Timber Using Combined Measurement Techniques. Report of the Combigrade—Project—Phase 2; VTT Publications: Espoo, Finland, 2008. [Google Scholar]
- Jeong, G.Y. Relationship between anatomical and mechanical properties of loblolly pine (Pinus taeda). For. Prod. J. 2013, 63, 47–53. [Google Scholar] [CrossRef]
- Garcia-Iruela, A.; Esteban, L.G.; de Palacios, P.; García-Fernández, F.; Torres, A.D.; Iriarte, E.V.; Simón, C. Resinous wood of Pinus pinaster Ait.: Physico-mechanical properties. BioResources 2016, 11, 5230–5241. [Google Scholar] [CrossRef]


| SPECIFICATIONS | ME-1 | ME-2 | |
|---|---|---|---|
| FACE KNOT DIAMETER (h) | d ≤ 1/5 “h” | d ≤ 1/2 “h” | |
| EDGE KNOT DIAMETER (b) | d ≤ 1/2 “b” and d ≤ 30 mm | d ≤ 2/3 “b” | |
| MAXIMUM GROWTH RING WIDTH (1) | |||
| Scots pine | ≤4 mm | No limit | |
| Salzmann pine | ≤5 mm | No limit | |
| Maritime pine | ≤8 mm | No limit | |
| Radiata pine | ≤10 mm | No limit | |
| FISSURES | Drying cracks (2),(3) | f ≤ 2/5 | f ≤ 3/5 |
| Drying cracks are considered only if their length exceeds ¼ of the length of the piece or 1 m, whichever is shorter. | |||
| Lightning shakes | Not permitted | ||
| Frost shakes | Not permitted | ||
| Felling shakes | Not permitted | ||
| RING SHAKES | Not permitted | ||
| RESIN AND BARK POCKETS | Permitted if length is ≤1.5·“h” | ||
| COMPRESSION WOOD | Permitted in 1/5 of cross-section or external surface of the piece | Permitted in 2/5 of cross-section or external surface of the piece | |
| SLOPE OF GRAIN | 1:10 (10%) | 1:6 (16.7%) | |
| WANE | Length | ≤1/4 “L” | ≤1/3 “L” |
| Width and thickness | g ≤ 1/4 | g ≤ 1/3 | |
| PITH (1) | Permitted Not permitted if wet graded | Permitted | |
| BIOLOGICAL DAMAGE | Mistletoe (Viscum album L.) | Not permitted | |
| Blue stain | Permitted | ||
| Rot | Not permitted | ||
| Xylophagous insect tunnels | Not permitted | ||
| MAXIMUM DISTORTIONS (2)(3)(4) | Bow | 10 mm (over a length of 2 m) | 20 mm (over a length of 2 m) |
| Spring | 8 mm (over a length of 2 m) | 12 mm (over a length of 2 m) | |
| Twist | 1 mm (for every 25 mm “h”) (over a length of 2 m) | 2 mm (for every 25 mm “h”) (over a length of 2 m) | |
| Cup | No limit | No limit | |
| Number of Sub-Samples | 1 | 2 | 3 | 4 | ≥5 |
|---|---|---|---|---|---|
| kn for modulus of elasticity and density | 0.88 | 0.91 | 0.94 | 0.97 | 1.00 |
| kn for strength parallel to grain | 0.70 | 0.80 | 0.90 | 0.95 | 1.00 |
| ME-1 | No. Data | 48 | |
|---|---|---|---|
| Moisture Content (%) | 12.1 | ||
| fm (N∙mm−2) | ρ (kg∙m−3) | E0 (N∙mm−2) | |
| Mean | 70.6 | 627.1 | 15,138.1 |
| Standard deviation | 20.3 | 51.4 | 3947.6 |
| Maximum | 121.9 | 723.2 | 21,657.6 |
| Minimum | 20.1 | 506.9 | 1843.8 |
| Coefficient of variation (%) | 28.8 | 8.2 | 26.1 |
| 5-percentile value | 37.7 | 544.1 | - |
| Characteristic value | 26.4 | 478.8 | 14,022.7 |
| ME-2 | No. Data | 824 | |
|---|---|---|---|
| Moisture Content (%) | 12.0 | ||
| fm (N∙mm−2) | ρ (kg∙m−3) | E0 (N∙mm−2) | |
| Mean | 47.3 | 588.5 | 12,172.5 |
| Standard deviation | 19.1 | 53.1 | 3480.1 |
| Maximum | 108.4 | 919.5 | 23,588.5 |
| Minimum | 11.9 | 245.8 | 1517.1 |
| Coefficient of variation (%) | 40.3 | 9.0 | 28.6 |
| 5-percentile value | 20.2 | 514.5 | - |
| Characteristic value | 14.1 | 452.8 | 11,275.6 |
| ME-1 | ME-2 | ||
|---|---|---|---|
| Density (kg∙m−3) | Mean | 627.1 | 588.5 |
| Standard deviation | 51.4 | 53.1 | |
| Maximum | 723.2 | 919.5 | |
| Minimum | 506.9 | 245.8 | |
| Number of growth rings | Mean | 12 | 10 |
| Standard deviation | 2.8 | 3.1 | |
| Maximum | 19 | 26 | |
| Minimum | 7 | 5 | |
| Growth ring width (mm) | Mean | 3.70 | 4.41 |
| Standard deviation | 0.77 | 1.23 | |
| Maximum | 5.13 | 7.91 | |
| Minimum | 1.08 | 1.72 | |
| Resinous wood | Presence | - | 160 |
| Absence | 48 | 664 | |
| Property | Variable | p-Value | Equation | R | R2 |
|---|---|---|---|---|---|
| MOR | Density | 6.40 × 10⁻⁶ | 0.27 | 0.07 | |
| Number of growth rings | 2.98 × 10⁻²⁴ | - | - | - | |
| Growth ring width | 2.58 × 10⁻⁴ | −0.37 | 0.14 | ||
| Presence of resinous wood | 1.83 × 10⁻⁶ | - | - | - | |
| MOE | Density | 5.53 × 10⁻²⁷ | 0.34 | 0.12 | |
| Number of growth rings | 6.25 × 10⁻¹³ | - | - | - | |
| Growth ring width | 7.80 × 10⁻⁵ | −0.51 | 0.26 | ||
| Presence of resinous wood | 9.23 × 10⁻¹⁵ | - | - | - |
© 2020 by the authors. Licensee MDPI, Basel, Switzerland. This article is an open access article distributed under the terms and conditions of the Creative Commons Attribution (CC BY) license (http://creativecommons.org/licenses/by/4.0/).
Share and Cite
Esteban, L.G.; de Palacios, P.; García Fernández, F.; García-Iruela, A.; del Pozo, J.C.; Pérez Borrego, V.; Agulló Pérez, J.; Padrón Cedrés, E.; Arriaga, F. Characterisation of Pinus canariensis C.Sm. ex DC. Sawn Timber from Reforested Trees on the Island of Tenerife, Spain. Forests 2020, 11, 769. https://doi.org/10.3390/f11070769
Esteban LG, de Palacios P, García Fernández F, García-Iruela A, del Pozo JC, Pérez Borrego V, Agulló Pérez J, Padrón Cedrés E, Arriaga F. Characterisation of Pinus canariensis C.Sm. ex DC. Sawn Timber from Reforested Trees on the Island of Tenerife, Spain. Forests. 2020; 11(7):769. https://doi.org/10.3390/f11070769
Chicago/Turabian StyleEsteban, Luis García, Paloma de Palacios, Francisco García Fernández, Alberto García-Iruela, Juan Carlos del Pozo, Víctor Pérez Borrego, Juan Agulló Pérez, Eva Padrón Cedrés, and Francisco Arriaga. 2020. "Characterisation of Pinus canariensis C.Sm. ex DC. Sawn Timber from Reforested Trees on the Island of Tenerife, Spain" Forests 11, no. 7: 769. https://doi.org/10.3390/f11070769
APA StyleEsteban, L. G., de Palacios, P., García Fernández, F., García-Iruela, A., del Pozo, J. C., Pérez Borrego, V., Agulló Pérez, J., Padrón Cedrés, E., & Arriaga, F. (2020). Characterisation of Pinus canariensis C.Sm. ex DC. Sawn Timber from Reforested Trees on the Island of Tenerife, Spain. Forests, 11(7), 769. https://doi.org/10.3390/f11070769