Article

Optimising Tree Plantation Land Use in Brazil by Analysing Trade-Offs between Economic and Environmental Factors Using Multi-Objective Programming

1
Universidade Federal de Mato Grosso do Sul, Campo Grande 79560-000, Brazil
2
Universidade Federal do Rio Grande do Sul, Centro de Estudos e Pesquisas em Agronegócios, Porto Alegre 90040-060, Brazil
3
Universidade Federal da Grande Dourados, Núcleo de Pesquisas Ambientais, Sociais e Econômicas, Dourados 79804-970, Brazil
*
Author to whom correspondence should be addressed.
Forests 2020, 11(7), 723; https://doi.org/10.3390/f11070723
Submission received: 6 April 2020 / Revised: 8 May 2020 / Accepted: 11 May 2020 / Published: 1 July 2020
(This article belongs to the Special Issue Forests, Plantations, and Land Use)

Abstract

:
In order to meet the growing global demand for bioproducts, areas of forests planted for productive purposes tend to increase worldwide. However, there are several controversies about the possible negative impacts of such forests, such as invasive potential, influence on water balance and biodiversity, and competition with other types of land use. As a result, there is a need to optimize land use, in order to achieve improvements in terms of sustainability in the broadest sense. In this study, the environmental and economic performances of pine and eucalyptus forest production systems for multiple purposes are compared aiming an optimized allocation of land use in the Center-West Region of Brazil. Life cycle assessment, life cycle cost and analysis of financial and economic indicators were used to assess potential environmental and economic impacts, covering the agricultural and industrial phases of pine and eucalyptus forest systems managed for the production of cellulose and sawn wood and, for pine, the production of rosin and turpentine from the extraction of gumresin and by applying the kraft process. Subsequently, the TOPSIS multicriteria decision-making method was applied to rank production systems in different combinations of phases and criteria, and multi-objective optimization was used to allocate land use according to different restrictions of areas and efficiency. The adoption of cleaner energy sources and the use of more efficient machines, equipment and vehicles are the main solutions to improve the environmental and economic performance of the forestry sector. The production systems of pine for cellulose and pine for sawn wood, rosin and turpentine were identified as the best solutions to optimize land use. For this reason, they must be considered as alternatives for the expansion and diversification of the Brazilian forest productive chain.

1. Introduction

Climate change is challenging the current models of economic development based on fossil resources, and expectations of growth of the world population indicate that there will be a greater pressure on natural resources necessary for human well-being [1]. As a result, the debate on the transition to a new paradigm of economic growth has intensified, i.e., bioeconomics [2,3,4].
The concept of bioeconomics is discussed from two main perspectives, one industrial and the other centered on public goods [5]. The first perspective refers to an economy that encompasses the production of renewable biological resources and their conversion into food, bio-based products and bioenergy, as well as related public goods [6]. This economy includes agriculture, forestry, fishing, food, paper and cellulose industries, and part of the chemical, energy and biotechnology industries [6]. In a complementary and somewhat paradoxical way, there is also concern with a more sustainable use of scarce natural resources and the conservation of ecosystem services, which are public goods that must be protected by the adoption of more efficient production methods [5].
In an integrative view, forests are fundamental to achieve a biobased economy. The ecological characteristics, functions and processes of these ecosystems translate into several benefits that directly or indirectly contribute to human well-being [7], through regulation, provision, or even cultural services [8].
Forests are the main regulators of carbon, energy and water cycles as they provide the basis for carbon storage, cooling of the earth’s surface and distribution of water resources [9], as well as biodiversity [10]. In addition, forests have recreational function and, in some communities, represent a cultural identity [11,12,13].
Provision services deserve to be highlighted because, in the context of bioeconomics, it is expected that the demand for forest products increases continuously, due to the wide potential for application as alternatives to fossil-based resources [10]. In addition to the traditional uses of wood in the manufacture of furniture, in civil construction and in the production of firewood and charcoal, technological advances are enabling the expansion of forest-based bioproducts and bioenergies.
Studies highlight the potential of biomass for the production of biofuels [14,15,16], polymers [17] and green chemicals, such as levulinic acid [18], and rosin and turpentine [19]. In addition to being technically feasible, these alternatives to fossil resources for material and energy purposes promote the reduction of environmental impacts associated with the final product when compared to the products they replace [17,18,19,20].
Due to the growing interest in bioproducts and the need to reduce pressure on natural forests for the supply of raw materials, the trend is that forests planted for productive purposes continue to expand [21]. Forests planted for productive purposes are composed of introduced or native species established through planting or sowing, with a focus on wood production and non-timber products [22]. According to recent estimates, the area of planted forests in the world is 290 million hectares [23], of which more than half is occupied by forests directed to productive functions or, at least, as a part of the management objective [24,25].
On the other hand, although forests play a key role in minimizing climate change, there are other environmental impacts that may be associated with forest plants. There are some controversies about the impacts that can be associated with forests planted for productive purposes, especially pine and eucalyptus, which together account for almost 70% of the planted area worldwide [26]. The main criticisms refer to the potencial negative impacts that these forests can cause to the environment and the local community due to the use of exotic species [27], their invasive potential [28], the effects on water availability [29], biodiversity [30], and social conflicts over land tenure and the use of natural resources [31].
The expansion of pine and eucalyptus forest plantations in Brazil began in the 1960s driven by fiscal incentives to initially meet the demands of the pulp and paper industries and then other important segments, such as the production of panels, steel and drying of grains [32]. It can be considered that this process occurred quickly, accentuating the controversial perceptions regarding forests planted for commercial purposes, both by parts of academia and the society.
In Brazil, environmental pressures on forest plantations have been greater than those exerted on other agricultural activities and are increased by the widespread claim that forest planting occurs in agricultural areas [33]. Although there is no evidence to confirm it [33], the growing demand for renewable biological resources implies additional pressures on forests and agricultural crops [1] aiming at the production of food, fibers, bioproducts, bioenergy and other public goods [6]. Consequently, conflicts arise over the use of resources, especially land, as it is a finite resource on which the economy and the quality of human life directly depend [34].
Although products from agriculture, forestry and other land uses are essential, they also exert significant environmental impacts during their life cycle [35]. The AFOLU sector (Agriculture, Forestry, and Other Land Use) is responsible for almost a quarter of the anthropogenic emissions of greenhouse gases, mostly emissions generated by deforestation, livestock, and soil and nutrient management [34].
As environmental impacts, socioeconomic aspects also need to be considered in order to optimize land use and achieve improvements in terms of sustainability in the broadest sense [34]. However, the allocation of land use for competing purposes is complex, due to synergies and multifunctionalities between different uses and therefore requires a systematic comparison of alternatives [35].
The state of Mato Grosso do Sul (MS) is one of the recent markers of the Brazilian forestry sector and a good example to elucidate the importance of the optimized allocation of land use. The forests are concentrated in the eastern region of that state, where it is difficult to produce grains due to the predominance of low fertility sandy soils susceptible to erosion requiring high investments for correction [36]. Due to their adaptability to these conditions, forests have become an option to make productive a vast area of degraded pastures, because of the extensive practice of beef cattle farming in the region.
Pine and eucalyptus forests are the most planted worldwide, due to the similar characteristics they share that make them economically highly interesting [26], among them fast growth, high productivity and adaptability to a diversity of environments [27]. However, some factors may cause the productivity and quality of pine and eucalyptus plantation production to differ significantly and, together with local market conditions, influence decision makers to choose one species over another.
In addition to competing with eucalyptus in the same markets, pine has a great potential to contribute to the diversification sought by the sector in other segments. Rosin and turpentine produced from gumresin extracted from pine, and as a by-product of the pine cellulose production process, are renewable chemical substances that replace petroleum derivatives with applications in a wide range of industries, such as chemicals, pharmaceuticals, food and biofuels [19].
Therefore, the objective of this study was to compare the environmental and economic performance of pine and eucalyptus forest production systems to produce cellulose, sawn wood, rosin and turpentine aiming at optimized allocation of land use in the Center-West region of Brazil. To this end, it was proposed to integrate life cycle assessment, life cycle cost, analysis of financial and economic indicators and multicriteria decision-making methods to determine the optimal allocation of land use considering a broad scope to compare two species competing for the same purposes. To the best of our knowledge, this methodological approach has been used in a limited number of studies on planted forests for productive purposes previously identified in the scientific literature.

2. Materials and Methods

2.1. Study Site

Forestry practices can vary significantly between different locations and in a same region planted with different tree species [37]. Therefore, due to the variability of the tree growing phase of forest production systems in Brazil and consequently the impossibility of obtaining representative systems for the region, we opted for simulations. In this study, forest production was simulated on a 2500-hectare rural property located in the municipality of Ribas do Rio Pardo, state of Mato Grosso do Sul, in the Center-West Region of Brazil, at 20°26′34″ S and 53°45′32″ W (Figure 1). In this region, Neosols and the Latosols of medium texture predominate, both with a low natural fertility, although there are also some patches of Planosols. The predominant climate is humid to sub-humid, with annual rainfalls between 1500 and 1750 mm [38]. It corresponds to the Aw type of the Köppen classification, i.e., tropical with dry winters [39].

2.2. Production Systems

The systems were simulated based on data collected by interviews and questionnaires with producers and experts in the field in addition to technical and scientific studies published on the subject. For the tree growing phase, five forest production systems of Pinus caribaea var. hondurensis x tecunumanii and Eucalyptus urograndis I144, with different purposes and consequently different planting spacing and densities, were evaluated (Table 1).
In systems that have, as their main objective, the production of wood, thinning is carried out, while in systems for the production of cellulose, thinning is not carried out; therefore, the stand is clearcut at the end of the cycle (Table 2 details typical production cycles). In no system is there a collection of forest residues. There is formation of litter, which plays an important role in restoring part of the nutrients that were removed from the soil during the growth of trees.
The systems for the production of wood have the same cycle period of 21 years. The management of pine for wood and resin systems is different from the system intended for wood only by the number of thinning events and type of trees thinned in each case. The resin period starts at 12 years of age from September of the first year to May of the following year. In winter, between June and August, the trees rest and the collecting containers are fixed again for the next harvest.
The average production in Brazil is 35.7 m3/ha/year for eucalyptus plantations and 30.5 m3/ha/year for pine, according to information reported by the main companies in the sector [40]. Based on this information, a sensitivity analysis was performed for the average annual increase (AAI), considering a variation of 30 to 40 m3/ha/year for eucalyptus and of 25 to 35 m3/ha/year for pine.
Based on this, a discrete distribution of the possible values for the AAIs was carried out through the data analysis supplement of the Excel software. The distribution was made by generating 10,000 random numbers restricted to pre-established limits at an interval of 0.5 between them and a same probability for the occurrence of each number. Subsequently, the mean, the standard deviation of the distribution and the minimum and maximum values of AAIs of each system were calculated. Then, using the software SisEucalipto and SisPinus, both from Embrapa (Brazilian Agricultural Research Corporation), the management of each system (cycle duration, number of trees per hectare, periods and quantities of thinning and/or cutting trees) were simulated with minimum, maximum and average AAIs, according to the values established by the distribution. From these data, the volumes of wood production by thinning and cutting were obtained, as well as the total volume produced by each system (Table 2).

2.3. Scope and Functional Unit

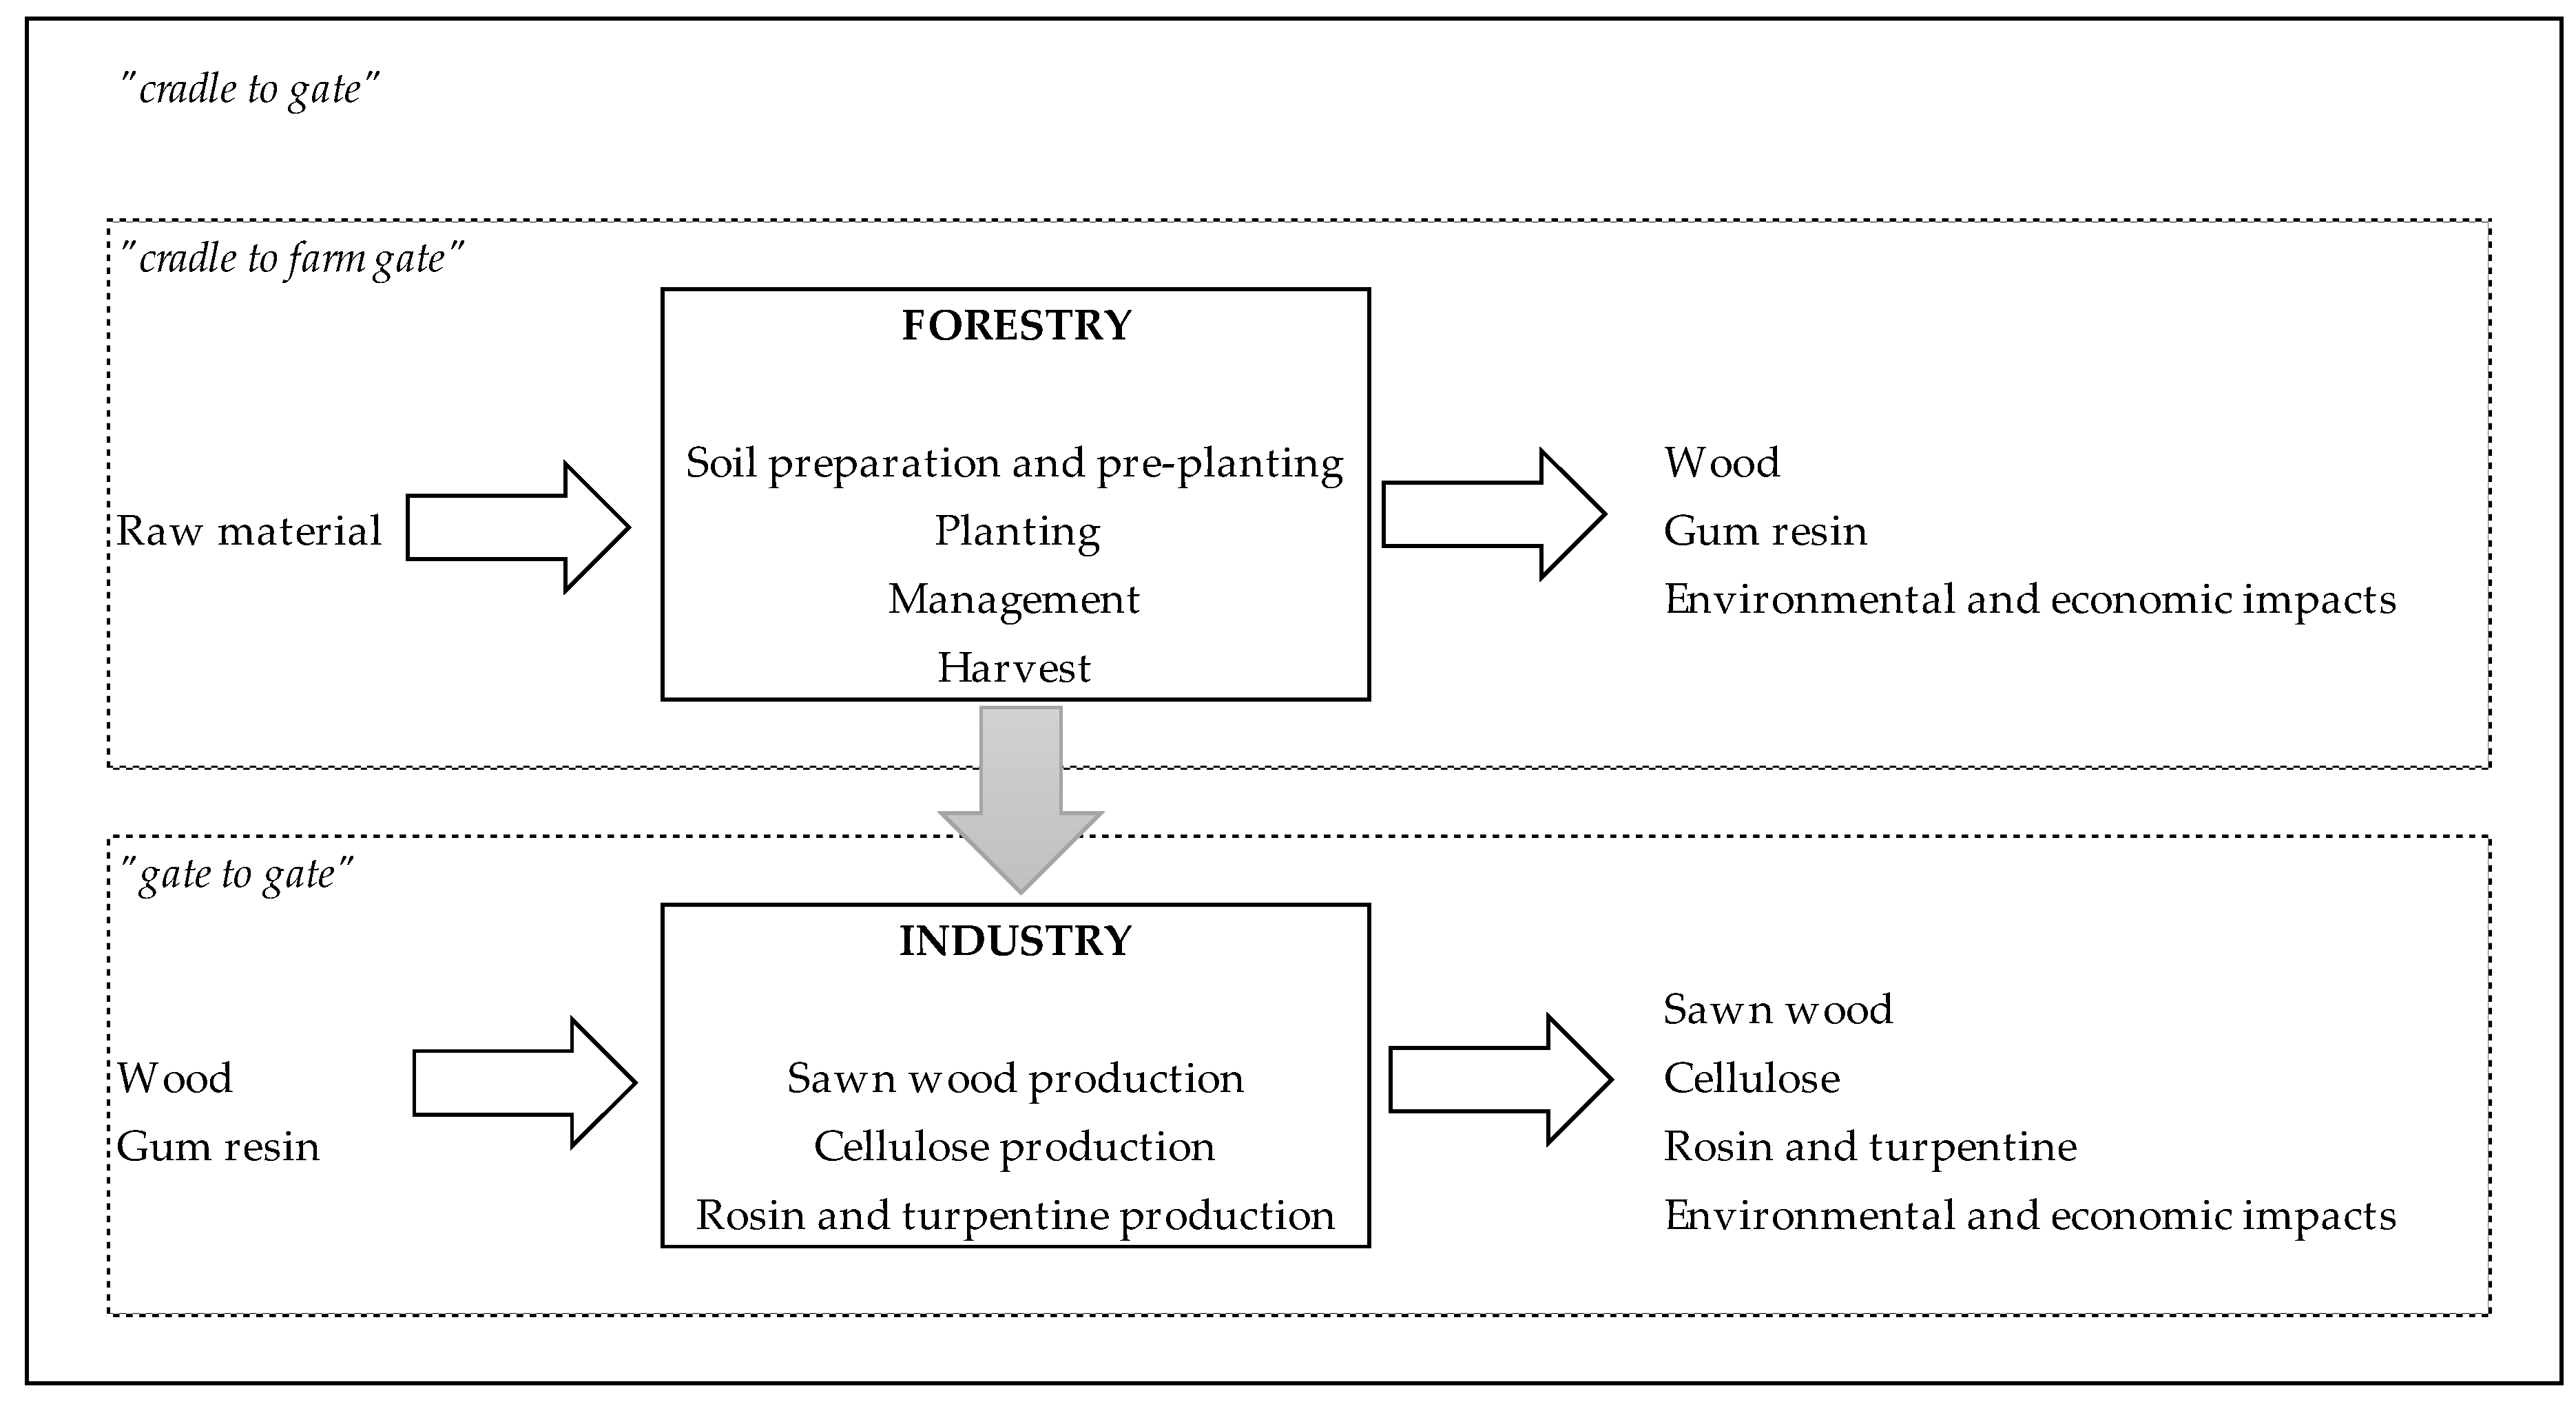
The industrial phase of the systems was also analyzed. It consists of processing the wood produced in the tree growing phase into sawn wood and cellulose (for both forest species) and, in the case of pine, also for the production of rosin and turpentine from the extraction of gumresin from live trees and as by-products of cellulose production, known as the Kraft process. Therefore, the scope of this study is characterized as “from cradle to gate,” covering the agricultural and industrial phases of forest production for different purposes (Figure 2).
Unlike most life cycle assessment studies, in which analyses per product unit predominate [41], another functional unit was included in this case as the objective was to compare different species for the optimization of the land use for forests planted with productive purposes. Therefore, the unit of one hectare per year of cycle was used as a functional unit in both the agricultural and industrial phases.
Thus, the industrial phase represents the processing of raw materials generated per hectare in one year of the cycle of each system in the tree growing phase. This facilitated the aggregation of impacts of both phases and allowed assessing the possible consequences of different land use options in a coherent way.

2.4. Assessment of Potential Environmental Impacts

The environmental inventory of the tree growing phase is the result of the quantity and type of inputs, machinery and transportation used. The processes include cleaning the area, grading, subsoiling, ant control, application of lime, fertilizers, herbicides and fungicides, maintenance of firebreaks, pruning and thinning (when appropriate), cutting and transportation. In the case of the PSG system, they also include resin process, resin collection and transportation.
The environmental inventory of the industrial phase, on the other hand, consists of the amount of fuels and electricity used, as these inputs are present in all industrial processes. It was necessary to restrict the calculation of potential environmental impacts to these items in order to balance the comparison between systems, since different levels of details of the processes were obtained from the sources analyzed.
The production of cellulose comprises the processes of reception and preparation of wood, cooking, bleaching, drying and shipping. The industrial processes of sawmills start with the reception of logs, followed by debarking, formation of trims, grating, and finally, drying.
The processing of gum-resin includes distillation, pre-filtration, condensation, separation and crystallization, until the pitch and turpentine are sent to the deposit tanks. Tall oil resin (TOR) and crude sulfate turpentine (CST) are obtained from the recovery of waste generated by the kraft pulp production process, which includes reactions with sulfuric acid and distillation.
All environmental data related to the potential impacts of forestry and industrial process described previously were collected from the Ecoinvent database. The production costs necessary for the life cycle cost analysis of the tree growing phase were collected directly from local suppliers.
The most relevant impact categories were defined after analyzing the environmental inventory and identifying in the literature the potential environmental impacts that could be associated using inputs, machinery and transportation (in the tree growing phase) and fuels and electricity (in the industrial phase). Using the Simapro software, the following categories of potential environmental impacts were analyzed for both phases: potential impact on climate change (GWP-100a), photochemical ozone formation, eutrophication, acidification, human toxicity, and ecotoxicity.
The impact assignment methods selected were those of midpoint: USEtox (consensus only) V1.04 [42] for human toxicity and ecotoxicity, and CML-IA baseline V3.02 [43] for the other categories. As there is still no specific impact attribution method for Brazil, we opted for the joint application of both methods, which provide a global coverage and are widely accepted, as recommended by Silva (2012) and other authors. In particular, the choice of USEtox for the categories of ecotoxicity and human toxicity was due to its specific development with this focus in mind and its acceptance as the most robust method currently available for these categories.
Carbon sequestration was calculated using the Tier 2 approach of the IPCC method [44] for forests based on the carbon stock in biomass above and below ground. The data used for the calculation were area, volume of marketable biomass in growth, ratio between biomass above and below ground, carbon fraction in dry matter (related to the climatic zone where the forest is located), and conversion factor and expansion of marketable biomass in above-ground biomass (specific to species in a given climatic zone). The area and the volume of marketable biomass in growth were obtained from the results of the simulations in the SisPinus and SisEucalipto software, and the rest are available in the IPCC’s Guidelines for National Greenhouse Gas Inventories [44].

2.5. Assessment of Economic Impacts

Firstly, the life cycle cost analysis (LCCA) was carried out, which encompassed all costs from the acquisition of raw materials to the end of the tree growing phase cycle. Based on the cash flows, the annual profitability ratios were calculated, also simulating the revenues from the sale of carbon credits (Table 3). The cost of labor was also used as an economic indicator for direct job generation based on the annualization of this cost in each system.
Then, investment analyses were performed based on the calculation of the Annualized Profitability Index (API), represented by Equation (1). The annual profitability was obtained during a cycle of each system, without considering the cost of land. This method consists of annually distributing the value of the NPV (net present value) per investment unit of the project throughout its useful life [45]. Through it, it is possible to solve the limitations of the NPV in comparing projects with different investment and terms simultaneously [45]. That is why API was considered an adequate tool to compare systems fairly. For its calculation, the current interest rate of 8.5% per year of the FCO Rural Investiment of Banco do Brasil was considered, among others, for rural producers in the Center-West region of the country.
API = { [ t = 1 n R t D t ( 1 + i ) t ] · i | t = 1 n D t ( 1 + i ) t | · [ 1 ( 1 + i ) n ] } ,
where:
API = Annualized Profitability Index;
Rt = cash inflows (revenue) expected during period t;
Dt = cash outflows (expenses) expected during period t;
i = interest rate or discount rate;
n = project life in years.
The API was also calculated by simulating the existence of a carbon credit market. The credits were estimated by subtracting the sequestration of CO2 in the biomass from the potential impact on climate change, thus obtaining negative net emissions. The price considered for the calculation of revenue was based on the average worldwide transactions in 2015: $3.3/ton CO2 [46].
Due to the unavailability of complete data referring to the production costs of the industrial phase, an economic analysis was performed by calculating the gross added value (GVA), which is based on the value added to the raw material taking, as reference, its prices plus the final products. The use of GVA as an economic indicator is justified because it is directly related to the gross revenue of the industry and, consequently, to the generation of taxes, which are macroeconomic indicators relevant to the region.

2.6. Multicriteria Decision-Making Methods

To determine the most satisfactory solution among several alternatives, there are two main approaches to support decision-making, and the choice of one of them depends on the rationality of the decision maker in demonstrating preferences. The first approach is the overclassification or overcoming approach, by which comparisons are made pair by pair to verify which alternative is superior for each criterion and, in the end, the best evaluated alternative is the one that presents superiority in most criteria [47]. However, methods of this type, such as Promethee, do not allow a hierarchy of alternatives and do not allow trade-offs among criteria [47,48]. In other words, an alternative can be superior in most criteria and, at the same time, the worst in some criteria that are relevant to decision makers.
Therefore, when rationality involves the weighting of criteria and includes trade-offs, the most suitable methods are those of the multi-attribute utility theory or the unique synthesis criterion, such as Topsis, for which the ideal positive solution is one that maximizes the benefit criteria and minimizes the cost criteria [47].

2.6.1. Topsis

The variety of indicators used to evaluate production systems makes it difficult to carry out a simple comparison for decision-making. It is a multicriteria decision problem, as there are more than two alternatives to choose from, with conflicting criteria and restrictions for analysis [49].
The multicriteria method chosen to select the best production purpose for land use in each phase was TOPSIS (technique for order preference by similarity to the ideal solution). This method creates a ranking of alternatives based on the isolated calculation of each evaluated criterion, in which the best alternative is the one that has the longest distance from the negative solution and the shortest distance from the ideal solution [49]. The criteria are represented by sets of indicators that make up the environmental and economic analyses.
For the environmental criterion, the following were considered as indicators: net emissions (tree growing phase and integrated phases) or global warming potential (industrial phase), photochemical ozone formation, acidification, eutrophication, ecotoxicity, and human toxicity. For the economic criterion, the following were considered as indicators: API, API with the sale of carbon credits, direct jobs generated (tree growing phase), and gross value added (GVA, industrial phase).
For the calculation, a decision matrix (xij) is elaborated with alternatives (i) and criteria (j). Subsequently, the data are normalized by dividing the value of j by the highest value of j, avoiding possible outliers. Then, the deviation from the ideal scenario (Equation (2)) and the deviation from the worst scenario (Equation (3)) are calculated.
S i + = j = 1 n ( n i j n j + ) 2 ,
S i = j = 1 n ( n i j n j ) 2 ,
where:
S i + = deviation from the best alternative;
S i = deviation from the worst alternative;
n i j = value of alternative i evaluated in criterion j;
n j ± = best or worst value i in criterion j;
The model ends with the calculation of the value (C+) that determines the alternative in relation to the best and worst solution (Equation (4)). Then, the values are ranked in an increasing way, in which the highest value represents the best alternative found.
C i + = S i ( S i + + S i ) ,
where:
C i + = distance from the best and worst alternative;
S i + = deviation from the best alternative;
S i = deviation from the worst alternative;

2.6.2. Multiobjective Optimization

In decision-making processes featuring several objectives to be achieved, which are generally conflicting with each other and an optimal solution for all objectives simultaneously is difficult to find, there is a problem of multi-objective optimization [50]. In this sense, mathematical programming seeks to find the most efficient way to use limited resources to achieve a certain objective and, for this reason, it is commonly referred to optimization [51].
The key concept at the base of this tool is the non-dominated solution (Pareto’s optimum, efficient or not inferior), which is that of a solution for which there is no other permissible solution that simultaneously improves all objective functions [52]. For this reason, it requires an interactive solution procedure, by which the decision maker investigates a series of solutions to find the most satisfactory ones [51].
The formulation and solution of an optimization problem involves the identification of decision variables as well as the expression of an objective function and any restrictions in terms of decision variables [51]. The objective function and the restrictions can be linear or non-linear, which will imply different calculations to determine the solution [51]. Since the problem of this study is that the objective functions and the restrictions are linear in nature, it was possible to solve the optimization problem using linear programming, the Simplex method and the MS Solver, a supplement available in the MS Excel software.
The application of this method allowed optimizing the land use of an area of 1,000,000 hectares to be occupied by planted pine and/or eucalyptus forests for different production purposes (Equations (5)–(8)). This reference value was attributed based on the current area of eucalyptus forests in the state, but the results of the optimization are presented in percentages. We opted for this approach because it can be useful for any area intended to optimize the use with forests, since the total area does not influence the results of optimization and depends on the specific market conditions of each situation.
Objective functions:
M a x i m i z e X : [ X 1 + X 2 + + X n ]   p o s i t i v e   e c o n o m i c   a n d   e n v i r o n m e n t a l   i m p a c t s ,
M i n i m i z e : [ X 1 + X 2 + + X n ]   n e g a t i v e   e n v i r o n m e n t a l   i m p a c t s ,
Subject to:
X 1 + X 2 + + X n = 1.000.0007 ,
[ X 1 , X 2 , , X n 0 ]   c o n d i t i o n   o f   n o n n e g a t i v i t y ,
where:
X1Xn: area to be occupied by the production system.
Besides restrictions on non-negativity and the total area where land use was optimized, additional restrictions were set on the area destined for the production of cellulose and wood and efficiency, in relation to the indicators evaluated. Optimizations were carried out with different combinations of insertion of area restrictions for a specific purpose and efficiency, to assess their influence on the results of the solution obtained.
In addition, these optimizations were based on three different considerations of environmental and economic criteria. Regarding the first consideration, both criteria were given 50% weight, to find the most appropriate solution. To test how robust and reliable the outputs were, it was also assumed that the decision makers’ preference regarding the criteria may also differ. For this reason, we also opted to adopt the weights of 70%/30% and 30%/70% for environmental and economic criteria. Given the difference in the number of indicators for each criterion, the weights were divided by the respective weight of the criterion to then compute the weight of each indicator.
For optimization, the same indicators were considered for the composition of the environmental and economic criteria used in the ranking by TOPSIS. In the integration of the phases, the indicators of environmental and economic criteria of the industrial pine sawn wood systems from the PSG agricultural system were grouped together with the rosin and turpentine from gumresin industry. Likewise, the pine cellulose industry and the production of rosin and turpentine were integrated by the Kraft process (PCRT system). Since the objective of the study was to compare the systems by the functional unit of one ha per year, it was considered appropriate to integrate the industries supplied by the same agricultural system.

3. Results

3.1. Environmental Impacts

3.1.1. Agricultural Process

Since the results of the assessment of each category have been normalized, they are presented as percentages: 100% represents the greatest impact obtained for the categories considered as negative environmental effects of production systems. The net result of emissions from all systems is negative, given that, forestry processes sequester more CO2 than they emit greenhouse gases, which means a positive environmental consequence of forest production systems.
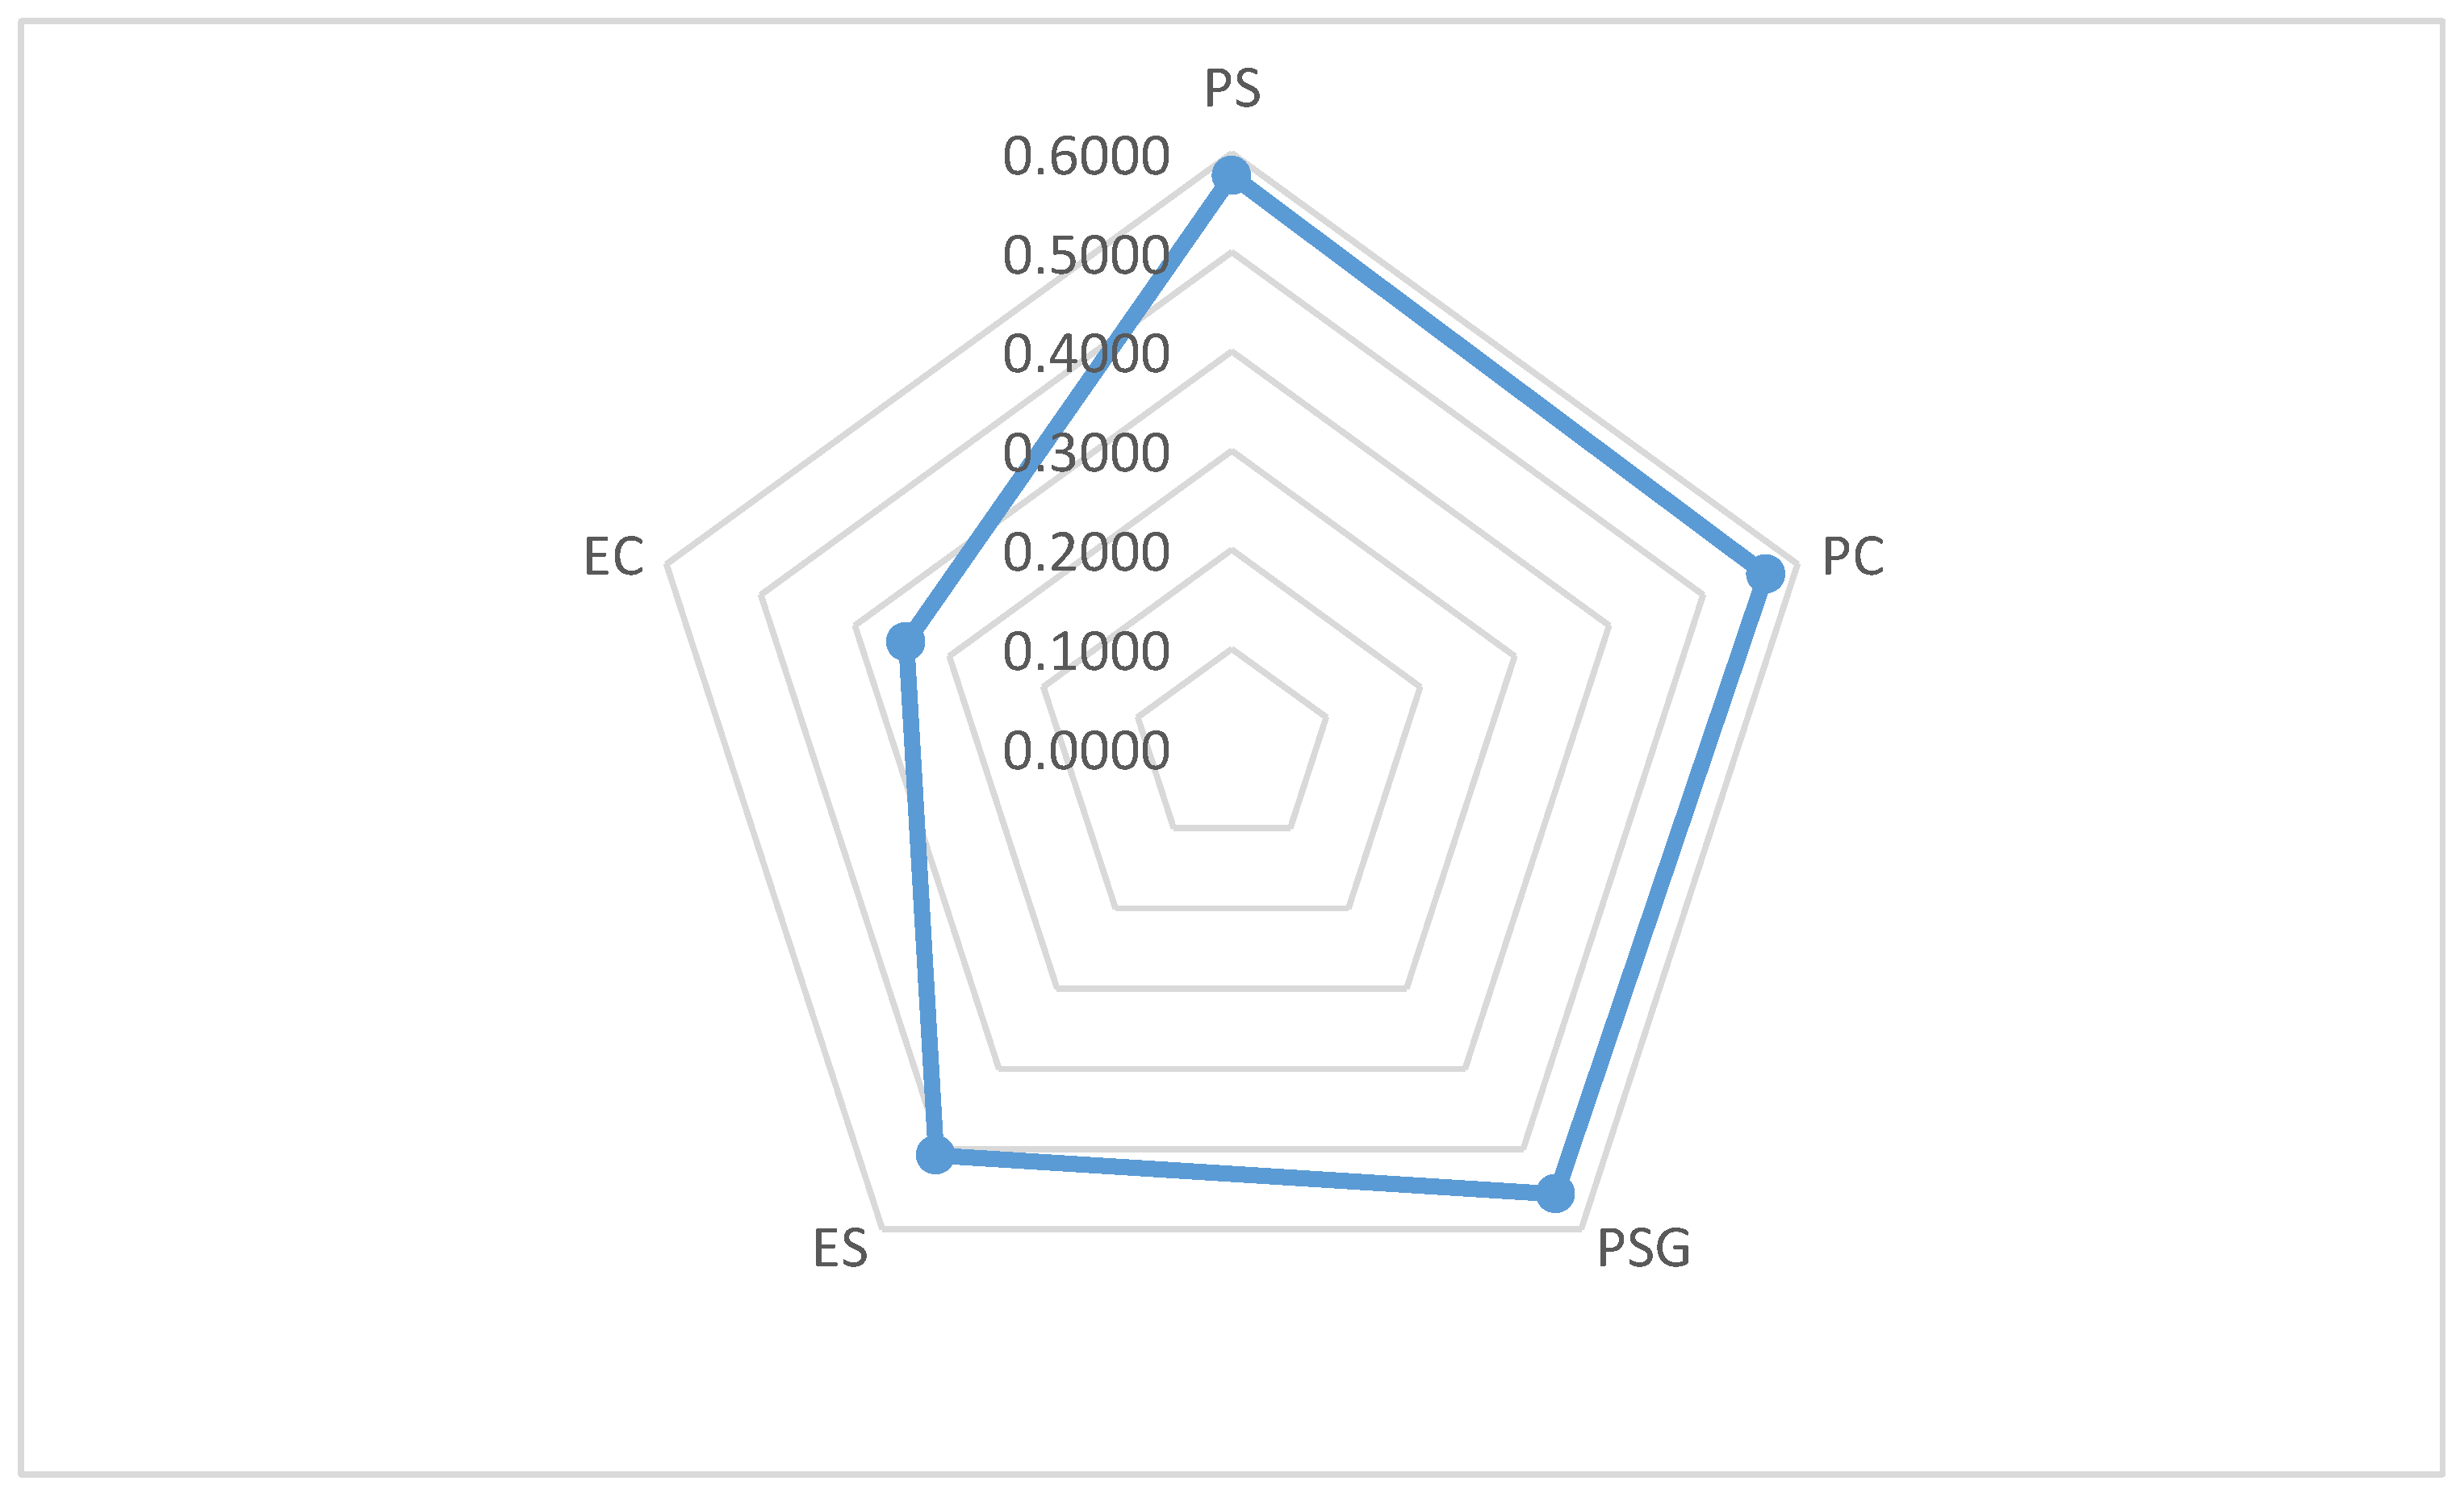
The results obtained for each impact category reveal a significant variation when different management scenarios for pine and eucalyptus are considered (Figure 3). However, as the variation in productivity at the tree growing phase does not influence the ranking of systems as to the potential environmental impacts, it is possible to draw a representation of the performance of each system based on their average productivity, in which systems with the greatest negative environmental impact are closer to the center of the graph (Figure 4).
The system of pine for wood (PS) has the best performance for all impact categories analyzed, except for net emissions. In this last category, the values are negative for all systems, as it is the amount of CO2 sequestered from the atmosphere after discounting the emissions generated by forestry processes; this means that the system with the greatest impact is the best performing system.
The influence of the species is observed when comparing the systems for the production of wood, whose cycle period is the same and for which eucalyptus stands out from pine. According to the results, on average, one hectare of eucalyptus forest managed for commercial purposes sequesters approximately 13 tons of CO2 eq. per year, while the pine forest sequesters ten tons of CO2 eq. per hectare in one year. This is explained by the greater amount of biomass produced by eucalyptus in the same period.
It is also possible to observe the importance of larger cycles for a greater CO2 sequestration when analyzing systems within the same species, but with different purposes. Management practices that provide greater system productivity positively affect the amount of carbon sequestered. As variations were considered in relation to the mean AAI of 30 m3/ha/year for pine and 35 m3/ha/year for eucalyptus, the latter obtained the best performance for both wood and cellulose.
In the ranking established by comparing the potential environmental impacts in one hectare per year of production cycle, all with the same weight, there is a predominance of pine systems over eucalyptus ones, regardless of productivity or purpose of production. However, as there is no system that has the best environmental performance in all indicators, it is worth mentioning that a change in the weight of indicators that make up the environmental criterion could change the ranking of systems and the consequent decision-making.
Although there are similarities in management, the simulated systems for eucalyptus have higher demands for fertilizers, diesel and lubricating oils related to transportation, the latter being proportionally higher in wood systems due to a higher productivity. As the data were also annualized, the eucalyptus system for cellulose was somewhat penalized by the fact that it had soil preparation and management needs identical to the system for producing wood, but with a shorter cycle period. However, this method of comparing systems is valid because, while the pine system for cellulose has a 15-year cycle, the eucalyptus system has two complete cycles in a same period. In this way, consistency is maintained when comparing systems with different productivity and duration periods.
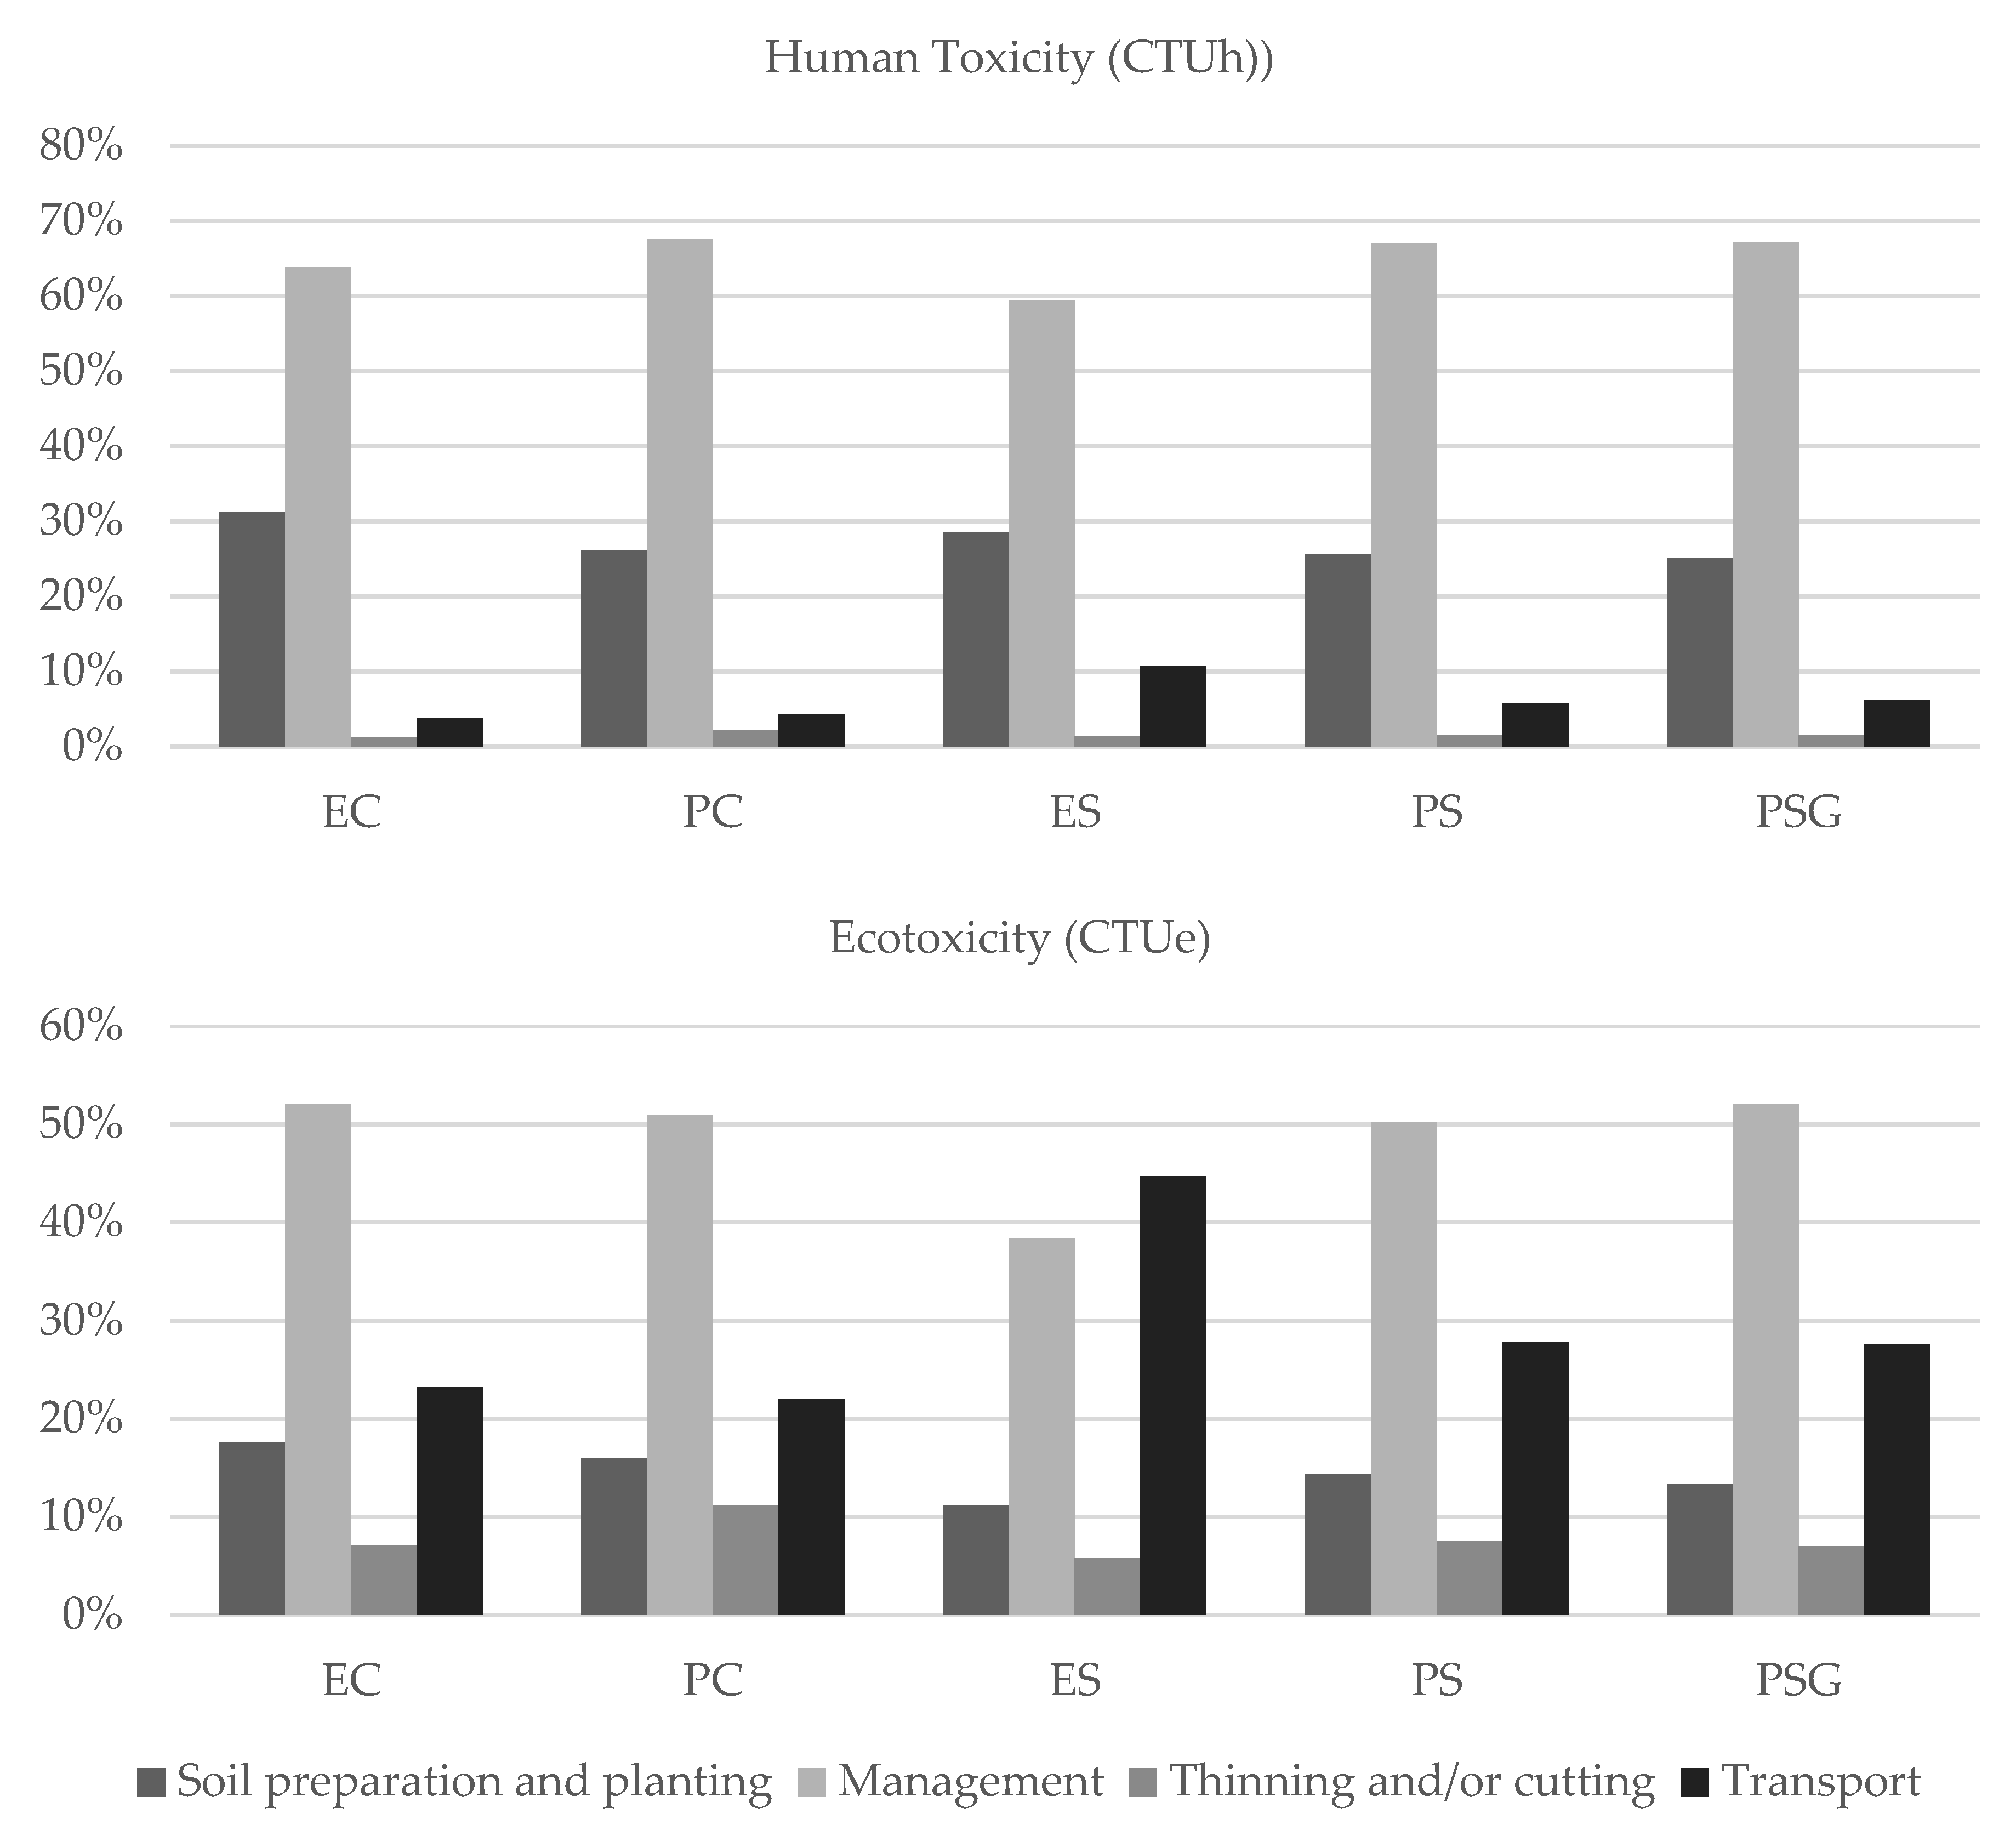
The thinning and cutting activities contribute the least to potential environmental impacts in all categories analyzed (Figure 5). On average, among all systems, the transport activity contributes the most to the category of climate change (34%), followed by management operations (31%). However, this only applies to systems for the production of wood and to the pine system for cellulose. In the EC system, soil preparation and management phases are the major contributors to the total impacts. The lower productivity of this system, compared to the others, in relation to the functional unit used, is the factor that explains this difference.
The sensitivity analysis regarding the productivity of the systems only influenced the transport activity. On average, the potential environmental impacts varied 24% in relation to the minimum and maximum volumes of wood produced. This proportion is significant since transport is the most impacting phase in the categories of photochemical ozone formation (45%), acidification (41%) and climate change (34%) due to the use of fossil fuels. Management influences the most the potential impacts of eutrophication (40%) due to the application of fertilizers, especially those containing nitrogen, and human toxicity (65%) and ecotoxicity (49%), due to the considerable amounts of limestone and herbicide used.
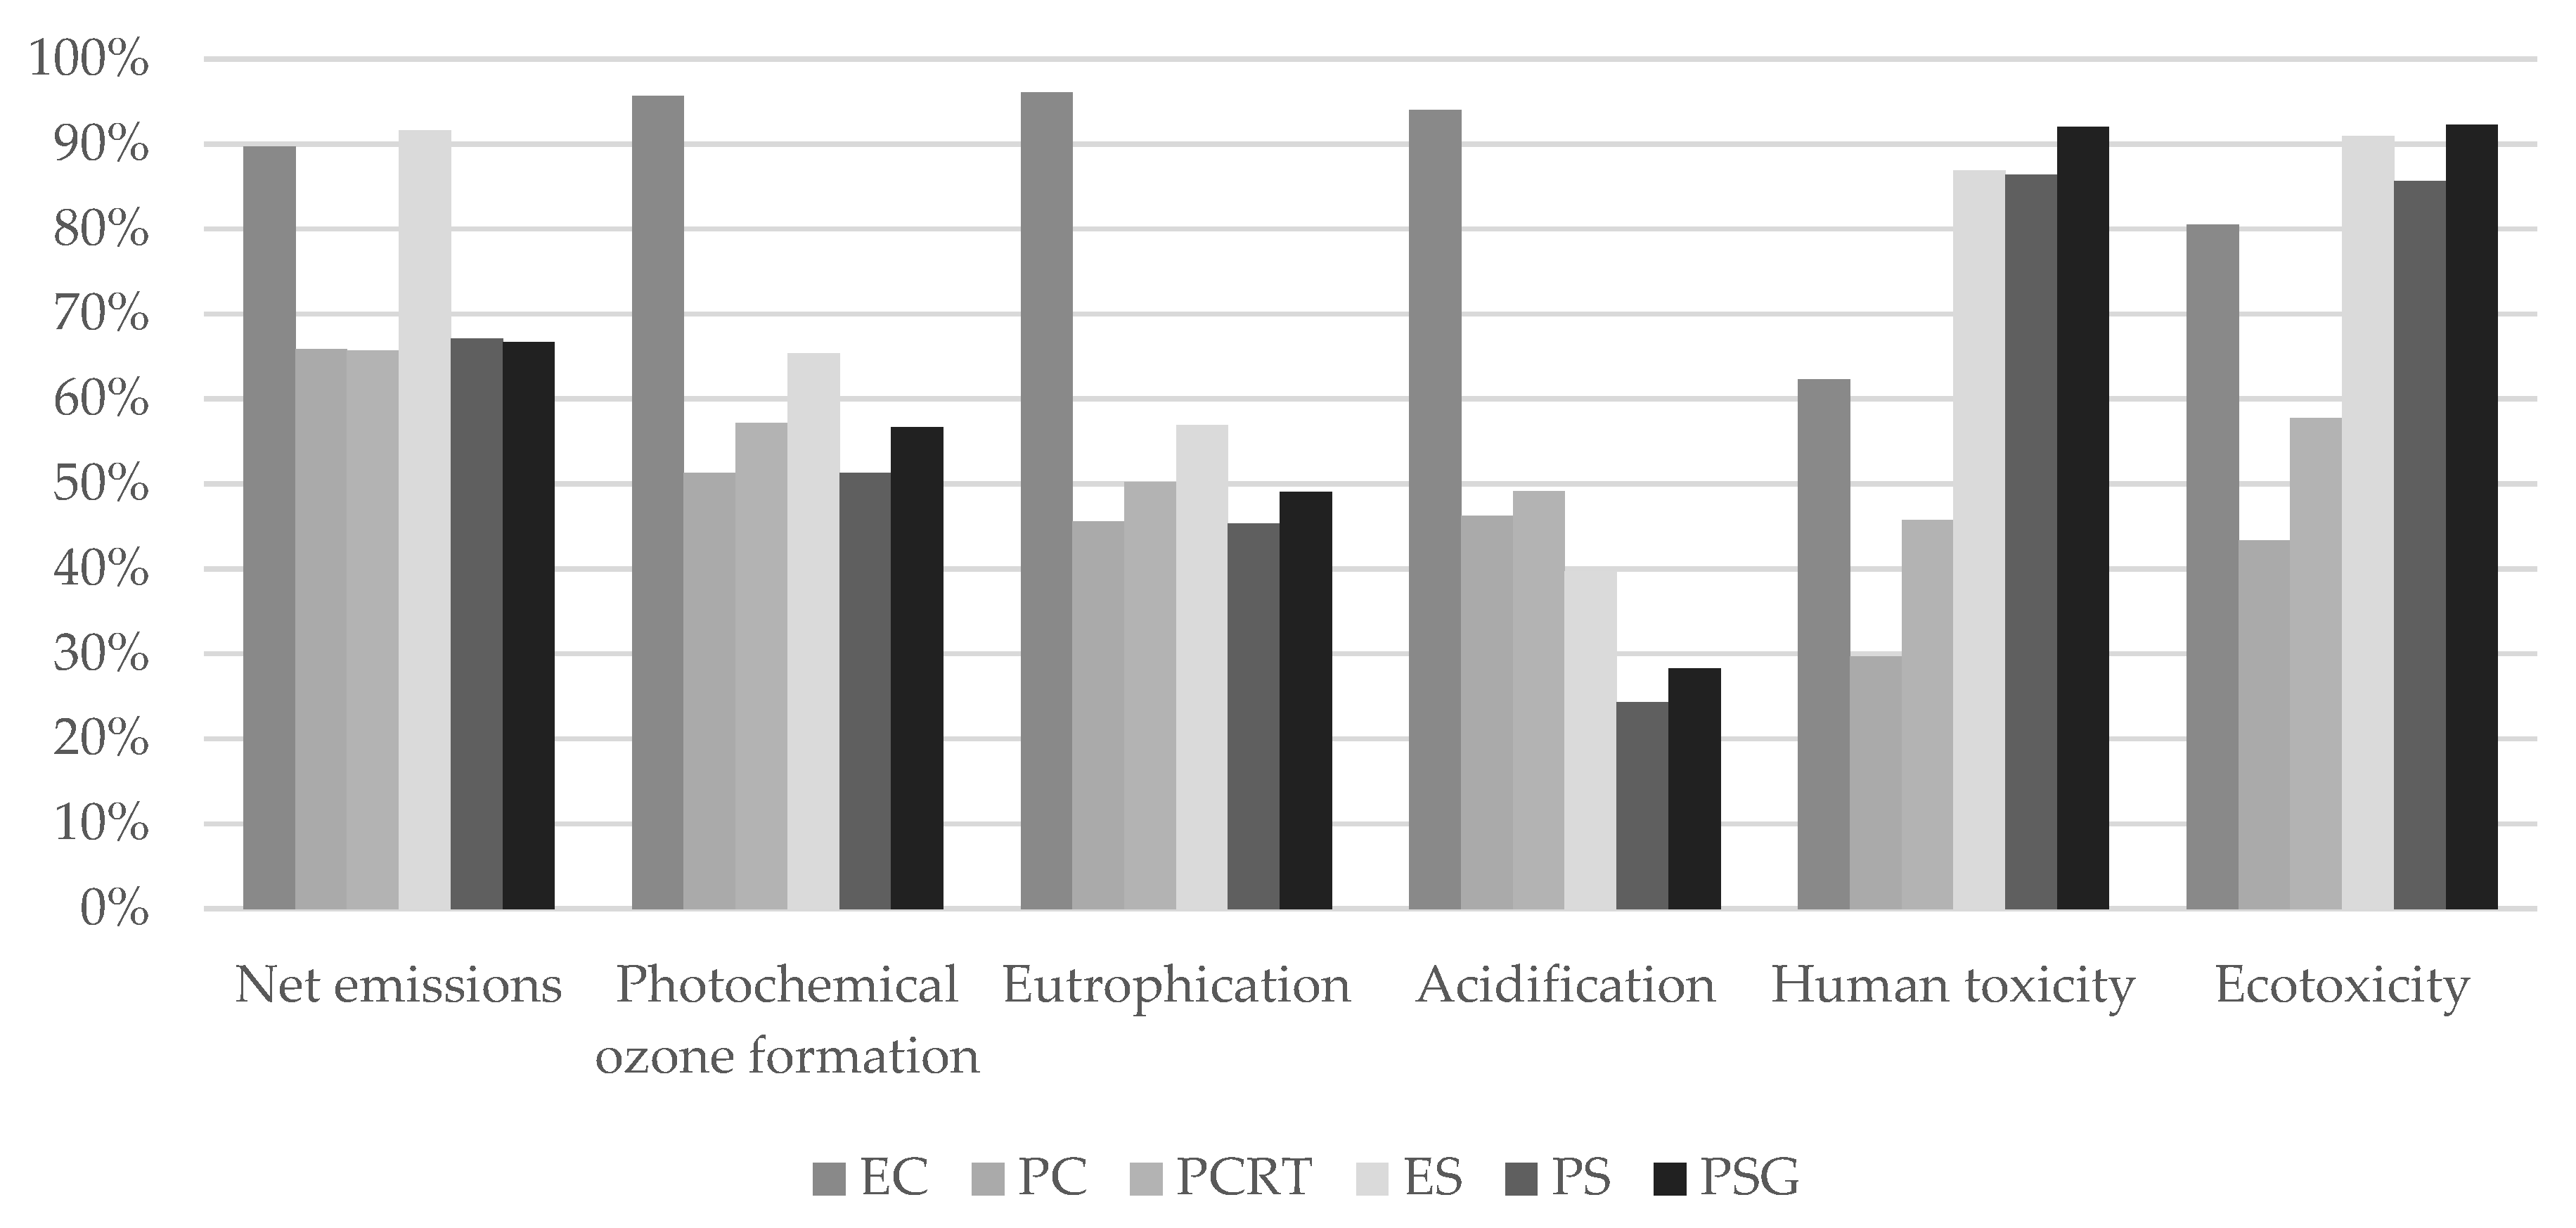
When the agricultural and industrial phases are integrated, the PC and PCRT systems have the best performance regarding the environmental criterion (Figure 6). The eucalyptus cellulose system had the worst performance in relation to photochemical ozone formation, acidification and ecotoxicity, accounting, on average, for 71% in the tree growing phase, the most negatively impacting among all systems, because of the amount of inputs used. However, it should be noted that all systems, even after the integration of the industrial phase, continued to present negative emissions, that is, sequestering more atmospheric CO2 than emitting greenhouse gases.
The systems whose main purpose is the production of pine wood (PM and PRM) stand out in relation to cellulose systems in the categories of human toxicity and ecotoxicity. They have potentially higher environmental impacts in these categories, on average 70% due to the industrial phase, as they have a lower specific consumption factor and produce a greater volume of wood that serves as raw material for the industry, consequently increasing impacts.
It cannot be stated that the agricultural or industrial phase is necessarily the one that most impacts on forest production systems because, in this study, the level of detail of the environmental inventory of the tree growing phase was higher than the industrial phase and the functional unit used can also influence the contribution of each phase, depending on the system and the species. However, the information on the contribution of each phase is useful to explain the results found.

3.1.2. Economic Impacts

Transport is the activity that most impacts costs, representing, on average, 61% of the total cost per hectare of the systems. This phase is directly influenced by productivity because the higher this parameter is, the higher the transport cost. Next, costs with cutting (14%), acquisition of inputs (10%), purchase and use of machinery (10%), and labor (6%) are the most expensive. The exception is the PSG system because it is more labor-intensive due to resin operations, which represents, on average, 38% of the total cost throughout the cycle. The second most relevant cost in this system is transportation (32%), followed by inputs (12%), mechanization (9%), and thinning and cutting (6%).
The revenues were obtained from the assortment of wood production for cellulose, sawmill, rolling mill and energy systems, according to the results of the simulations in the SisPinus and SisEucalipto software. The best economic result in the tree growing phase was obtained for the PSG system, which presented the best performance in all indicators. Although resin extraction activity in pine forest planting incurs more costs, it significantly increases the profitability of the property. Next, the best systems are pine for wood and eucalyptus for cellulose.
The annual profitability index varied from 2.49% to 10.59%, considering the traditional markets for firewood, cellulose, sawmill and rolling wood, and the sale of gum resin, in the case of pine. The sale of carbon credits represented an increase in the API of around 1% and 0.5% for the eucalyptus for cellulose and eucalyptus for sawn wood systems, respectively. For pine systems, the increase is, on average, 0.5%. The increase is less relevant for the PSG system (0.3%), as the revenues from this system are significantly higher than the others. It is worth mentioning that the price used for the simulation of the carbon credit market is an average of the negotiations in 2016 (US$3.3/ton), which is below the largest transactions reported to Ecosystem Marketplace (US$44.8/ton).
These data indicate a potential market that, if explored, may bring important financial results for forestry, especially for eucalyptus plantations. It would benefit more because it has a greater capacity to sequester carbon and, due to the lower revenues compare to pine systems, the relative contribution of the revenue generated by carbon credits is higher.
Despite the assortment of the systems in the industrial stage for the purpose of economic analysis, the entire production of one hectare was intended for the central purpose of each system, which is justified by the fact that, in general, the largest assortment is associated with the main objective of forest management. Considering economic analysis of the industrial phase consists of only one indicator and is not a multicriteria problem, the ranking can be created by a direct comparison of the values obtained.
The system that most generates gross value added (GVA) by industrializing the raw materials generated per hectare in one year is the eucalyptus cellulose industry (EC), followed by the pine cellulose and the production of rosin and turpentine Kraft (PCRT), and pine cellulose only (PC) (Table 4). Excluding sawn wood production, eucalyptus production generates more GVA, which can be influenced by the region in which prices were collected, where this wood is most valued in the market.
However, when the agricultural and industrial phases are added, the best system from an economic point of view is pine for the production of sawn wood and gum resin Eucalyptus sawn wood is the system with the worst performance. Therefore, the influence of the scope is perceived upon analyzing the economic criterion for decision-making.

3.2. Decision-Making Based on Multicriteria Methods

3.2.1. Ranking of Production Systems

The comparison of land use by forests planted for productive purposes was based on environmental and economic criteria. The following were used as indicators for the environmental criterion: net emissions, photochemical ozone formation, acidification, eutrophication, ecotoxicity, and human toxicity. The economic criterion, on the other hand, had as indicators API, API with sale of carbon credits, direct jobs generated (in the tree growing phase), and the GVA (in the industrial phase).
The TOPSIS decision-making algorithm made it possible to create a ranking of systems with various combinations of phases and analyzed criteria, integrating the sensitivity analysis for production volumes. This tool proved very useful to illustrate the relevance of the scope and criteria used in the study of agro-industrial systems and to expand the applicability of results generated by the methods applied for the evaluation of the systems, especially those directed to environmental impacts.
By considering environmental and economic criteria only at the tree growing phase, productivity is a determining factor to increase the efficiency of all systems. However, when integrating the industrial phase, trade-offs are evident in relation to economic and environmental performances (Table 5). Therefore, from a bioeconomic perspective, the broader the scope and the more criteria considered, the greater the complexity of the process of choosing the best system.

3.2.2. Optimization of Land Use

Based on the results obtained with the TOPSIS method, there is no ideal solution for all criteria in all scopes evaluated. As TOPSIS is a non-compensatory method, even the system classified as the best in each ranking can perform significantly higher or lower, in some indicators, in relation to the others with which it is compared. In this way, the preference of decision makers represented by different weights to the indicators deemed as the most relevant could completely modify the ranking result.
Therefore, the optimization aimed to verify that forestry systems should be jointly prioritized to supply the products demanded with the greatest efficiency from an environmental and economic point of view, without necessarily expanding the area where forests are currently cultivated. For that, scenarios were created with different restrictions and weightings of criteria. First, area restrictions were established that represented possible changes in the demand for forest products, being 50% of the planted area for the production of cellulose and 50% for the production of wood, 70% for cellulose and 30% for wood, and 30% for cellulose and 70% for wood.
Efficiency restrictions of 20% and 30% were also inserted, which means that the systems chosen should perform at least 20% or 30% higher than the system with the worst performance in each indicator, respectively. In addition, the environmental and economic criteria were weighted in three different ways, so that they represented scenarios where both had the same weight and scenarios where the economic aspect prevailed over the environmental aspect, and vice versa, in the decision-making of public and private managers.
As can be noted, the generated decision matrix largely corroborated the results obtained by applying Topsis (Figure 7).
Area restrictions alone, or in conjunction with an efficiency restriction of 20%, do not affect the options selected. The best forest plantations for the occupation of the area were pine managed for the production of sawn wood, gum resin and cellulose. The prioritization of the environmental or economic criterion does not change the solutions found to optimize land use under different conditions of restrictions. Only with the increase in the efficiency restriction to 30% the optimized solution starts to insert the eucalyptus system for cellulose production, however with a small share in total area (4%).

4. Discussion

As Dias and Arroja stated [41], it would be inconsistent to make a direct comparison of the potential absolute environmental impacts obtained in this study with others, because of important methodological differences regarding the limits of the systems, functional units and methods of impact attribution. In addition, local specificities, such as management practices and edaphoclimatic conditions, greatly influence the results.
This research differs from others, mainly because of the functional unit used. Most LCA studies on forests consider the volume of wood produced [41]. Due to the purpose of this study, similar as that of Brandao et al. [35], the basis for comparing potential impacts is the per hectare of land in one year, which still makes possible to discuss the various points considered critical for the forestry sector.
The first point refers to carbon balance considering its equivalence to other greenhouse gases. The global warming potential of forestry processes is relatively low in relation to the amount of carbon sequestered by the forest. Even after the integration of the industrial phase, the systems continued to present negative emissions, that is, sequestering more atmospheric CO2 than emitting greenhouse gases.
For this reason, forests are highly important for mitigating emissions and adapting to climate change, either as carbon sinks in forests, or as stocks of forest products [10]. However, as shown in other studies, the amount of carbon sequestered is strongly influenced by species, age of the forest, and the management practices adopted [29,53,54,55,56].
By comparing species in general terms of potential negative environmental impacts, Dias and Arroja [41] also found that, under the same management regime, the production of one m3 ub (under bark) of pine impacts less than eucalyptus in most criteria. According to the authors, this is because pine has a longer cycle, which directly implies less use of machines, fossil fuels and fertilizers in the same period.
In this study, the thinning and cutting processes were the least impactful. This differs from the literature, which points this activity as the most impactful [37,41,57]; however, these studies did not include the transport of logs to the industry.
Nonetheless Gonzáles-García [58] reached the same conclusion by considering the transport of rural property to the industry 90 km away. However, the longer distance take into account in the present work (230 km) may explain this divergence. In any case, the reason why cutting and transport are the activities identified as critical points is the same: the high demand for fossil fuels.
In view of the results obtained, the inputs used in transport and handling are the main contributors to the impact categories analyzed, representing the hotspots of the systems. The identification of these critical points makes it possible to indicate adaptations in the systems in order to improve their environmental performance.
The impacts caused by transportation and most impacts generated by management are due to the use of fossil fuels by trucks and machines. In this regard, a widely discussed alternative is the use of biofuels (including pine resin), but some less conventional options such as black liquor generated by cellulose plants, wood chips and forest waste can also be explored [58].
The types of machines represent another relevant factor. As noted by Barrantes et al. [59], the use of forwarders to load logs, in addition to having a greater operational efficiency, enables an increase in environmental efficiency in all categories compared to the agricultural tractor. As in transportation, the activity optimization by using vehicles with greater capacity and preferably with greater fuel use efficiency is another action that can be investigated to reduce potential environmental impacts.
In terms of management, the main point of action is the rational use of fertilizers [41], in addition to the recycling of nutrients, such as nitrogen, phosphorus and potassium, which are byproducts of cattle farming, for example [60]. Such procedure would be much facilitated in forestry-pasture integration systems [19,61,62].
At the industrial phase, the consumption of fossil fuels, such as diesel, gasoline, LPP fuel oils (low pour point) and electricity, were the main contributors to potential environmental impacts, as already pointed out in studies on the cellulose industry [63] and on the MDP industry (medium-density particleboard) [64]. Replacing fossil energy sources with biomass and forest residues has been suggested, which, depending on the distance from the forest to the industry, the amount needed and the allocation of impacts, can reduce the potential environmental impacts of the industrial phase. From an economic point of view, it has been shown that resin extraction activity in pine forest planting increases costs, but, on the other hand, significantly increases the profitability of the property, as Neves et al. [65] pointed out, in addition to contributing more to the generation of jobs and fixation of people in rural areas. The carbon credit market can also significantly change the economic performance of forestry and be decisive for the adoption of management practices aiming to create a greater carbon sequestration [21,54], with the direct consequence of reducing potential environmental impacts of the economic activity. Thus, the sale of carbon credits can represent an incentive via market to adopt practices aligned with bioeconomy principles, and should therefore be the object of policy drafting and development f mechanisms that facilitate these transactions.
In view of the results of all systems, it is possible to note that, although the financial returns are long-term and depend on variations in plantation productivity, the costs of inputs and labor and the prices of products sold, forestry is a good income generation option for rural producers [11,21,66]. This may also be a more advantageous economic activity for the rural producer in relation to other activities, such as cattle breeding.
The APIs obtained for the agricultural systems of pine and eucalyptus forests were, in most cases, higher than those identified by Florindo et al. [67] for cattle farming south of the region where this study was carried out, where the API was 1.55% for the extensive system and 3.51% for the semi-intensive system. These data reinforce the attractiveness of forestry investments, especially for the east coast region of the state of Mato Grosso do Sul, where cattle farming is practiced generally in extensively and degraded pastures, conditions under which the net present value activity can even be negative [68].
That is why it is recommended that investments in sawmills and pine-based chemical industries be encouraged in the evaluated region. This is an interesting option to improve the forest industry already consolidated in the region, which can provide increases and diversification in the income in soils without agricultural aptitude or even in degraded pastures, as several studies have already demonstrated [69,70,71].

5. Conclusions

The results of this study demonstrate that pine plantations aiming at the production of cellulose, wood and gumresin are the best options to optimize land use, compared to eucalyptus, in the region where the study was carried out. For this reason, it is suggested that rural producers, industries, the government and other decision makers evaluate the market conditions of industries based on planted pine forests as an alternative for the expansion and diversification of the forest productive chain in the Center-West region of Brazil. Investments in pine forestry have the potential to benefit rural producers, increase income and minimize risks by diversifying their activities, in addition to increasing generation of jobs, increasing tax revenues and other indirect positive impacts for the local community.
In forest production systems, the higher the productivity in the tree growing phase, the better the environmental and economic performance. For this reason, it is crucial to invest in high-quality genetic materials, as well as in the qualification of managers and employees, to adopt planned and more efficient management practices.
Due to high growth rate and rapid growth, pine and eucalyptus plantations for commercial multipurposes are of great relevance to mitigate greenhouse gas emissions and promote adaptation to climate change, through carbon sequestration and storage of it in its bioproducts. However, it is possible to improve the environmental performance of these production systems, as together with economic benefits, then some critical points and possible recommendations are highlighted:
  • Fossil fuels are the inputs that contribute the most to different categories of potential environmental impacts. The replacement by cleaner energy sources and the use of more efficient machines, equipment and vehicles is the main solution to improve the environmental and economic performance of the sector.
  • The increase in transport efficiency also collaborates synergistically to increase the financial result, since this operation impacts the total cost of forestry activities in most evaluated systems the most.
  • The sale of carbon credits is another market that, if explored, represents an opportunity to obtain important financial results for forestry, especially in eucalyptus systems, as well as an incentive to adopt more efficient environmental management practices.
  • The cultivation of pine to obtain wood and gum-resin has a high demand for labor, making this component the costliest. Even though the higher demand for labor increases costs, the resin significantly increases the profitability of the property, which makes this system the one with the best economic performance among all evaluated. In addition to the financial results for the forest owner, resin contributes significantly more to the generation of jobs and the fixation of man in the countryside. For this reason, it is essential to have conditions that favor the employment relationship or even the provision of this service to enable this activity., Since employees are often hired individually by the rural producer or company that owns the forest, it would be interesting to create strategies that reduce hiring costs, favor the continuity of the provision of services, and provide greater legal certainty to employment relationships. The creation of companies specialized in the provision of this service or cooperatives organized by rural workers could be alternatives for the solution of labor problems in resin economic operations.
It has also been shown that the integration of multicriteria decision-making methods to life cycle assessment, life cycle cost and analysis of financial and economic indicators is very useful in supporting complex decisions that lead to drafting of public policies aiming at expand the contributionof forestry in bioeconomy context. It should be noted that the functional unit, the scope, the criteria considered, and the weighting of the indicators are important issues that can influence the results among the alternatives being considered. Therefore, researchers and decision makers must carefully analyze these aspects when proposing solutions to a multicriteria problem.

Author Contributions

G.M. and T.F. conceived of the presented idea, performed the analytic calculations and the numerical simulations. E.T. was involved in planning and supervised the work. A.F.N. encouraged G.M. to investigate potencial environmental impacts of forestry and supervised the findings of this work. C.R. verified the analytical methods. All authors discussed the results and contributed to the final manuscript. All authors have read and agreed to the published version of the manuscript.

Funding

This research was funded in part by the Coordination for the Improvement of Higher Education Personnel-Brazil (CAPES)-Finance Code 001.

Conflicts of Interest

The authors declared no conflicts of interest. The funding agencies had no role in the design of the study, collection, analyses or interpretation of data, writing the manuscript or in the decision to publish the results.

References

  1. Ingrao, C.; Bacenetti, J.; Bezama, A.; Blok, V.; Geldermann, J.; Goglio, P.; Zabaniotou, A. Agricultural and forest biomass for food, materials and energy: Bio-economy as the cornerstone to cleaner production and more sustainable consumption patterns for accelerating the transition towards equitable, sustainable, post fossil-carbon societies. J. Clean. Prod. 2016, 117, 4–6. [Google Scholar] [CrossRef] [Green Version]
  2. Kleinschmit, D.; Arts, B.; Giurca, A.; Mustalahti, I.; Sergent, A.; Pülzl, H. Environmental concerns in political bioeconomy discourses. Int. For. Rev. 2017, 19, 41–55. [Google Scholar] [CrossRef]
  3. Mustalahti, I. The responsive bioeconomy: The need for inclusion of citizens and environmental capability in the forest based bioeconomy. J. Clean. Prod. 2018, 172, 3781–3790. [Google Scholar] [CrossRef]
  4. Pülzl, H.; Kleinschmit, D.; Arts, B. Bioeconomy–an emerging meta-discourse affecting forest discourses? Scand. J. For. Res. 2014, 29, 386–393. [Google Scholar] [CrossRef]
  5. Schmidt, O.; Padel, S.; Levidow, L. The bio-economy concept and knowledge base in a public goods and farmer perspective. Bio-Based Appl. Econ. 2012, 1, 47–63. [Google Scholar]
  6. European Comission. Communication from the Commission to the European Parliament, the Council, the European Economic and Social Committee and the Committee of the Regions: Innovating for Sustainable Growth: A Bioeconomy for Europe. Available online: http://ec.europa.eu/research/bioeconomy/pdf/official-strategy_en.pdf (accessed on 14 November 2017).
  7. Costanza, R.; D’Arge, R.; De Groot, R.; Farber, S.; Grasso, M.; Hannon, B.; Raskin, R.G. The value of the world’s ecosystem services and natural capital. Nature 1997, 387, 253–260. [Google Scholar] [CrossRef]
  8. The Economics of Ecosystems and Biodiversity (TEEB). Mainstreaming the Economics of Nature: A Synthesis of the Approach: Conclusions and Recommendations of TEEB. Available online: http://www.teebweb.org/publication/mainstreaming-the-economics-of-nature-a-synthesis-of-the-approach-conclusions-and-recommendations-of-teeb/ (accessed on 22 December 2017).
  9. Ellison, D.; Morris, C.E.; Locatelli, B.; Sheil, D.; Cohen, J.; Murdiyarso, D.; Gaveau, D. Trees, forests and water: Cool insights for a hot world. Glob. Environ. Chang. 2017, 43, 51–61. [Google Scholar] [CrossRef]
  10. Food and Agriculture Organization of the United Nations (FAO). Forestry for a Low-Carbon Future: Integrating Forests and Wood Products in Climate Change Strategies 2016. Available online: http://www.fao.org/3/a-i5857e.pdf (accessed on 19 October 2016).
  11. Diaz-Balteiro, L.; Alfranca, O.; González-Pachón, J.; Romero, C. Ranking of industrial forest plantations in terms of sustainability: A multicriteria approach. J. Environ. Manag. 2016, 180, 123–132. [Google Scholar] [CrossRef]
  12. Turner, J.A.; Dhakal, B.; Yao, R.; Barnard, T.; Maunder, C. Non-timber values from planted forests: Recreation in Whakarewarewa forest. N. Z. J. For. 2011, 55, 24–31. [Google Scholar]
  13. Boxall, P.C.; Adamowicz, W.L.; Swait, J.; Williams, M.; Louviere, J. A comparison of stated preference methods for environmental valuation. Ecol. Econ. 1996, 18, 243–253. [Google Scholar] [CrossRef]
  14. Winjobi, O.; Shonnard, D.R.; Bar-Ziv, E.; Zhou, W. Techno-economic assessment of the effect of torrefaction on fast pyrolysis of pine. Biofuels Bioprod. Biorefin. 2016, 10, 117–128. [Google Scholar] [CrossRef]
  15. Daystar, J.; Treasure, T.; Reeb, C.; Venditti, R.; Gonzalez, R.; Kelley, S. Environmental impacts of bioethanol using the NREL biochemical conversion route: Multivariate analysis and single score results. Biofuels Bioprod. Biorefin. 2015, 9, 484–500. [Google Scholar] [CrossRef]
  16. Tran, N.; Illukpitiya, P.; Yanagida, J.F.; Ogoshi, R. Optimizing biofuel production: An economic analysis for selected biofuel feedstock production in Hawaii. Biomass Bioenergy 2011, 35, 1756–1764. [Google Scholar] [CrossRef]
  17. Grison, K.; Pistor, V.; Scienza, L.C.; Zattera, A.J. The physical perspective on the solid and molten states associated with the mechanical properties of eco-friendly HDPE/P inus taeda wood-plastic composites. J. Appl. Polym. Sci. 2016, 133. [Google Scholar] [CrossRef]
  18. Victor, A.; Pulidindi, I.N.; Gedanken, A. Levulinic acid production from Cicer arietinum, cotton, Pinus radiata and sugarcane bagasse. RSC Adv. 2014, 4, 44706–44711. [Google Scholar] [CrossRef]
  19. Rodrigues-Corrêa, K.C.D.S.; de Lima, J.C.; Fett-Neto, A.G. Pine oleoresin: Tapping green chemicals, biofuels, food protection, and carbon sequestration from multipurpose trees. Food Energy Secur. 2012, 1, 81–93. [Google Scholar] [CrossRef]
  20. Ohlström, M.; Mäkinen, T.; Laurikko, J.; Pipatti, R. New Concepts for Biofuels in Transportation: Biomass-Based Methanol Production and Reduced Emissions in Advanced Vehicles. Available online: https://cris.vtt.fi/en/publications/new-concepts-for-biofuels-in-transportation-biomass-based-methano (accessed on 12 November 2018).
  21. Pirard, R.; Petit, H.; Baral, H. Local impacts of industrial tree plantations: An empirical analysis in Indonesia across plantation types. Land Use Policy 2017, 60, 242–253. [Google Scholar] [CrossRef] [Green Version]
  22. Food and Agriculture Organization of the United Nations (FAO). Global Forest Resources Assessment 2005. Available online: http://www.fao.org/docrep/008/a0400e/a0400e00.htm (accessed on 28 November 2016).
  23. Food and Agriculture Organization of the United Nations (FAO). Global Forest Resources Assessment 2015. Available online: http://www.fao.org/3/a-i4808e.pdf (accessed on 15 October 2016).
  24. Food and Agriculture Organization of the United Nations (FAO). Global Forest Resources Assessment 2010. Available online: http://www.fao.org/docrep/013/i1757e/i1757e.pdf (accessed on 7 November 2016).
  25. Baral, S.; Chhetri, B.B.K.; Baral, H.; Vacik, H. Investments in different taxonomies of goods: What should Nepal’s community forest user groups prioritize? For. Policy Econ. 2019, 100, 24–32. [Google Scholar] [CrossRef]
  26. Indufor. Strategic Review on the Future of Forest Plantations in the World 2012. Available online: http://www.fao.org/forestry/42701-090e8a9fd4969cb334b2ae7957d7b1505.pdf (accessed on 26 March 2017).
  27. Dodet, M.; Collet, C. When should exotic forest plantation tree species be considered as an invasive threat and how should we treat them? Biol. Invasions 2012, 14, 1765–1778. [Google Scholar] [CrossRef]
  28. Lorentz, K.A.; Minogue, P.J. Exotic Eucalyptus plantations in the southeastern US: Risk assessment, management and policy approaches. Biol. Invasions 2015, 17, 1581–1593. [Google Scholar] [CrossRef]
  29. Cademus, R.; Escobedo, F.J.; McLaughlin, D.; Abd-Elrahman, A. Analyzing trade-offs, synergies, and drivers among timber production, carbon sequestration, and water yield in Pinus elliotii forests in southeastern USA. Forests 2014, 5, 1409–1431. [Google Scholar] [CrossRef] [Green Version]
  30. Vance, E.D.; Loehle, C.; Wigley, T.B.; Weatherford, P. Scientific basis for sustainable management of Eucalyptus and Populus as short-rotation woody crops in the US. Forests 2014, 5, 901–918. [Google Scholar] [CrossRef]
  31. Kröger, M. The expansion of industrial tree plantations and dispossession in Brazil. Dev. Chang. 2012, 43, 947–973. [Google Scholar] [CrossRef] [Green Version]
  32. Moreira, J.M.M.Á.P.; Simioni, F.J.; de Oliveira, E.B. Importância e desempenho das florestas plantadas no contexto do agronegócio brasileiro. Floresta 2017, 47, 85–94. [Google Scholar] [CrossRef] [Green Version]
  33. Oliveira, Y.M.M.; Oliveira, E.B. Plantações Florestais: Geração de Benefícios com Baixo Impacto Ambiental. Available online: http://www.alice.cnptia.embrapa.br/alice/handle/doc/1076130 (accessed on 31 October 2019).
  34. Smith, P.; Bustamante, M.; Ahammad, H.; Clark, H.; Dong, H.; Elsiddig, E.A.; Masera, O. Agriculture, forestry and other land use (AFOLU). In Climate Change 2014: Mitigation of Climate Change. Contribution of Working Group III to the Fifth Assessment Report of the Intergovernmental Panel on Climate Change; Cambridge University Press: Cambridge, UK, 2014; pp. 811–922. [Google Scholar]
  35. Brandão, M.; Clift, R.; Basson, L. A life-cycle approach to characterising environmental and economic impacts of multifunctional land-use systems: An integrated assessment in the UK. Sustainability 2010, 2, 3747–3776. [Google Scholar] [CrossRef] [Green Version]
  36. Governo do Estado de Mato Grosso do Sul. Plano Estadual para o Desenvolvimento de Florestas Plantadas: Relatório Final. Available online: https://m.sebrae.com.br/Sebrae/Portal%20Sebrae/UFs/MS/Estudos%20e%20Pesquisas/Plano%20Estadual%20para%20Desenvolvimento%20Economico%20de%20Florestas%20Plantadas.pdf (accessed on 23 November 2019).
  37. González-García, S.; Dias, A.C.; Feijoo, G.; Moreira, M.T.; Arroja, L. Divergences on the environmental impact associated to the production of maritime pine wood in Europe: French and Portuguese case studies. Sci. Total Environ. 2014, 472, 324–337. [Google Scholar] [CrossRef] [PubMed]
  38. Governo do Estado de Mato Grosso do Sul. Caderno Geoambiental. Available online: http://www.semade.ms.gov.br/caderno-geoambiental/ (accessed on 3 May 2017).
  39. Climate-Data. Clima: Ribas do Rio Pardo. Available online: https://pt.climate-data.org/location/43544/ (accessed on 3 May 2017).
  40. Indústria Brasileira de Árvores (IBÁ). Relatório Anual 2017. Available online: http://iba.org/images/shared/Biblioteca/IBA_RelatorioAnual2017.pdf (accessed on 13 April 2017).
  41. Dias, A.C.; Arroja, L. Environmental impacts of eucalypt and maritime pine wood production in Portugal. J. Clean. Prod. 2012, 37, 368–376. [Google Scholar] [CrossRef]
  42. Rosenbaum, R.K.; Bachmann, T.M.; Gold, L.S.; Huijbregts, M.A.; Jolliet, O.; Juraske, R.; McKone, T.E. USEtox—the UNEP-SETAC toxicity model: Recommended characterisation factors for human toxicity and freshwater ecotoxicity in life cycle impact assessment. Int. J. Life Cycle Assess. 2008, 13, 532. [Google Scholar] [CrossRef] [Green Version]
  43. Guinée, J.B.; Gorrée, M.; Heijungs, R.; Huppes, G.; Kleijn, R.; de Koning, A.; de Bruijn, H. Life Cycle Assessment: An Operational Guide to the ISO Standards. 2001. Available online: http://www.leidenuniv.nl/interfac/cml/lca2/ (accessed on 15 August 2017).
  44. Intergovernmental Panel on Climate Change (IPCC). IPCC Guidelines for National Greenhouse Gas Inventories. Available online: http://www.ipcc-nggip.iges.or.jp/public/2006gl/vol4.html (accessed on 23 April 2017).
  45. Franco, A.L.; Galli, O.C. Método para Análise de Investimentos: Alternativa para Classificação de Projetos com Prazo e Volume de Recursos Diferentes. Available online: http://www.abepro.org.br/biblioteca/enegep2007_TR590447_9837.pdf (accessed on 14 April 2018).
  46. Ecosystem Marketplace. Raising Ambition State of the Voluntary Carbon Markets 2016. Available online: http://www.forest-trends.org/documents/files/doc_5242.pdf (accessed on 25 September 2017).
  47. Almeida, A.T. O Conhecimento e o uso de Métodos Multicritério de Apoio a Decisão, 2nd ed.; Recife, Ed.; Editora Universitária da UFPE: Recife, Brazil, 2011. [Google Scholar]
  48. Baral, S.; Khadka, C.; Vacik, H. Using MCA tools for evaluating community-managed forests from a green economy perspective: Lessons from Nepal. Int. J. Sustain. Dev. World Ecol. 2019, 26, 672–683. [Google Scholar] [CrossRef]
  49. Tzeng, G.H.; Huang, J.J. Multiple Attribute Decision Making: Methods and Applications; CRC Press: Boca Raton, FL, USA, 2011. [Google Scholar]
  50. Sampaio, P.R. Teoria, Métodos e Aplicações de Otimização Multiobjetivo. Ph.D. Thesis, Programa de mestrado em Ciência da Computação, Universidade de São Paulo, São Paulo, Brazil, 2011. [Google Scholar]
  51. Ragsdale, C.T. Modelagem e Análise de Decisão; Cengage Learning: São Paulo, Brazil, 2009. [Google Scholar]
  52. Antunes, C.; Alves, M. Programação linear multiobjetivo-métodos interativos e software. In Anais do Congreso Latino-Iberoamericano de Investigación Operativa; Pontificia Universidad Católica de Chile: Santiago, Chile, 2012; pp. 4725–4736. [Google Scholar]
  53. Álvarez, S.; Rubio, A. Carbon Baseline in a mixed pine-oak forest in the Juarez mountain range (Oaxaca, Mexico) using the CO2FIX v. 3.2 model. Rev. Chapingo. Ser. Cienc. For. Ambiente 2013, 19, 125–137. [Google Scholar]
  54. Chatterjee, A.; Mooney, S.; Vance, G.F. Comparisons of carbon pools and economic profitability for managed ponderosa pine stands in Wyoming, USA. J. For. Res. 2010, 21, 482–486. [Google Scholar] [CrossRef] [Green Version]
  55. Pérez, S.; Renedo, C.J.; Ortiz, A.; Manana, M. Energy potential of waste from 10 forest species in the North of Spain (Cantabria). Bioresour. Technol. 2008, 99, 6339–6345. [Google Scholar] [CrossRef] [PubMed]
  56. Thomas, S.C.; Malczewski, G.; Saprunoff, M. Assessing the potential of native tree species for carbon sequestration forestry in Northeast China. J. Environ. Manag. 2007, 85, 663–671. [Google Scholar] [CrossRef] [PubMed]
  57. Morales, M.; Aroca, G.; Rubilar, R.; Acuna, E.; Mola-Yudego, B.; González-García, S. Cradle-to-gate life cycle assessment of Eucalyptus globulus short rotation plantations in Chile. J. Clean. Prod. 2015, 99, 239–249. [Google Scholar] [CrossRef]
  58. Gonzalez-Garcia, S.; Berg, S.; Moreira, M.T.; Feijoo, G. Evaluation of forest operations in Spanish eucalypt plantations under a life cycle assessment perspective. Scand. J. For. Res. 2009, 24, 160–172. [Google Scholar] [CrossRef]
  59. Barrantes, L.; Matsuura, M.D.S.; Moreira, J.; Ugaya, C. Avaliação do ciclo de vida da madeira de eucalipto para produção de energia no Brasil. In Embrapa Meio Ambiente-Artigo em anais de Congresso (ALICE), Congresso Brasileiro em Gestão do Ciclo de Vida; Associação Brasileira de Ciclo de Vida: Fortaleza, Brasil, 2016; Volume 5, pp. 384–390. [Google Scholar]
  60. Cowling, E.B.; Furiness, C.S. Potentials for win-win alliances among animal agriculture and forest products industries: Application of the principles of industrial ecology and sustainable development. Sci. China Ser. C Life Sci. 2005, 48, 697–709. [Google Scholar]
  61. Ferraz, S.F.B.; Lima, W.P.; Rodrigues, C.B. Managing forest plantation landscapes for water conservation. Forest ecology and management. Amsterdã 2013, 301, 58–66. [Google Scholar]
  62. Stewart, H.T.; Race, D.H.; Curtis, A.L.; Stewart, A.J. A case study of socio-economic returns from farm forestry and agriculture in south-east Australia during 1993–2007. For. Policy Econ. 2011, 13, 390–395. [Google Scholar] [CrossRef]
  63. Silva, D.A.L.; Pavan, A.L.R.; de Oliveira, J.A.; Ometto, A.R. Life cycle assessment of offset paper production in Brazil: Hotspots and cleaner production alternatives. J. Clean. Prod. 2015, 93, 222–233. [Google Scholar] [CrossRef]
  64. Silva, D.A.L. Avaliação do Ciclo de Vida da Produção do Painel de Madeira MDP no Brasil. Available online: www.teses.usp.br/teses/disponiveis/88/88131/tde-31072012-121351/pt-br.php (accessed on 2 August 2017).
  65. Neves, G.A. Análise Econômico-Financeira da Exploração de Pinus Resinífero em Pequenos Módulos Rurais. Available online: http://www.ipef.br/servicos/teses/arquivos/neves,ga.pdf (accessed on 16 October 2017).
  66. Bukenya, M.; Johnsen, F.H.; Gombya-Ssembajjwe, W.S. Environmental and exchange entitlements from Eucalyptus woodlots: The case of Mukono district in Uganda. For. Trees Livelihoods 2009, 19, 3–17. [Google Scholar] [CrossRef]
  67. Florindo, T.J.; Medeiros, G.I.B.; Talamini, E.; da Costa, J.S.; Ruviaro, C.F. Carbon footprint and Life Cycle Costing of beef cattle in the Brazilian midwest. J. Clean. Prod. 2017, 147, 119–129. [Google Scholar] [CrossRef]
  68. Oliveira Silva, R.; Barioni, L.G.; Hall, J.J.; Moretti, A.C.; Veloso, R.F.; Alexander, P.; Moran, D. Sustainable intensification of Brazilian livestock production through optimized pasture restoration. Agric. Syst. 2017, 153, 201–211. [Google Scholar] [CrossRef]
  69. Chen, Y.L.; Liu, R.J.; Bi, Y.L.; Feng, G. Use of mycorrhizal fungi for forest plantations and minesite rehabilitation. In Mycorrhizal Fungi: Use in Sustainable Agriculture and Land Restoration; Springer: Berlin/Heidelberg, Germany, 2014; pp. 325–355. [Google Scholar]
  70. Knoke, T.; Bendix, J.; Pohle, P.; Hamer, U.; Hildebrandt, P.; Roos, K.; Silva, B. Afforestation or intense pasturing improve the ecological and economic value of abandoned tropical farmlands. Nat. Commun. 2014, 5, 1–12. [Google Scholar] [CrossRef] [PubMed] [Green Version]
  71. Toro, J.; Gessel, S.P. Radiata pine plantations in Chile. In Planted Forests: Contributions to the Quest for Sustainable Societies; Springer: Dodlek, The Netherlands, 1999; pp. 393–404. [Google Scholar]
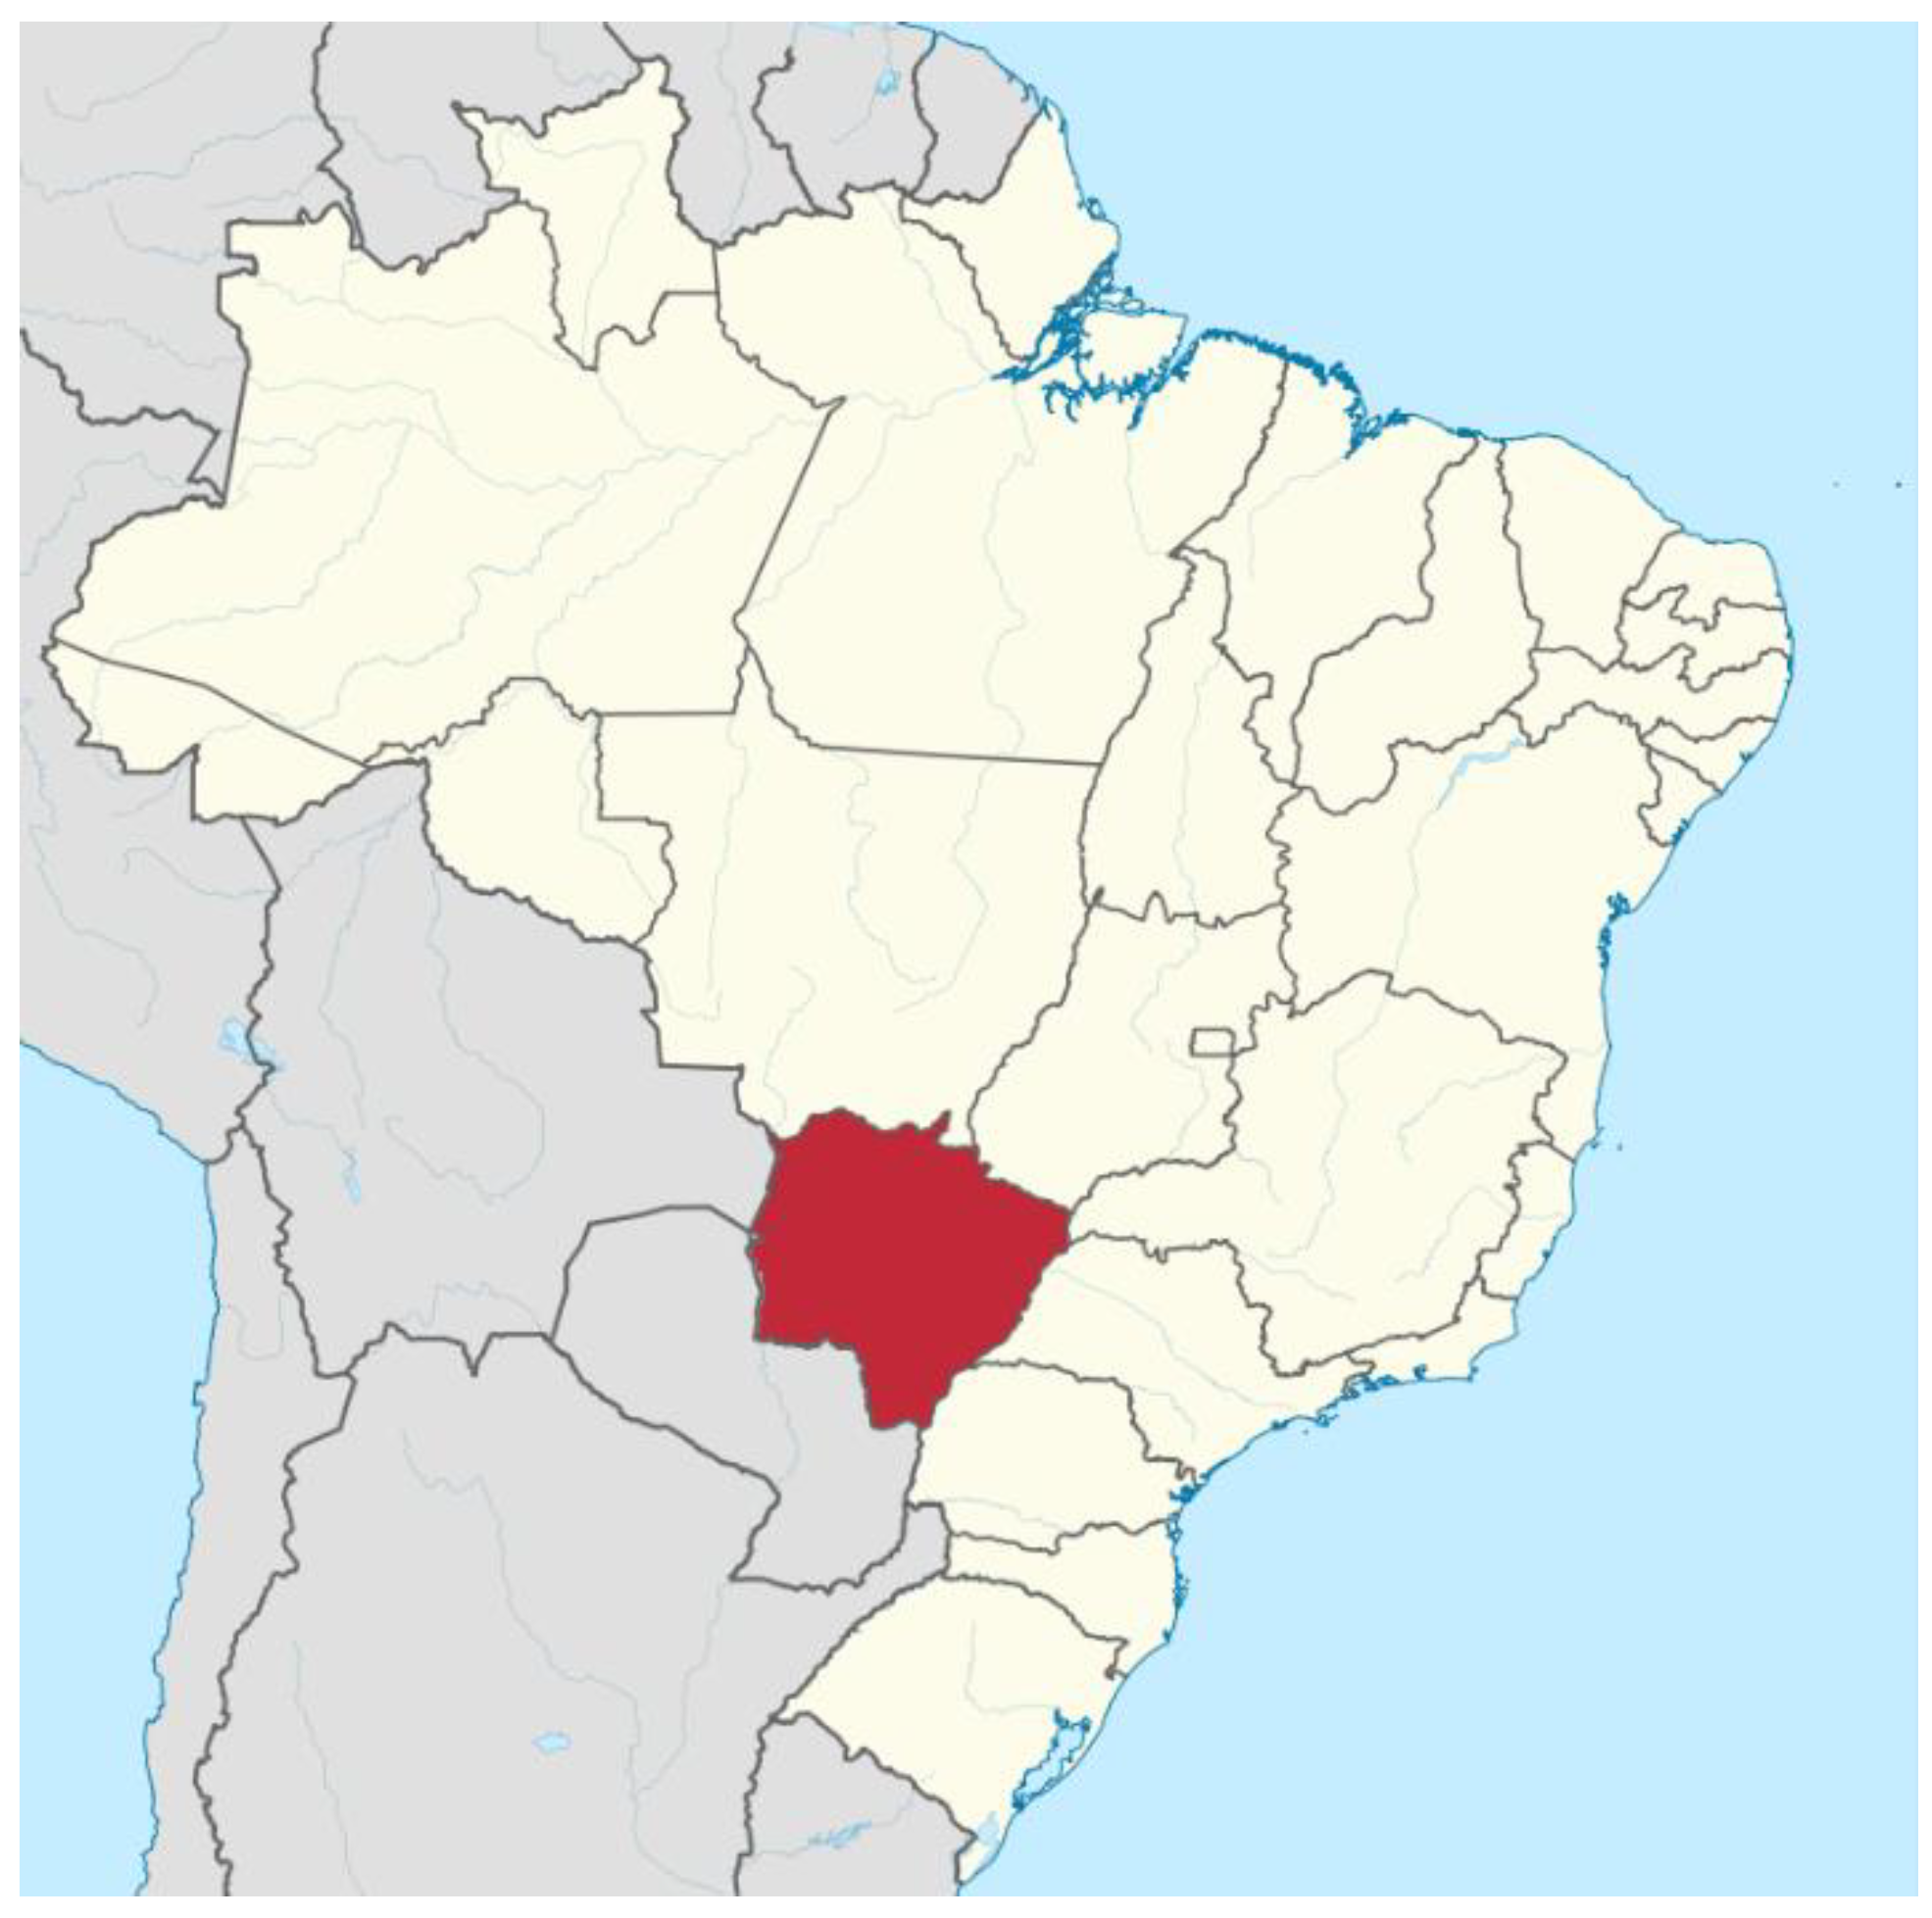
Figure 1. State of Mato Grosso do Sul in which the property studied was located, within the Center-West region of Brazil.
Forests 11 00723 g001
Figure 2. Scope of the study.
Forests 11 00723 g002
Figure 3. Potential environmental impacts of the tree growing phase. Net emissions: negative values.
Forests 11 00723 g003
Figure 4. Comparison of systems by potential environmental impacts of the tree growing phase.
Forests 11 00723 g004
Figure 5. Contribution of each activity to the category of potential impacts: climate change, photochemical ozone formation, eutrophication, acidification, human toxicity, ecotoxicity.
Forests 11 00723 g005aForests 11 00723 g005b
Figure 6. Potential environmental impacts after the integration of the agricultural and industrial phases. Net emissions: negative values.
Forests 11 00723 g006
Figure 7. Decision matrix for land use optimization. En = Environmental criteria. Ec = Economic criteria.
Forests 11 00723 g007
Table 1. Description of production systems.
SystemProduction Purpose(s)SpacingDensity (ha−1)
ECEucalyptus for cellulose3.4 m × 2.3 m1300
PCPine for cellulose3 m × 1.5 m2222
ESEucalyptus for sawn wood3 m × 2 m1667
PSPine for sawn wood3 m × 2 m1667
PSGPine for sawn wood and gum resin3 m × 2 m1667
Table 2. Management and production volume of the systems.
SystemWood Production by Thinning and Cutting (m3)Total Production (m3)MAI * (m3/ha/year)
7 Years8 Years12 Years14 Years15 Years16 Years21 Years
ECMIN217.3 217.331
MAX269.1 269.138.4
AVG242.6 242.634.7
PCMIN 398.2 398.226.5
MAX 508 50833.9
AVG 453.3 453.330.2
ESMIN99.9 141 428.166931.9
MAX119.1 172 512.3803.438.3
AVG109.5 156.4 470.5736.435.1
PSMIN 53.165 124.6321563.726.8
MAX 69.583 156.6399.6708.733.7
AVG 61.273.9 140.4360635.530.3
PSGMIN 52.250.7 462.6565.526.9
MAX 71.662.6 569.1703.333.5
AVG 61.757 515.8634.530.2
* MAI: Mean Annual Increment.
Table 3. Evaluation of financial indicators.
SystemRevenue (US$) 1Costs (US$) 1API (%) 2Revenue C (US$ ) 1,3API C (%) 3
EC6192.804058.656.906417.327.85
PC10,035.284872.725.5210,384.886.13
ES18,091.2410,417.432.7018,772.773.19
PS18,801.686271.118.2319,301.288.77
PSG30,918.4111,451.559.5331,416.099.85
1 Values based on the price of the dollar on 13 February 2020 (US$1 = R$4.34). 2 Annualized profitability index (API). 3 Revenue and API plus the sale of carbon credits.
Table 4. Gross value added (GVA) generated by the industrial phase of production systems.
SystemGross Value Added (GVA)
(US$)
Annual GVA
(US$)
EC25,767.053681.11
PC40,434.792695.62
PCRT42,092.402806.22
ES12,724.19605.99
PS7390.78351.84
PSG16,178.57770.51
Table 5. Ranking of production systems considering the agricultural and industrial phases.
RankingCriterium
EnvironmentalEconomicEnvironmental + Economic
1stPCPSGPC
2ndPCRTECPSG
3rdPSPCRTPCRT
4thESPCEC
5thPSGPSPS
6thECESES