Article

Urban Green Space Accessibility and Distribution Equity in an Arid Oasis City: Urumqi, China

1
College of Resources and Environmental Science, Ministry of Education Key Laboratory of Oasis Ecology, Xinjiang University, Urumqi 830046, China
2
Faculty of Forest and Environment, Eberswalde University for Sustainable Development, 16225 Eberswalde, Germany
3
College of Tourism, Xinjiang University, Urumqi 830046, China
*
Author to whom correspondence should be addressed.
Forests 2020, 11(6), 690; https://doi.org/10.3390/f11060690
Submission received: 24 April 2020 / Revised: 22 May 2020 / Accepted: 14 June 2020 / Published: 18 June 2020
(This article belongs to the Special Issue Nature-Based Solutions in Urban Forestry Planning and Management)

Abstract

:
Urban green space (UGS) is crucial to the healthy development of urban residents. However, UGS that is accessible can benefit residents to an even greater degree. Based on the two-step floating catchment area model (2SFCA) and the location quotient (LQ), we analyzed the changes from 1999 to 2019 in UGS walking accessibility and equity in built-up areas of Urumqi at different administrative levels, and how UGS policy affects the improvement of accessibility. The results showed that UGS accessibility and equity are not evenly distributed at different administrative levels and UGS categories. Although the overall UGS accessibility and equity has improved with policy implementation, these changes are caused by metro-level UGS construction in urban fringe areas. The improvement in UGS accessibility at the neighborhood level in densely populated areas is neglected, which leads to a mismatch between UGS construction and population distribution. In addition, the accessibility of UGS is also limited by geographical location, population density, road distribution, and water shortage in arid metropolitan Urumqi. Our research results provide a theoretical basis for Urumqi and other cities in the optimization of UGS structure and the realization of social equity.

1. Introduction

Urban green space (UGS) is an urban area with natural and artificial vegetation as the main existing forms [1]. UGS is of wide concern because it provides many ecosystem services (ESs). Numerous studies have confirmed the multifunctionality as well as the economic, ecological, environment, recreation, and health benefits of UGS [2].
Although UGS provides many benefits, residents can enjoy more benefits from accessible UGS [3]. With the intensification of the urbanization, UGS is being replaced by built-up area, which threatens the well-being of residents, especially in developing countries [4,5]. Meanwhile, UGS construction often emphasizes scale and quantity, and pays little attention to the UGS distribution and residents’ demand, which decreases the UGS accessibility and equity [4]. The United Nations Sustainable Development Goals (Goals 3, 10, and 11) are strengthening inclusive and sustainable urban development in all countries, reducing inequalities, aiming to meet the needs of different populations by 2030 [6]. In this context, the accessibility of UGS has become an important issue of social justice.
The accessibility of UGS refers to the degree of difficulty for residents to go to the UGS [2]. The accessibility of a UGS determines the impact of UGS on residents’ well-being to a large extent, and it is an important bridge connecting UGS and residents’ well-being. In recent years, the accessibility of UGS has been increasingly considered [7]. Based on the Web of Science database, we used “accessibility” and “urban green” or “urban green space” or “UGS” or “urban park” as the retrieval terms to retrieve 152 studies related to UGS accessibility, and found that the early studies mainly focused on four aspects: (1) the characteristics of spatial distribution of UGS accessibility [8,9], (2) the relationship between the accessibility of UGS and the attributes of residents [10,11], (3) the relationship between the accessibility of UGS and the means of travel [12], and (4) the influence of UGS accessibility on the health of residents [13,14]. Although previous studies have evaluated the accessibility of UGS and its influencing factors, which can provide a basis for the future planning and management of UGS, some problems still need to be further addressed. Firstly, in addition to the above factors, UGS accessibility and equity are also affected by regional urbanization level, UGS policy and population growth [15]. However, few studies have explored the dynamic changes in UGS accessibility and equity with these policies on a time scale, and further evaluated the effectiveness of these policies; secondly, due to the limitation of data acquisition, few studies have evaluated the differences of UGS accessibility and equity on different scales, including UGS categories and spatial and temporal levels [16]; thirdly, research results from different regions are contradictory due to differences in research indicators, methods, scales, and cultures. For example, Park (2020) and Jillian (2020) found that residents with a higher socioeconomic level have high accessibility to parks [17,18]. However, Ward et al. (2013) found that there is no significant correlation between the accessibility of urban parks and the socio-economic level of residents [19]. Eventually, the research is mainly focused on Western developed countries, including the USA [18], Denmark [20], Germany [21,22], and Singapore [23]. However, little is known about the accessibility of UGS in developing countries, especially for oasis cities with a water shortage in arid Northwestern China. Non-Western countries are quite different from Western countries in urban environment, society, economy, and culture. In addition, a series of UGS policies lead to obvious changes in landscape patterns in the rapid urbanization process of developing countries [24]. Therefore, the research on UGS accessibility at different scales in non-Western countries and the evaluation of the effectiveness of UGS policy can expand the knowledge scope of UGS accessibility and equity.
We are committed to addressing the above problems. Based on existing research and actual situations, we choose Urumqi as the research area, an oasis city in arid land, and use a two-step floating catchment area method (2SFCA) and location quotient (LQ) to evaluate the walking accessibility and equity of UGS at different scales, and evaluate the effectiveness of the policy. Specifically, there are three objectives: (1) to assess UGS accessibility spatial distribution from arid areas at different scale levels (30 × 30 m, sub-district level and district level) and UGS categories (neighborhood, district, and metro levels), (2) to reveal the inequity of UGS accessibility at the sub-district level for three time thresholds (1999, 2009, and 2019), and (3) to track changes in UGS accessibility and equity, and evaluate the effects of UGS policies. The research results will enrich the research perspective of UGS accessibility and provide a theoretical basis for future UGS planning in Urumqi.

2. Materials and Methods
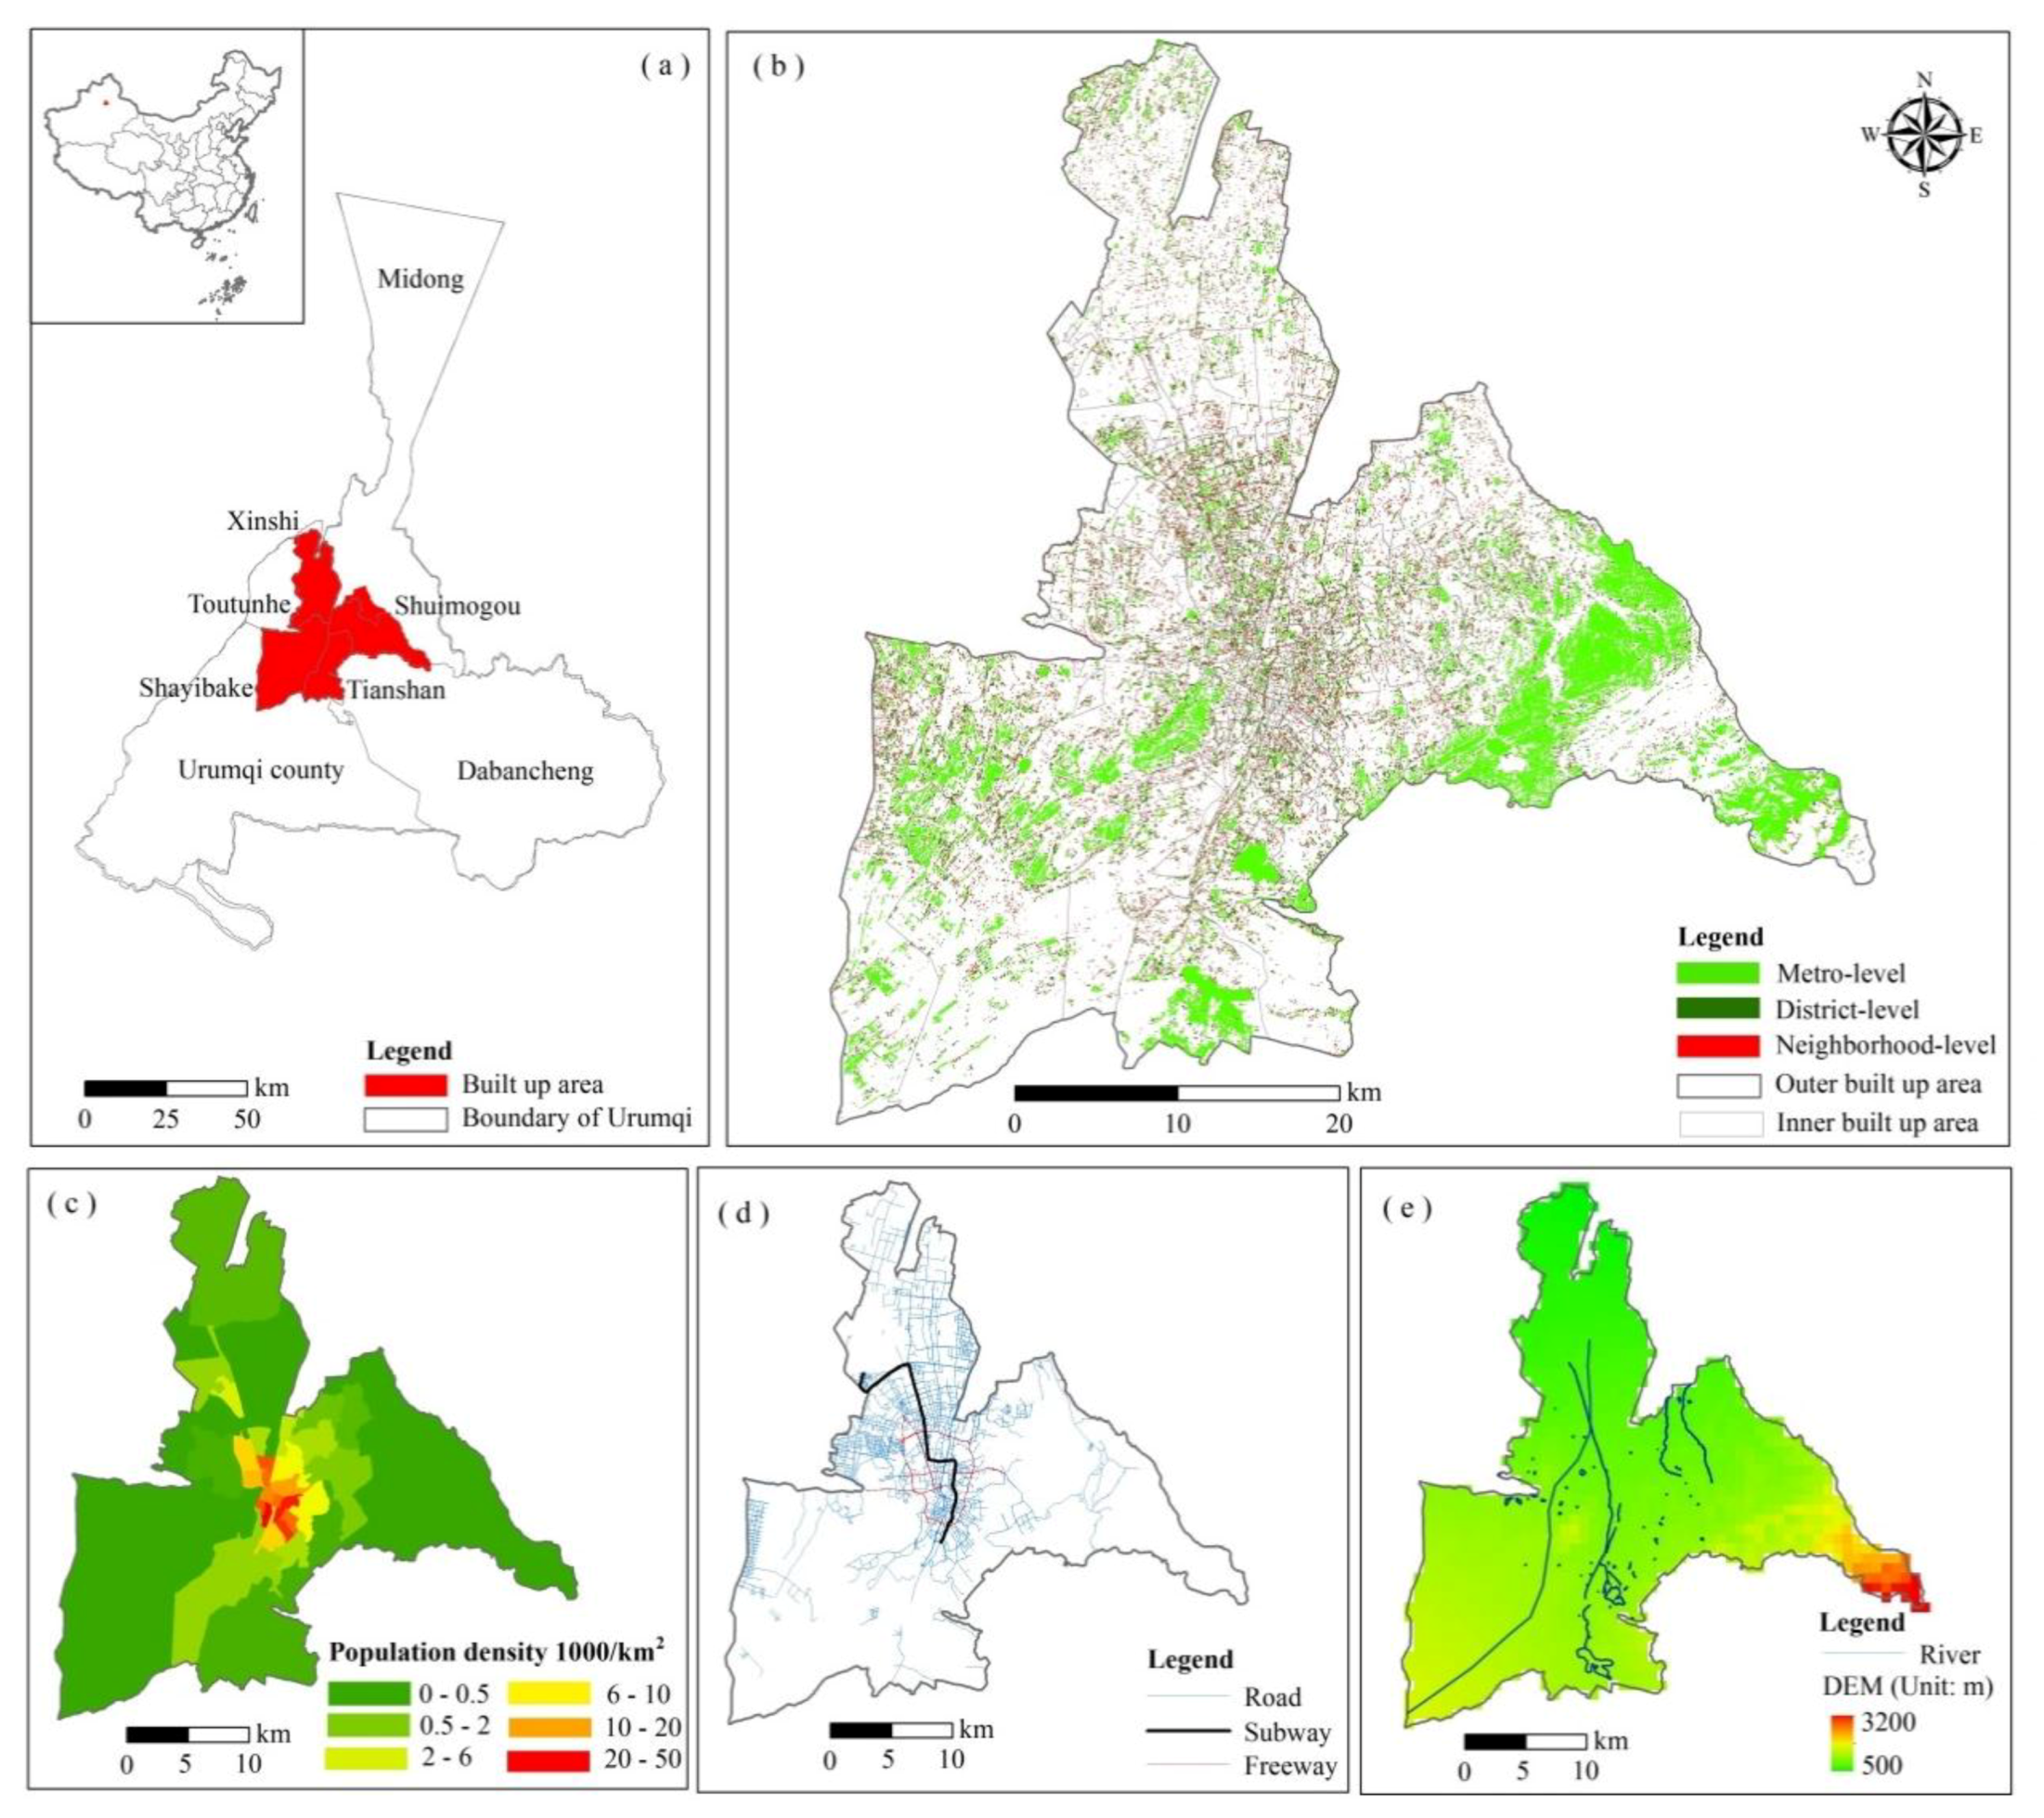
2.1. Study Area

Urumqi is located in arid Northwestern China (42°45′–44°08′N, 86°37′–88°58′E, a.s.l. 850 m), which is the core area of China’s “One Belt One Road” initiative. Since the beginning of China’s reform and opening policy, especially based on China’s “Go West Strategy” starting in 2000, as a typical oasis city in Central Asia, Urumqi has developed rapidly, become an important hub of the world’s economy and China’s trade gateway to Central Asia and Europe, and developed into a desert metropolis or a “megacity for tomorrow.” This applies not only to infrastructure and economic growth, but also to socio-political awareness of environmental and nature conservation issues and the sustainable use of natural resources, especially the increasingly scarce water.
The administrative area of Urumqi covers 1.2 × 10⁴ km2, with a total population of 2.68 million, covering 14 ethnic groups [25]. The built-up area covers an 827.55 km2, including four districts: Shayibake, Tianshan, Shuimogou, and Xinshi (Figure 1), accounting for 10.7% of Urumqi’s total administrative area, and has a population of 2.06 million by 2017, accounting for 76.87% of the total population. The urban green coverage rate is 34.9%, and the per capita green area is 11.50 m2 [25].
Urumqi belongs to the mountain terrain oasis city, mainly in the north of Tianshan Mountain and in the south of the Gurbantunggut Desert. The climate is very dry with an average annual precipitation of 250 mm and a potential annual evaporation of 2800 mm [26]. Because of the water shortage in the arid area, the plant survival rate and coverage rate are low. However, in order to join the ranks of National Garden Cities, the Urumqi municipal government has carried out a series of greening projects to improve the UGS coverage in built-up areas since 1992, and these projects are divided into three stages: 1992–2000, 2001–2010, and 2011–2020 (Table 1) [27]. Although Urumqi has made efforts to improve the UGS coverage in built-up areas, it only takes the UGS area, the coverage rate, and the green space per capita as targets, and ignores the fairness of the distribution of UGS. In addition, because of the local water shortage and accelerating urbanization process, UGS is fragmented. In this study, we chose the built-up area of Urumqi as the research area, mainly for the following four reasons: (1) The built-up area represents 76.87% of the population and 84.73% of GDP in Urumqi. It is an area with rapid urbanization and very obvious spatial and temporal dynamic change in UGS, which is faced with constraints of accessibility and quality. (2) The UGS policy was mainly implemented in the built-up area from 1992 to 2020, which allowed us to conveniently analyze the impact of UGS policy on the accesibility and equity of UGS. (3) The data of the sub-district level are mainly concentrated in built-up areas, so obtaining data is easy. (4) Due to the landscape types are mainly farmland and desert in the north of Urumqi, so it is easy to make errors in UGS extraction.

2.2. Data Sources

In order to analyze the impact of UGS policy on accessibility and equity, we chose three time levels to study (1999, 2009, and 2019), according to the implementation stage of UGS policy in Urumqi (Section 2.1). Research data include 1999, 2009, and 2019 green space boundaries, the streets, roads, and proper census data. The spatial distribution of street level population was derived from the population census in 2000, 2009, and 2015. Because of the lack of demographic data in 1999 and 2019, we assume that the population did not change significantly in 2015–2019, and the 2000 and 2015 census data represent 1999 and 2019. The road data are from the Urumqi Transportation Bureau in 1999, 2009, and 2019, including subway, municipal roads, and sub-district roads. The border of built-up areas comes from the Urumqi Land and Resources Bureau.
According to the previous research results [28,29], we selected, for our main study area and data acquisition, 30 m resolution remote sensing imagery. Based on United States Geological Survey (https://earthexplorer.usgs.gov/), we acquired Landsat 5 TM and Landsat7 ETM remote sensing images with a 30 m resolution from 1999 to 2019. Firstly, radiometric correction, geometrically correction, and atmospheric correction of the image were done using ERDAS 9.2 software (ERDAS Corporation, Atlanta, GA, USA). Secondly, we referred to the research results of Ye et al. (2018) [30]. The maximum likelihood method was used for supervised classification based on ERDAS 9.2 software. The land use types were divided into industrial land, transportation land, residential/commercial land, UGS, agricultural land, and water. Eventually, we randomly created 60 sample points on Google Earth (Google Corporation, Mountain View, CA, USA) to evaluate the accuracy of the classification, with the classification accuracy of 87% and a Kappa coefficient of 0.807.

2.3. Method

2.3.1. The Two-Step Floating Catchment Area Method (2SFCA)

In this study, we used 2SFCA to calculate UGS accessibility [31]. This method combines UGS supply and residents’ demand, and comprehensively evaluates UGS accessibility from multiple dimensions such as UGS quantity, distribution, and demand. The accessibility of UGS is affected by travel mode, distance, time, population attributes, and other factors [32,33]. Based on the Questionnaire Star Survey Platform (https://www.wjx.cn/), we conducted a semi-structured questionnaire survey to obtain key indicators affecting the accessibility of UGS. The questionnaire consists of two parts: (1) the attributes of respondents, including gender, age, economic status, and address and (2) UGS accessibility factors, including the means of travel (walking, cycling, and driving), access time at different administrative levels, and UGS categories. A total of 480 questionnaires were collected, and 416 of them were valid, accounting for 86.67%. The reason for the invalid questionnaire was that the respondents were non-local residents.
The results of the questionnaire showed that walking was the main means of travel in our study area. UGS categories also have an impact on the accessibility distance (Supplementary Materials, Table S1). Therefore, in this study, walking and the UGS scale are considered as important influencing factors of accessibility. Firstly, UGS is divided into three categories per its scale and function: the neighborhood level, the district level, and the metro level) [16,30]. The classification basis of UGS category is shown in Table 2. Secondly, according to the maximum walking time of residents to different UGS categories, the walking distance is converted to a speed of 1 m/s. Combined with the data of walking distance required by urban planning in China, we set the walking distance of 300, 1000, and 2000 m to UGS as the maximum walking distance for the neighborhood level, district level, and metro level, respectively. Thirdly, the 2SFCA method proposed by Luo et al. (2004) and Ye et al. (2018) was adopted to analyze the accessibility of neighborhood-level, district-level, and metro-level UGS, respectively [30,31]. Compared with other methods, this method can better counter the supply and demand relationship between residents and different UGS categories. It is worth noting that, in order to reduce the calculation error of UGS accessibility, we did not use the traditional Euclidean distance to calculate accessibility. Instead, based on road network data, we measured the Minimum Road Network Distance between residential areas and UGS in the Arc GIS 10.1 (Esri Corporation, Sacramento CA, USA) Network Analysis. Due to the lack of UGS entrance data and road obstacle data (such as road congestion and the number of traffic lights), we did not consider the influence of obstacle factors on accessibility in actual travel. Eventually, we added the accessibility of different UGS categories to obtain the total UGS accessibility.
The 2SFCA method calculates the accessibility of UGS in three steps on the basis of supply and demand, respectively. The UGS accessibility was calculated by the following formula.
R j i = S j i k { d k j d 0 i } G ( d k j , d 0 i ) P k
where d k j is the distance between demand point k and supply point j; d 0 i is the space distance set by the UGS categories to reach i; P k are the number of demanders in the search area (that is, d k j d 0 i ); S j i is the total supply of UGS type i at point j; G ( d k j , d 0 i ) is the distance attenuation function of the influence of point source elements on spatial elements, namely the Gauss equation. The calculation method is shown as follows.
G ( d k j , d 0 i ) = { e 1 2 × ( d k j d 0 i ) 2 e 1 2 1 e 1 2 , d k j d 0 i 0 , d k j > d 0 i
The second step is to form the spatial scope for each requirement k given the spatial distance d 0 i . In this scope, the supply–demand ratio R j i of supply ground j is weighted by a Gaussian equation, and the weighted ratio is then summed to obtain the spatial accessibility of demand ground A k i .
A k i = j { d k j d 0 i } G ( d k j , d 0 i ) × R j i
where d k j is the distance between the demand point k and the center of gravity of the supply ground j.
The third step is to sum up the accessibility of each demand point k at different UGS categories to obtain the total UGS accessibility A k i of demand point k.
A k = i = 1 n A k i
A k is a summation of accessibility of UGS type i, n = 3.

2.3.2. Lorenz Curve and Gini Coefficient

Lorenz proposed the Lorenz curve to analyze the wealth inequality in different regions or at different times in 1905, which is widely used in economic, social, and transportation fields [34]. In this study, the Lorenz curve was used to characterize the relationship between UGS accessibility and population distribution. All spatial pixels were ranked according to per capita UGS accessibility from low to high, and the proportion of UGS resources shared by the resident population in each interval of 10% was also calculated. Gini coefficient (G) is an index to judge the degree of distributive fairness according to the Lorenz curve, and it varies from 0 to 1 [35]. The value 0.4 is generally regarded as a red line against inequality. If the G is 0, the UGS distribution is completely equal. If the G is 1, the UGS distribution is absolutely unequal. The G was calculated by the following formula
G = 1 i = 1 n ( P i P i 1 ) × ( R i R i 1 )
where P i is the accumulative percentage of population, and R i is the accumulative percentage of UGS accessibility.

2.3.3. Location Quotient (LQ)

Although the G can effectively evaluate the UGS equity in the research area, the spatial distribution of equity cannot be distinguished. To further analyze the social fairness of UGS accessibility at the sub-district level and district level, we introduce the Location Quotient (LQ) [36]. If LQ is greater than 1, it indicates that the UGS accessibility is high. The calculation formula is
L Q = T i × P P i × T
where Ti and Pi are the UGS accessibility and population in pixel i, and T and P are the total amount of UGS accessibility and population.

3. Results

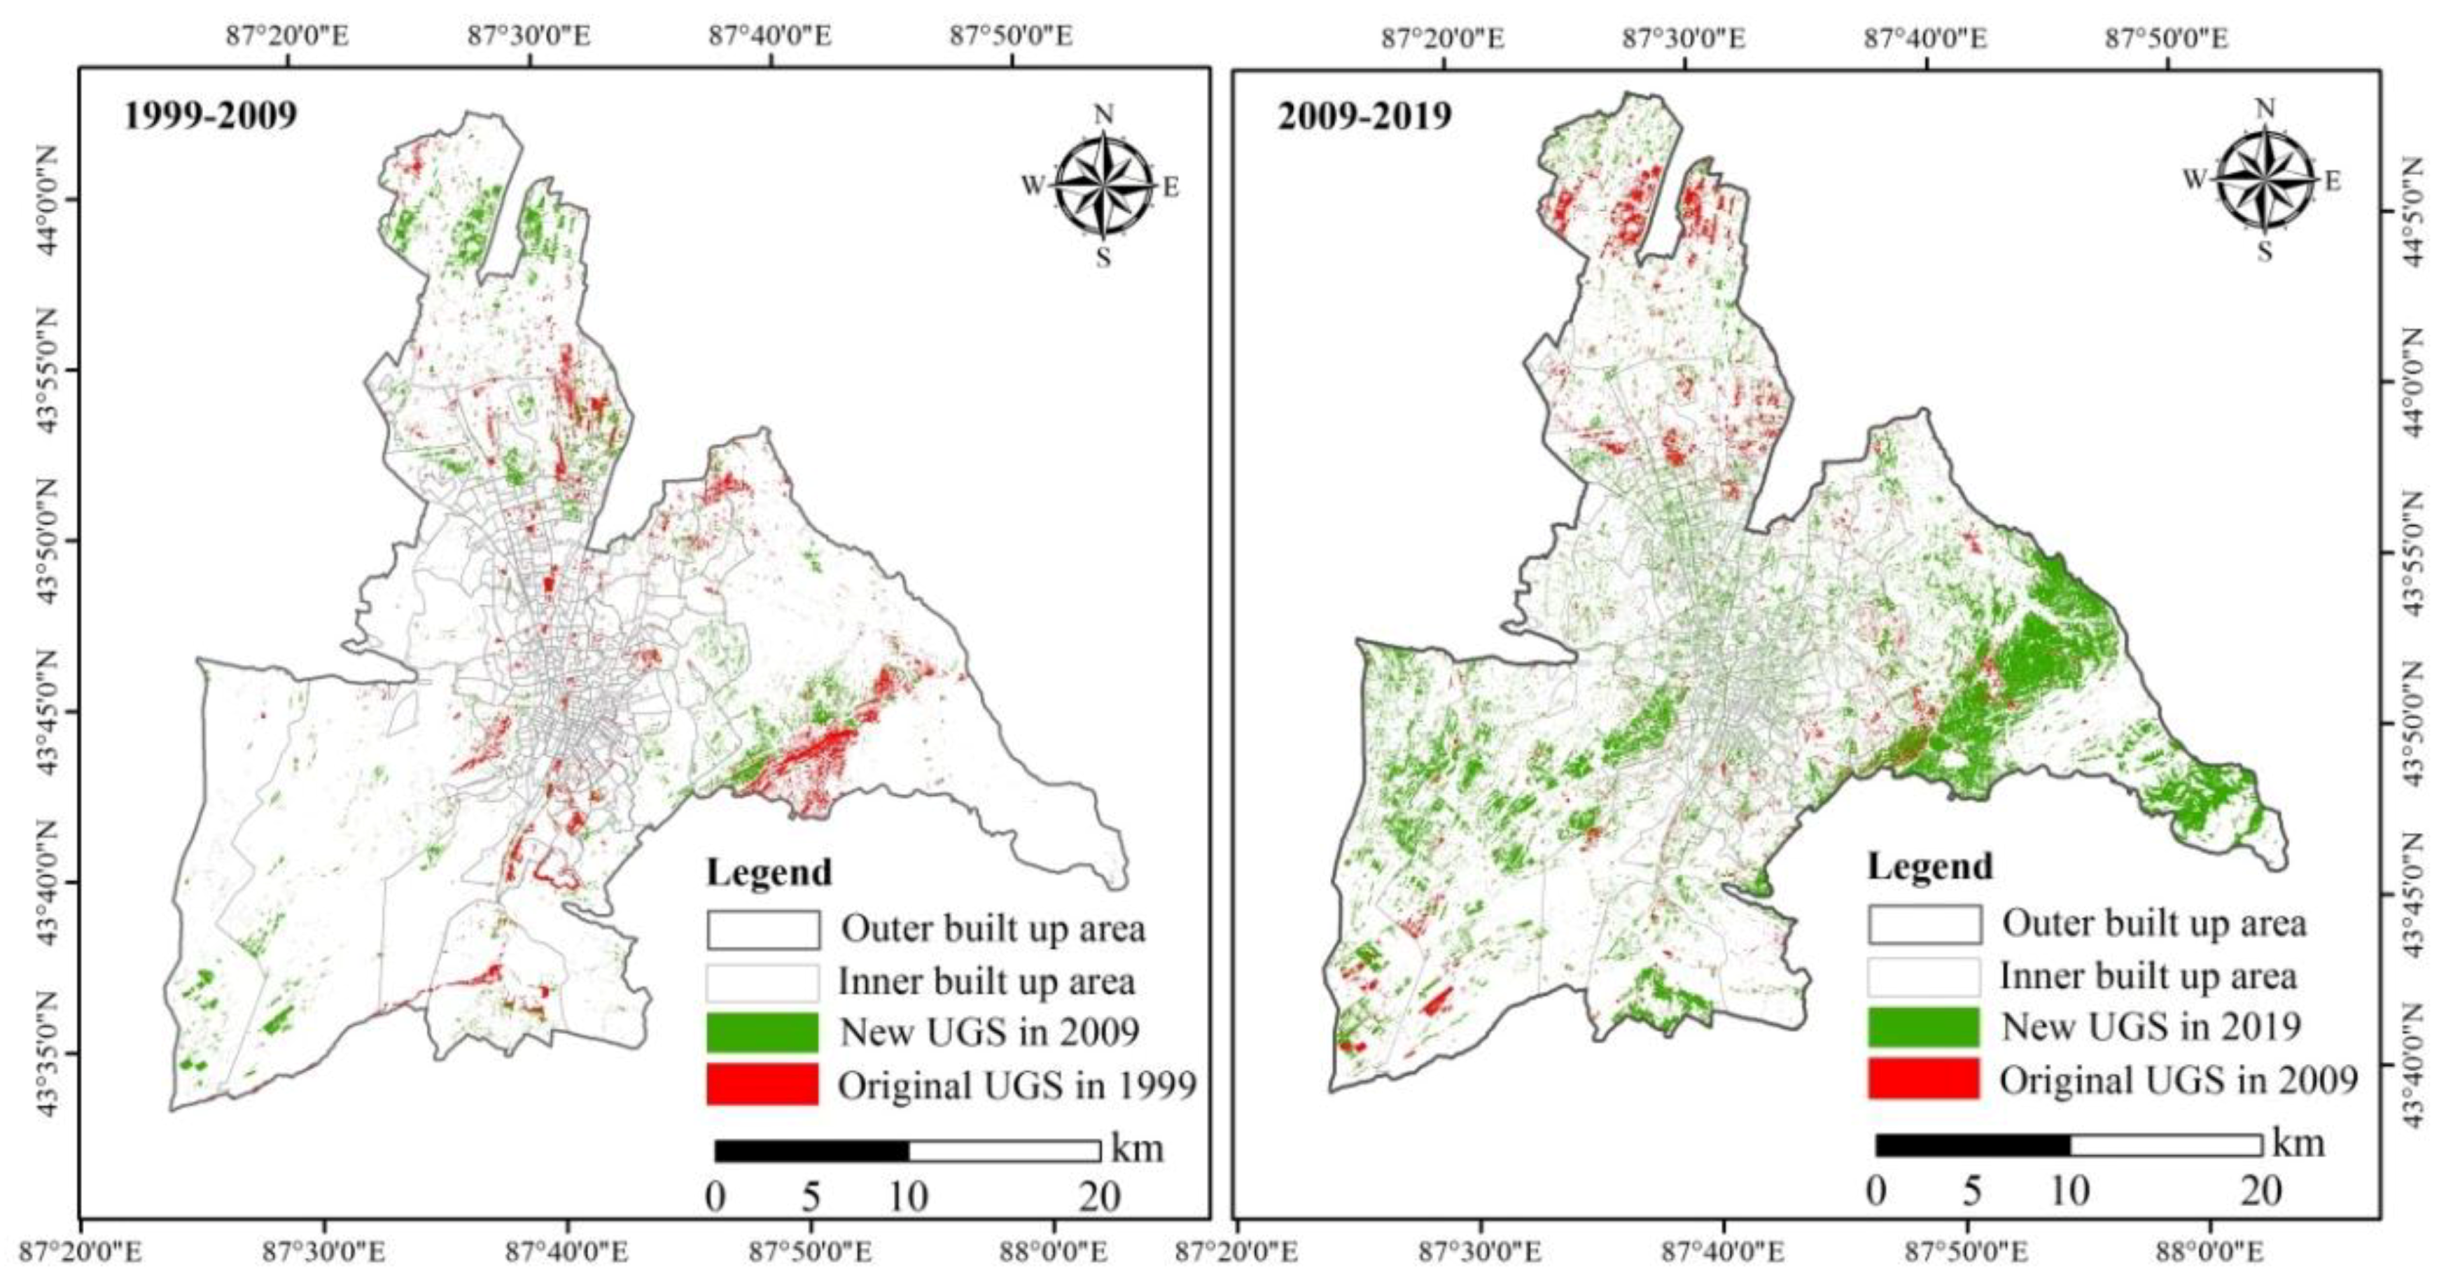
3.1. Overall Changes in UGS

The change in UGS area can affect the accessibility and equity of UGS. The spatial and temporal changes in UGS in the built-up area of Urumqi are as follows. Firstly, the UGS area was 206.14 km2 in 2019, and UGS was mainly district-level and metro-level (Figure 2). Secondly, the distribution of UGS in the built-up area is unbalanced (Figure 3). It is mainly distributed in the Shuimogou and Shayibake districts, where the UGS area reached 86.60 km2 (42.01%) and 66.27 km2 (32.15%) in 2019, respectively. Thirdly, with the acceleration of the UGS construction in Urumqi, the UGS area of the urban built-up areas has increased by 5.76 times from 1999 to 2019. District-level and metro-level UGS increased by 28.17 km2 (16.53%) and 128.84 km2 (75.62%), respectively. By contrast, the neighborhood-level UGS increased by only 13.37 km2. Eventually, the increase in UGS in built-up areas mainly occurred in the urban fringe of the Shayibake and Shuimogou districts from 1990 to 2009, with the UGS area increasing by 18.35 km2. The UGS mainly developed along the direction of suburbs in the Shuimogou district from 2009 to 2019, and the UGS area increased by 152.03 km2. On the whole, the UGS construction is unbalanced in both spatial levels and UGS categories.

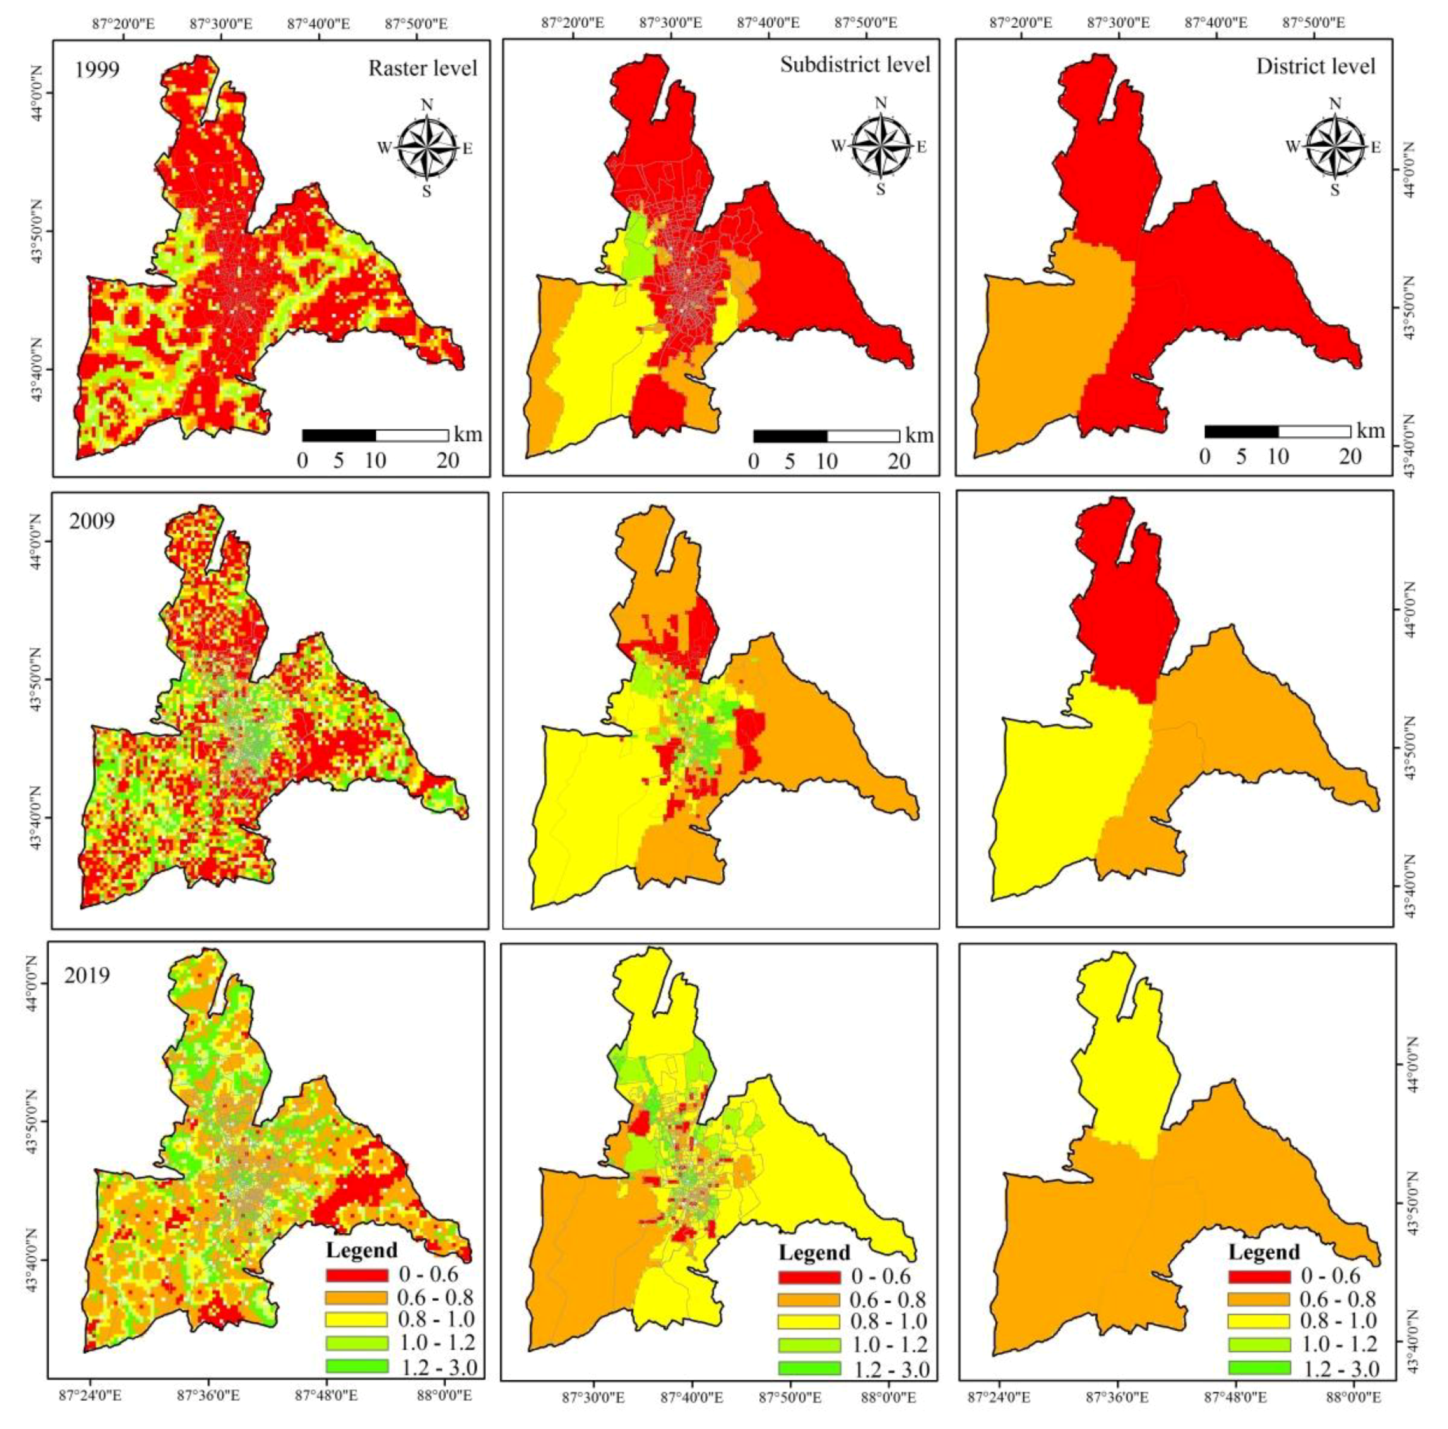
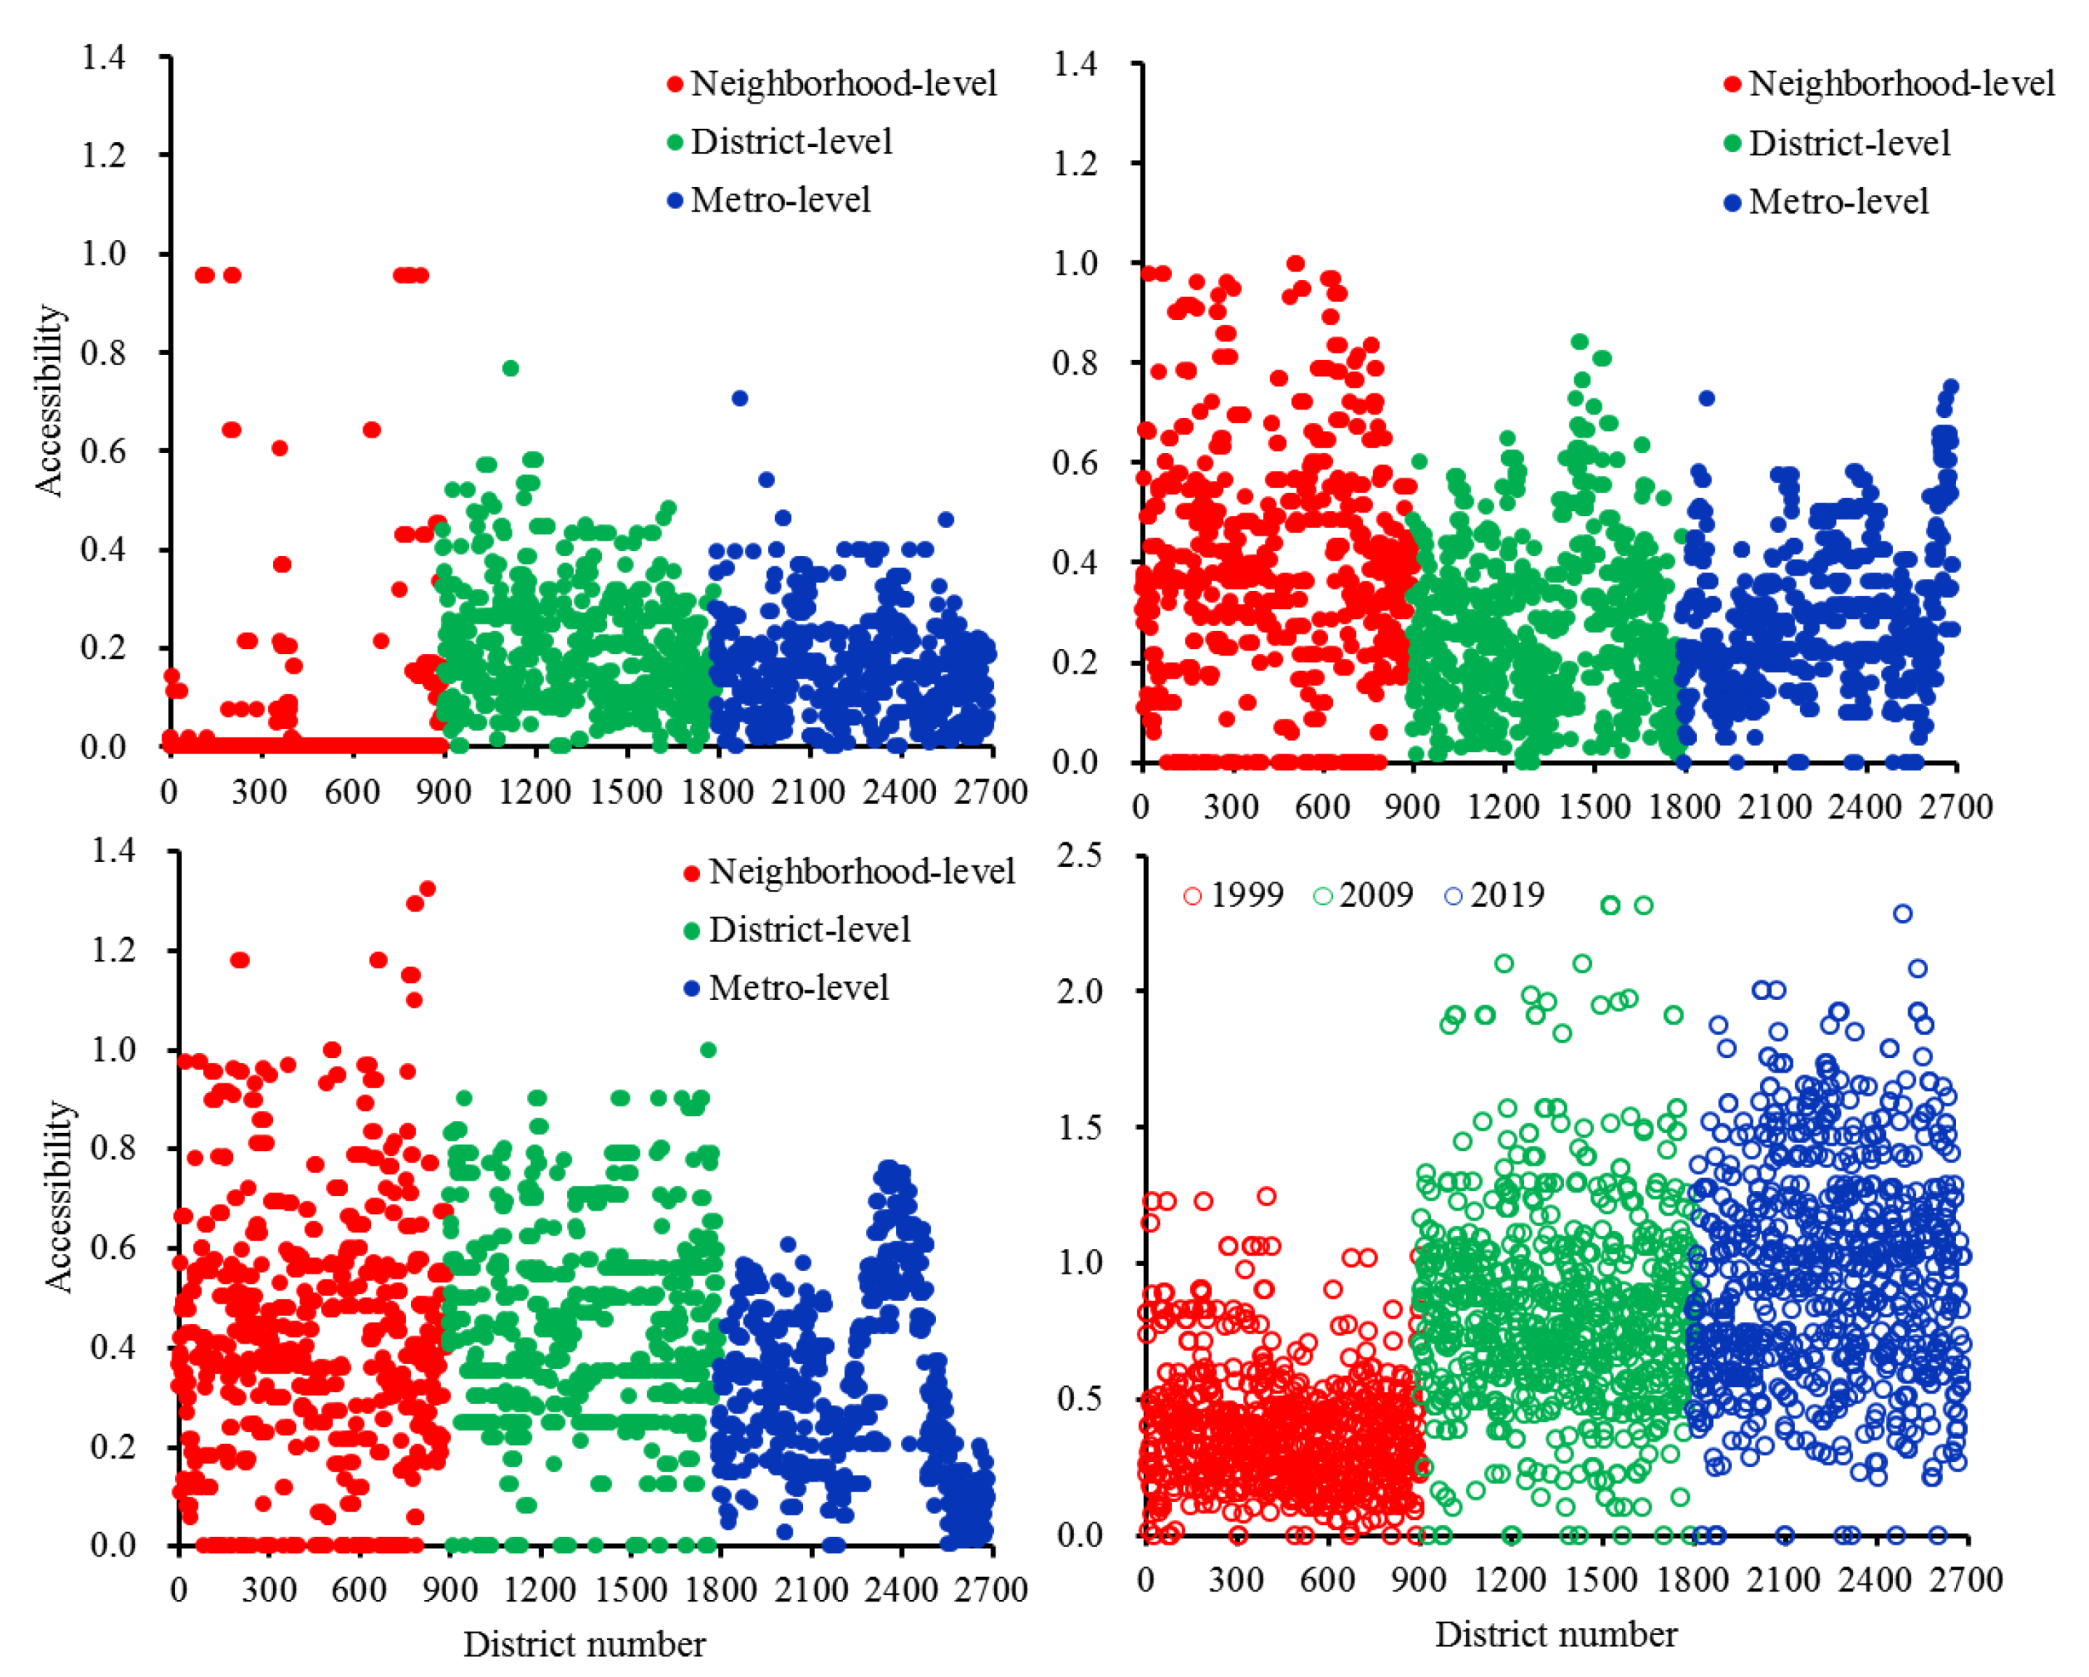
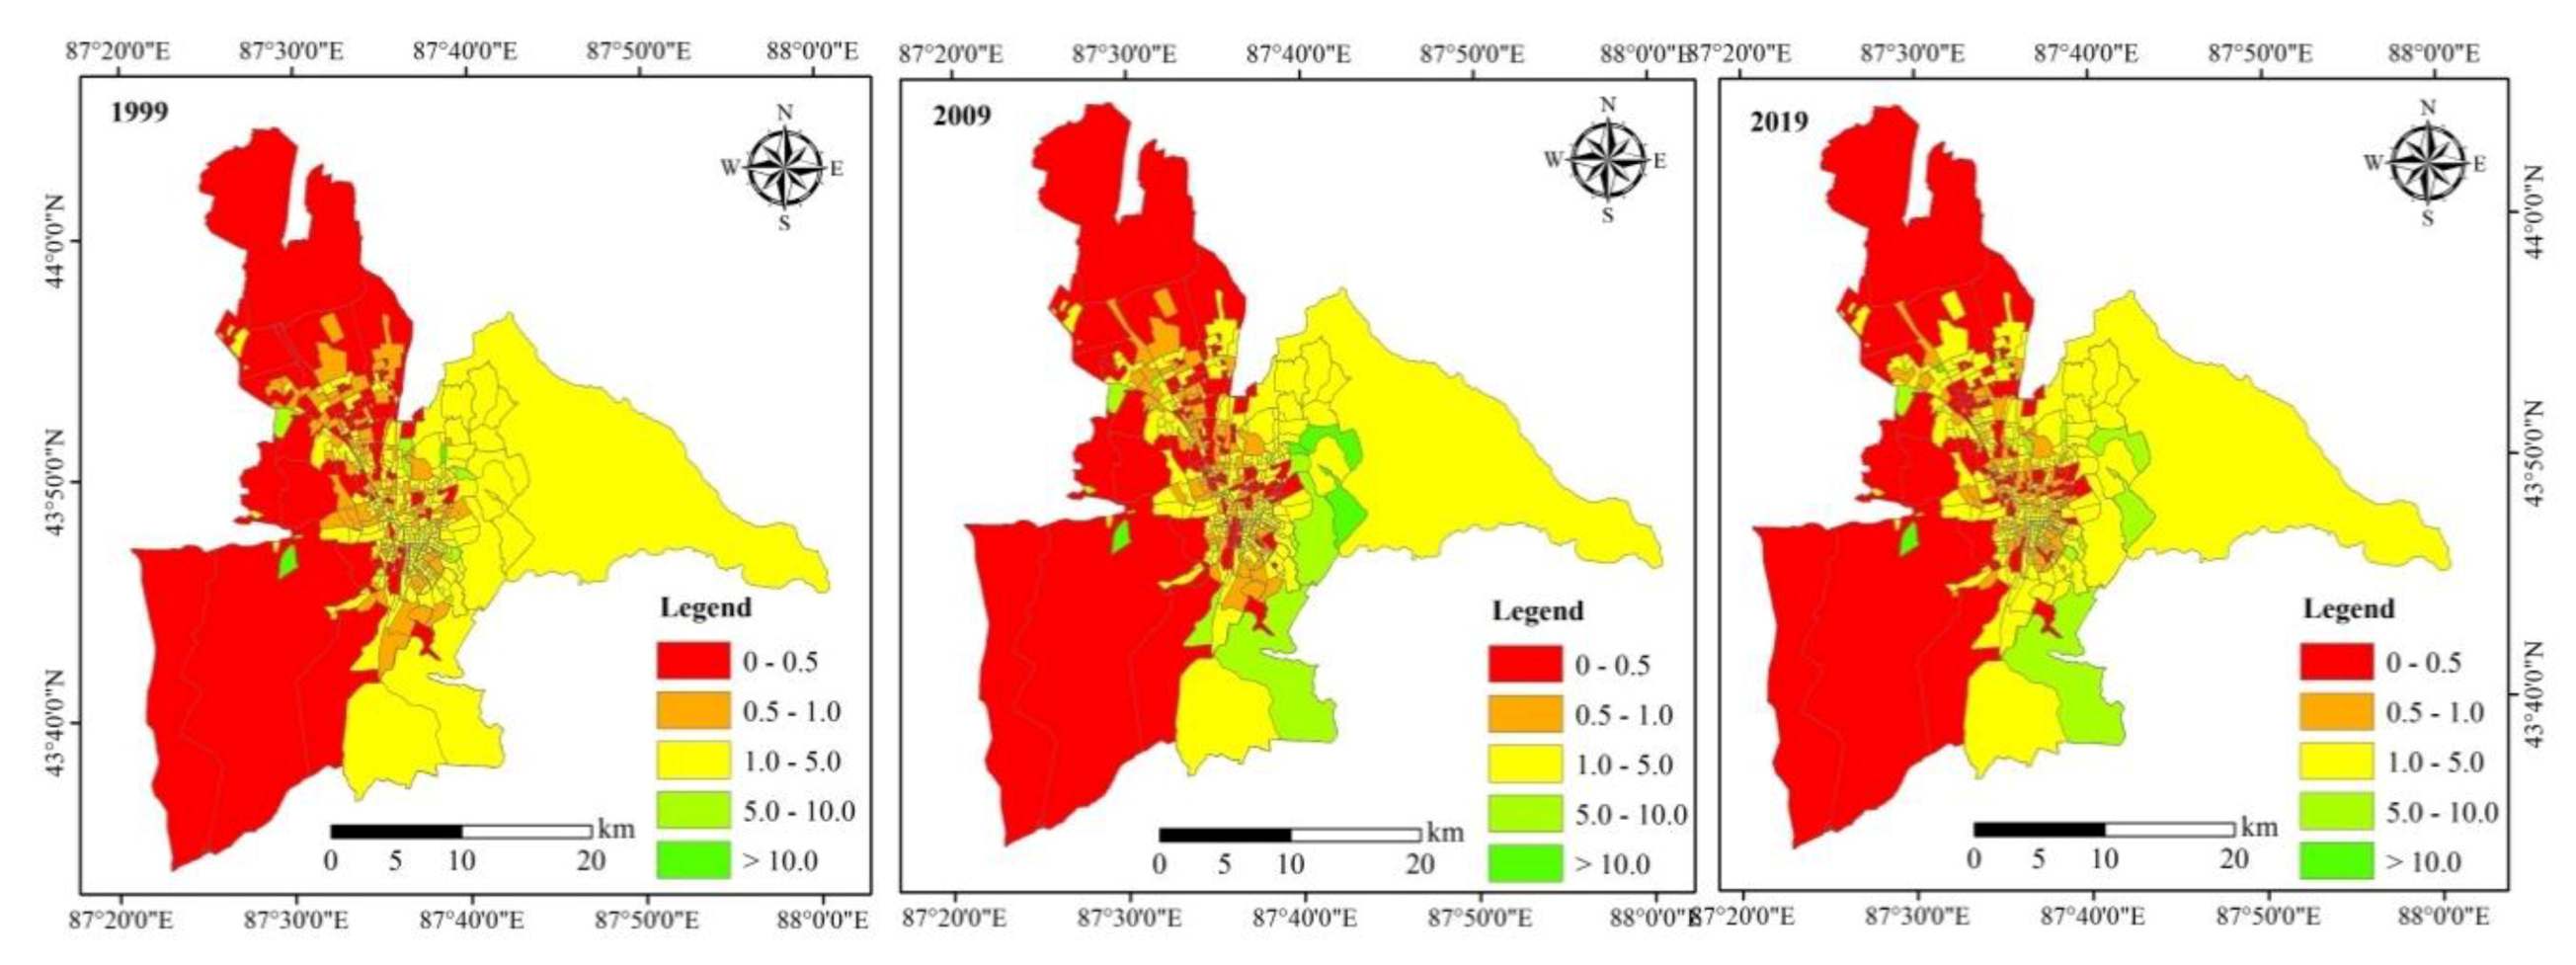
3.2. Spatial Distribution of UGS Accessibility

The results of UGS accessibility and its changes are displayed in Figure 4, Figure 5 and Figure 6. We can see that the UGS accessibility has undergone great changes from 1999 to 2019 in the built-up area of Urumqi. Firstly, the accessibility of UGS gradually improved from 1999 to 2019, including in 30 × 30 m, sub-district and district-level. UGS accessibility increased from 0.139 in 1999 to 0.235 in 2009, and further increased to 2019. Secondly, the gap of accessibility decreased between the different UGS categories from 1999 to 2019 (Figure 6). The lowest accessibility of neighborhood-level UGS was 0.034 in 1999, while those of the district-level and metro-level UGS were as high as 0.186 and 0.149. With the increase in UGS area, the accessibility of the three levels of UGS increased significantly, especially at the neighborhood level. The accessibility of neighborhood-level UGS increased to 0.427 in 2019, higher than the 0.431 and 0.320 accessibility levels of the district-level and metro-level UGS in 2019. Thirdly, the distribution of accessibility was uneven. The southwest of the study area had high UGS accessibility at the 30 × 30 m and sub-district level in 1999. Shuimogou and Tianshan districts are higher than the Xinshiqu and Shayibake districts at the district level. It is worth noting that the UGS construction is mainly metro-level and concentrated in the outskirts of the city, mainly in the Shuimogou and Shayibake districts, which leads to the lack of neighborhood-level UGS within the core area of the built-up area (Figure 3). Therefore, the accessibility of UGS in the central urban area was still not improved from 2009 to 2019 (Figure 4). Eventually, with the increase in UGS area and the construction of road traffic network, the accessibility of UGS significantly improved in different UGS categories from 1999 to 2019 (Figure 5). Neighborhood-level and district-level UGS areas had good effects on the improvement in UGS accessibility in the core part of the built-up area. However, metro-level UGS had a better effect on UGS accessibility in the marginal areas of built-up areas. On the whole, our study shows that, although the UGS accessibility in the surrounding areas of the city experienced a substantial increase from 1999 to 2019, the distribution of UGS accessibility was unbalanced in the urban core and the periphery of the city.

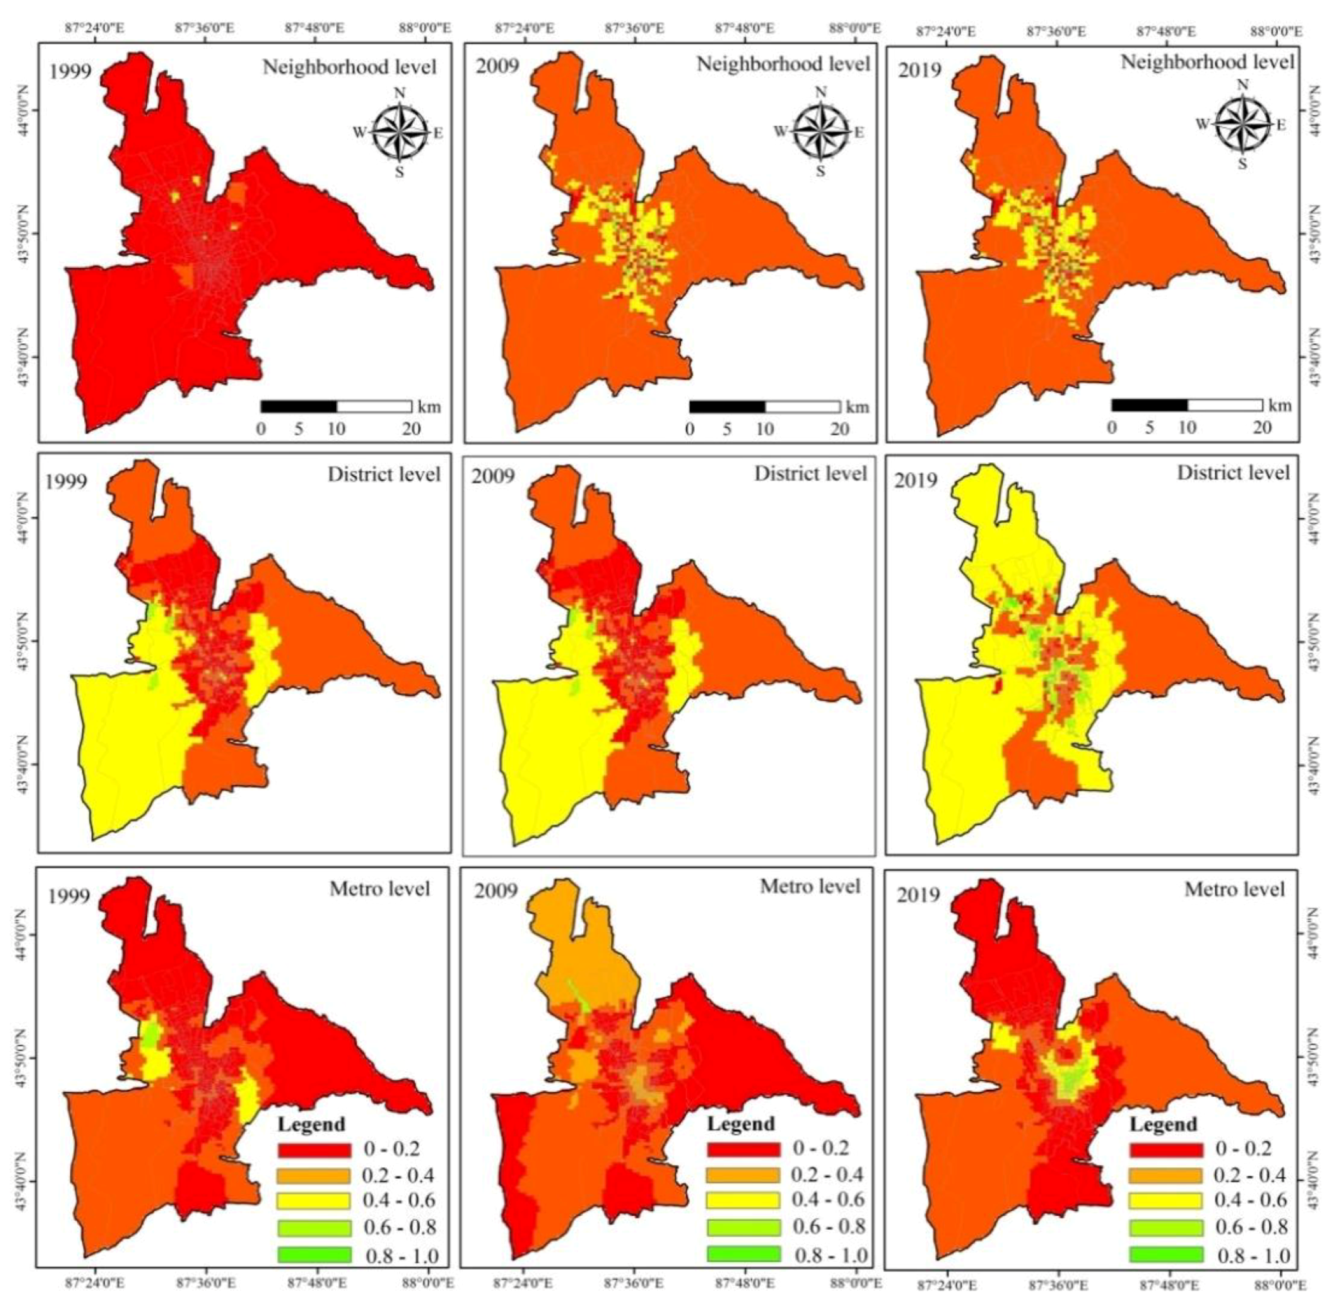
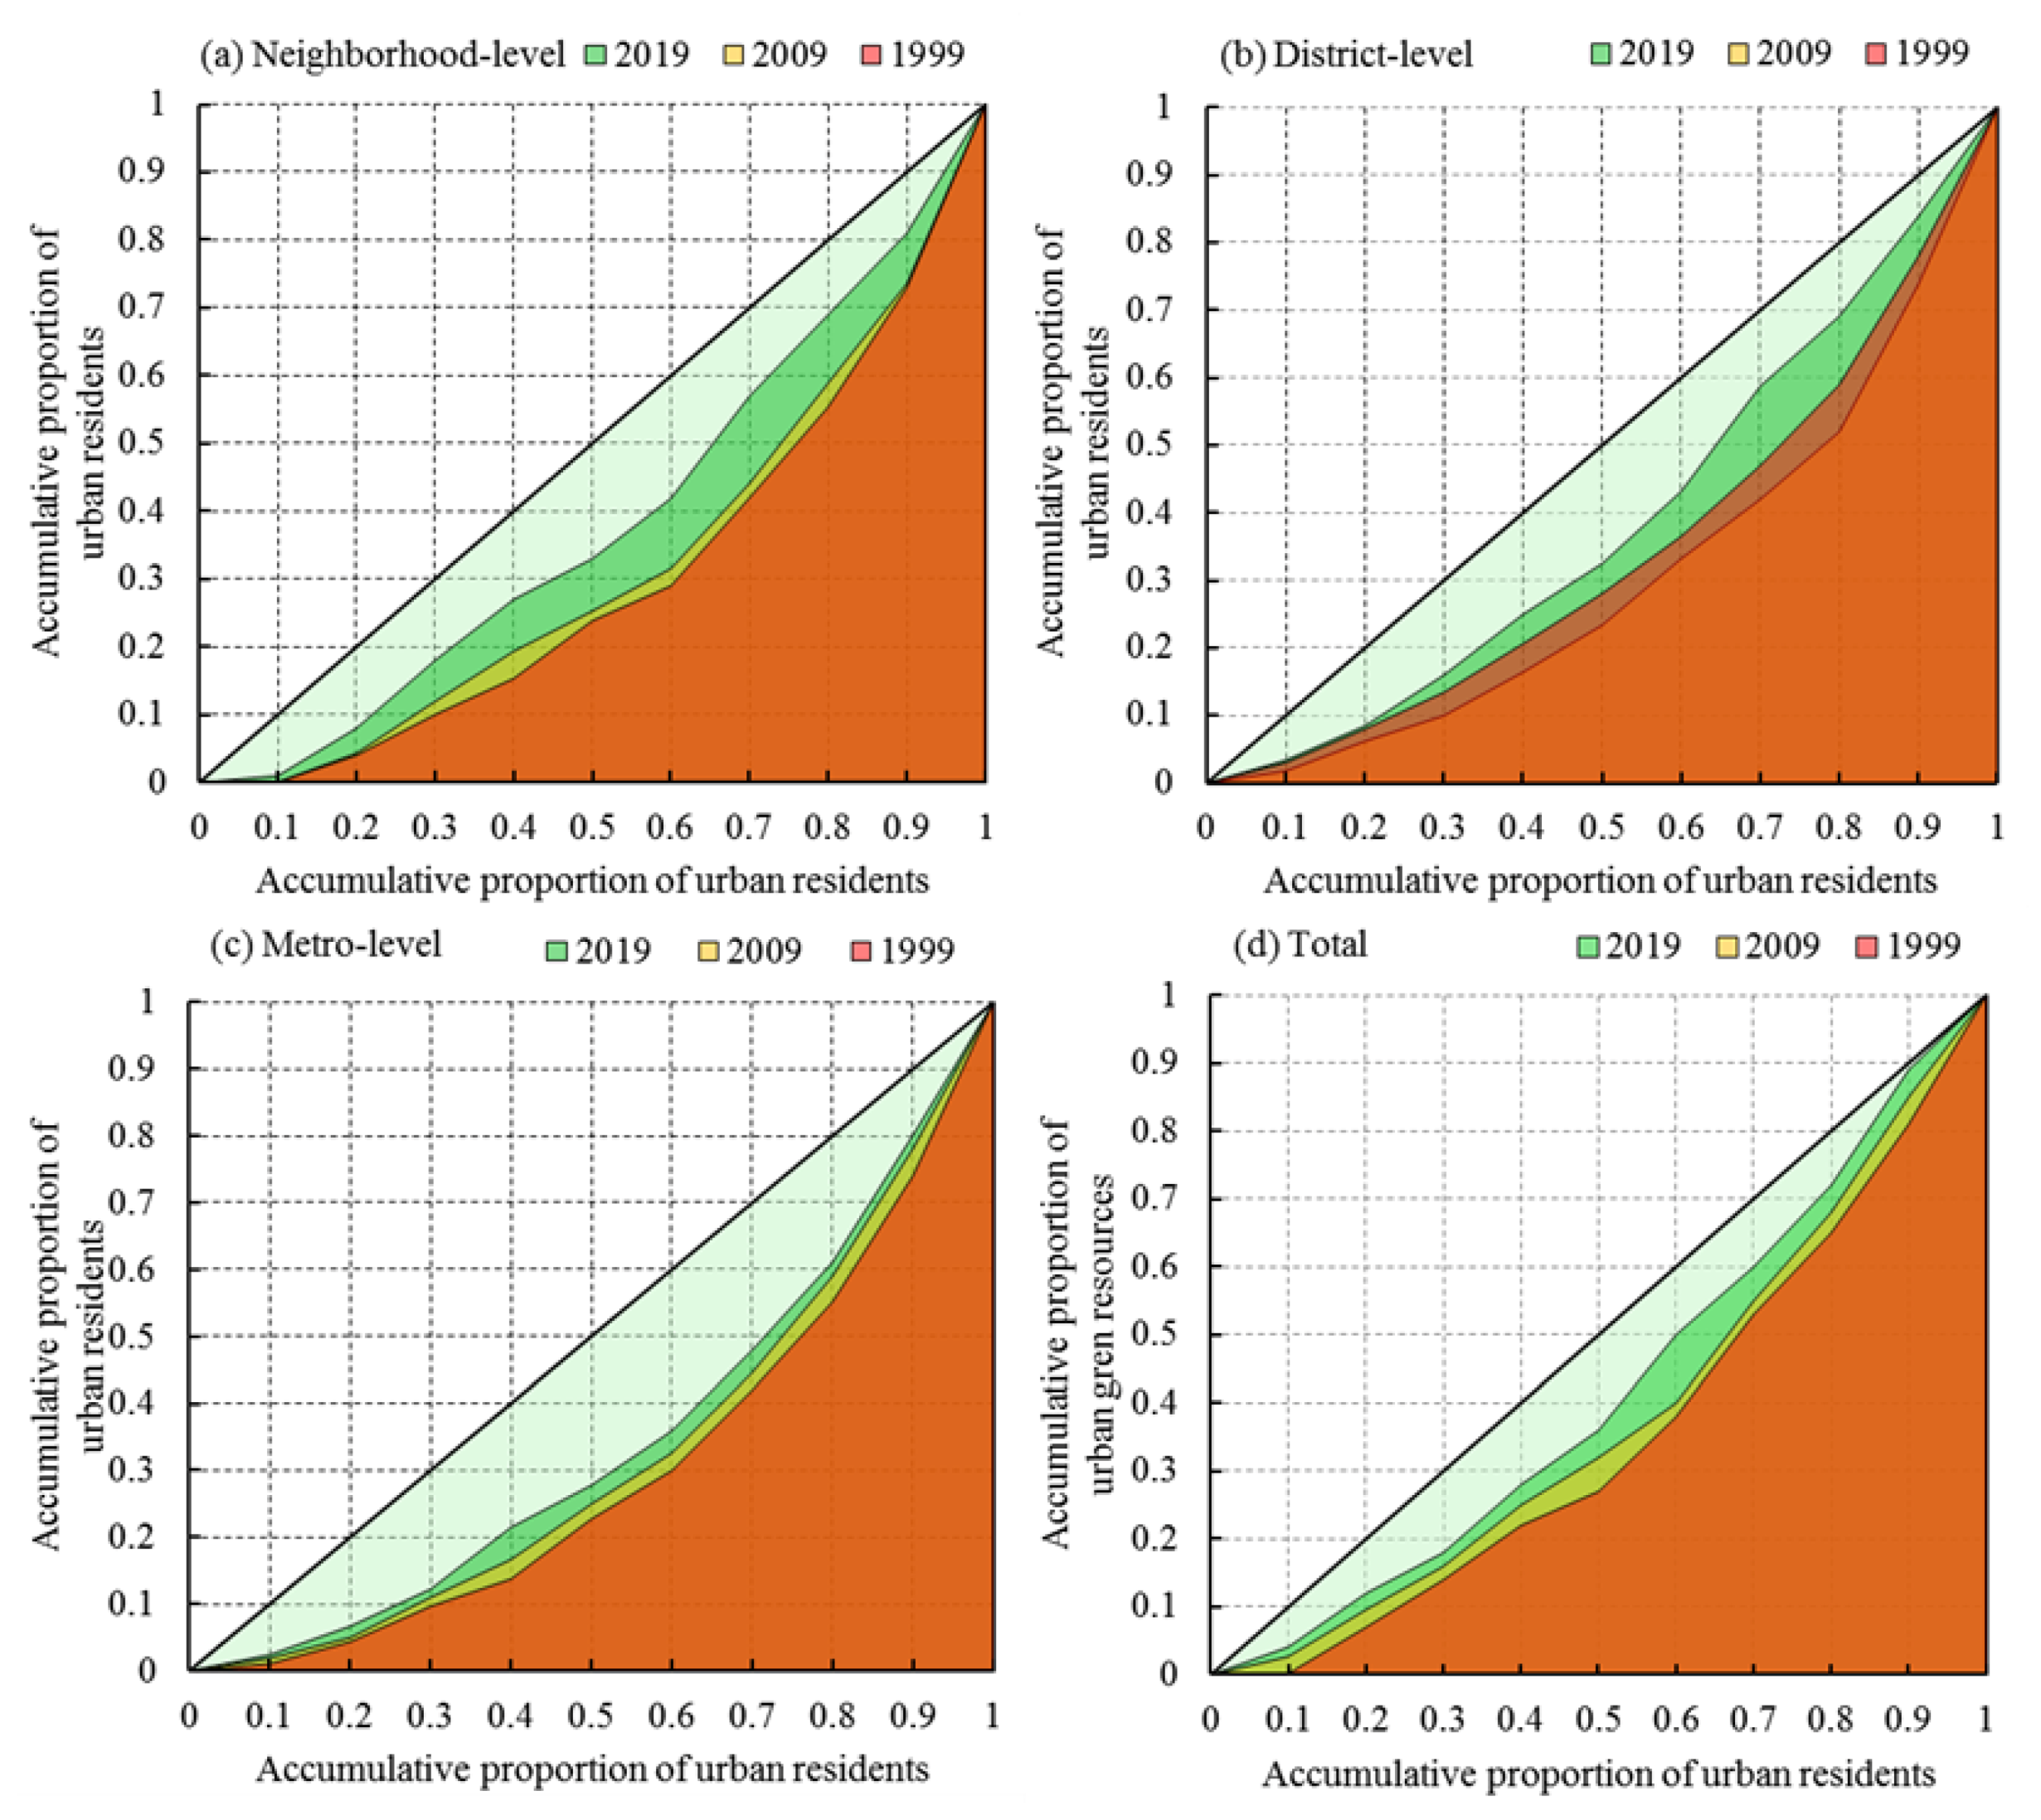
3.3. Social Equity of UGS Accessibility

We used the Lorentz curve to investigate the social equity of UGS accessibility at different UGS categories from 1999 to 2019. On the whole, the Gini coefficient of the UGS resource in built-up areas is 0.17, 0.24, and 0.31 in 1999, 2009, and 2019, respectively, which are close to the warning line of 0.4. The Lorenz curve protrudes downward, which is below the absolute fairness line, indicating that the distribution of UGS accessible resources is not fair.
UGS categories are not evenly distributed among residents. It was shown that the top 10% of all residents could use 1.8–3.4% and 1.0–2.4% of the district-level and metro-level UGS resources from 1999 to 2019, while the same proportion of residents could only use about 0.06–1% of the neighborhood-level UGS (Figure 7). This shows that the allocation of UGS resources deviates from the principle of efficiency. From the perspective of a time scale, with the increase in UGS, the proportion of the top 10% of residents using UGS resources increased from 0.2% in 1999 to 4.1% in 2019, and social equity of UGS accessibility markedly increased. It is worth noting that the equity of different UGS resources also increases gradually. Although neighborhood-level and district-level UGS increased by only 10.88 and 24.13 km2 from 2009 to 2019 (Figure 2), accounting for 24.65% of the total increased area, the increase in social resource equity was significantly higher than that of the metro level (Table 3). This result shows that increasing the proportion of neighborhood-level and district-level UGS in the built-up areas of Urumqi is effective in improving the fairness of UGS resources.

3.4. Spatial Patterns of Social Equity

In order to reveal the fair spatial distribution of UGS resource, we calculate the Location Quotient. The results show that the UGS resource in the built-up area is not fair. Firstly, there is inequality at the district level. The LQ values are lower than 1 in the Xinshi and Shayibake districts for 1999–2019, indicating that there were fewer UGS resources than the overall level (Table 4). However, LQ values were higher than those in the Shuimogou and Tianshan districts. Secondly, LQ values of the central urban areas, the northern areas and the southwestern areas of the built-up areas are generally lower than those of other regions at the sub-district level for 1999–2019 (Figure 8). There were 36.53–44.26% of areas with LQ values lower than 1, and about 15.56–20.08% of areas with LQ values lower than 0.50. Thirdly, the social equity of UGS gradually improved from 1999 to 2019, increasing from 1.079 in 1999 to 2.526 in 2019 (Table 4). The increase in UGS equity was most obvious in the Tianshan and Shuimogou districts. The improvement in UGS area and transportation network has contributed to the improvement in social equity.

4. Discussion

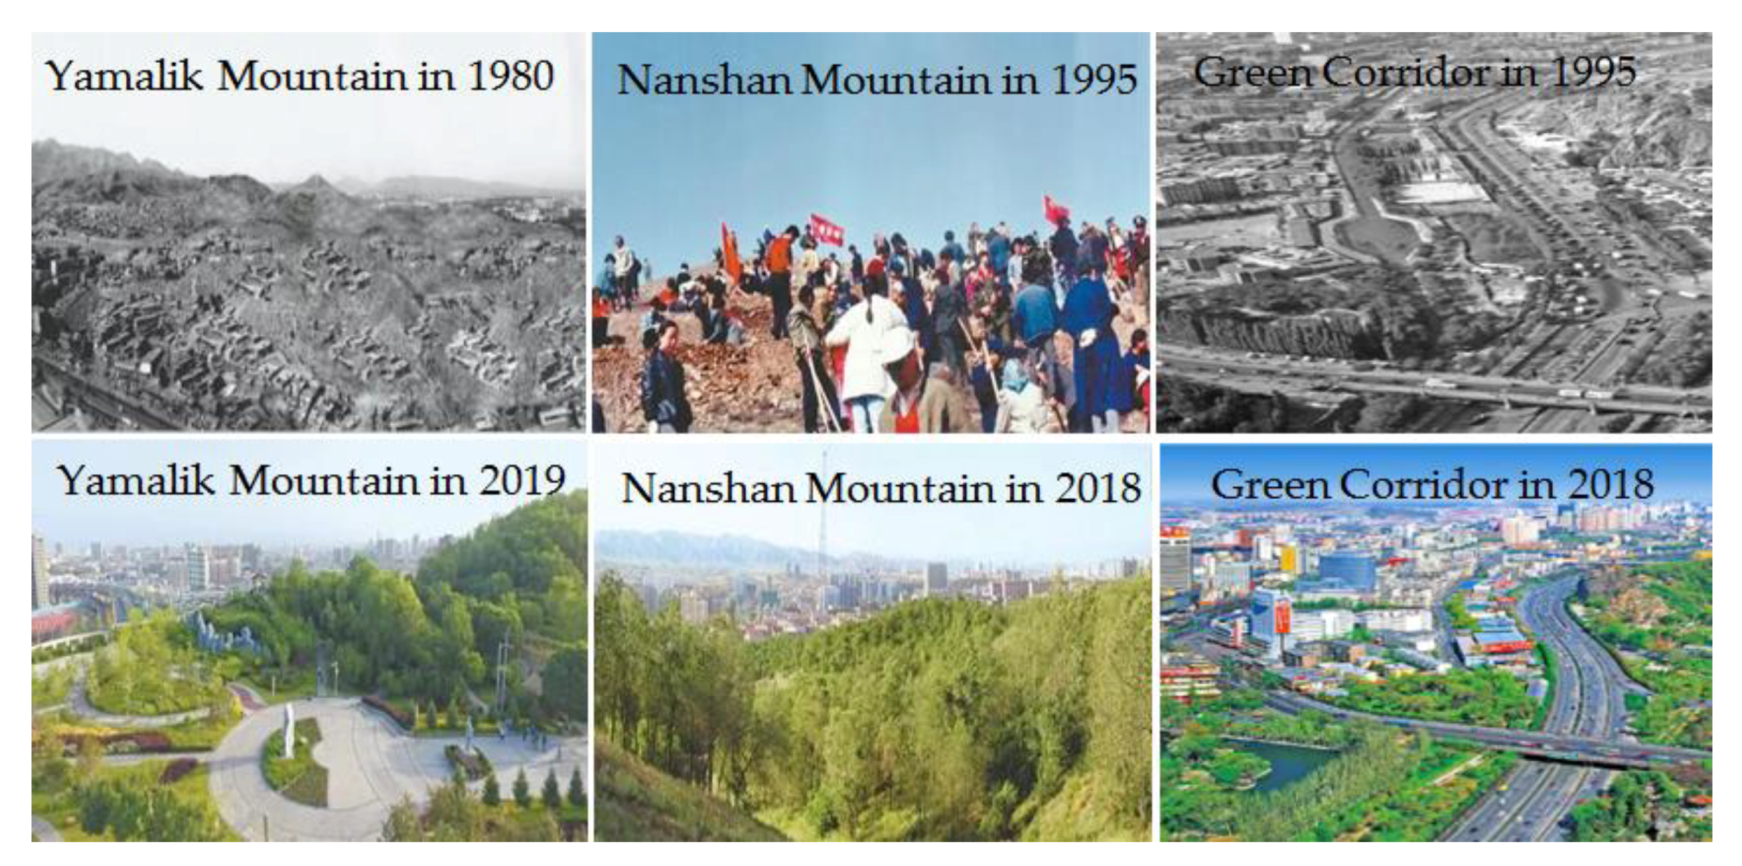
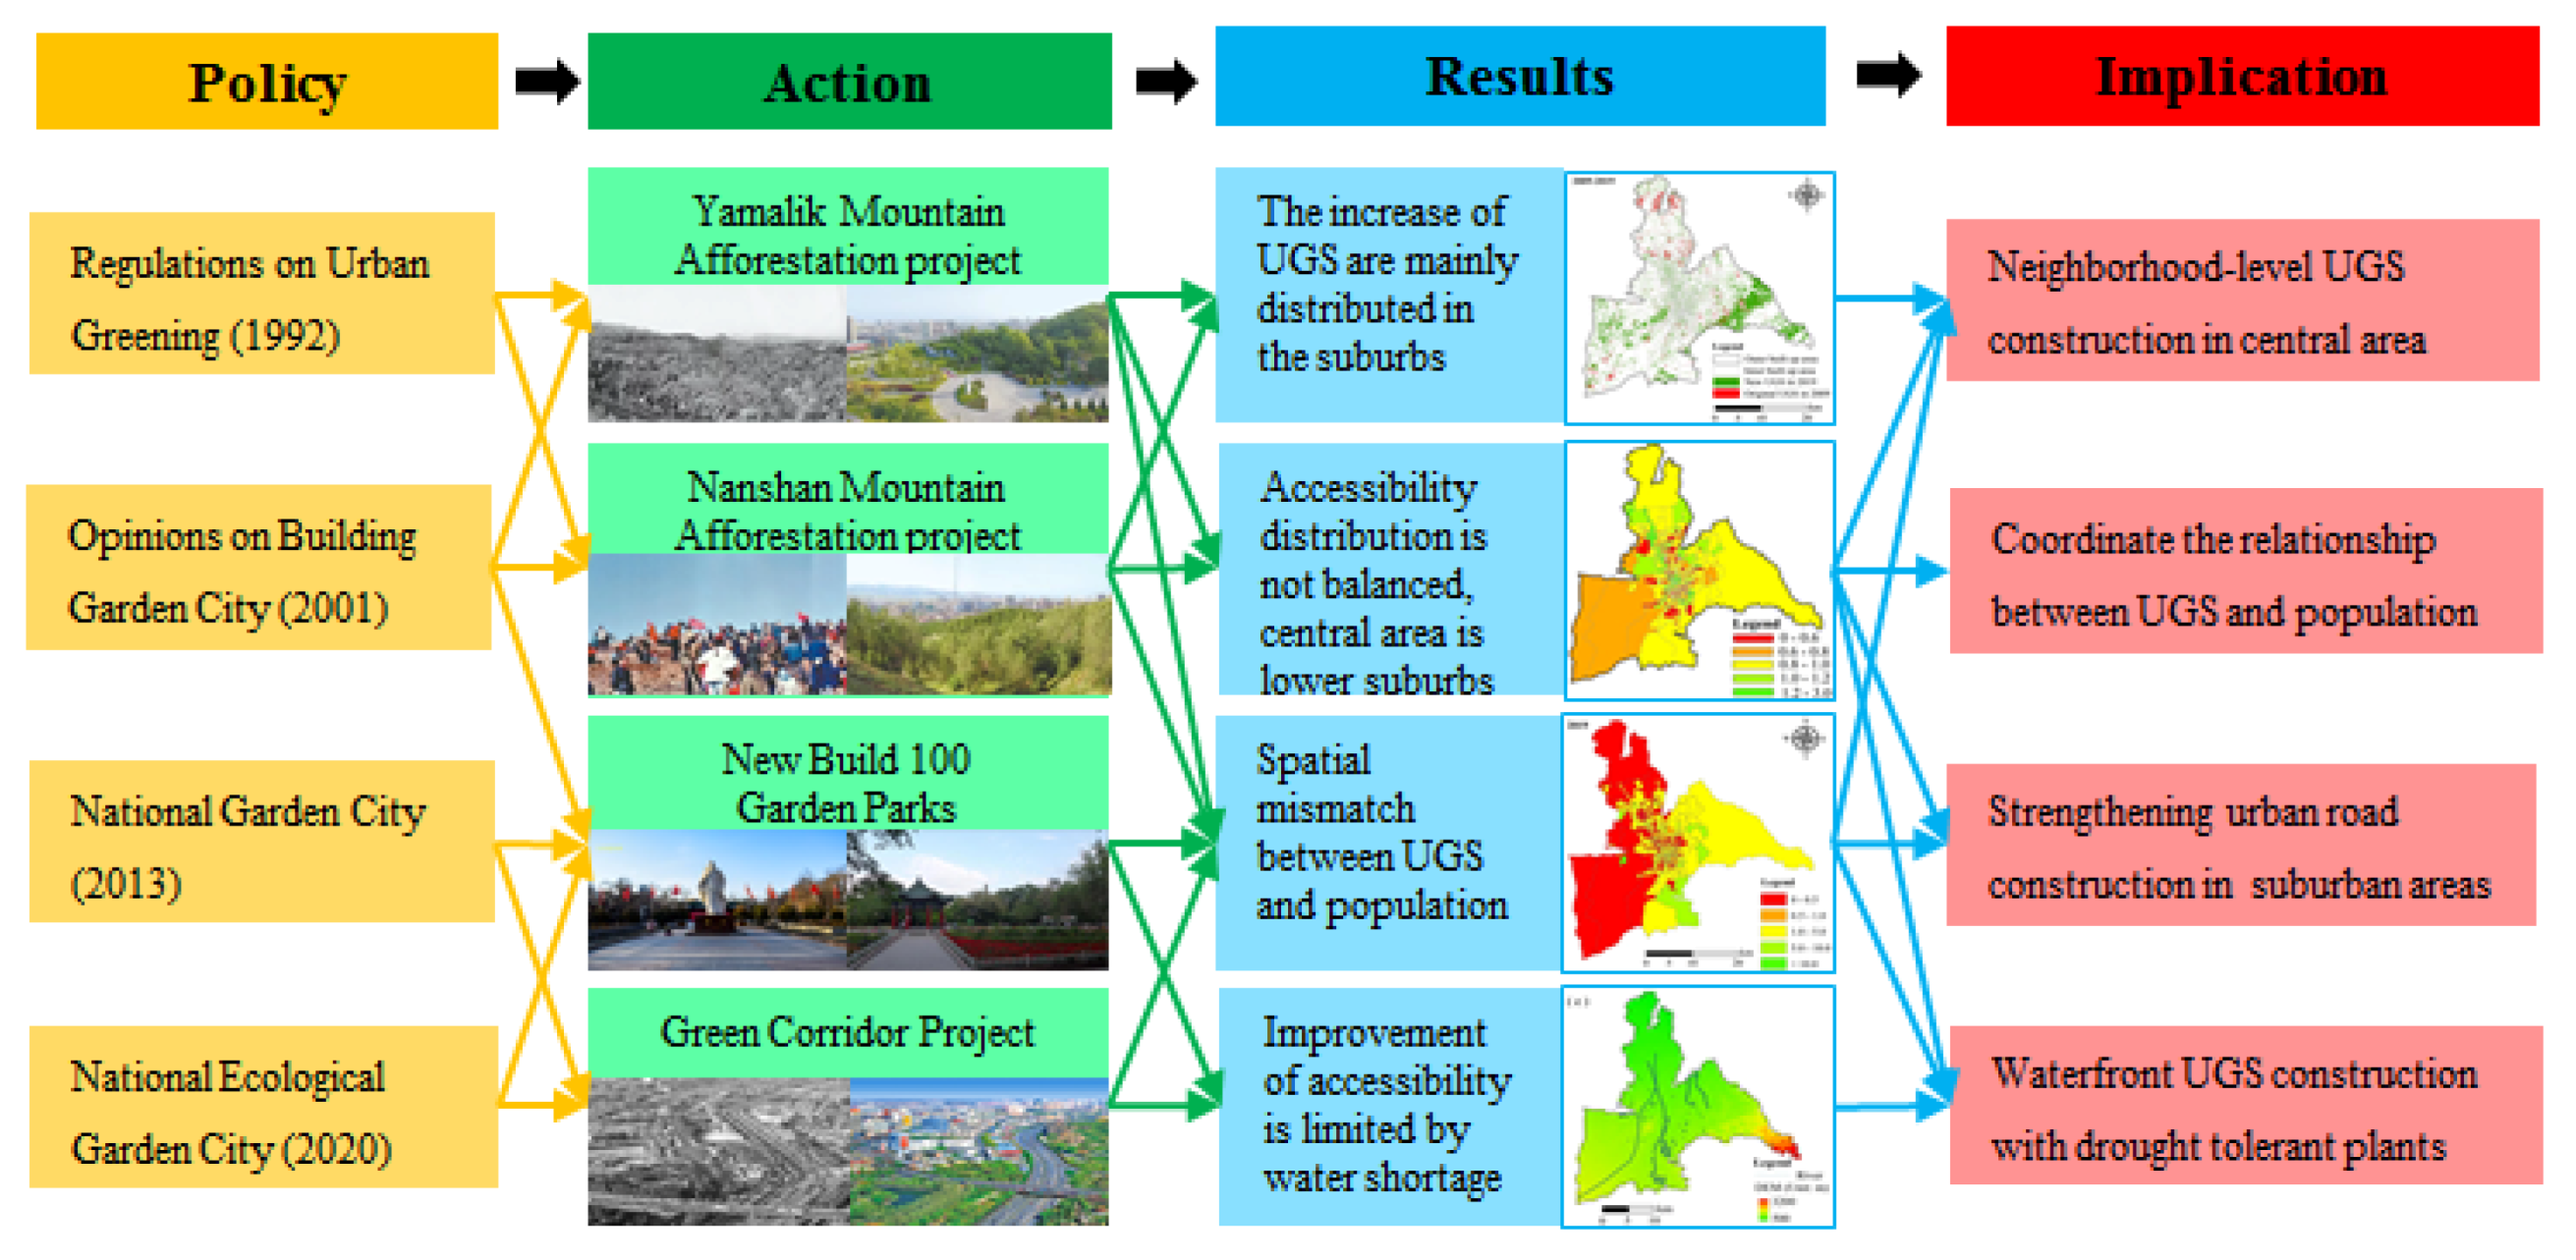
4.1. Influences of UGS Policies

From the overall planning of UGS, it can be seen that the implementation of the “Opinions on the Construction of a Garden City in Urumqi” (2001) plays an important role in the improvement of the UGS area and the accessibility of built-up areas. Firstly, Urumqi needs to build a National Garden City by 2013, with a green land rate of 30% in the built-up area, and establish a National Ecological Garden City by 2020. Our research shows that the UGS area of the urban built-up areas has increased by 5.48 times in the past two decades. In this stage, the policy mainly focuses on the afforestation of barren mountains in Urumqi, and the metro-level UGS grew rapidly from 1999 to 2019. This is different from the research result of Ye et al. (2018), who found that the high-density city of Macao was dominated by the construction of micro-scale UGS, and the improvement in UGS is concentrated in economically developed areas [30]. Due to the water shortage and space imbalance in arid areas, it is difficult to carry out large-scale greening in Urumqi’s built-up areas. Notably, our results show that the percentage of UGS in built-up areas in Urumqi in 2019 is lower than indicated in the official statistics (41.90%), which may be caused by different classification methods. For example, we only consider the UGS with an area of more than 100 m2, and quite a few road green spaces and industrial green spaces are not taken into account. Secondly, according to the implementation of “Opinions on the Construction of a Garden City in Urumqi,” the UGS construction mainly focuses on the afforestation of barren hills in the suburbs of built-up areas, such as the Afforestation Project of Yamalik Mountain, the Afforestation Project of Nanshan Mountain, and the Green Corridor Project of River Beach (Figure 9) [37]. Therefore, the improvement in UGS accessibility in the suburbs of built-up areas is the highest. However, the construction of UGS in the Shayibake and Xinshi districts is neglected, resulting in the uneven distribution of UGS accessibility. These results are inconsistent with those of Fan et al. (2016) and Ye et al. (2018) [5,30]. Fan et al.’s research results (2016) show that Shanghai and its surrounding cities improved the accessibility of UGS from 2000 to 2010. However, as the UGS construction is mainly concentrated in the inner part of the city, the outer part of the city still lags behind the average level of UGS accessibility in the whole city [5]. Ye et al.’s research (2018) shows that the UGS upgrade policy and the new micro-scale UGS construction policy have improved the UGS accessibility in the economically developed areas in the central urban area of Macao [30]. In contrast, UGS accessibility in Urumqi is more affected by the resource conditions. Due to the scarcity of water and land resources, it tends to be dominated by greening in remote suburbs, which leads to a high coverage of UGS in the suburbs and an obvious improvement in the accessibility of UGS. Thirdly, our results show that the UGS was mainly increased by metro-level UGS, and increased from 24.06 km2 in 1999 to 152.89 km2 in 2019. However, the neglect of neighborhood-level construction in densely populated areas leads to a low level of UGS accessibility and equity in central urban areas. This is different from the results of Xing et al. (2018), which show that the Wuhan urban area improves the quality supply of parks by increasing the number, size, and facilities of parks, such as restrooms, trails and paths, water features, shaded areas, and picnic areas, thus increasing the accessibility of UGS [38]. However, Urumqi is still in the development stage of improving the accessibility of UGS through quality. On the whole, with the implementation of the “Opinions on the Construction of a Garden City in Urumqi,” the amount of UGS in the built-up areas increased rapidly from 1999 to 2019, reflecting the fairness of UGS in the overall amount. However, the distribution and different UGS categories are neglected, which shows the spatial imbalance of UGS resources.

4.2. Local Context and Potential Limitations

Our study confirms that the distribution and construction of UGS from 1999 to 2019 was mainly focused on the boundary of built-up areas. However, the distribution of UGS is not consistent with other resource conditions. This leads to social inequity in the allocation of UGS accessible resources. Many studies have shown that the accessibility and equity of UGS resources is often related to the geographical location and development history of the city [23,39]. Combined with the background of oasis cities in arid areas, this study found that population density, road distribution, geographical location, and water resource restrictions had a restrictive effect on the accessibility and equity of UGS. Firstly, the population of built-up areas is increasing from the edge of the city to the center of the city, while the UGS is concentrated in the eastern edge of the built-up areas. The distribution of UGS is not consistent with the population distribution (Figure 1c), resulting in LQ values in the western and central areas that are generally lower than those in the east. Secondly, road distribution may be an important factor that leads to the accessibility of UGS resources. As the road network is mainly concentrated in the central area, the road density is low at the edge of the built-up area (Figure 1d). Although more UGS is concentrated at the edge of the built-up area, the low accessibility caused by traffic inconvenience aggravates the inequality of UGS. Thirdly, Urumqi is a mountainous city (Figure 1e). The north of the built-up area is mainly farmland and Gurbantunggut Desert, while the south is Tianshan Mountain. The central urban area is mainly occupied by building land. It is difficult to carry out metro-level greening work with shortages of water resources in the north and land resources in the central city. Therefore, inspired by the goal of creating a National Garden City in 2013, the local government further increased the UGS in Tianshan Mountain to achieve the goal. Therefore, the fairness of UGS distribution is neglected. Eventually, water shortage in arid areas may affect the equity of UGS. Urumqi is located in the arid region, with an average annual rainfall of 250 mm, an annual evaporation capacity of 2800 mm, and an average per capita water resource of only 319 m3, which represents a city with an extreme water shortage [26]. According to the Xinjiang Water Resources Bulletin in 2013, 77.9% of water is used for agriculture [40]. At the same time, the spatial distribution of surface water resources in built-up areas is not balanced (Figure 1e). Water resources are concentrated in the south, which makes it difficult to carry out large-scale greening projects in other areas, and further aggravates the unfairness of UGS resources.

4.3. Policy Implications of Sustainable UGS Development

Our results reveal the spatial and temporal distribution of UGS accessibility and equity, and provide policy implications for reducing inequality and promoting sustainable development (Figure 10). (1) According to the general urban plan of Urumqi (2001–2020), Urumqi will add 40.09 km2 of public green space and 49 green parks in 2020. We have identified the areas with low UGS accessibility on the sub-district levels. We encourage the use of this spatial map to guide future planning. (2) Our research shows that neighborhood-level UGS has a higher level of accessibility in the central city. Due to the scarcity of land resources in high-density urban areas, and considering the demand for water resources, we suggest that the central urban area should be dominated by the construction of neighborhood-level UGS, and the UGS should be planted with drought-tolerant plants with low water consumption to increase the accessibility of low-density UGS. (3) We found that the spatial mismatch between the distribution of UGS and population is one of the factors leading to the fairness of UGS. We suggest that the society’s demand for the allocation of UGS should be taken into consideration, and the UGS construction should be planned according to the spatial distribution of population, so as to expand the area and quantity of UGS in densely populated areas. (4) As a result of the limitation of geographical position and history in Urumqi, the built-up UGS area is focused on the edge and is unfair at district levels. For example, the main types of land are farmland and desert in the north of the built-up area, which leads to the difficulty of afforestation. On the one hand, we propose to improve the accessibility of marginal green space by strengthening urban road construction. On the other hand, we propose to develop agricultural tourism parks to replace UGS to improve the well-being of residents. In addition, considering such factors as population distribution, accessibility, and water resources in arid areas, we suggest that UGS construction should be combined with the distribution of surface water resources in built-up areas, and priority should be given to waterfront green space construction in Heping River, Shuimogou River, and other places to minimize the consumption of water resources.

4.4. Contributions and Limitations

In this study, the spatial and temporal patterns of UGS accessibility and equity in arid oasis cities were evaluated at a high resolution, which filled in the gap of our understanding of UGS accessibility. This research contributes to the literature in three ways. First, we used a unique case study area to investigate UGS accessibility in high-density, Asian, oasis cities. Our findings differ from those previously based in Western and Asian cities. Different results reflect the differences in UGS development history and population distribution. For example, the supply of UGS is high on the edge of built-up areas in Urumqi; the demand of residents is high in the central city. However, UGS are evenly distributed in Shanghai [5], Beijing [16], and Macau [30]. Secondly, we revealed the mismatch between UGS accessibility and equity in different UGS categories and spatial scales. Eventually, we discuss the change in UGS accessibility over time, and reveal the influence of UGS policy and the limitations of local UGS construction. Compared with Feng et al.’s research (2019) on the spatial distribution of UGS accessibility in Beijing [16], this study revealed the impact of policy changes on UGS accessibility and fairness through time-scale analysis, and evaluated the effectiveness of UGS policy. Compared with Ye et al.’s research (2018) on accessibility in Macao [30], we reveal the spatial and temporal differences from different UGS categories, and the research on different scales is particularly helpful to identify the need for policy intervention. Compared with the study of Fan et al. (2017) in Shanghai [5], we adopted the 2SFCA method, which can reflect the actual accessibility more accurately than the Euclidean distance method based on the balance between the supply and demand of UGS.
However, there are still several limitations in our study. Firstly, we only considered walking into the UGS. However, residents are also getting access to the UGS by cycling and driving [41,42]. Secondly, the UGS accessibility of residents was evaluated. However, the characteristics of residents (age, income, etc.) also have a high impact on the accessibility [43]. Due to the limitations of research data, we failed to fully analyze the differences in the accessibility of disadvantaged groups (low-income groups, elderly people, and children) to address specific inequalities. Thirdly, according to the estimation method of distance, the measurement of UGS accessibility distance can be divided into the linear distance method, the cumulative resistance method, and the road network analysis method. The straight-line distance method takes the straight-line distance (Euclidean distance) between the residence and the UGS as the distance between them. Based on the resistance coefficient of the land use type, the method of cumulative resistance calculates the path with the least cumulative resistance to the park to determine the accessibility distance. The Road Network Analysis Method is to calculate the shortest walking, bus, or driving distance from the place of residence to the UGS by the network analysis method based on the topological map of the road network. However, different methods produce different results. For example, La Rosa (2014) used the Euclidean distance and Network Analysis methods to calculate the UGS accessibility of Catania, and found that different methods had different results on UGS accessibility [8]. In this study, we used network analysis to simulate the actual travel situation. However, due to the lack of UGS entrance data and road obstacle data (such as road congestion and the number of traffic lights), we did not consider the influence of obstacle factors on accessibility in actual travel. Therefore, future research needs to further consider the resistance factor to improve the calculation accuracy, but also needs to discuss the influence of different methods for UGS accessibility. Fourthly, the accessibility of UGS is affected not only by distance, transportation mode, and the residents’ conditions, but also by area, quiet, spaciousness, safety, biodiversity, and infrastructure [28]. Therefore, it is necessary to explore the attractiveness of UGS quality factors to the accessibility of UGS. In Urumqi, there are 14 ethnic groups that are culturally diverse. Residents of different cultural backgrounds may have different preferences for UGS. Future studies should further consider the effects of these factors.

5. Conclusions

The results reveal that the distribution of UGS accessibility and equity is unbalanced in different spatial and temporal scales, and the UGS coverage is the lowest in the center of the built-up area. The distribution of accessibility resources at different UGS categories is unbalanced, and the Gini coefficient of neighborhood-level UGS is lower than that of the district-level and metro-level UGS. Therefore, attention should be paid to the neighborhood-level UGS construction of densely populated areas in urban centers. With the implementation of the UGS policy in Urumqi, the accessibility has been greatly improved. However, there is a mismatch between UGS and population distribution due to the influence of geographical location and water resources. Our research provides valuable insights into the development of targeted UGS planning to address social inequities.

Supplementary Materials

The following are available online at https://www.mdpi.com/1999-4907/11/6/690/s1, Table S1: Respondents’ perception of urban green accessibility indicators.

Author Contributions

Conceptualization, L.S. and Ü.H.; Methodology, L.S.; Software, L.S. and Z.M.; Validation, Ü.H., A.A., and M.W.; Formal analysis, L.S.; Investigation, L.S. and Z.M.; Resources, L.S.; Data curation, L.S. and Z.M.; Writing—original draft preparation, L.S.; Writing—review and editing, L.S. and Ü.H; Visualization, L.S.; Supervision, A.A.; Project administration, Ü.H.; Funding acquisition, Ü.H. All authors have read and agreed to the published version of the manuscript.

Funding

This research was funded by the National Natural Science Foundation of China, grant number 31770750, the Doctor Startup Foundation of Xinjiang University, grant number XJUBSCX-201915, and the Sino-German interdisciplinary joint program for innovative talents training funded by the China Scholarship Council, grant number 201907010026.

Acknowledgments

The authors thank the anonymous referees for comments that improved the content as well as the presentation of this paper.

Conflicts of Interest

The authors declare that there is no conflict of interest.

References

  1. Stessens, P.; Khan, A.Z.; Huysmans, M.; Canters, F. Analysing urban green space accessibility and quality: A GIS-based model as spatial decision support for urban ecosystem services in Brussels. Ecosyst. Serv. 2017, 28, 328–340. [Google Scholar] [CrossRef]
  2. World Health Organization. Urban Green Spaces and Health. A Review of Evidence; WHO Regional Office for Europe: Copenhagen, Denmark, 2016. [Google Scholar]
  3. Xiao, Y.; Wang, Z.; Li, Z.; Tang, Z. An assessment of urban park access in Shanghai—Implications for the social equity in urban China. Landsc. Urban Plan. 2017, 157, 383–393. [Google Scholar] [CrossRef]
  4. Wu, J.S.; Si, M.L.; Li, W.F. Spatial equity analysis of urban green space from the perspective of balance between supply and demand: A case study of Futian District, Shenzhen, China. Chin. J. Appl. Ecol. 2016, 27, 2831–2838. [Google Scholar]
  5. Fan, P.; Chen, J.; John, R. Urban landscape and environmental change during the economic transition on the Mongolian Plateau: Hohhot and Ulaanbaatar. Environ. Res. 2016, 144, 96–112. [Google Scholar] [CrossRef] [Green Version]
  6. United Nations. Sustainable Development Goals. Available online: https://www.un.org/sustainabledevelopment/zh/(2015) (accessed on 20 January 2020).
  7. McCormack, G.R.; Rock, M.; Toohey, A.M.; Hignell, D. Characteristics of urban parks associated with park use and physical activity: A review of qualitative research. Health Place 2010, 16, 712–726. [Google Scholar] [CrossRef]
  8. La Rosa, D. Accessibility to green spaces: GIS based indicators for sustainable planning in a dense urban context. Ecol. Indic. 2013, 11, 1742–1755. [Google Scholar] [CrossRef]
  9. Kabisch, N.; Haase, D. Green justice or just green? Provision of urban green spaces in Berlin, Germany. Landsc. Urban Plan. 2014, 122, 129–139. [Google Scholar] [CrossRef]
  10. Comber, A.; Brunsdon, C.; Green, E. Using a GIS-based network analysis to determine urban green space accessibility for different ethnic and religious groups. Landsc. Urban Plan. 2008, 86, 103–114. [Google Scholar] [CrossRef] [Green Version]
  11. Rojas, C.; Páez, A.; Barbosa, O.; Carrasco, J. Accessibility to urban green spaces in Chilean cities using adaptive thresholds. J. Transp. Geogr. 2016, 57, 227–240. [Google Scholar] [CrossRef]
  12. Wan, N.; Zou, B.; Sternberg, T. A three-step floating catchment area method for analyzing spatial access to health services. Int. J. Geogr. Inf. Sci. 2012, 26, 1073–1089. [Google Scholar] [CrossRef]
  13. Sallis, J.F.; Glanz, K. The Role of Built Environments in Physical Activity, Eating, and Obesity in Childhood. Future Child. 2006, 16, 89–108. [Google Scholar] [CrossRef]
  14. Bachi, L.; Ribeiro, S.C.; Hermes, J.; Saadi, A. Cultural Ecosystem Services (CES) in landscapes with a tourist vocation: Mapping and modeling the physical landscape components that bring benefits to people in a mountain tourist destination in southeastern Brazil. Tour. Manag. 2020, 77, 104–117. [Google Scholar] [CrossRef]
  15. Rigolon, A. A complex landscape of inequity in access to urban parks: A literature review. Landsc. Urban Plan. 2016, 153, 160–169. [Google Scholar] [CrossRef]
  16. Feng, S.; Chen, L.; Sun, R.; Feng, Z.; Li, J.; Khan, M.S.; Jing, Y. The Distribution and Accessibility of Urban Parks in Beijing, China: Implications of Social Equity. Int. J. Environ. Res. Public Health 2019, 16, 4894. [Google Scholar] [CrossRef] [PubMed] [Green Version]
  17. Park, Y.J.; Guldmann, J.M. Understanding disparities in community green accessibility under alternative green measures: A metropolitan-wide analysis of Columbus, Ohio, and Atlanta, Georgia. Landsc. Urban Plan. 2020, 200, 11–24. [Google Scholar] [CrossRef]
  18. Hamil, P.; Eller, J.K. Locating the green space paradox: A study of gentrification and public green space accessibility in Philadelphia, Pennsylvania. Landsc. Urban Plan. 2020, 195, 103–114. [Google Scholar] [CrossRef]
  19. Ward Thompson, C.; Roe, J.; Aspinall, P. Woodland improvements in deprived urban communities: What impact do they have on people’s activities and quality of life? Landsc. Urban Plan. 2013, 118, 79–89. [Google Scholar] [CrossRef]
  20. Schipperijn, J.; Stigsdotter, U.K.; Randrup, T.B.; Troelsen, J. Influences on the use of urban green space—A case study in Odense, Denmark. Urban For. Urban Green. 2010, 9, 25–32. [Google Scholar] [CrossRef]
  21. Xu, C.; Haase, D.; Pribadi, D.O.; Pauleit, S. Spatial variation of green space equity and its relation with urban dynamics: A case study in the region of Munich. Ecol Indic. 2018, 93, 512–523. [Google Scholar] [CrossRef]
  22. Wang, J.; Xu, C.; Pauleit, S.; Kindler, A.; Banzhaf, E. Spatial patterns of urban green infrastructure for equity: A novel exploration. J. Clean. Prod. 2019, 117, 858–871. [Google Scholar] [CrossRef]
  23. Tan, P.Y.; Wang, J.; Sia, A. Perspectives on five decades of the urban greening of Singapore. Cities 2013, 32, 24–32. [Google Scholar] [CrossRef]
  24. Wu, F.; Xu, J.; Yeh, A.G.O. Urban Development in Post-Reform China: State, Market, and Space; Routledge Press: London, UK, 2006. [Google Scholar]
  25. Urumqi Statistic Bureau. Urumqi Statistical Yearbook; China Statistical Press: Beijing, China, 2017.
  26. Ye, W.Y.; Yin, L.K.; Oian, Y. Study on plant community types and species diversity of main barren hill in Urumqi. J. Xinjiang Agric. Univ. 2015, 28, 44–48. [Google Scholar]
  27. Urumqi Statistic Bureau. Urumqi Statistical Yearbook; China Statistical Press: Beijing, China, 2014.
  28. Van Herzele, A.; Wiedemann, T. A monitoring tool for the provision of accessible and attractive urban green spaces. Landsc. Urban Plan. 2003, 63, 109–126. [Google Scholar] [CrossRef]
  29. Kong, F.; Nakagoshi, N. Spatial-temporal gradient analysis of urban green spaces in Jinan, China. Landsc. Urban Plan. 2006, 78, 147–164. [Google Scholar] [CrossRef]
  30. Ye, C.D.; Hu, L.; Li, M. Urban green space accessibility changes in a high-density city: A case study of Macau from 2010 to 2015. J. Transp. Geogr. 2018, 66, 106–115. [Google Scholar] [CrossRef]
  31. Luo, W. Using a GIS-based floating catchment method to assess areas with shortage of physicians. Health Place 2004, 10, 1–11. [Google Scholar] [CrossRef]
  32. Dai, D. Racial/ethnic and socioeconomic disparities in urban green space accessibility: Where to intervene? Landsc. Urban Plan. 2011, 102, 234–244. [Google Scholar] [CrossRef]
  33. Wang, A.; Wang, H.; Chan, E.H.W. The incompatibility in urban green space provision: An agent-based comparative study. J. Clean. Prod. 2020, 253, 120–127. [Google Scholar] [CrossRef]
  34. Lorenz, M.O. Methods of Measuring the Concentration of Wealth. Publ. Am. Stat. Assoc. 1905, 9, 209. [Google Scholar] [CrossRef]
  35. Delbosc, A.; Currie, G. Using Lorenz curves to assess public transport equity. J. Transp. Geogr. 2011, 19, 1252–1259. [Google Scholar] [CrossRef]
  36. Isserman, A.M. The Location Quotient Approach to Estimating Regional Economic Impacts. J. Am. Inst. Plan. 1977, 43, 33–41. [Google Scholar] [CrossRef]
  37. Urumqi Forestry Bureau. Urban Green Space System Planning of Urumqi; Urumqi Forestry Bureau: Urumqi, China, 2014. [Google Scholar]
  38. Xing, L.; Liu, Y.; Liu, X.; Wei, X.; Mao, Y. Spatio-temporal disparity between demand and supply of park green space service in urban area of Wuhan from 2000 to 2014. Habitat. Int. 2018, 71, 49–59. [Google Scholar] [CrossRef]
  39. Tian, Y.; Jim, C.Y.; Wang, H. Assessing the landscape and ecological quality of urban green spaces in a compact city. Landsc. Urban Plan. 2014, 121, 97–108. [Google Scholar] [CrossRef]
  40. Xinjiang Water Resources Bureau. Xinjiang Water Resources Bulletin; Xinjiang Water Resources Bureau: Xinjiang, China, 2013. [Google Scholar]
  41. Wang, L.; Liu, Y.; Sun, C.; Liu, Y. Accessibility impact of the present and future high-speed rail network: A case study of Jiangsu Province, China. J. Transp. Geogr. 2016, 54, 161–172. [Google Scholar] [CrossRef]
  42. Guzman, L.A.; Oviedo, D.; Rivera, C. Assessing equity in transport accessibility to work and study: The Bogotá region. J. Transp. Geogr. 2017, 58, 236–246. [Google Scholar] [CrossRef]
  43. Gu, X.; Li, Q.; Chand, S. Factors influencing residents’ access to and use of country parks in Shanghai, China. Cities 2020, 97, 102501. [Google Scholar] [CrossRef]
Figure 1. Urumqi and its built up area (a); the distribution of the UGS (b); the distribution of districts and population (c); the distribution of road (d); rivers and elevation (e).
Forests 11 00690 g001
Figure 2. The change in UGS area in Urumqi from 1999 to 2019.
Forests 11 00690 g002
Figure 3. UGS changes from 1999 to 2019.
Forests 11 00690 g003
Figure 4. Spatial and temporal variation in UGS accessibility.
Forests 11 00690 g004
Figure 5. Spatial and temporal variation in accessibility among different UGS categories.
Forests 11 00690 g005
Figure 6. UGS accessibility distribution and its changes from 1999 to 2019 at different levels.
Forests 11 00690 g006
Figure 7. Lorenz curve for the distribution of UGS resources.
Forests 11 00690 g007
Figure 8. Spatial and temporal variation in from 1999 to 2019.
Forests 11 00690 g008
Figure 9. UGS construction action to increase green coverage from 1980 to 2019.
Forests 11 00690 g009
Figure 10. UGS construction implications of sustainable development in Urumqi.
Forests 11 00690 g010
Table 1. Urban green space (UGS) planning and construction implementation in Urumqi.
StagesPolicy and TargetAction and Achievement
First stage (1992–2000)Regulations on Urban Greening (1992);Afforestation project of Yamalik Mountain and Nanshan Mountain;
The per capita UGS and UGS coverage rate should be more than 5 m2 and 30% in 2000.UGS coverage rate had reached 23.3%, with 5.5 m2 of public green space per capita in 1999.
Second stage (2001–2010)Opinions on Urumqi Garden City Building (2001);Urumqi has added 100 new garden parks;
Built Regional Garden City of Autonomous Region Xinjiang (2010).Urumqi has established a garden city in 2010.
Third stage (2011–2020)Opinions on Urumqi Garden City Building (2001);Green Corridor Project of River Beach;
Build National Garden City by 2013 and National Ecological Garden City by 2020.UGS coverage rate in built-up areas was 35.35% and successfully established National Garden City in 2014.
Table 2. Definition of UGS in Urumqi.
UGS CategoriesDefinitionImages
Neighborhood levelGenerally, for community use with basic facilities; area size is lower than 1000 m2. Forests 11 00690 i001
District levelFor special use with open spaces, plants and basic facilities; area size is more than 1000 m2. Forests 11 00690 i002
Metro levelOpen forest park, natural forests, and grasslands; area size is more than 3000 m2. Forests 11 00690 i003
Table 3. Least significant differences in social equity.
Neighborhood Level199920092019District Level199920092019
199910.0560.036 *199910.0830.040 *
2009 10.040 *2009 10.053
2019 12019 1
Metro Level1999200920192019 YearNeighborhood LevelDistrict LevelMetro Level
199910.1120.106Neighborhood level10.070.028 *
2009 10.163District level 10.042 *
2019 1Metro level 1
* Significant at the 0.05 level.
Table 4. LQ distribution and its changes at the district level.
Area1999200920191999–20092009–20191999–2019
Xinshi0.6120.6350.9260.023↑0.291↑0.314↑
Shuimogou1.6092.6144.7201.005↑2.106↑3.111↑
Shayibake0.7530.840.8690.087↑0.029↑0.116↑
Tianshan1.3412.3763.5871.035↑1.211↑2.246↑
Total1.0791.6162.5260.538↑0.909↑1.447↑
↑represents an increasing trend.

