Article

A Comparative Evaluation of Three Stem Profile Equations for Three Precious Tree Species in Southern China

1
Research Center of Forest Management Engineering of State Forestry and Grassland Administration, Beijing Forestry University, Beijing 100083, China
2
College of Landscape Architecture, Shangqiu University, Shangqiu 476113, China
3
Key Laboratory of Forest Management and Growth Modelling, NFGA, Institute of Forest Resource Information Techniques, Chinese Academy of Forestry, Beijing 100091, China
4
Guangxi Youyiguan Forest Ecosystem Research Station, Pingxiang 532600, China
5
Experiment Center of Tropical Forestry, Chinese Academy of Forestry, Pingxiang 532600, China
*
Authors to whom correspondence should be addressed.
Forests 2020, 11(6), 669; https://doi.org/10.3390/f11060669
Submission received: 24 April 2020 / Revised: 25 May 2020 / Accepted: 4 June 2020 / Published: 11 June 2020
(This article belongs to the Special Issue Modeling the Performance of Wood and Wood Products)

Abstract

:
Accurately describing the stem curve of precious tree species and estimating the quantity of various types of wood and their volume in the tropics can provide technical support for reasonable bucking. This study utilized Erythrophleum fordii, Castanopsis hystrix and Tectona grandis as study objects. Forty replicates of each species were used for a total of 120 individual trees. Their tape equations were constructed using simple tape equations, segmented taper equations and variable form taper equations. Statistical indicators were utilized to determine the best taper equation for the three types of precious tree species. A number of methods were compared and analyzed, including the index of correlation, the residual sum of squares, the mean prediction error, the variance of prediction errors and the root mean square error. Finally, a preliminary quantitative analysis was conducted to determine the trends of these three types of tree species. The result shows that the precision of the three predictions developed for each species is high, and, in particular, the segmented taper equations with optimized algorithms is the best. The tendency of the three species to vary was shown to be the highest for T. grandis in the range of 0.0 to 0.8 for its relative height, followed by E. fordii, while the variation of C. hystrix was the smallest. However, in the range of 0.8 to 1.0 relative height, the variation of Castanopsis hystrix was the largest, and the variation of both E. fordii and T. grandis were almost the same. Therefore, the segmented taper equations with optimization algorithms was recommended to fit the three types of tree species in the tropics. These types of equations can be used to estimate the stumpage and timber quantity and as a guide reasonable bucking for these three species.

1. Introduction

Precious tree species are primarily distributed in tropical provinces such as Guangxi and Fujian in China. Among them, Castanopsis hystrix, Erythrophleum fordii and Tectona grandis are primarily distributed in Guangxi, Guangdong, Fujian Provinces. These tree species are well known for the hardness of their wood, and its extreme resistance to corrosion, water and moisture. Moreover, these tree species not only provide excellent materials for construction, craftsmanship and fine furniture but they can also be used for ship boards and masts [1]. Large-scale plantings of these tree species continue to increase in southern China, since they are well adapted to the growing conditions there. The reputation of the three types of timber comes from their matchless combination of qualities, such as termite, fungus and weathering resistance, lightness and strength and seasoning capacity without splitting, cracking, warping or materially altering their shape [2]. Therefore, the demand of these high-value materials in the lumber market is strong. The market demand for these species has been rising steadily in China in recent years, causing the tree species to become a scarcer resource, and the current market relies heavily on imports. China only uses 5% of the world’s forest area and 3% of the world’s forest stock to support the growing wood consumption demand of 23% of the world’s population [2]. The security situation of the forest resources is very serious. Many artificial timber forests are cultured to meet the increasing demands from civilians. However, unreasonable tree species composition and low economic benefits cause challenges in utilizing the artificial timber forests. In addition to these challenges, the quality of the log products still determines the benefits of wood production in the current intense market competition [3]. According to foreign reports, optimizing tree constitution can improve economic efficiency by 39–55% [4]. Thus, to accurately estimate the quantity and constitution of precious tree species in the artificial timber forests is a key technical problem that needs to be solved, and the taper equation can be used for this purpose [5]. The taper of trees correlates with the saw timber quality, and growth-stem-profile models can generally be characterized as segmented or continuous. A geometric solid may be assumed to approximate the stem form in a segment, and the form of this solid may be described by a sub-function. To perform continuous predictions, the sub-functions are constrained to coincide at the points of the join [6]. A number of studies focus on the stem shape of fast-growing timber species, since the stem shape control of the trees plays a fundamental role in improving the log quality of the forest trees [7]. The main method for describing the change of stem shape is through the taper equation, which mathematically describes the degree of decrease in the diameter when the height increases [8].
In forestry, the taper is usually understood to describe the stem shape and can be used to calculate the total volume of the stem and each segment of the log as well as the volume and length of the timber from the height of the root to the diameter of any small head. According to the type of equation, the equation can be roughly classified into three categories: (1) the simple taper equation [9,10], (2) the segmented taper equation [11,12,13,14,15] and (3) the variable exponent equation [16,17,18]. Max et al. [11] and Cao et al. [12] established a stem curve model using the simple taper equation. Newnham [16] and Kozak [19] used variable parameters to establish the stem equation for interpretable variables. These models can predict the stem shapes more accurately. In practical applications, it is impossible for any one of the taper equations to describe the stem shape of all tree species satisfactorily, nor to apply to all the timbers of a certain tree species. It is necessary to establish its own stem shape model for each of the different tree species [20].
Currently, China has had some achievements on the stem shape model of the main timber species. Zeng et al. [5] proposed the general form of the optimal structure of the taper equation with the Chinese fir as an example. Wang [21] studied the theoretical bucking and the production of timber yields based on the taper equation. The results of that Jiang et al. [14] studied the taper of the Chinese larch stem based on a nonlinear hybrid model show that the fitting accuracy of the mixed effect model is higher than that of the basic model. Hu et al. [22] focused on the larch plantations with variable exponential taper equations and compared the stem shape quality of different densities. The results indicated that the taper model from Lee et al. [23] has a good fitting effect, and the stem shape quality of the trees with larger density (870 plants/hm2). The larch of the moderate density stand (487 plants/hm2) has good stem shape quality. However, so far, there have been few reports on the stem curve of precious tree species in China. Therefore, this work aims to (1) demonstrate the feasibility of developing statistically and legally defensible estimates of the precious timber product volume in the south subtropical region of China; (2) study three main precious tree species, Erythrophleum fordii, Castanopsis hystrix and Tectona grandis and construct the best stem curve models for each of the species; (3) estimate the stumpage of these tree species and the refined estimation of each species and provide intelligent technical support for reasonable bucking.

2. Materials and Methods

2.1. Data Source and Processing

The experimental site is the Tropical Forestry Experimental Center of the Chinese Academy of Forestry and Guangxi Youyiguan Forest Ecosystem Research Station, Pingxiang City, Guangxi Zhuang Autonomous Region, 106°41′ to 106°59′ E, 21°57′ to 22°16′ N. The region belongs to the subtropical monsoon climate zone with abundant rainfall, an average annual temperature of 23.4 °C and the annual rainfall of 1062 to 1772 mm. The soil is mainly red soil developed by granite with some limestone soil, acid purple soil and alluvial soil. The main invaluable species cultivated include Castanopsis hystrix, Erythrophleum fordii, Tectona grandis, Betula alnoides and Magnoliaceae glance. These species have been managed for more than 30 years, and the largest diameter at breast height has reached more than 40 cm [24].
The modeling data is individual data from 30 standard pure forest plots of the Tropical Forestry Experimental Center (10 plots each of Castanopsis hystrix, Erythrophleum fordii and Tectona grandis, where each plot area is 0.06 hm2). The specific method of data acquisition is the analysis tree data of invaluable tree species including the three species of Castanopsis hystrix, Erythrophleum fordii and Tectona grandis. Setting up 10 temporary sample plots of 20 × 30 m for each tree species (30 pieces in total), and selecting one of the dominant trees, the sub-dominant trees, the average trees and the pressed trees in the sample plots. That is, each tree species has 10 dominant trees, 10 sub-dominant trees, 10 average trees and 10 pressed trees, in total 40 fallen timbers (Table 1). The data is measured diameters at 0 m, 0.3 m, 1.3 m, 2.0 m and then every further 2 m of tree stem, and the following indicators are measured: (1) tree height; (2) tree base (0.1 m), cross-section height (0.3 m) and the center of 1.3 m with outside and inside bark diameter; (3) the outside and inside bark diameter diameters in the east–west direction and the north1south direction at the center of each 2 m segment for the fallen timbers. The average observed value in the four directions is the segmented outside and inside bark diameter of the respective zones [25]. The measurement accuracy of the diameter at breast height (DBH) is kept at 0.01 cm, and the measurement accuracy of the tree height is kept at 0.01 m. The quantity relative height ( h / H ), where h is the height of the cross-section from the ground (m) and H is the height of the tree (m), is used to indicate the relative tree height. Additionally, relative diameter d / D , where d is the corresponding cross-sectional diameter at relative height h (cm) and D is the DBH (cm), is used to indicate the corresponding diameter(Figure 1).The h / H and d / D of each tree species are negatively correlated, and there is no obvious abnormal value in the experimental data.

2.2. Model Construction and Test Method

2.2.1. Basic Model

Three simple tree species in the experimental area were modeled using the simple taper equation, the segmented taper equation and the variable exponent taper equation. The models constructed by the three methods are analyzed and compared statistically using some criteria. Finally, an optimal equation is obtained for estimating the stem curve of the three tree species.
(1) Simple taper equation. The expression of the typical simple taper equation [7] model is
d 2 / D 2 = a + b ( h / H ) + c ( h / H ) 2
where a, b, c are the parameters of the equation, D is the DBH with the outside bark (cm), H is the height of the whole tree (m), h is the height from the ground (m), and d is the diameter with the outside bark at the height h of the stem (cm).
(2) Segmented taper equation. The typical segmented taper model [12] consists of three polynomials, representing the different geometries of the lower, middle and upper parts of the stem. That is, the stem is composed of a concave body, a parabolic body and a vertebral body, and the expression of the model is as shown in (2):
( d / D ) 2 = b 1 ( h / H 1 ) + b 2 ( h 2 / H 2 1 ) + b 3 ( a 1 h / H ) 2 I 1 + b 4 ( a 2 h / H ) 2 I 2
where   b 1 ,   b 2 ,   b 3 ,   b 4 are the parameters of the equation, a 1 and a 2 are the relative heights of the lower and upper stem in the inflexion points, respectively, d / D is the relative diameter, h / H is the relative tree height and I 1 and I 2 are the indicator variables of the model. When h / H a 1 I 1 = 1 , otherwise I 1 = 0 , and when h / H a 2 , I 2 = 1 , otherwise I 2 = 0 .
(3) Variable exponent taper equation. The expression of the variable exponent taper model proposed by Lee et al. [23] is as shown in (3):
d = b 1 D b 2 ( 1 h r ) b 3 h r 2 + b 4 h r + b 5
where b 1 , b 2 ,   b 3 , b 4 ,   b 5 are the parameters of the equation, b 1 , b 2 ,   b 3 ,   b 5 > 0 ,     b 4 < 0 , h r is the relative height of the tree.

2.2.2. Model Evaluation and Test Indicators

Since the research object is the precious tree species, and the data is based on the investigation of the fallen objective tree, that is, the data is obtained through destructive investigation, the total observed data is less. Therefore, the authors use 10-fold cross-validation to construct and test the stem curve of each tree species. All the experimental data are randomly divided into 10 groups. One group is eliminated each time in order, and the remaining nine groups are used for modeling and the eliminated groups are tested. The 10th fold is sequentially calculated. By utilizing the cross-validation scheme, the basic models (1)–(3) are analyzed and compared using the mean prediction error ( e ¯ ), the variance of the prediction errors ( σ 2 ) and the root mean square error ( δ ). Thus, a model with the best prediction effect to analyze the stem curve of invaluable trees species is determined. The estimated values of the parameters from the three basic models are calculated using all of the experimental data. The model is further analyzed by using the index of correlation (R2) and the residual sum of squares (RSS). Finally, the optimal taper equation is determined for each of invaluable tree species, Erythrophleum fordii, Castanopsis hystrix and Tectona grandis. The test indicators are calculated as follows:
e ¯ = y i y ^ i N
σ 2 = ( y i y ^ i ) 2 N 1
δ = e 2 + σ 2
R 2 = 1 ( y i y ^ i ) 2 ( y i y N ) 2
R S S = ( y i y ^ i ) 2
where y i is the actual measured value, y ^ i is the predicted value generated by the model, and N is the number of total observations, RSS is the residual sum of squares.
All calculations are implemented on ForStat statistical software [26].

3. Results

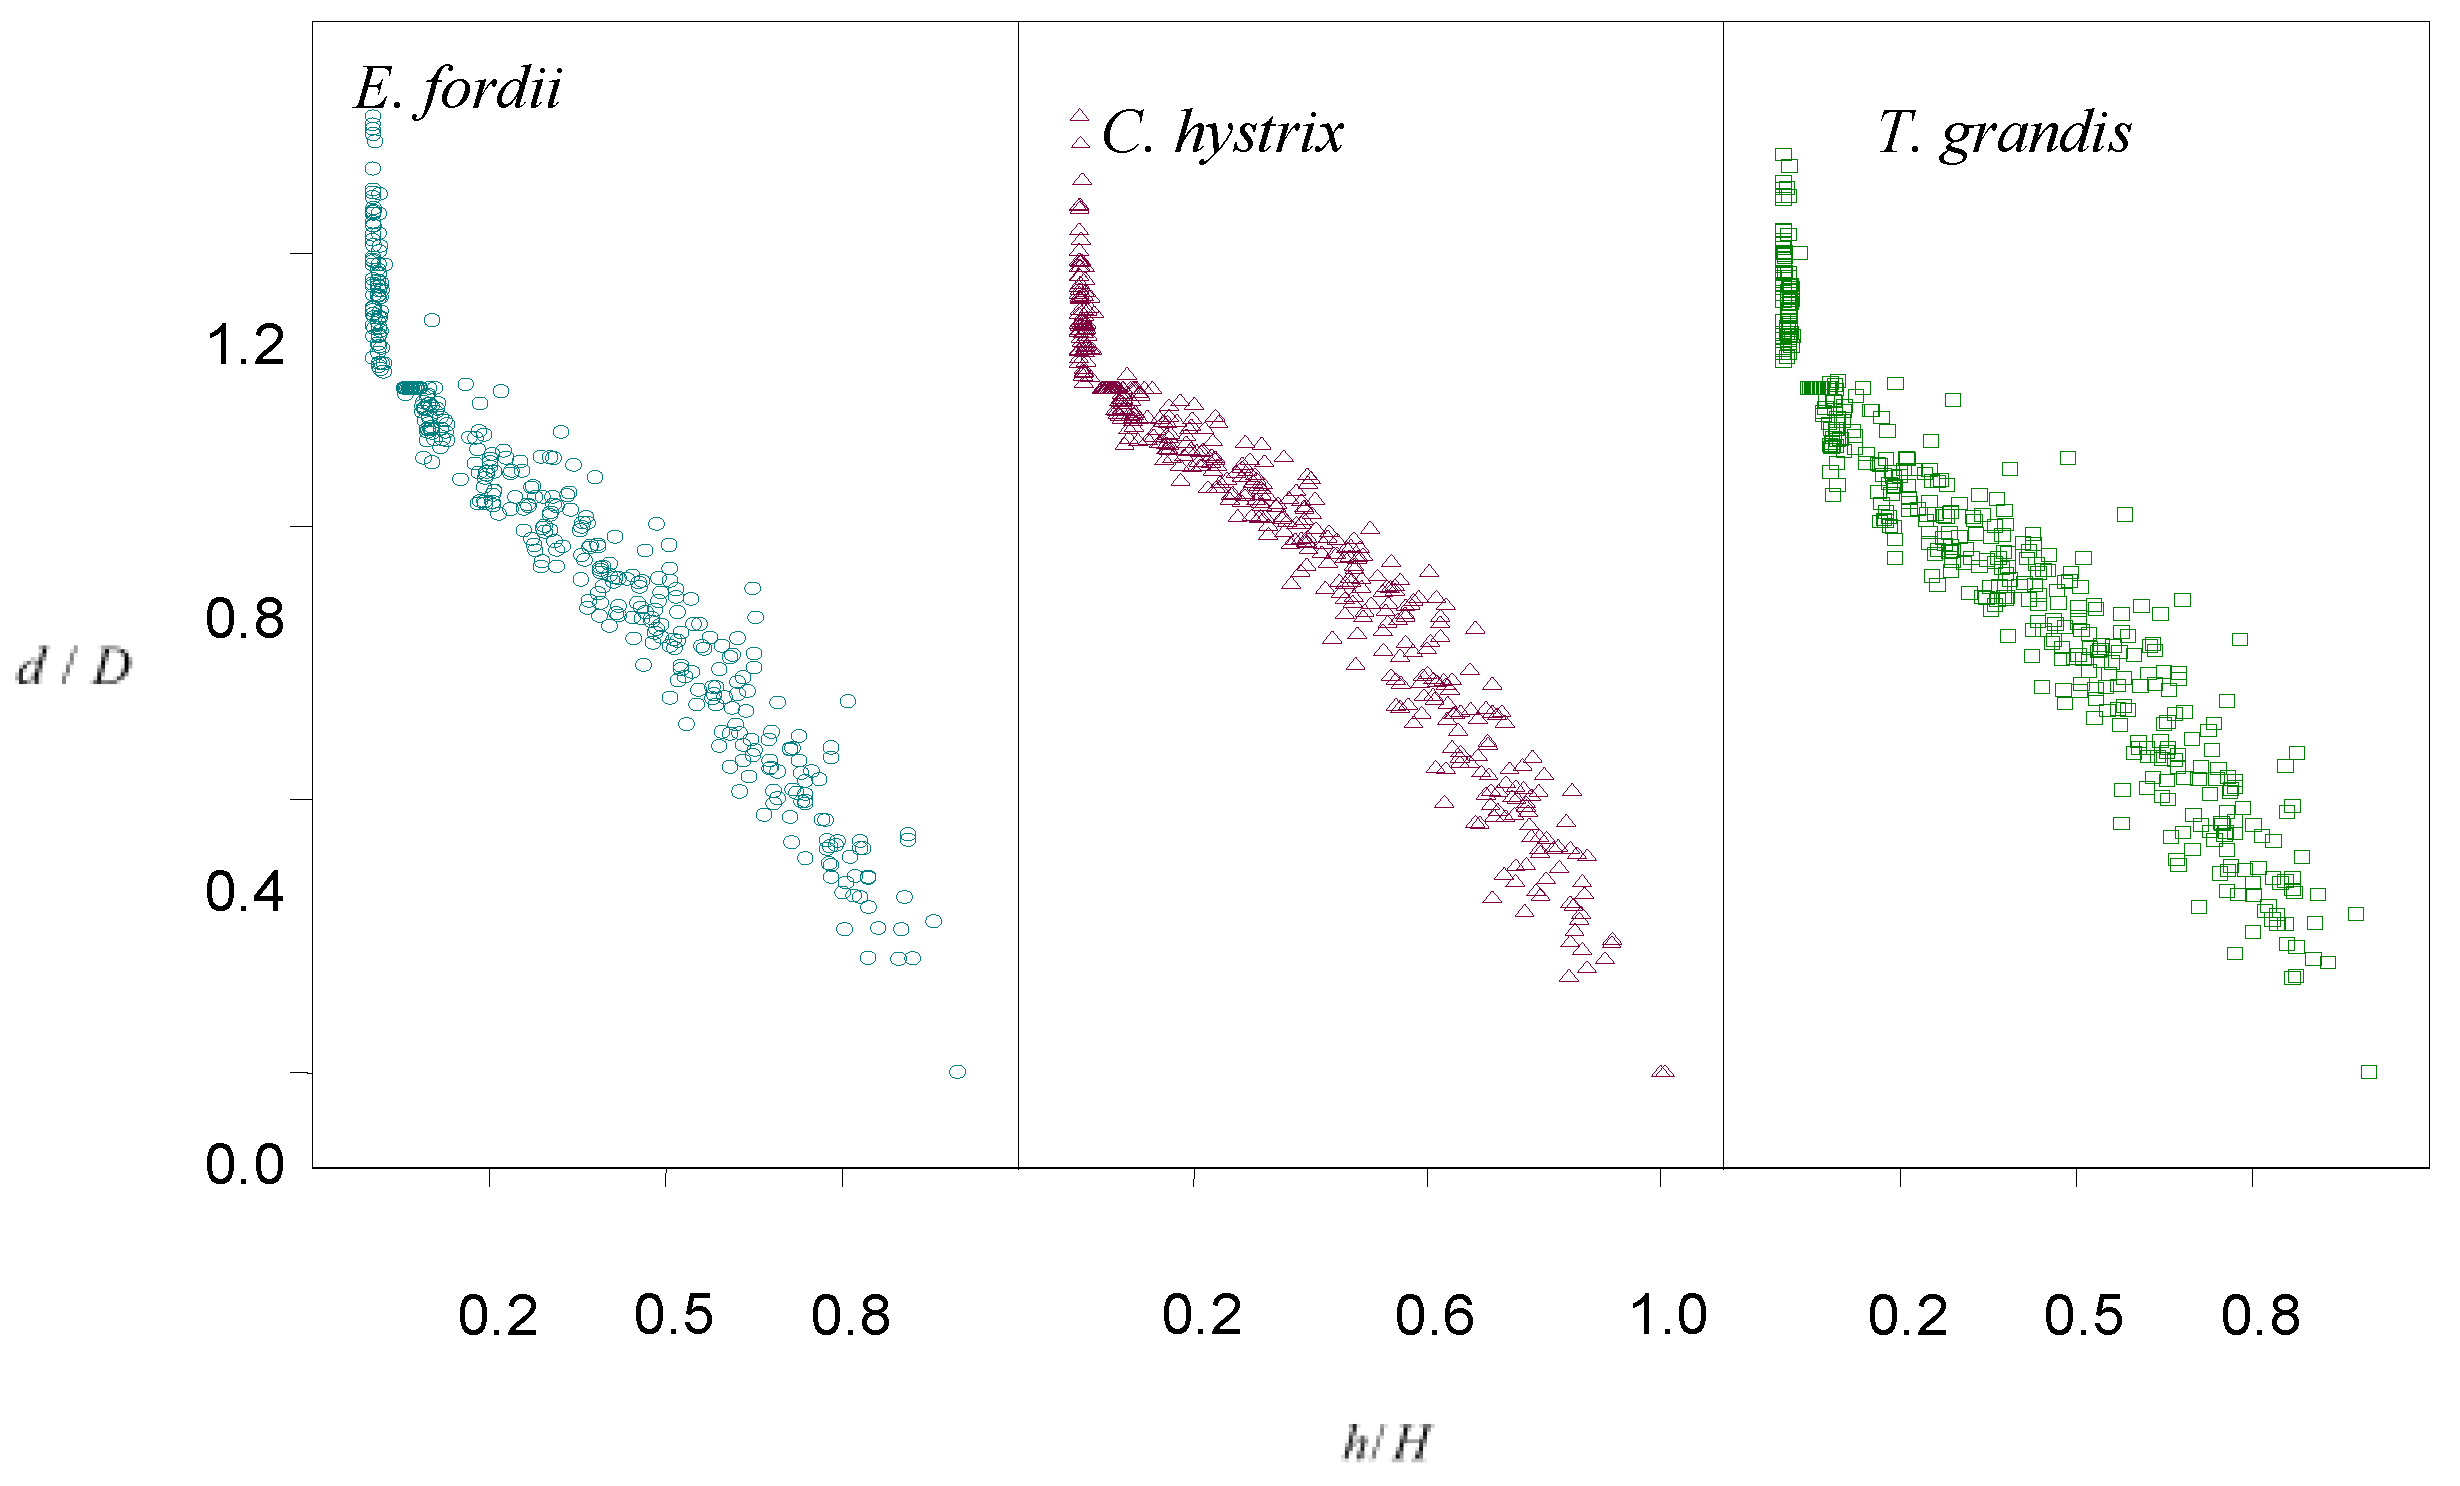
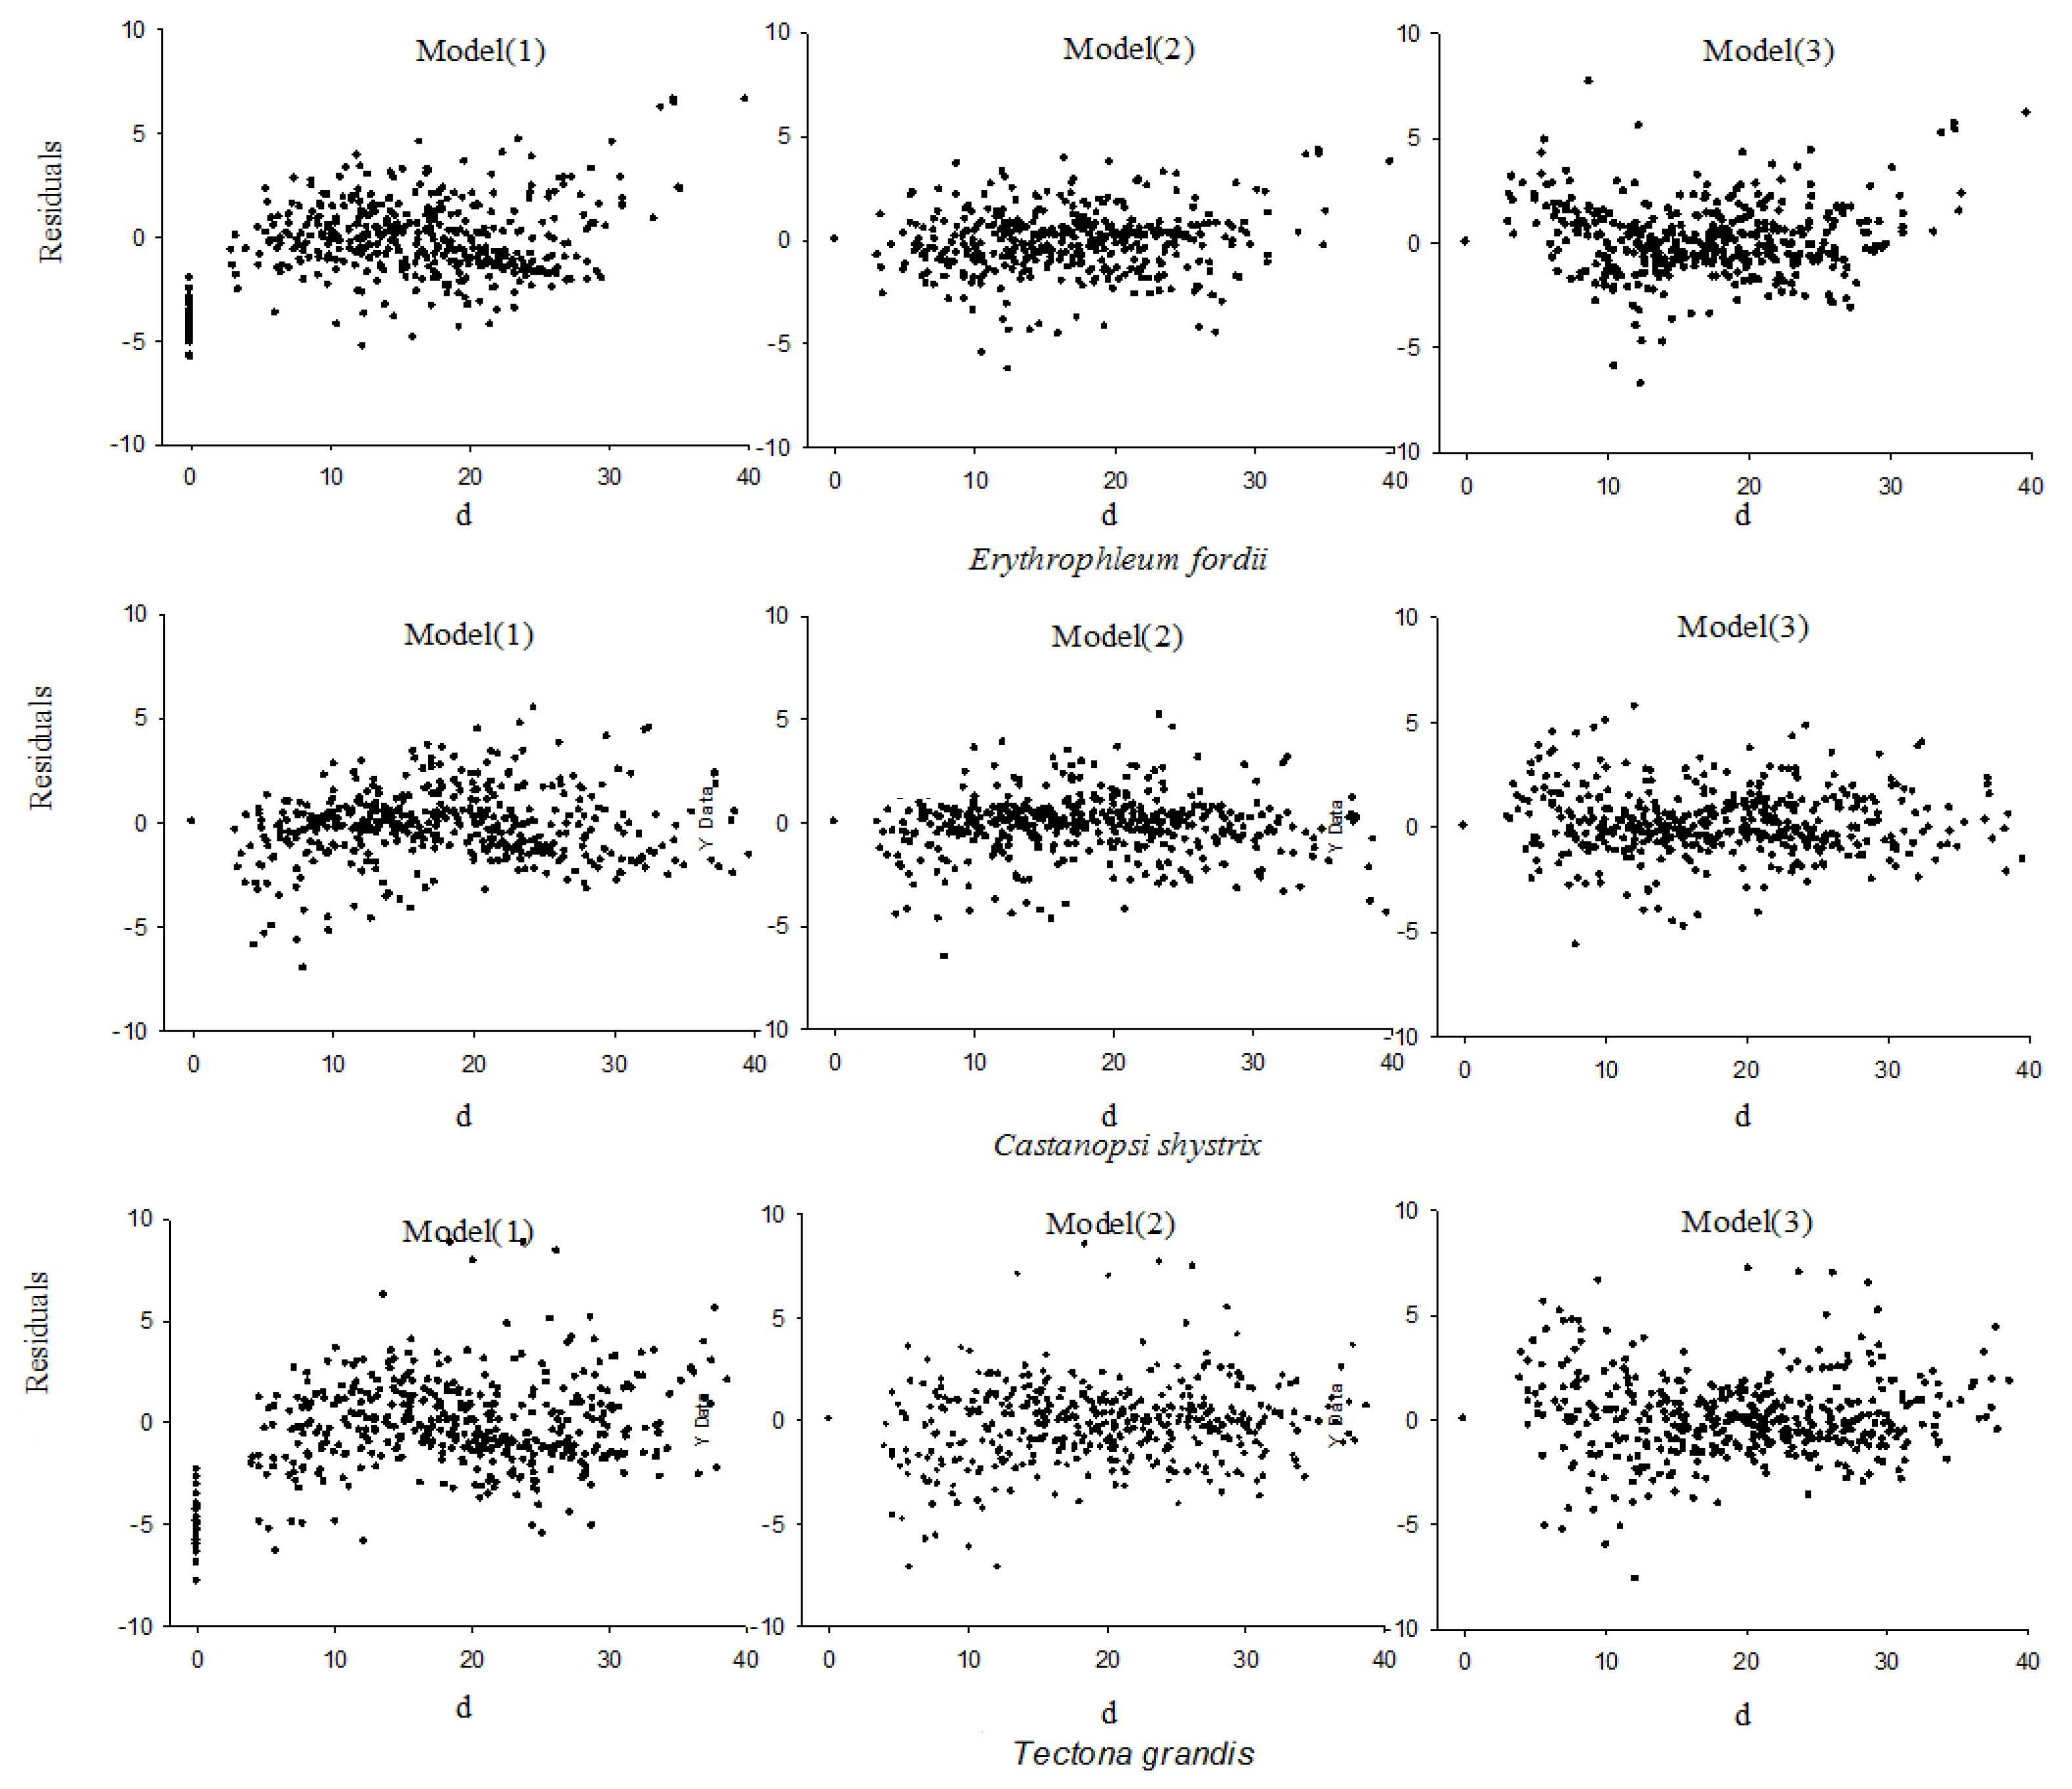
3.1. Selection of the Stem Curve Models for Three Tree Species

In the selection of the basic model, Jiang et al. [24] used the model (1) to compile the timber-produced rate table of Chinese fir. The test results of the accuracy met the requirements and good prediction results were obtained. Due to the good fitting effect of (2), it has been chosen by many scholars in the literature as the basic model [12,15,22]. The authors used the RSS as the objective function and a two-factor automatic optimization algorithm to determine the initial values of a 1 and a 2 of the model (2). It is theoretically guaranteed that the model has the highest prediction accuracy corresponding to the inflection point parameters searched under the same modeling data [27]. Hu et al. [22] studied the stem shape of larch plantations using the variable parameter taper equations. The results showed that the variable exponent equation proposed by Lee et al. [23] is more effective and can be used to describe the stem shape of larch plantations. In this study, the calculation results of the 10th-fold cross-validation schemes corresponding to the models (1) to (3) of Erythrophleum fordii, Castanopsis hystrix and Tectona grandis are shown in Table 2.
Three models have better prediction effects on the Erythrophleum fordii, Castanopsis hystrix and Tectona grandis (Table 2). The mean prediction error ( e ¯ ) is smallest for each species is obtained from model (3) and largest from model (1). For the variance of prediction errors ( σ 2 ), Erythrophleum fordii, Castanopsis hystrix and Tectona grandis model (2) is minimum and model (1) is the largest, namely. For δ for three tree species, again model (2) is the smallest and model (1) has the worst. As far as the specific tree species are concerned, the δ of the Erythrophleum fordii model (2) is smaller than model (1) and model (3) by 29.6% and 9.8% respectively, for the Castanopsis hystrix model (2) is smaller by 11.4% and 2.8%, respectively, and the Tectona grandis model is less by 24.21% and 7.44%, respectively. Therefore, the model (2) has the best prediction effect on the stem curve for all three tree species.
There are some differences in the accuracy of the models corresponding to different tree species, and they can be summarized as follows: The e ¯ of model (1) is largest for the Tectona grandis maximum and the minimum for Castanopsis hystrix; The e ¯ of model (2) and the model (3) are the largest and the Erythrophleum fordii is smallest. It can be seen that the e ¯ corresponding to the models (1) to (3) is largest for Tectona grandis. For σ 2 and   δ , the Castanopsis hystrix is the smallest for each model, the Erythrophleum fordii is the second, and the Tectona grandis is the largest, which further explains that the three models have better predictions for the stem curve of each tree species. Since model (2) has the highest prediction accuracy for the different tree species, it is selected as the final stem curve equation of three invaluable tree species. It can be seen from Figure 2 that the scattered distributions of the three invaluable tree species are comparatively scattered for model (1) and model (3), especially model (1) has a certain degree of heteroscedasticity.

3.2. Parameter Estimation

All of the experimental data for Erythrophleum fordii, Castanopsis hystrix and Tectona grandis is substituted into models (1)–(3). Fitted by ForStat statistical software, the estimated values of the model parameters are obtained. And the fit statistics are shown in Table 3.
As can be seen from Table 3, for Erythrophleum fordii, R 2 of model (2) is 2.55% and 1.43% higher than that of model (1) and model (3), respectively, and RSS decreased by 39.22% and 13.53%, respectively. For Castanopsis hystrix, R 2 of model (2) is 1.77% and 1.98% higher than that of model (1) and model (3), respectively, and RSS decreased by 39.3% and 8.81%, respectively. For Tectona grandis, R 2 of model (2) is 2.88% and 1.11% higher than that of model (1) and model (3), respectively, and RSS decreased by 37.23% and 7.74%, respectively. Obviously, the fitting measures of model (2) are significantly better than those of the other models. Using Erythrophleum fordii as an example, the parameters are substituted into the segmented taper model and the Formula (9) for the stem is obtained as:
( d / D ) 2 = 2.006 ( h / H 1 ) + 1.021 ( h 2 / H 2 1 ) + 262.0113 ( 0.038 h / H ) 2 I 1 0.712 ( 0.443 h / H ) 2 I 2
If h / H 0.038 , I 1 = 1 , otherwise I 1 = 0 ; When h / H 0.433 , I 2 = 1 , otherwise I 2 = 0 .

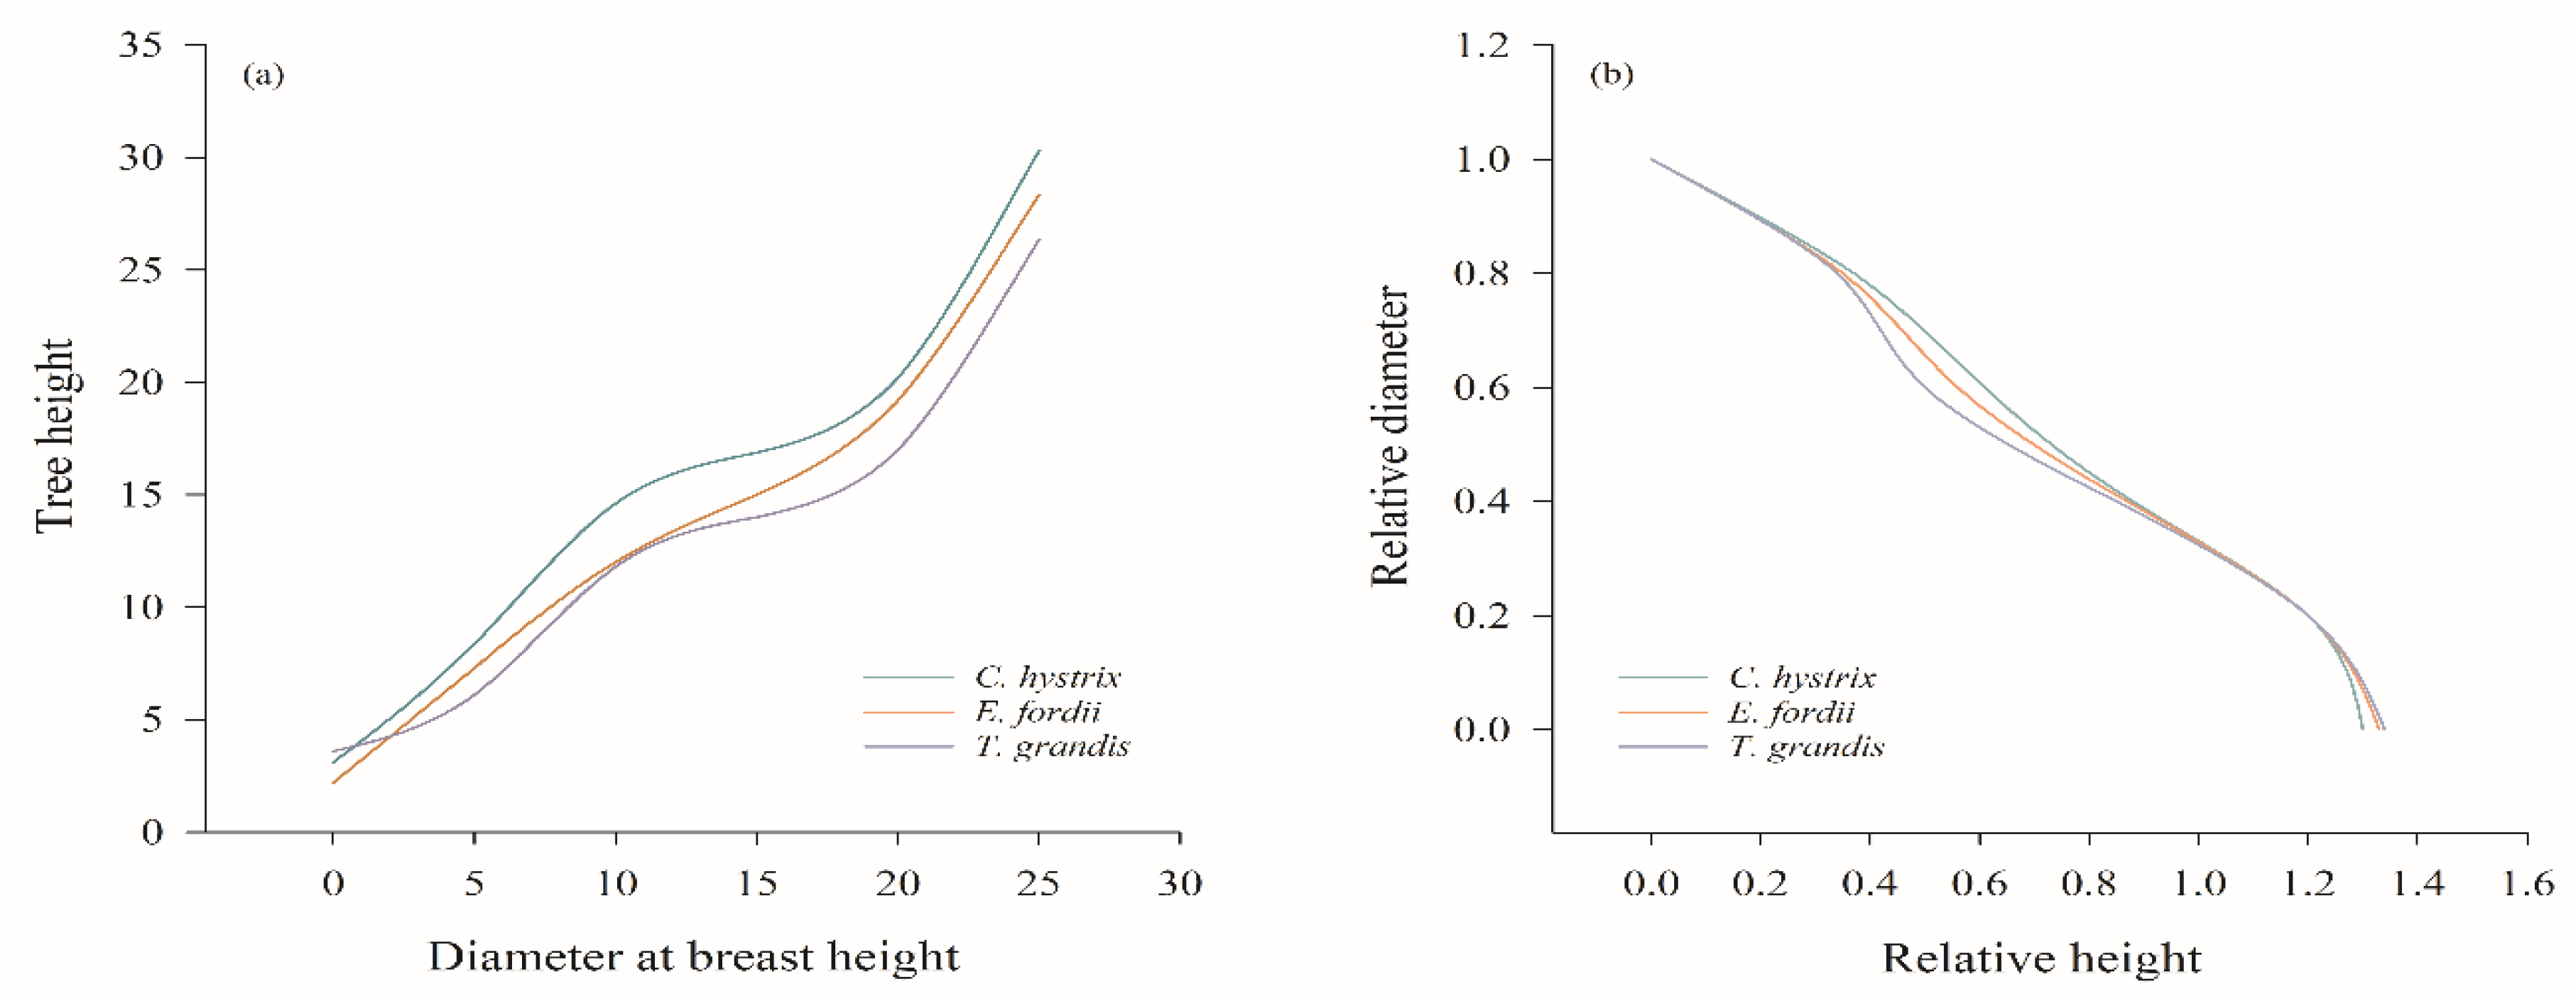
3.3. Stem Analysis of Three Invaluable Tree Species

The relative tree height h / H is divided into 1000 points in the range of 0 to 1 with step size 0.001. According to model (2), using the parameter estimation values corresponding to each tree species in Table 2, the diameters corresponding to the tree heights of the three tree species are calculated in Figure 3a, and the relationship of the tree height and diameter is plotted. It can be seen from Figure 3b that among the three tree species, the DBH is the same, and when the relative tree height ( h / H ) is between 0.00 and 0.07, the stem of the Tectona grandis is the thickest, and the stems of the Castanopsis hystrix and Erythrophleum fordii are almost the same. The relative diameter ( d / D ) of the Castanopsis hystrix is the largest when the relative tree height ( h / H ) is between 0.07 and 0.70, followed by the Erythrophleum fordii, and the smallest is the Tectona grandis, that is, the stem of Castanopsis hystrix is the thickest. When the relative tree height ( h / H ) is in the range of 0.7 to 0.8, the relative diameters ( d / D ) of the Erythrophleum fordii, Castanopsis hystrix and Tectona grandis are almost the same. When the relative tree height ( h / H ) is above 0.8, the Castanopsis hystrix has the smallest diameter ( d / D ), while the relative diameters of the Erythrophleum fordii and Tectona grandis are similar. When h / H is in the range 0.07–0.70, the stem of the Tectona grandis is the finest, followed by the Erythrophleum fordii, and the stem of the Castanopsis hystrix is the thickest while for the range 0.7 to 0.8, the stem thicknesses of the three tree species are almost the same. When h / H is above 0.8, the stem of the Castanopsis hystrix is the thinnest, and the stems of the Erythrophleum fordii and Tectona grandis are almost the same. As the diameter of the stem becomes thinner with the height of the stem, the relative height h / H of the tree is 0.0–0.8. The change of the stem of the Tectona grandis is the largest, and the change of the stem of the Castanopsis hystrix is the smallest, and the change of the stem of the Erythrophleum fordii is between the two. That is, when h / H is in the range 0–0.8, the taper of the Tectona grandis is the largest, followed by Erythrophleum fordii, and the taper of the Castanopsis hystrix is the smallest. When h / H is above 0.8, the change of the stem for the Castanopsis hystrix is the largest, and the change of the stem for the Erythrophleum fordii and Tectona grandis is almost the same. That is, when h / H is above 0.8, the taper of the Castanopsis hystrix is the largest, and the tapers of the Erythrophleum fordii and Tectona grandis are almost the same. However, in general, the stem curves predicted by the model (2) are better for the three tree species. The equations estimate merchantable volume from diameter at breast height and stand predominant height, after the comparing of different taper models, the optimum variable taper model was selected to construct a Two-way variable merchantable volume table. The system can estimate the length of trunk with any diameter, the diameter at any height, the volume of commercial timber and the yield of different timber species on the trunk of Erythrophleum fordii (Table 4). In addition to providing as good or better total volume estimates, the proposed models can also be utilized to predict product volumes to any desired top diameter limit and product volume estimation for the same tree, a feature not supported in the existing total stem volume tables.

4. Discussion

The stem varies with different tree species and different management measures, such as conifers and broad-leaved trees, as well as dense and sparse plantations having significantly different taper of the stem [28]. Therefore, it is necessary to establish corresponding taper equations for different tree species. Previous related research only dealt with improving the accuracy of the taper equations [29]. However, these studies have the simple analysis of the shape parameters, do not give specific definitions and cannot be used as a means of comparing the stems [30]. But the trunk profile of different tree species and different stands has great changes. Any model of trunk curve cannot fully describe the changes of trunk shape of all tree species, at the same time, it will not fully adapt to all stands of a certain tree species. Brooks et al. (2008) [31] used the segmented taper equation to establish a consistent volume equation for three tree species that the model is suitable for describing the trunk shape of three tree species. Overall, model (2) is slightly better than model (1) and model (3). The scatter trend is more regular and there is no heteroscedasticity, which further validates the use of model (2) to estimate the stem of the three invaluable tree species. The procedure used to assess the parameters of the model could be improved; because our objective was to build a soundly based model rather than to make precise and accurate predictions, we focused on the qualitative behavior of the model rather than on its statistical properties.
A total of 120 species of tropical invaluable tree species 40 of Erythrophleum fordii, Castanopsis hystrix and Tectona grandis respectively) are studied. The corresponding taper equations are constructed by a simple taper equation, segmented taper equation and variable exponent taper equation. By using the index of correlation, the residual sum of squares, the mean prediction error, the variance of prediction errors and the root mean square error, the model (2) has been found to have the best fitting effect. According to the fitting results for the model (2) parameters, the equation was further evaluated by relative height ( h / H ) classes in order to evaluate its performance at different positions throughout the merchantable stem. That is, when the relative tree height is (0–0.8), the stem of the Tectona grandis changes the most, and the stem of the Castanopsis hystrix changes the smallest, and the change of the stem of the Erythrophleum fordii is between the two. This indicates that under appropriate management practices and with good genetic materials, Tectona grandis can assume a more cylindrical shape. When the relative tree height is above 0.8, the stem of the Castanopsis hystrix has the largest change, and the change of Erythrophleum fordii and Tectona grandis is almost the same, it can be applied and popularized in forestry production to draw up the table of binary timber yield of three species.
In the paper, the constructed model has shed light on how to construct a stem curve model of invaluable tree species using existing methods. The simple stem curve model uses a simple function to describe the change of stem shape, but it is obvious that different parts of a certain section of the trunk can be regarded as a different geometry approximately, and a simple regression equation is not enough to describe the shape of the trunk. Later, many scholars established a large number of complex models to describe the trunk curve and solve the problem of different segment shapes of the trunk [32]. Hence, the change trend of the stem curve for the tropical invaluable tree species is quantitatively analyzed [33]. Building such a tree-and-stand model would require an analysis of the qualitative behavior of the model at the tree and stand levels, and a quantitative comparison of simulated growth to the observed data at both levels, which provides the technical support for accurately estimating the stumpage of invaluable tree species, the quantity of each species and reasonable bucking. We believe that developing timber measurement minimum standards, acceptable across borders, can contribute to removing gray zones created by a lack of comparable estimates for the regions of interest. For the species with timber as the cultivation target, the timber output of different specifications is an important basis to identify the economic value of forest resources, so as to better meet the market demand, it is necessary to compile the table of stand species yield. Based on theoretical merchantable volume for stand, two-way equations of merchantable volume for stand were built and a superior equation was selected. Using such models can help to reduce weaknesses in traditional methods of wood scaling, and can provide the index basis about forest resource’ s quantity and quality for the purpose of scientific forest management reasonably exploitation and utilization and realizing of limited cutting plan.
Stem profile models can provide a systematic way for linking the raw commodity (wood) to wood products and thus should be useful for understanding differences in wood pricing systems and assessing potential growing timber stock value differences among markets [34]. When estimating tree volume, the improved base model was most promising. The merchant volume table of two-way log type, the merchant volume table of one-way log type, the merchant volume table of ground diameter and the merchant volume table of stand log type were been developed, which provide the method for complete series of tables. Furthermore, once a common stem profile model is accepted for modeling raw volume, changes in utilization standards can be rapidly accommodated. Traditionally, it is not easy to measure upper stem diameters, similar accuracy can be obtained reducing the cost involved by stem diameter measurements on standing trees. For a given tree species, when discussing the growth of a stand, the diameter, height, height under branches, crown width, distribution and accumulation of trees are always taken as the research object. When discussing the growth effect of stand management variables such as site, density and thinning, these indicators are also taken as the basis, while the dry form indicators are seldom considered. Hence, a critical step in developing compatible estimates within a region of interest is developing a regionally valid stem profile model on which scaling conversions can be based [35]. Losses in recoverable timber products caused by the presence of cull or stem deformities could be accounted for during forest inventory procedures to improve local timber product estimates and to enable cross-border comparisons of productivity potential of forest sites within the region of interest. Previous research only focused on improving the precision of the stem profile equation. Different tree species and different management measures have different trunk shapes, for example, conifer and broad-leaved trees, dense and sparse plantation have significantly different trunk sharpness. Therefore, it is necessary to establish corresponding stem profile equation for different tree species.

5. Conclusions

Different silvicultural treatments, like spacing, thinning and fertilizer application may require site-specific taper equations developed a model, but further study is needed for the living trees of invaluable tree species and the specific realization of the value estimation, and on how to combine the modern statistical methods (the nonlinear mixed-effects model method) to analyze the stems of different tree types of the same tree species. In this study, a single set of parameters could be used to explicitly predict the stem profile of three tree species that could easily be interpreted. The parameters generated thereof reflect a regional stem analysis database management system and provide valid stem profile models for major commercial invaluable tree species for the tropical region. Different inflexion points of variable parameters in the taper equation are actually defined, which provides a method for tree stem shape change so that the actual variable parameter values can be used to compare the trunk shape. Model (2) showed consistent performance in terms of overall fit statistics and sectional performance, in estimating diameter and volume, respectively, it can therefore be considered to be suitable for estimating stem diameters and tree volume of three precious tree species for Southern China. The model can be used to accurately assess the effect of intensive silvicultural treatments, such as spacing, site preparation and provenance trials, on stem form and growth, which will therefore serve as important decision-making tool for sustainable forest management of plantations, and can be utilized to estimate multi-product volumes for “Store timber in forest”.

Author Contributions

Conceptualization, J.J.; data curation, A.M. and L.P.; formal analysis, J.L.; funding acquisition, J.J.; investigation, J.J. and A.M.; methodology, J.J. and L.P.; writing—original draft, J.J.; writing—review and editing: J.J. and L.P. All authors have read and agreed to the published version of the manuscript.

Funding

This work was funded by the National Natural Science Foundation of China (Grant No. 31901306).

Acknowledgments

We would like to thank all people contributing to forest plot survey for this study and two anonymous reviewers for helpful comments on earlier versions of this manuscript.

Conflicts of Interest

The authors declared no potential conflict of interest with respect to the research, authorship, and/or publication of this article.

References

  1. Bai, J.P. Investigation Report of rare species in Guangdong, Fujian. Shanxi For. Sci. Technol. 2009, 38, 51–52. [Google Scholar]
  2. Chen, X.T. Study on Development Prospects of rare species Plantation in Guangxi. For. Sci. Technol. 2012, 37, 53–55. [Google Scholar]
  3. Shook, S.R.; Zhang, Y.; Wagner, F.G. Wood products cooperatives: Overview and exploratory analysis. For. Prod. J. 2001, 51, 25–33. [Google Scholar]
  4. Bowers, S. Increased value through optimal bucking. West. J. Appl. For. 1998, 13, 85–89. [Google Scholar] [CrossRef] [Green Version]
  5. Li, R.; Weiskittel, A.R. Comparison of model forms for estimating stem taper and volume in the primary conifer species of the North American Acadian Region. Ann. For. Sci. 2010, 67, 1–16. [Google Scholar] [CrossRef] [Green Version]
  6. Scolforo, H.F.; McTague, J.P.; Burkhart, H.; Roise, J.; Carneiro, R.L.; Stape, J.L. Generalized stem taper and tree volume equations applied to eucalyptus of varying genetics in Brazil. Can. J. For. Res. 2019, 49, 447–462. [Google Scholar] [CrossRef]
  7. Kozak, A.; Munro, D.O.; Smith, J.H.G. Taper functions and their application in forest inventory. For. Chron. 1969, 45, 278–283. [Google Scholar] [CrossRef]
  8. Özçelik, R.; Brooks, J.R.; Jiang, L. Modeling stem profile of Lebanon cedar, Brutian pine, and Cilicica fir in Southern Turkey using nonlinear mixed-effects models. Eur. J. For. Res. 2011, 130, 613–621. [Google Scholar] [CrossRef]
  9. Poudel, K.P.; Temesgen, H.; Gray, A.N. Estimating upper stem diameters and volume of Douglas-fir and Western hemlock trees in the Pacific northwest. For. Ecosyst. 2018, 5, 3–14. [Google Scholar] [CrossRef] [Green Version]
  10. Amidon, E.L. A general taper functional form to predict bole volume for five mixed-conifer species in Califonia. For. Sci. 1984, 30, 166–171. [Google Scholar]
  11. Max, T.A.; Burkhart, H.E. Segmented polynomial regression applied to taper equations. For. Sci. 1976, 22, 283–289. [Google Scholar]
  12. Cao, Q.V.; Burkhart, H.E.; Max, T.A. Evaluations of two methods for cubic volume prediction of loblolly pine to any merchantable limit. For. Sci. 1980, 26, 71–80. [Google Scholar]
  13. Brooks, J.R.; Jiang, L.; Ozçelik, R. Compatible stem volume and taper equations for Brutian pine, Cedar of Lebanon, and Cilicica fir in Turkey. For. Ecol. Manag. 2008, 256, 147–151. [Google Scholar] [CrossRef]
  14. Jiang, L.C.; Liu, R.L. A Stem Taper Model with Nonlinear Mixed Effects for Dahurian larch. Sci. Silvae Sin. 2011, 47, 101–106. [Google Scholar]
  15. Jiang, L.; Liu, R. Segmented taper equations with crown ratio and stand density for Dahurian Larch (Larix gmelinii) in Northeastern China. J. For. Res. 2011, 22, 347–352. [Google Scholar] [CrossRef]
  16. Vasilescu, M.M.; Teresneu, C.C.; Dinulica, F. A rapid method for estimating the median diameter of the stem profile of Norway spruce (Picea abies Karst) trees. iFor. Biogeosci. For. 2017, 10, e1–e6. [Google Scholar] [CrossRef] [Green Version]
  17. Yan, R.H.; Wu, F.Z. Research on commodity volume estimation system variant. J. Nanjing For. Univ. 1992, 16, 31–37. [Google Scholar]
  18. Muhairwe, C.K. Tree form and taper variation over time for interior lodgepole pine. Can. J. For. Res. 1994, 24, 1904–1913. [Google Scholar] [CrossRef]
  19. Kozak, A. A variable-exponent taper equation. Can. J. For. Res. 1988, 18, 1363–1368. [Google Scholar] [CrossRef]
  20. Valentine, H.T.; Gregoire, T.G. A switching model of bole taper. Can. J. For. Res. 2001, 31, 1400–1409. [Google Scholar] [CrossRef]
  21. Wang, M.L. Theoretical bucking: Taper equations and merchantable volume tables. For. Res. 1998, 11, 271–276. [Google Scholar]
  22. Hu, C.X.; Yang, S.L.; Jia, W.W. Stem profile model and variable-exponent of Larix gmelinii plantation. Chin. J. Appl. Ecol. 2011, 22, 1695–1701. [Google Scholar]
  23. Lee, W.-K.; Seo, J.-H.; Son, Y.-M.; Lee, K.-H.; von Gadow, K. Modeling stem profiles for Pinus densiflora in Korea. For. Ecol. Manag. 2003, 172, 69–77. [Google Scholar] [CrossRef]
  24. Jiang, J.; Lu, Y.C.; Wang, L.; Cai, D.; Jia, H.; Ming, A.; Chen, B. Facilitation by Tree Species in Variable Retention Harvesting for the Restoration of Monoculture Plantations in Southern China. Trop. Conserv. Sci. 2019, 12, 1–12. [Google Scholar] [CrossRef]
  25. Pang, L.F. Stand Harvest Analysis and Information Management System for Target Tree; Chinese Academy of Forestry: Beijing, China, 2015. [Google Scholar]
  26. Tang, S.Z.; Lang, K.J.; Li, H.K. Statistics and Computation of Biomathematical Models (Forstat Course); Science Press: Beijing, China, 2009; pp. 56–79. [Google Scholar]
  27. Tasissa, G.; Burkhart, H.E.; Amateis, R.L. Volume and taper equations for thinned and unthinned loblolly pine trees in cotover, site-prepared plantations. South. J. Appl. For. 1997, 21, 146–152. [Google Scholar]
  28. Shahzad, M.K.; Hussain, A.; Jiang, L. A model form for stem taper and volume estimates of white birch (Betula platyphylla Sukaczev): A major commercial tree species of Northeast China. Can. J. For. Res. 2020, 50, 274–286. [Google Scholar]
  29. Arias-Rodil, M.; Diéguez-Aranda, U.; Puerta, F.R.; López-Sánchez, C.A.; Líbano, E.C.; Obregón, A.C.; Castedo-Dorado, F. Modelling and localizing a stem taper function for Pinus radiata in Spain. Can. J. For. Res. 2015, 45, 647–658. [Google Scholar] [CrossRef]
  30. Klos, R.J.; Wang, G.G.; Dang, Q.L.; East, E.W. Taper equations for five major commercial tree species in Manitoba, Canada. West. J. Appl. For. 2007, 22, 163–170. [Google Scholar] [CrossRef]
  31. Garber, S.M.; Maguire, D.A. Modeling stem taper of three central Oregon species using nonlinear mixed effects models and autoregressive error structures. For. Ecol. Manag. 2003, 179, 507–522. [Google Scholar] [CrossRef]
  32. Sharma, M.; Oderwald, R.G. Dimensionally compatible volume and taper equations. Can. J. For. Res. 2001, 31, 797–803. [Google Scholar] [CrossRef]
  33. Hussein, K.A.; Schmidt, M.; Kotz, H. Parameter parsimo nious taper functions for describing stem profiles. Sci. Silvae Sin. 2008, 44, 20–27. (In Chinese) [Google Scholar]
  34. Zhang, J.L.; Zhang, E.S.; Zhang, S.C.; Cui, L.-Z.; Yu, B.; Chen, D.-L. A study on the changing values of form index and geometrical solids of tree stem. J. Agric. Univ. Hebei 2007, 30, 66–70. (In Chinese) [Google Scholar]
  35. Bouriaud, O.; Stefan, G.; Saint-André, L. Comparing local calibration using random effects estimation and Bayesian calibrations: A case study with a mixed effect stem profile model. Ann. For. Sci. 2019, 76, 65. [Google Scholar] [CrossRef]
Figure 1. The scatter distribution of Erythrophleum fordii, Castanopsis hystrix and Tectona grandis.
Forests 11 00669 g001
Figure 2. Residual distribution of estimated stem diameter for the three models of E. fordii, C. hystrix and T. grandis.
Forests 11 00669 g002
Figure 3. The relationship with Diameter at breast height and height (a), and relative and relative diameter (b) of Erythrophleum fordii, Castanopsis hystrix and Tectona grandis, respectively.
Forests 11 00669 g003
Table 1. Statistics of diameter at breast height (DBH) and height in the sampled plots data.
Tree Species DBH/cmHeight/m
NumberMean ± Standard Deviation
(SD)
Max.Min.Variation Coefficient
(CV)
Mean ± SDMax.Min.CV
E. fordii4023.1 ± 3.530.19.20.2117.7 ± 2.123.110.30.25
C. hystrix4022.2 ± 5.4036.27.70.4322.1 ± 4.129.411.20.18
T. grandis4024.3 ± 4.137.511.10.1123.1 ± 2.626.59.400.27
Table 2. Evaluation indexes for models (1)–(3) using the 10-fold cross-validation of Erythrophleum fordii, Castanopsis hystrix and Tectona grandis.
ModelE. fordiiC. hystrixT. grandis
e ¯ σ 2   δ e ¯ σ 2 δ e ¯ σ 2 δ
(1)−0.4124.1512.287−0.2412.2231.733−0.3986.47731.512
(2)−0.1792.3181.378−0.1992.1981.619−0.2314.6200.134
(3)0.0542.5121.4560.0872.5391.1060.1104.2231.133
e ¯ = the mean prediction error; σ 2 = the variance of prediction errors; δ = the root mean square error.
Table 3. Parameter estimates and fit statistics for taper model of E. fordii, C. hystrix and T. grandis.
Tree SpeciesModelParameterFitting Statistics
b 1 b 2 b 3 b 4 b 5 ( a 1 ) a 2 R 2 RSS
E. fordii(1)1.237−2.30981.0688 0.9226.990
(2)−2.0061.021262.0113−0.7120.03800.4430.91235.11
(3)1.241−0.3349.0421−9.6184.5960 0.93214.360
C. hystrix(1)1.236−1.5550.5712 0.9625.515
(2)−2.4581.7043177.917−2.2550.03740.1190.9612.14
(3)1.108−0.1525.347−6.45461.2101 0.9202.11
T. grandis(1)1.1124−2.1231.578 0.93065.340
(2)−1.3671.086149.6113−0.76890.130.4780.8772.98
(3)2.879−0.1169.245−9.234.55 0.933.13
b 1 , b 2 ,   b 3 , b 4 ,   b 5 are the parameters of the equation, a 1 and a 2 are the relative heights of the lower and upper stem in the inflexion points, respectively. R2 = index of correlation, and RSS = the residual sum of squares.
Table 4. The two-way merchantable volume table of Erythrophleum fordii by model (2).
Diameter Class (cm)Height (m)Percentage of Outturn (%)
Large Diameter Timber Medium Size TimberSmall-Sized TimberTotal
870071.7771.77
10150079.1379.13
12170086.6286.62
14160088.1188.11
16190088.3288.32
18190089.1589.15
2021031.4260.2491.66
2222036.9354.1991.12
2422054.2337.5591.78
262234.0736.9421.9192.92
282040.4330.2121.4392.07
302250.1722.4718.3290.96

