Article

Identification of Spruce Budworm Natural Enemies Using a qPCR-Based Molecular Sorting Approach

1
Laurentian Forestry Centre, Natural Resources Canada, Quebec City, QC G1V4C7 Canada
2
Great Lakes Forestry Centre, Natural Resources Canada, Sault Ste. Marie, ON P6A2E5, Canada
3
Department of Integrative Biology, University of Guelph, Guelph, ON N1G2W1, Canada
4
Atlantic Forestry Centre, Natural Resources Canada, Fredericton, NB E3B5P7, Canada
5
Institut de Biologie Intégrative et des Systèmes, Université Laval, Quebec City, QC G1V0A6, Canada
*
Author to whom correspondence should be addressed.
These authors contributed equally to the work.
Current address: Centre for Ecological and Evolutionary Synthesis, Department of Biosciences, University of Oslo, 0316 Oslo, Norway
Forests 2020, 11(6), 621; https://doi.org/10.3390/f11060621
Submission received: 29 April 2020 / Revised: 22 May 2020 / Accepted: 26 May 2020 / Published: 1 June 2020
(This article belongs to the Special Issue Biological and Bio-Based Management of Forest Pests and Pathogens)

Abstract

:
Annual monitoring of mortality agents in the course of a spruce budworm (Choristoneura fumiferana (Clemens) (Lepidoptera: Tortricidae)) population cycle is essential to understanding the factors governing the rise and collapse of outbreaks. To date, assessments of causes of budworm mortality have relied on laboratory rearing of field-collected larvae, followed by visual identification of emerging parasitoids and/or microscopic analysis of pathogens in larval carcasses. Although this approach has provided vital information on the abundance and identity of mortality agents, the procedure is labor-intensive and has limits in terms of accuracy. To overcome these shortcomings, we developed a molecular identification tool that makes use of real-time quantitative PCR (qPCR) and TaqMan® technologies. The tool relies on taxon-specific molecular variants (single nucleotide polymorphism [SNP] markers) found in mitochondrial (COI) and nuclear (28S rDNA) genes, for parasitoids, and in the nuclear SSU rDNA gene for microsporidian pathogens; these are then used as molecular signatures targeted by qPCR primers and TaqMan probes. Thus, the design of several sets of primers and probes deployed in multiplex format enables the identification of natural enemies via a molecular sorting process, bypassing barcode sequencing. Crude budworm DNA extracts are processed through a first module that detects dipteran and hymenopteran parasitoids, and microsporidian infections. Positive samples are then processed for species determination using three additional modules, enabling the identification of 20 common natural enemies of the spruce budworm. The tool has been fully validated using DNA samples from all comprised taxa, and both its sensitivity and accuracy compared favorably with the rearing-based method in an analysis of field-collected budworms. Using this tool, sample processing can be completed within two days, does not require larval rearing, provides accurate species identification, and can be conducted by technical staff without extensive molecular biology or insect taxonomy training.

Graphical Abstract

1. Introduction

Effective management of eruptive forest defoliators rests on a thorough characterization of the factors responsible for the rise and decline of population outbreaks. This type of knowledge is particularly relevant to the fight against the spruce budworm (SBW), Choristoneura fumiferana, Canada’s most iconic and devastating lepidopteran defoliator. Although this pest ranges from coast to coast across the North American boreal forest, its epidemics have historically been most severe in the provinces of Quebec, New Brunswick, and Ontario (i.e., its eastern range), with a recurrence of outbreaks every ~35–45 years. Budworm population suppression efforts have traditionally involved insecticide treatments in high-value stands to diminish pest densities before defoliation reaches tree-killing levels (i.e., a “foliage protection strategy”; [1]). However, in the past decade the province of New Brunswick has been developing an alternative management approach referred to as “early intervention strategy” (EIS). In EIS, rising budworm populations are suppressed early and over relatively large contiguous areas with the aim of slowing or containing outbreak rise and spread [1,2]. The success of EIS depends at least partially on whether suppressed areas are reinvaded by immigrant moths and whether control tactics can be deployed in ways that avoid impacting the natural enemies that keep populations low [1].
There has long been interest in understanding the role natural enemies play in regulating spruce budworm population cycles. In particular, hymenopteran and dipteran parasitoids, along with microsporidian pathogens, are considered the main density-dependent mortality factors shaping oscillations [3,4], although exhaustion of host plant resources may also contribute [5]. Spruce budworm parasitoids and pathogens are components of a complex food web displaying architectural flexibility over large fluctuations in the abundance of their spruce budworm host [6]. Indeed, important changes are observed in the composition of the budworm parasitoid communities over the full epidemic/endemic cycle, with maximum species richness occurring at peak outbreak [4,6]. While early studies focused on the characterization of natural enemy communities during the outbreak, its collapse, and the ensuing endemic period [3,4,5,7], similar assessments targeting the transition from the endemic phase to an incipient outbreak have only recently been undertaken [2].
Over a hundred species of parasitoids have been listed as natural enemies of the spruce budworm [8]. In an investigation of the C. fumiferana-parasitoid food web in New Brunswick, 66 primary parasitoids (sensu [9]) and 21 primary pathogens were inventoried [6]. Nevertheless, monitoring and identifying these natural enemies have proven to be a labor-intensive, time-consuming task. Briefly, spruce budworm larvae are manually transferred from field-collected fir and spruce branches to artificial diet for rearing. Larvae are then monitored until moth eclosion or death (i.e., following parasitoid emergence or other causes). When present, parasitoids are identified based on morphological features, whereas dead larvae are processed for microscopic diagnosis of potential pathogens [4,5,7,10,11].
In an effort to simplify the above diagnostic procedure and to make it both more rapid and more accurate, we recently set out to design a DNA barcode-based molecular tool for the identification of spruce budworm natural enemies. Species identification of parasitoids and microsporidia through PCR amplification and sequencing of DNA barcodes has been used before (e.g., [12,13,14,15,16]). However, we sought to develop a user-friendly procedure that would bypass the barcode sequencing step, so that the advantages of using DNA as an identification tool could easily be transferred to personnel without molecular biology skills. To this end, we developed a suite of quantitative real-time PCR (qPCR) TaqMan® assays analogous to those we designed earlier for the identification of gypsy moths and their lymantriine relatives [17,18]. These assays take advantage of the existence of inter-taxonomic variation at specific nucleotide positions within DNA barcodes (here, 28S rDNA and COI for parasitoids and SSU rDNA for microsporidia). Such “molecular signatures” are exploited in the development of qPCR primers and TaqMan probes designed to detect DNA from a single taxon at a time. Thus, the use of several taxon-specific sets of primers and probes deployed in multiplex format, and in several tubes in parallel, enables the identification of natural enemies via a molecular sorting process.
To develop the assay presented here, we took advantage of barcode sequences generated in the context of earlier studies [13,14,15,16] and/or deposited in public databases such as the Barcode of Life Data System (BOLD; [19]) and GenBank. In addition, we generated relevant barcode sequences for those cases where such sequences were either unavailable or showed low specimen representation in public databases. The tool we developed has four modules, where the first one is aimed at detection: it establishes if a given budworm specimen is parasitized and, if so, whether the parasitoid is a Diptera or a Hymenoptera, and whether it is infected by microsporidia. The other modules enable species identification within each of these three taxonomic groups, with a focus on the most common spruce budworm natural enemies recorded in eastern Canada. The assay, which includes a simplified DNA extraction procedure, can be performed in two days and provides greater species identification accuracy than the traditional method.

2. Materials and Methods

2.1. Development of a Barcode Sequence Database for Spruce Budworm Parasitoids

The design of a molecular sorting tool (MST) such as the one presented here first required that we establish a list of priority species, as inclusion of all known (or a large number of) parasitoids would have rendered the proposed sorting strategy unmanageable. To this end, we examined the existing literature [4,6,8,20] and consulted with experts and field and laboratory personnel who have been involved in monitoring spruce budworm parasitoids in Quebec and New Brunswick over the past decades. At the end of this process, we generated the list presented in Table 1, in which parasitoid species are attributed to one of three categories: frequent, occasional, and less common. Although only species listed as “frequent” were targeted for identification by the molecular sorting tool, several additional species shown in Table 1 were considered in developing the 28S rDNA sequence database, as this marker was used for detection of parasitoids in Module 1, including discrimination between hymenopteran and dipteran parasitoids.
In developing the dipteran and hymenopteran species identification modules, we employed both COI and 28S rDNA markers, choosing either one or the other for a given species, depending on the presence of discriminating SNPs in the relevant sequences. Table 1 provides the numbers and sources of sequences populating our barcode database, including the ones that were generated through the present work. Actual marker sequences and GenBank accession numbers are provided in File S1.
In cases where the quality of GenBank-derived 28S rDNA and COI barcode sequences was inadequate for the purpose of developing PCR primers and TaqMan probes, or where there were either no or a few sequences available for a given species, we extracted DNA from either fresh or archival parasitoid specimens whose identification had been confirmed by taxonomists. To this end, we used the Qiagen DNeasy Blood and Tissue kit (Qiagen, Germantown, MD, USA) as described [17]. Primers used to amplify and sequence barcode DNA were designed using Oligo Explorer v1.2 and Oligo Analyzer v1.2 (Gene Link, New York, NY, USA), based on publicly available sequences; primer sequences are provided in File S2. PCR amplifications were conducted as described earlier [17], and PCR products were submitted for direct Sanger sequencing at the Plateforme de séquençage et de génotypage des génomes, CHU de Québec, Université Laval (Quebec City, Canada).

2.2. Development of a Barcode Sequence Database for Spruce Budworm Microsporidia

To date, two species of microsporidia have been reported as infecting the spruce budworm: Nosema fumiferanae [15,21,22,23,24] and a Cystosporogenes species [16]. Although the latter was originally described from insects reared in the laboratory, it has since been detected in field populations (Kyei-Poku, unpublished). A third species, Vairimorpha sp., has recently been detected in C. fumiferana larvae by one of us (G. Kyei-Poku), but has not yet been reported in the literature. For Nosema and Cystosporogenes, we used the small subunit rDNA (SSU rDNA) barcodes reported earlier [15,16], while the SSU rDNA barcode for Vairimorpha sp. was PCR-amplified and sequenced using the same approach described for the other two species. The SSU rDNA sequences used in the present study, along with their GenBank accession numbers, are provided in File S1.

2.3. Development of the Molecular Sorting Tool

See Results section for a description of the tool’s conceptual design. All molecular detection assays developed here are based on TaqMan® technology [25]. Primer and probe design was performed using Oligo Explorer v1.2 and Oligo Analyzer v1.2 (Gene Link, New York, NY, USA). Primers and probes (File S2) were designed to (i) minimize the development of secondary structures and dimer formation at the 3′ end of primers (minimal interaction between primers and probes) and (ii) to ensure the amplicon length does not exceed 200 bp (for optimal amplification efficiency). Interspecific SNPs were preferentially localized at the extreme 3′ end of primers and the middle of probes for maximum discriminatory effect. All primers and TaqMan probes were synthesized by Integrated DNA Technologies Inc. (IDT, Coralville, IA, USA). All assays were designed to work under the same thermocycling conditions.
For initial simplex testing, all probes were labelled with fluorescein (6-FAM) at the 5′ end and the quencher Iowa Black FQ (IBFQ) at the 3′ end. For subsequent 3-plex and 4-plex assay validation, we used probes labelled with the fluorophore HEX at the 5′ end and the quencher Iowa Black FQ (IBFQ) at the 3′ end, Cy5 at the 5′ end and the quencher Iowa Black RQ (IBRQ) at the 3′ end, and the fluorophore Texas Red at the 5′ end and the quencher Iowa Black RQ (IBRQ) at the 3′ end. Additionally, for non-LNA probes (see [17] for a description of LNA probes), a ZEN™ (for 6-FAM and HEX probes) or TAO™ (for Cy5 probes) internal quencher was placed between the 9th and 10th base from the reporter dye on the 5′ end of the probe sequence. These internal quenchers shorten the distance between dye and quencher, and in combination with the terminal 3′ quencher, provide a higher degree of quenching and lower initial background fluorescence. Triplex and 4-plex assays were analyzed for interactions between all primers and probes using Oligo Analyzer v1.2, and subsequently tested against the same panel of species used for the simplex assays. Care was taken to ensure that there was no or minimum overlap of amplicon regions in these assays.
Real-time PCR was performed on an Applied Biosystems 7500 Fast Real-Time PCR System (Thermofisher, Waltham, MA, USA). Amplifications were conducted using 1x QuantiTect Multiplex PCR NoROX Master Mix, with 0.5 μM of each primer, 0.1 μM of TaqMan probe, and ~2000 gene copies of template DNA in a final reaction volume of 10 μL. Two technical replicates were run for all reactions. Thermocycling conditions were set at 95 °C for 15 min, followed by 45 cycles at 95 °C for 15 s and 60 °C for 90 s. Fluorescence was read at each cycle, at the end of the extension step. The fluorescence threshold (Ft) was set at 10% of Fmax for the analysis of these results to avoid false Ct values for any sample that may have a baseline drift.

2.4. SYBR Green-Based Real-Time PCR Quantification of DNA

For assay development, purified parasitoid DNA was quantified using “parasitoid 28S general primers” (File S2). DNA was diluted to 100 copies for assay detection testing and 2000 copies for assay discrimination validation. In cases where purified DNA was unavailable, we used either positive lysates from field-collected budworm larvae or gBlocks gene fragments (IDT, Coralville, IA, USA) designed using available GenBank sequences. For microsporidia samples, ~1250 bp PCR-cloned SSU rDNA fragments were quantified using the “microsporidia SSU rDNA primers” (File S2), which were designed for the Module 1 microsporidia TaqMan assay.
DNA was quantified using the same thermocycling equipment described above. All reactions were performed in a final volume of 10 μL and contained 1x QuantiTect SYBR Green PCR Master Mix (Qiagen, Germantown, MD, USA), 0.5 μM of each of the parasitoid 28S general or microsporidia SSU rDNA primers, and 2 μL of template DNA. Real-time PCR thermocycling conditions were set at 95 °C for 15 min, followed by 40 cycles at 95 °C for 15 s, 50 °C for 30 s, and 65 °C for 60 s. The fluorescent threshold value was set at 10% of Fmax to determine Ct values. A Ct value of 22 was estimated to represent approximately 2000 copies of 28S DNA (parasitoid samples) or SSU rDNA (microsporidia samples).

2.5. TaqMan Assay Validation Using Purified DNA Samples and gBlocks Gene Fragments

gBlocks gene fragments (IDT, Coralville, IA, USA) were synthesized in either the 28S or COI gene region to provide positive controls for all assays. The fragments were between 150 and 250 bp, depending on assay amplicon size (see File S3 for gBlocks sequences). All gBlocks gene fragments were diluted to 10 fg for use in assay validation testing and produced Ct values between 20 and 24 with the TaqMan assays.
For assay detection, all assays were tested in simplex format using probes labelled with the designated fluorophore (FAM, Cy5, HEX, or Texas Red). Hundred copies of the 28S rDNA or SSU rDNA genes were used for these tests. Next, the assays were tested in multiplex format and finally again in multiplex format, but with a spruce budworm DNA spike of approximately 50,000 copies (10 fg) to simulate field collected budworm larvae samples. The spruce budworm DNA used for the DNA spike was extracted using the crude extraction method described in this paper. Ct values were compared between simplex, 3-plex/4-plex and 3-plex/4-plex with spruce budworm DNA spike to ensure that assay performance was not affected by multiplex primer and probe interactions and/or the presence of spruce budworm DNA.
For assay discrimination, all assays were tested in 3-plex or 4-plex format with a spruce budworm DNA spike against a panel of hymenopteran, dipteran or microsporidian DNA samples at 2000 copies 28S or SSU rDNA to ensure that the assays amplified only the desired target. For Module 2 assay discrimination testing (dipteran species), the assays were tested against a panel of dipteran parasitoid species, for Module 3 assay discrimination testing, the assays were tested against a panel of hymenopteran parasitoid species and for Module 4 testing, the assays were tested against a panel of microsporidian species.
All TaqMan assay validation was performed using the conditions described earlier in the Development of the molecular sorting tool Section 2.3.

2.6. Testing of the Molecular Sorting Tool Using Field-Collected Budworm Larvae

Choristoneura fumiferana larvae were manually collected from balsam fir branches sampled in the Charlevoix region of Quebec (Lac Germain, 47°55′17.4″ N, 70°04′39.7″ W) in 2019, where population densities were near outbreak levels. On two separate dates, 2–3 days before peak densities of 4th and 6th instars, respectively, two 45 cm-long branches were sampled in the upper mid-crown of ~20 trees. These samples yielded separate groups of 3rd/4th instars and 6th instars. Approximately half of the larvae from each group were processed for parasitoid identification by personnel of the Quebec Ministry of forests, fauna and parks (QMFFP), using the rearing-based method described in the Introduction section, but without microsporidian diagnosis. The other half were stored at −20 °C for later molecular analysis.
In order to make our assay easy to use by technical staff without extensive molecular training, we took steps to simplify and shorten the DNA extraction procedure. After conducting various preliminary tests, we settled on the following method: 3rd/4th-instar C. fumiferana larvae were placed in individual wells of a 96-deepwell plate (rack with 1.2 mL tube strips; Macherey-Nagel, Düren, Germany), along with a 3 mm Tungsten Carbide bead (Qiagen, Germantown, MD, USA). After flash-freezing in liquid nitrogen, the samples were ground in a Mixer Mill MM 300 (Retsch, Haan, Germany) for 2 cycles of 1 min at 26 Hz. The homogenized samples were centrifuged at 2000 g for 5 min in a 5804 R centrifuge (Eppendorf, Hamburg, Germany). We then added 400 µL of lysis solution [390 µL ATL buffer (Qiagen, Germantown, MD, USA) supplemented with 10 µL of Proteinase K (20 µg/µL, Qiagen, Germantown, MD, USA)] and placed the plate in a ThermoMixer C apparatus (Eppendorf, Hamburg, Germany) for an 18 h incubation (overnight) at 56 °C, with continuous 600 rpm shaking. For DNA extraction from the larger 6th-instar larvae, volume of the lysis solution was increased to 600 µL [585 µL ATL buffer and 15 µL Proteinase K (20 µg/µL)]. Lysates were centrifuged at 2000 g for 5 min, and 300 µL of each supernatant, containing the raw soluble extract, was transferred to an individual well in a half-deepwell storage plate (Thermo Scientific; Thermofisher Scientific, Waltham, MA, USA), which was then sealed with a Silicone Microplate precut cover (VWR International, Radnor, PA, USA) and placed in the refrigerator for short-term storage or in a freezer at −20 °C for long-term storage. Prior to processing in Module 1, the supernatant was diluted 1000-fold in UltraPure™ distilled water (Invitrogen: Thermofisher Scientific, Waltham, MA, USA). An aliquot of each sample was further processed in one or more of the other three modules, as dictated by results of the Module 1 assay.

2.7. Assessing the Limit of Detection

As parasitoid-to-host DNA ratio is expected to increase as a function of time after parasitization, we also assessed how soon after parasitization our assay could detect parasitoid DNA. To address this issue, we chose the ichneumonid parasitoid Tranosema rostrale, which has been extensively used in our laboratory in experiments involving parasitization under controlled conditions [26,27,28,29,30,31]. Tranosema rostrale cocoons came from a rearing of field-collected C. fumiferana larvae and were provided as cocoons by personnel of the QMFFP. Upon emergence, females were placed in the presence of males for mating in a cage and were subsequently held individually in a Petri dish in the presence of diluted honey for feeding. Spruce budworm hosts were obtained as post-diapause 2nd-instar larvae from the Insect Production Unit of Natural Resources Canada (Sault Ste. Marie, ON, Canada; [32]) and reared on artificial diet [33] until reaching the 4th instar. For parasitization, a newly molted 4th instar C. fumiferana larva was added to a Petri dish containing a mated T. rostrale female and monitored until parasitization (stinging) was observed. A sub-sample of larvae was processed for DNA extraction immediately after egg laying (time zero), while all other larvae were returned to artificial diet and reared until DNA extraction at 1, 2, and 5 days after parasitization. DNA extracts were then processed through Module 1 and the Tranosema-specific assay of Module 3.

3. Results

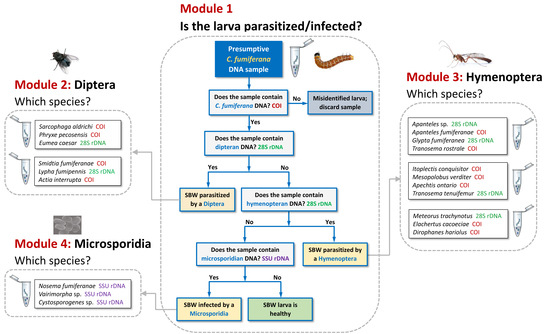
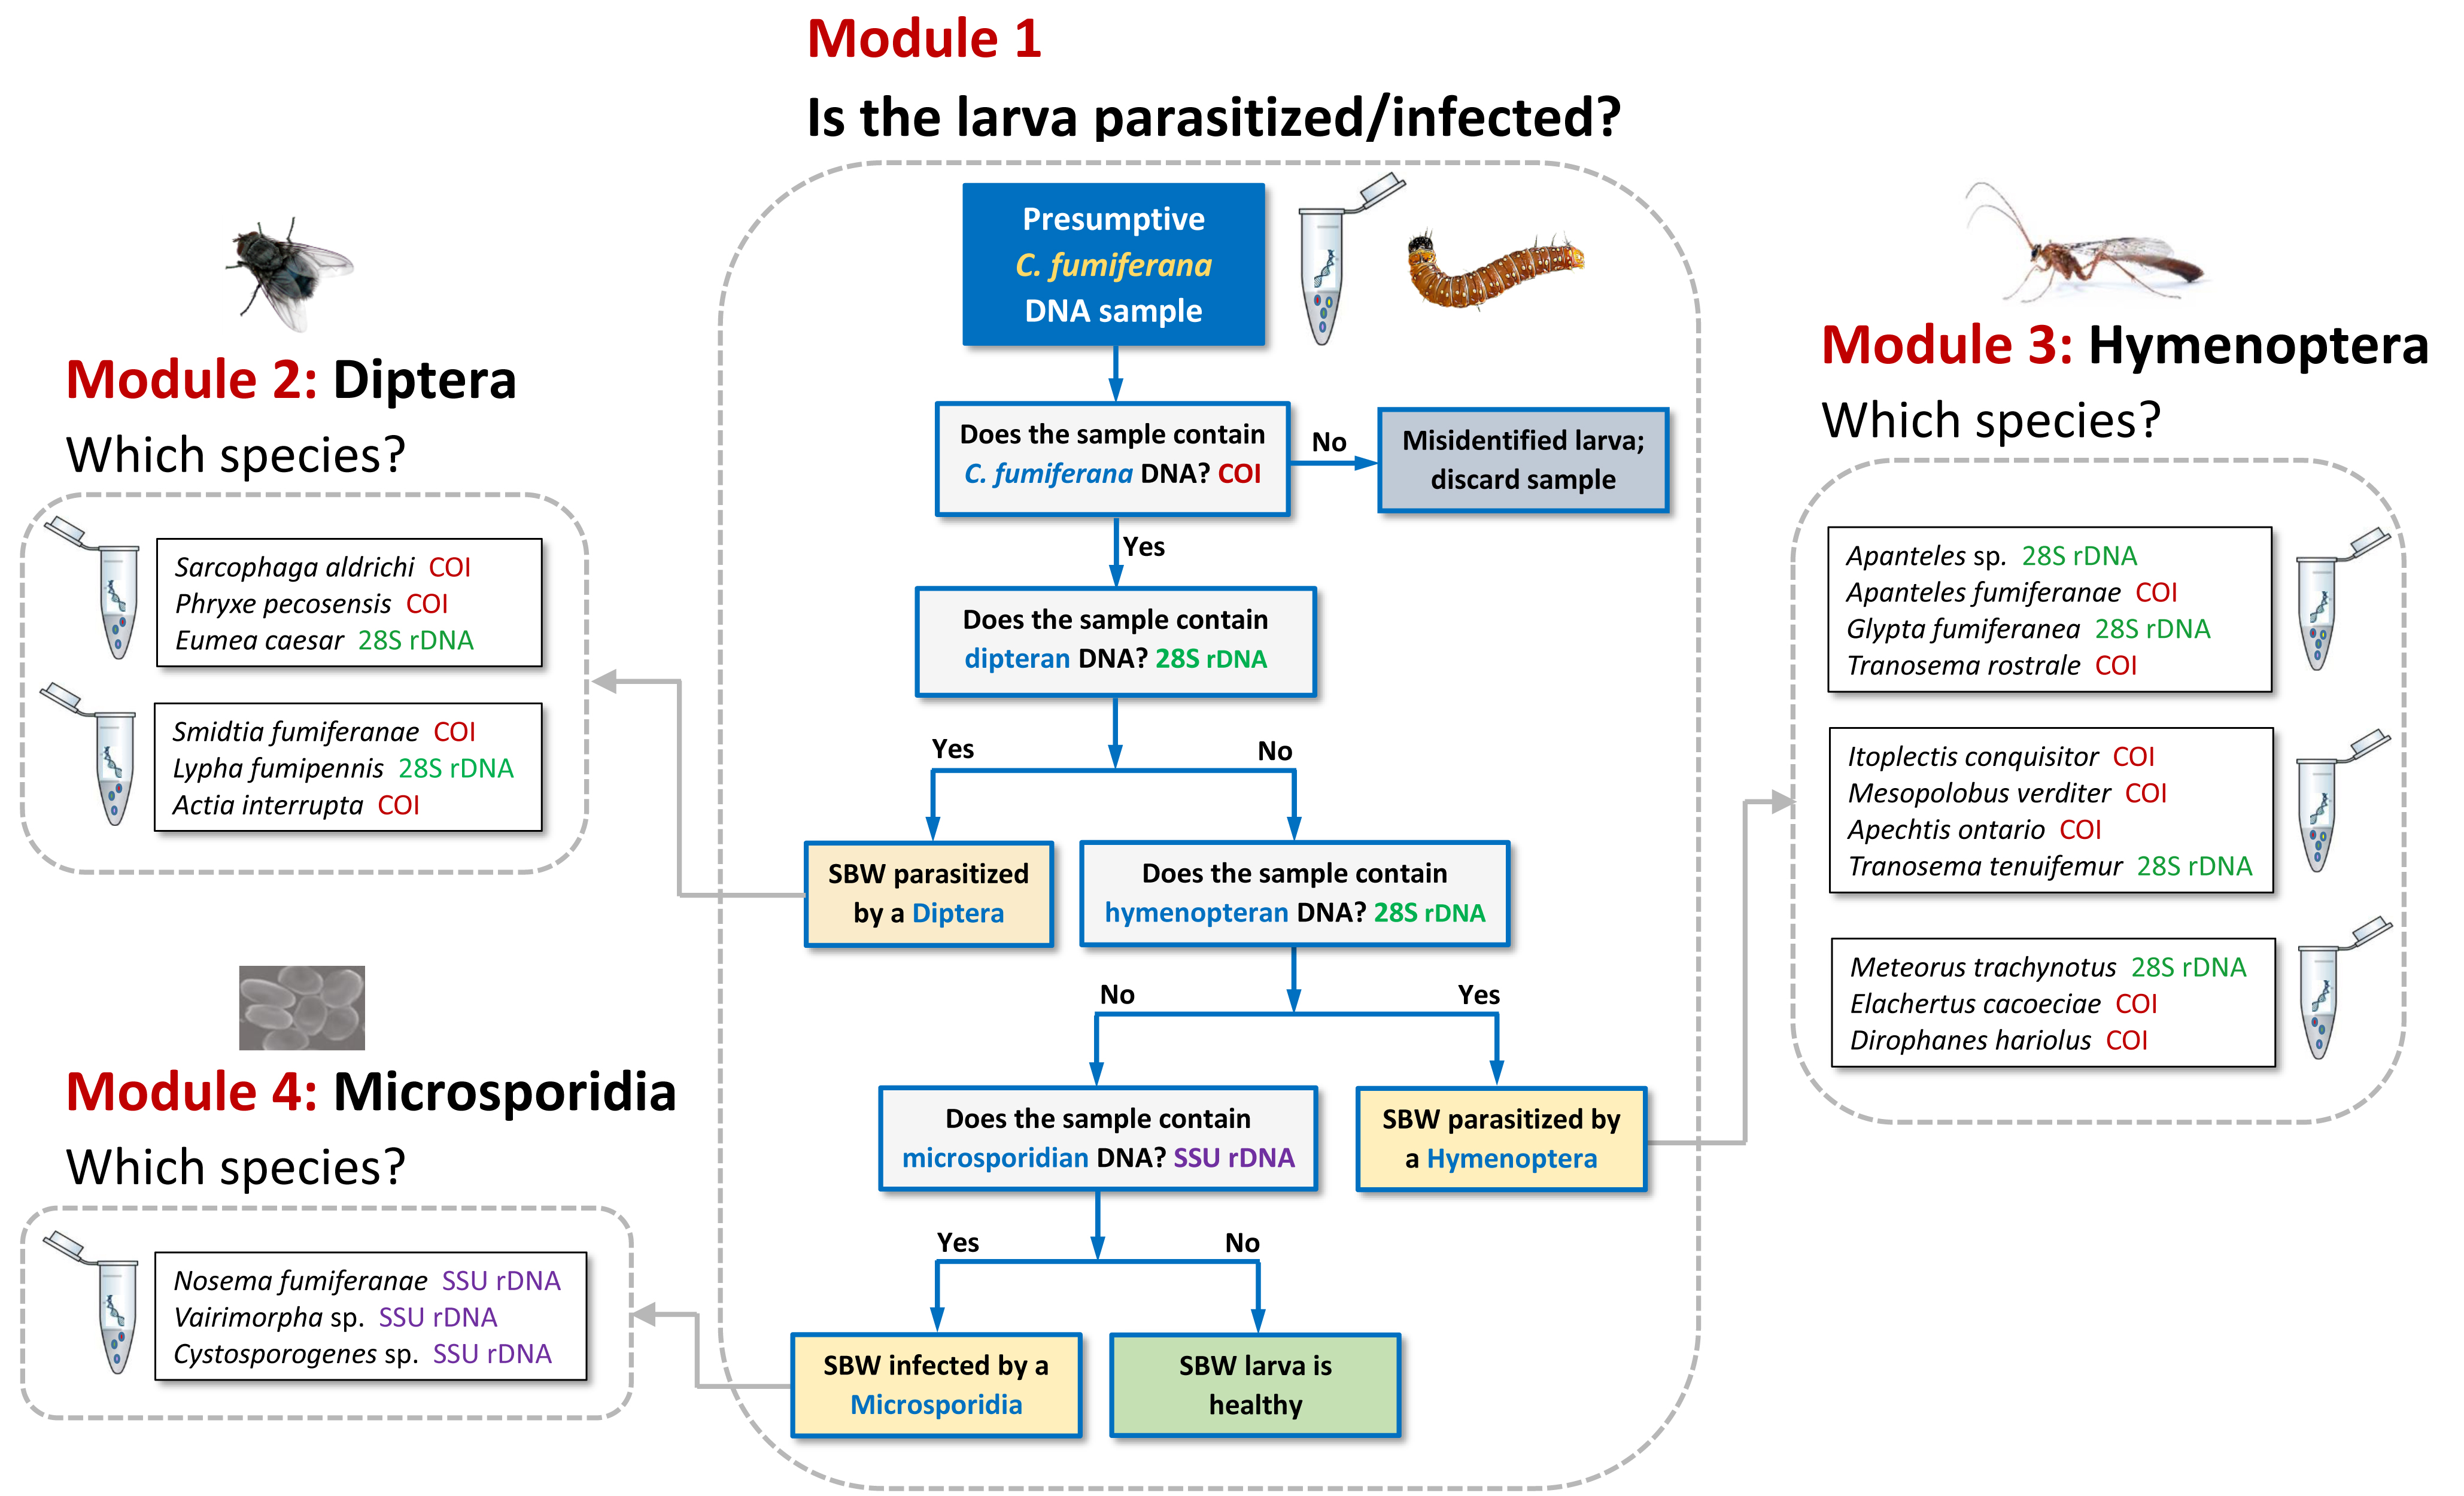
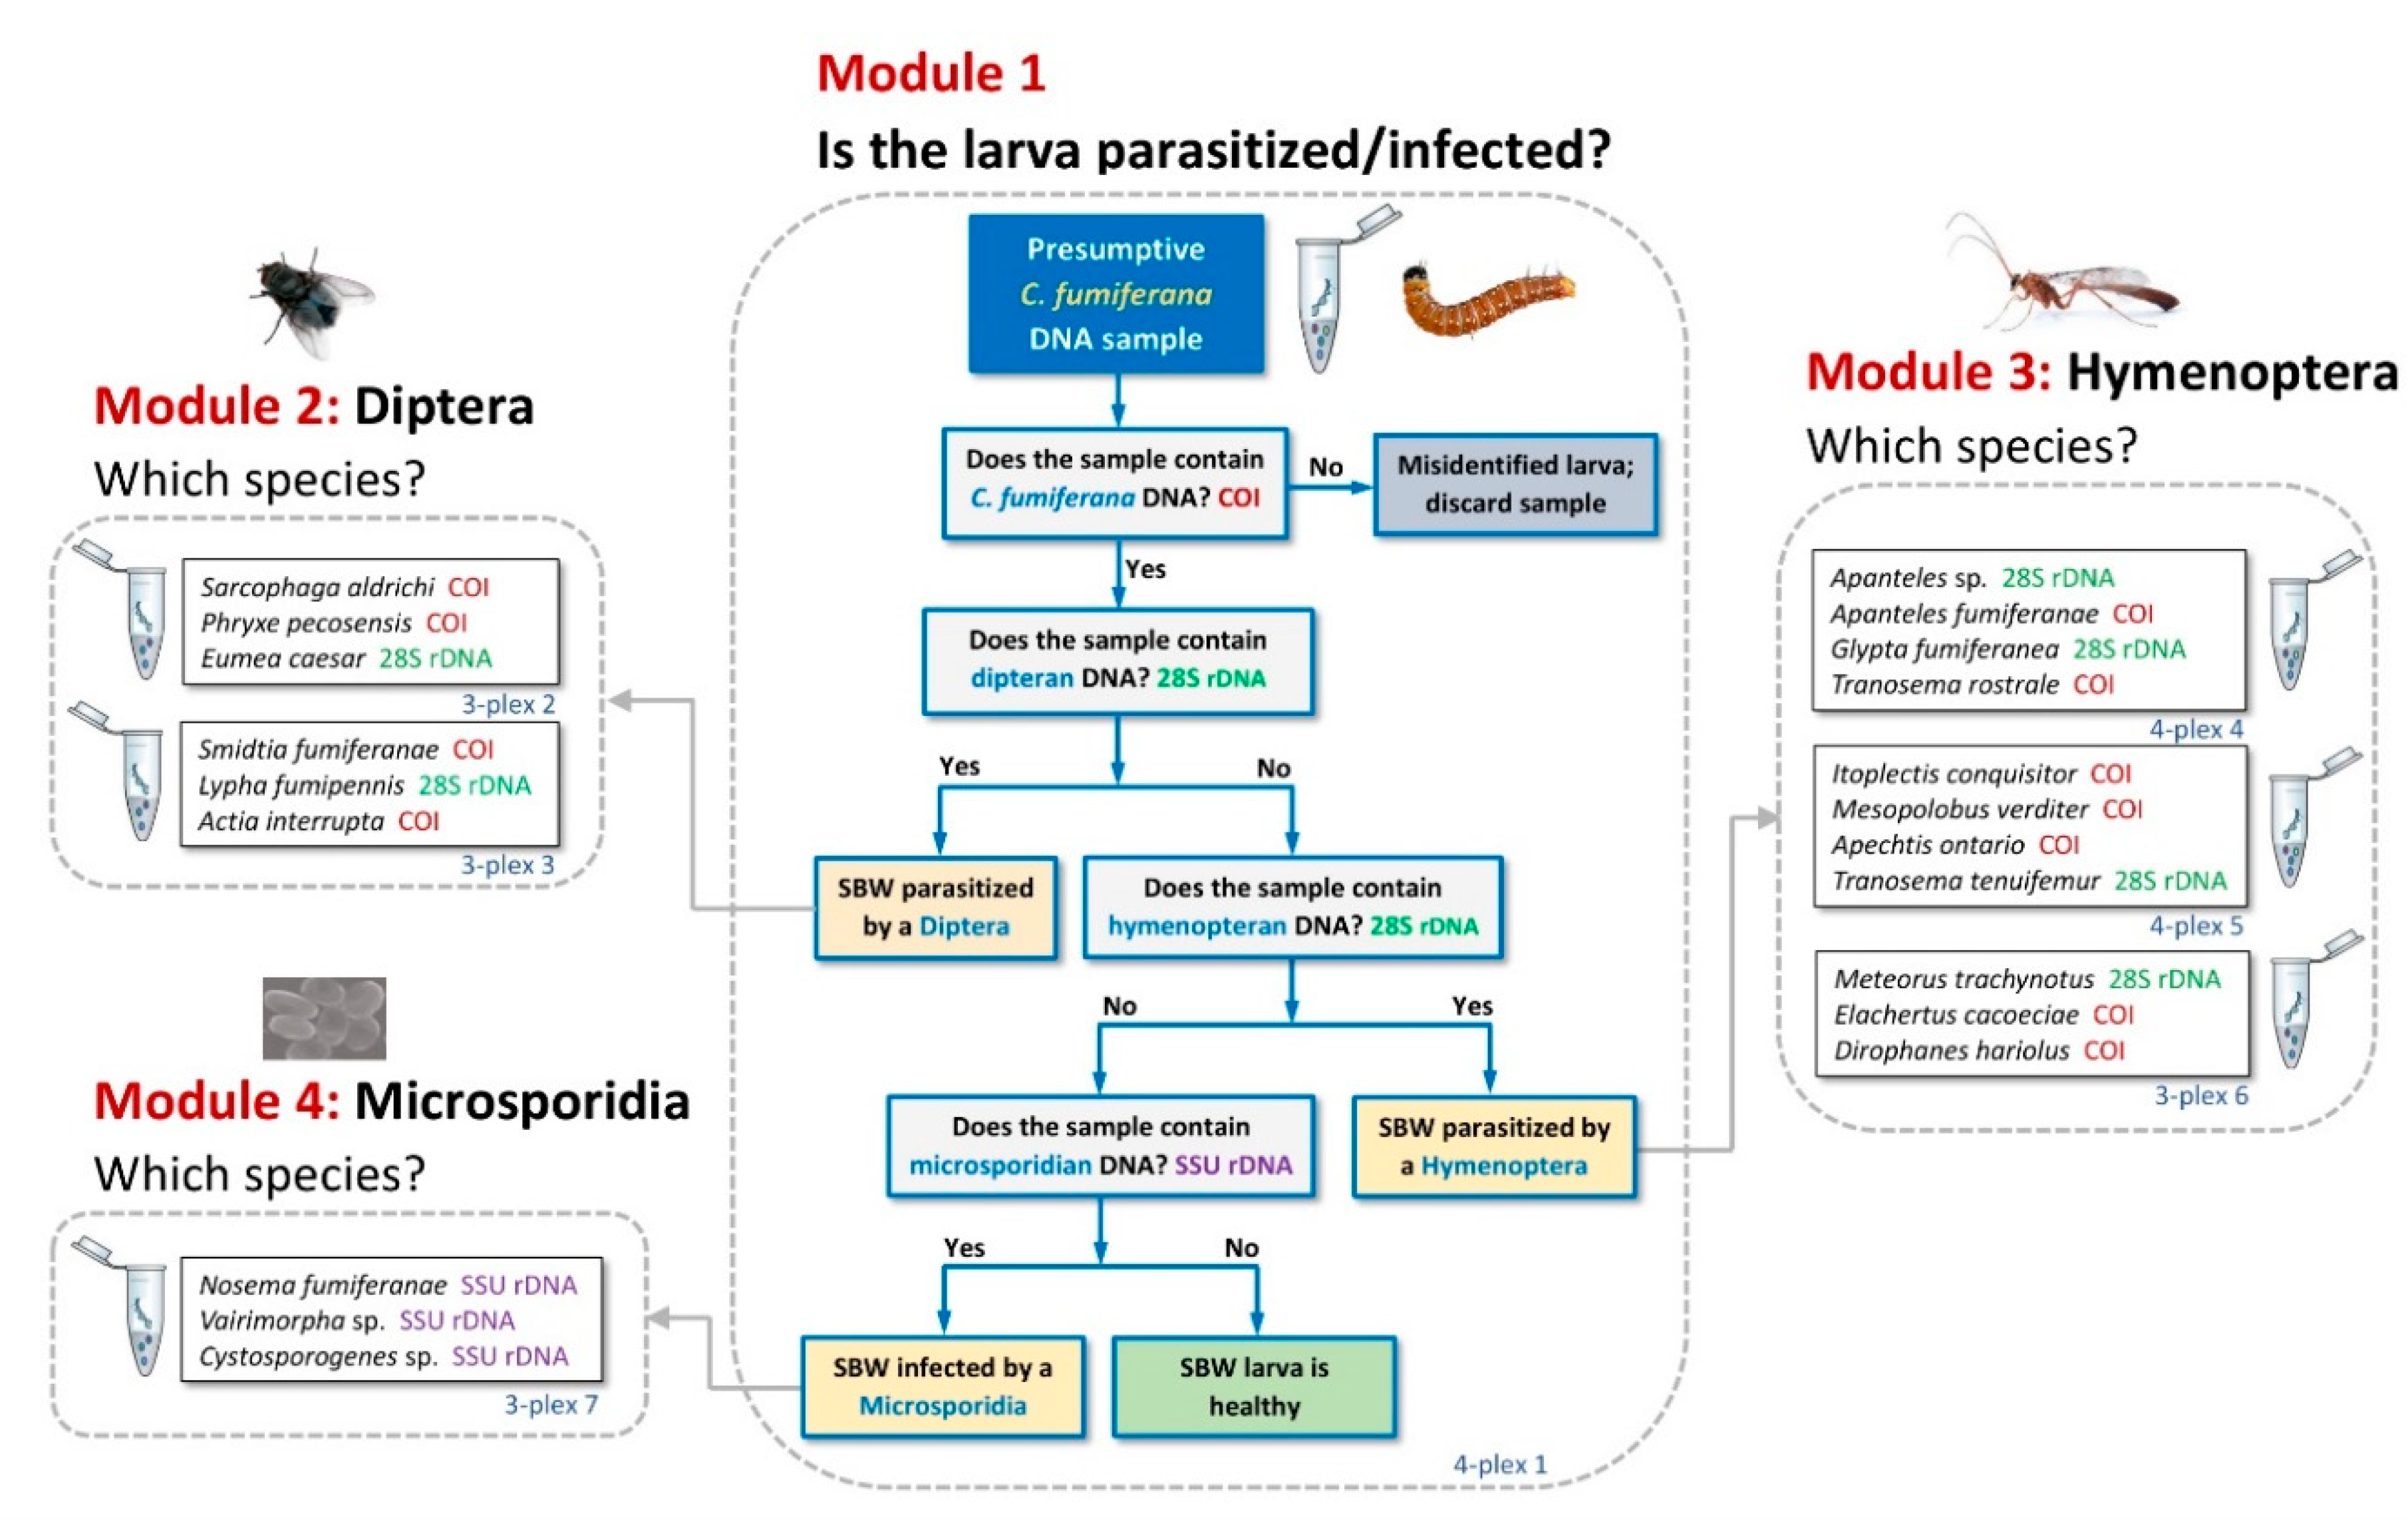
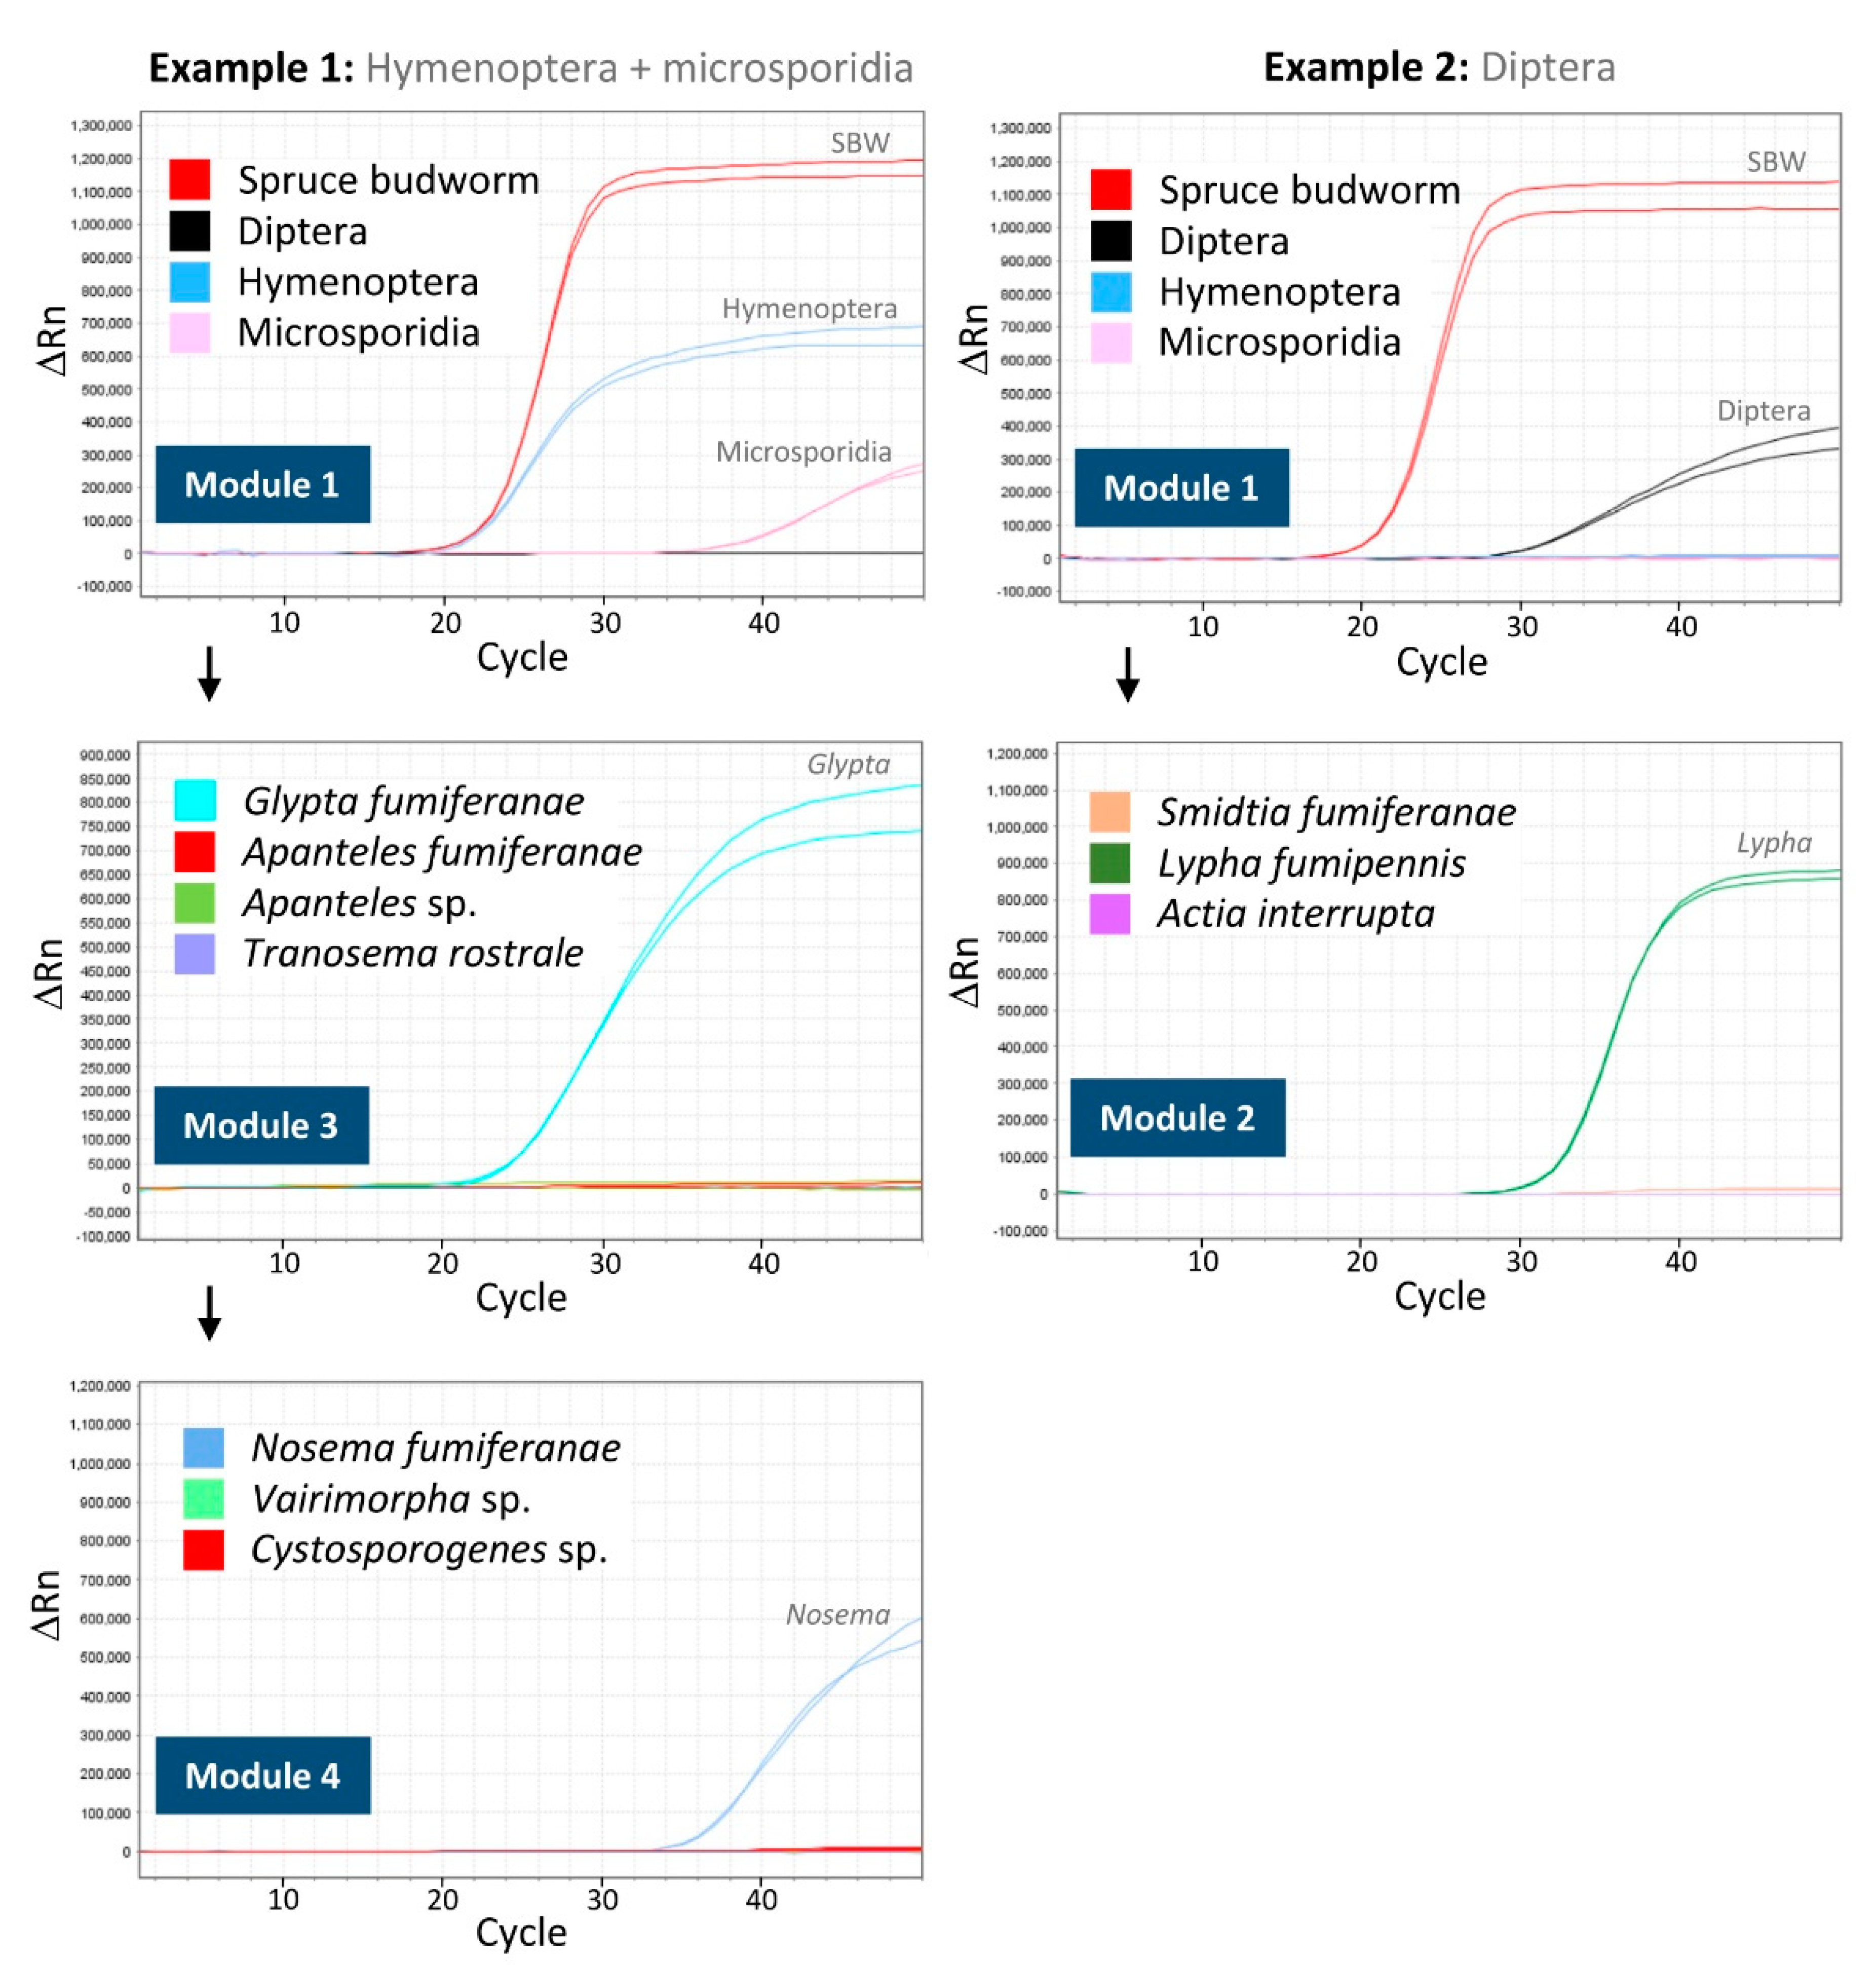
3.1. Tool Development and Architecture

To develop a molecular identification tool that builds on an existing DNA library, but does not require the technical expertise necessary to complete DNA sequencing, we capitalized on the qPCR TaqMan® technology, used in multiplex format. In this case, a collection of individual assays targeting specific taxa are organized in a hierarchical system and DNA samples are submitted to parallel analyses in a limited number of tubes; at the end of the process, compilation of positive and negative amplifications yields the correct identification. To design individual assays, we first needed to prioritize the natural enemies that were to be included in the tool (see Materials and Methods section for details) and then build a barcode database for priority species (Table 1; File S1). With this barcode database in hand, alignment of relevant barcode sequences made it possible to design qPCR primers and TaqMan probes in regions where primer and probe annealing would only be possible in the presence of DNA from the target species/taxon. For example, in an assay aimed at detecting dipteran parasitoid DNA, while discriminating against hymenopteran parasitoid and spruce budworm DNA, alignment of 28S rDNA barcode sequences from multiple representatives of the two parasitoid taxa, plus the spruce budworm, enabled the identification of DNA regions that were perfectly homogenous among all dipteran representatives, thus permitting the design of dipteran-specific primers and probes in these regions (Figure 1; corresponding alignments for each individual assay included in the tool are provided in File S4).
The molecular sorting tool (MST) presented here comprises four independent modules (Figure 2; Table 2). Processing of a DNA sample through the 4-plex assay of Module 1 informs the user as to whether the test specimen contains dipteran, hymenopteran, and/or microsporidian DNA. In addition, it determines whether the host was correctly identified as C. fumiferana, inasmuch as other lepidopteran larvae could have been incorrectly identified as spruce budworm during sample collection. Such misidentified samples may then be discarded or processed through additional, optional assays (i.e., not included in the standard version of Module 1) to determine if the host belongs to another pest species commonly found on fir and spruce trees, namely the black headed budworm (Acleris variana) and the spruce coneworm (Dioryctria reniculelloides; see last tab of File S4).
Depending on the outcome of Module 1 analysis, the user may then process aliquots of the same DNA sample through one or more of the other three modules for species/genus-level identification of the dipteran, hymenopteran, and/or microsporidian DNA detected by Module 1. Module 2, which comprises two 3-plex assays, enables identification of six dipteran parasitoid species, while Module 3 comprises two 4-plex assays plus one 3-plex assay, making it possible to identify 11 hymenopteran parasitoid species. Finally, sample processing through Module 4 enables identification of microsporidian pathogens at the species or genus level in a 3-plex assay (Figure 2; Table 2).
Examples of amplification curves obtained for samples processed through the MST are presented in Figure 3. In the first example, positive amplifications obtained after running Module 1 confirm the identification of the host as C. fumiferana, and reveal the presence of both hymenopteran and microsporidian DNA in the sample. The DNA extract is then further processed through Modules 3 and 4, identifying the parasitoid as Glypta fumiferanae and the pathogen as Nosema fumiferanae, respectively (Figure 3). In the second example, Module 1 processing yields positive amplifications for C. fumiferana and dipteran DNA, while Module 2 analysis identifies the parasitoid as Lypha fumipennis (Figure 3).

3.2. Tool Validation Using Synthetic gBlocks® Fragments and DNA Extracts

3.2.1. Detection

As a first step toward validating the detection capability of each individual assay making up the MST, simplex tests were conducted using 10 fg of synthetic gBlocks DNA fragments, designed to match the marker region targeted by each individual assay. All tests produced positive amplifications, with Ct values ranging from ~20 to ~24 (Table 3), indicating that gBlocks fragments provide suitable positive controls when processing DNA extracts from field-collected samples. As a second assessment of the detection capability of our tool, we ran tests using purified parasitoid DNA (whenever available) in simplex and multiplex formats, as well as in multiplex format in the presence of spruce budworm DNA, to ensure host DNA, typically present in large excess in larval extracts, did not interfere with any given assay. In tests assessing the reliability of Module 1 (Table 4), assays were run against species from our priority (“frequent”) list, plus additional dipteran and hymenopteran species from the “occasional” and “less common” categories (see Table 1; species in red characters in Table 4; tested only in 4-plex format in the presence of SBW DNA) to ensure that they, too, can be detected in parasitized larvae. Purified parasitoid DNA was secured for all but four species, three of which were instead processed in the form of crude spruce budworm lysates (parasitoid species identified through barcode sequencing during preliminary work), leaving one dipteran species, Sarcophaga aldrichi, for which our only DNA resource was a gBlocks COI barcode fragment, which could not be detected by the 28S rDNA-based Module 1 assay (note: based on the highly conserved 28S rDNA region selected for the design of the Diptera assay of Module 1 (Figure 1), S. aldrichi is expected to be detected, like all other Diptera). All assays yielded the expected amplifications, in both simplex and 4-plex format, with Ct values in the ~27–29 range. In addition, the presence of a spruce budworm DNA spike had no detectable impact on target-specific Ct values (Table 4). The same type of test was performed to assess the detection capabilities of Modules 2, 3, and 4. Again, all assays produced the expected amplifications, with Ct values in the ~27–33 range, and no measurable impact of the presence of spruce budworm DNA on detection (Table 5).

3.2.2. Discrimination

To ascertain absence of cross amplification among the different assays, DNA from each species was tested in multiplex format, both in its dedicated assay and in all other relevant assays (i.e., Module 2, Module 3, and Module 4 assays were tested against all available dipteran, hymenopteran, and microsporidian DNA, respectively). All dedicated assays yielded the predicted outcome, while no cross amplification was observed in any of the other assays (please note that the 4-plex 1B assay of Module 1 could not produce a positive amplification against Sarcophaga aldrichi, for which DNA was only available as a gBlocks COI fragment; File S5).

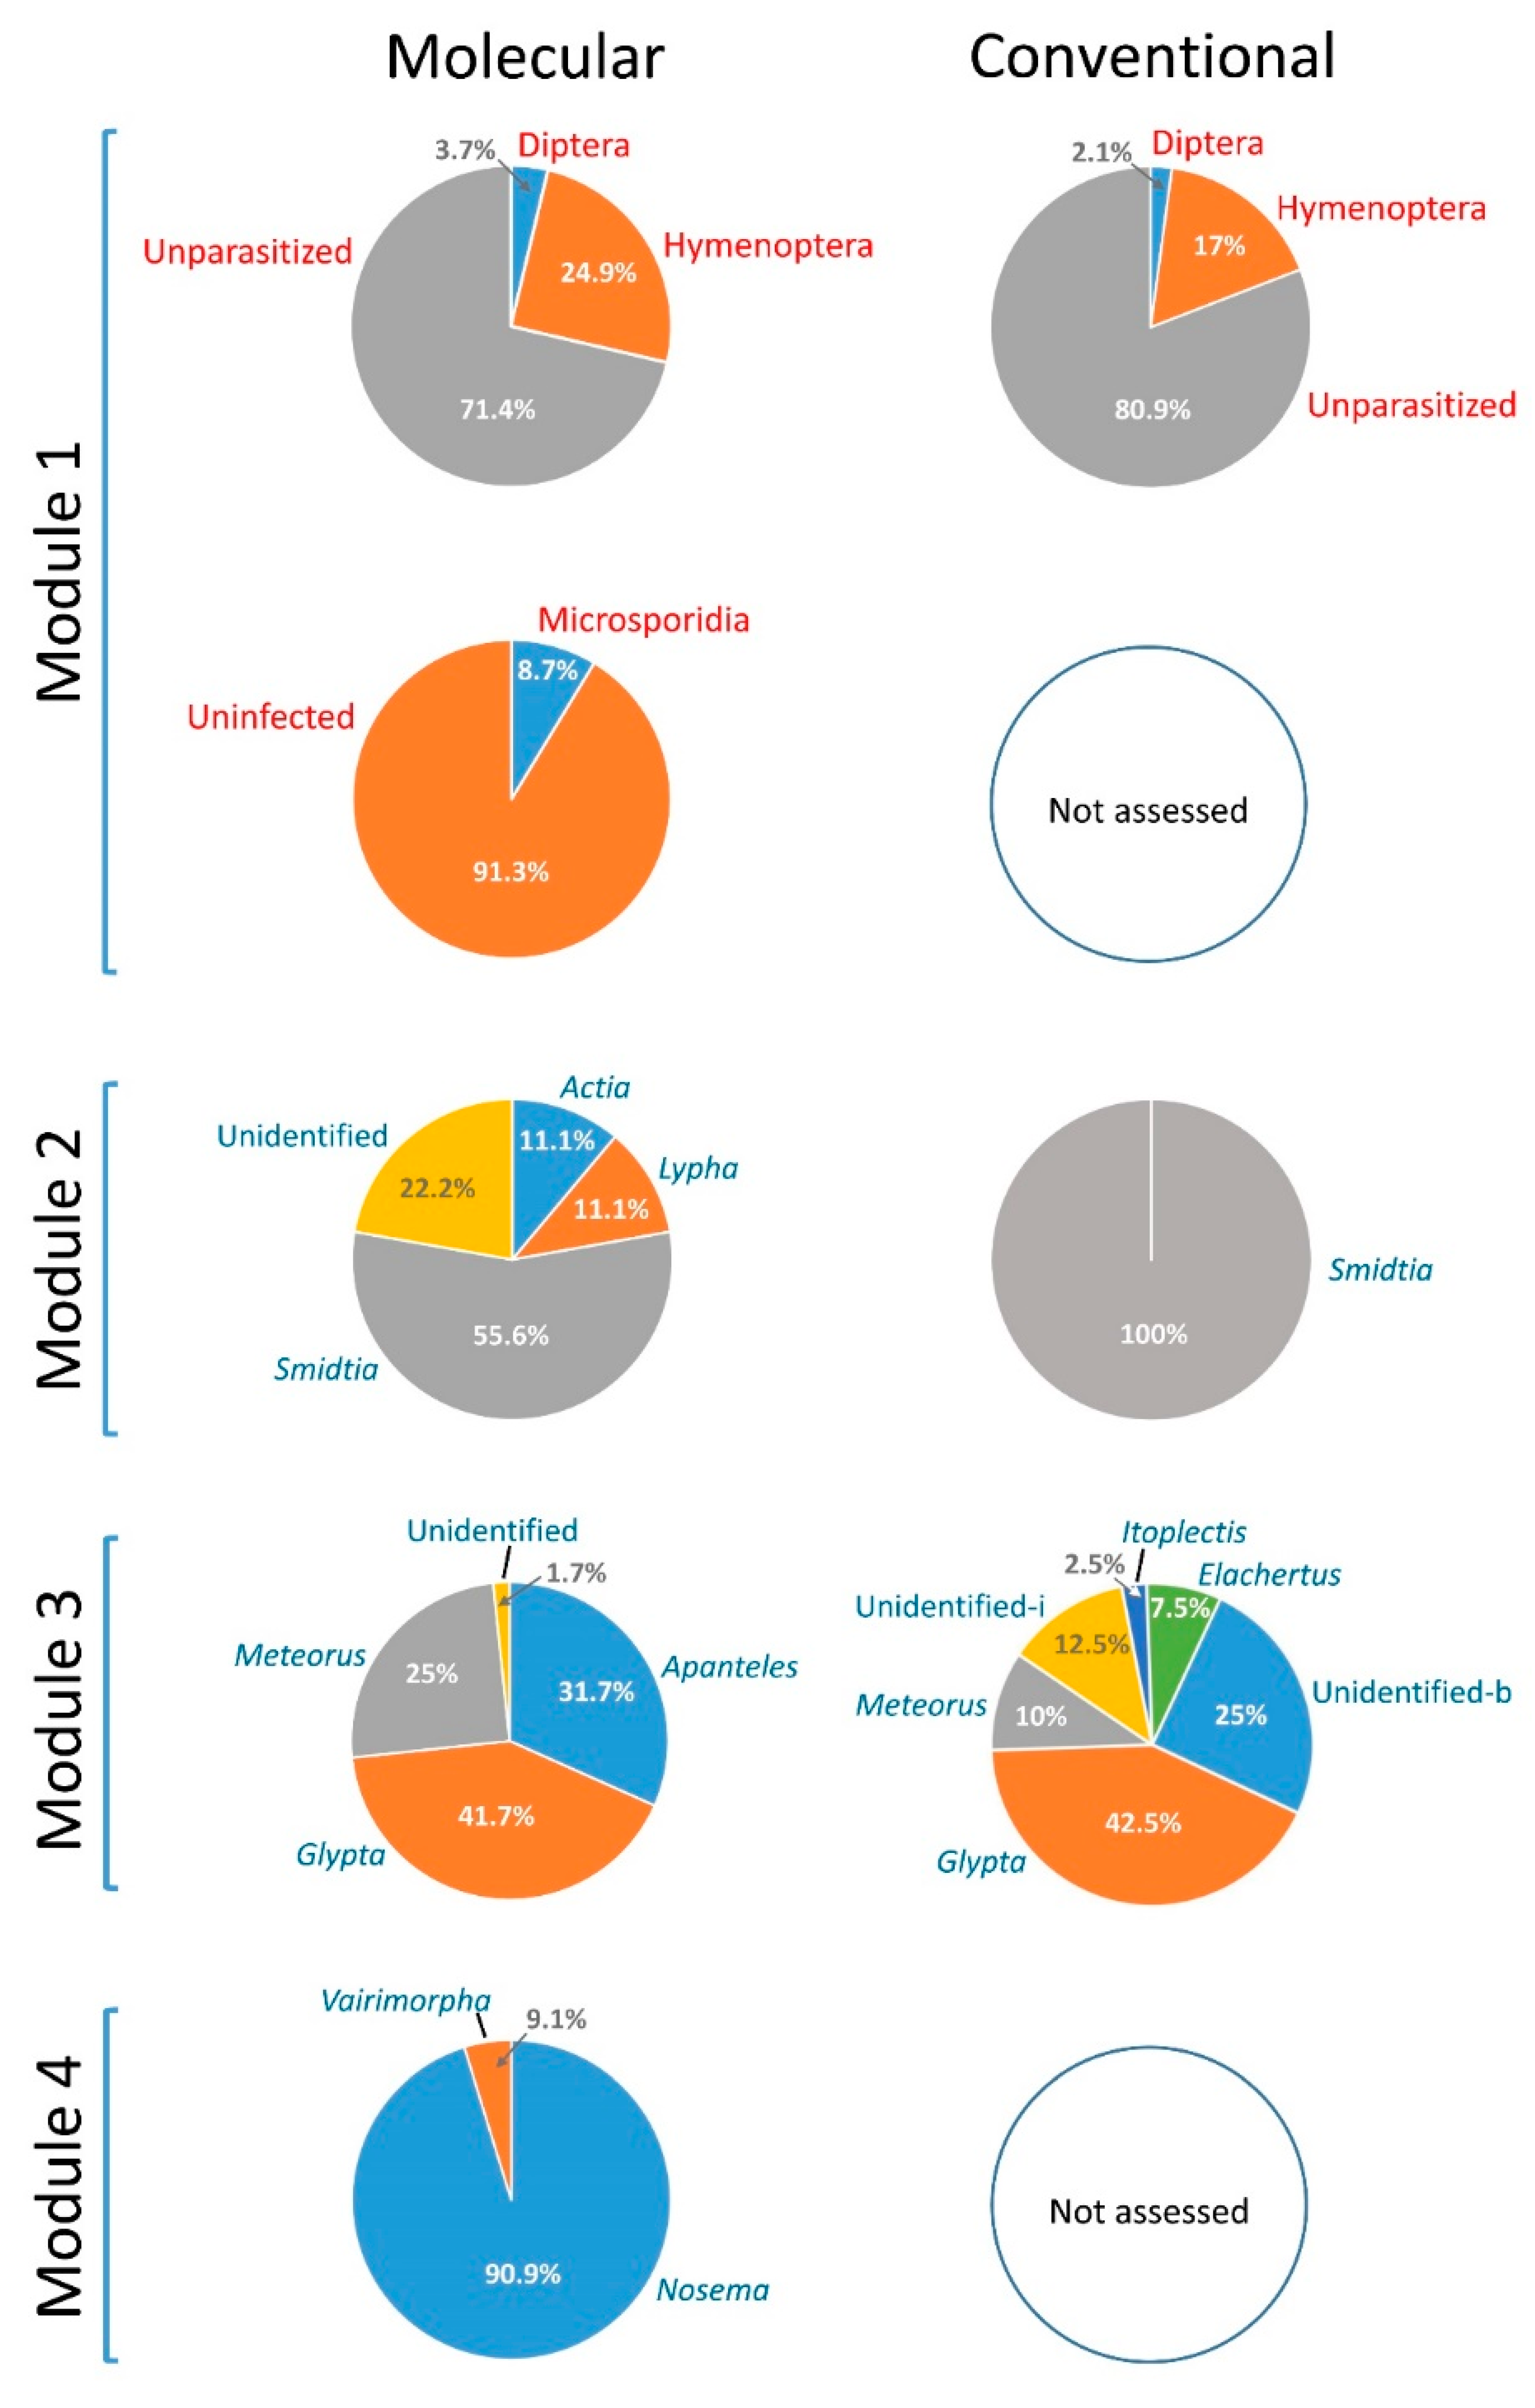
3.3. Comparative Performance of the Molecular Sorting Tool Using Field-Collected Larvae

As a first “real-life” assessment of our MST, we compared its performance with that of the conventional diagnostic approach, using two independent sets of spruce budworm larvae collected in a balsam fir stand, in the Charlevoix region of Quebec, in 2019. While the two sets of independent samples were not expected to yield identical results, we anticipated similar outcomes as both were from the same site and population. Not surprisingly, the two diagnostic approaches generated a similar assessment of the proportion of larvae harboring dipteran and hymenopteran parasitoids, although the proportions appeared somewhat higher with the molecular detection tool (Figure 4; see File S6 for details). For the identification of species of dipteran parasitoids, while the MST detected more taxa than the conventional approach, sample sizes were too low (N = 8, molecular; N = 5, conventional) to provide a fair comparison of the two methods. With respect to hymenopteran parasitoids, where sample sizes were larger (N = 55, molecular; N = 40, conventional), the two approaches yielded somewhat similar outcomes, particularly in reference to the occurrence of Glypta fumiferanae. However, the samples processed through the molecular approach generated a greater proportion of Meteorus trachynotus, while many parasitoids were classified as “unidentified braconids” by the conventional approach, all of which are presumed to correspond to those identified as Apanteles fumiferanae by the molecular method (Figure 4).
While the MST displayed greater precision than the conventional diagnostic method for the identification of hymenopteran parasitoids (i.e., fewer unidentified species), the set of samples processed through Module 3 of the tool yielded no positives for Itoplectis conquisitor and Elachertus cacoeciae, which were detected through rearing of larvae and visual identification of emerged parasitoids (Figure 4). In view of the low counts obtained for these two species (1 and 3 occurrences, respectively), the difference observed between the two methods could simply be due to chance. However, E. cacoeciae being an ectoparasitoid, we must consider the possibility that the insect became detached from its host during preprocessing storage at −20 °C, thereby escaping detection.
Interestingly, unlike the rearing-based method, the molecular approach enabled detection of a few cases of multiparasitism (File S6); in these cases the species with the lower Ct (most abundant DNA) was assumed to be the one that would have completed its development and killed the host (and the only one considered in calculating the proportions shown in Figure 4), as is typical of solitary endoparasitoids.
Finally, although the present samples were not processed for microsporidian detection using microscopic examination of larval tissues, their detection and identification by Modules 1 and 4 of the MST, respectively, revealed an infection rate below 10%, with ~90% of positives identified as Nosema fumiferanae and a new record for Vairimorpha spp. (Figure 4).

3.4. Assessment of the Limit of Detection

With a molecular detection and identification method such as the one presented here, the question arises as to how soon after parasitization can a parasitoid be detected; indeed, freshly laid eggs contain far fewer cells (and DNA) than older parasititoid larvae, thereby resulting in a much lower parasitoid:host DNA ratio. This question was experimentally addressed using the ichneumonid wasp Tranosema rostrale as a model. While all newly parasitized 4th-instar hosts (time zero) escaped hymenopteran detection at the Module 1 processing stage, parasitoids were detected in the majority of samples at 1, 2, and 5 days post-oviposition (Table 6).

4. Discussion

We report here on a qPCR-based molecular sorting tool (MST) designed for the rapid detection and identification of 20 spruce budworm natural enemies considered common in the eastern portion of their host’s range. This MST, which enables species identification without DNA sequencing, has been fully validated using parasitoid and microsporidian DNA (Table 3, Table 4 and Table 5; File S5), and its performance, using field-collected larvae, is shown to compare favorably with the conventional rearing-based approach (Figure 4; File S6).
To our knowledge, a molecular sorting strategy for identifying natural enemies has not been described previously. Although the present MST shows similarities to the TaqMan-based multiplex assays we developed earlier for the identification of lymantriine moths [17,18], it has a more complex modular architecture, both in terms of hierarchical organization (with Module 1 designed for detection and higher-level taxonomic identification, and Modules 2–4 designed for identification at the species/genus level) and number of targeted species. It also features a simplified DNA extraction procedure, whereby crude lysates are used, thus significantly shortening the DNA purification step.
Our suite of assays is expected to be robust with respect to potential PCR inhibition issues. First, the observation that the results of the molecular assay closely resemble those obtained using the rearing-based approach (Figure 4) indicates that inhibition is not a significant problem with our assays. We must also stress the fact that a portion of the validation tests (all of which were successful) were conducted in the presence of a spruce budworm DNA spike, where the DNA was in the form of a crude larval extract, which mimics real-life situations with environmental samples (see Table 4 and Table 5). In addition, whereas spruce budworm DNA was brought to a ~1000× dilution for operational use, to avoid potential inhibition of the PCR reaction (a dilution chosen after extensive preliminary testing), all spiked validation tests were conducted at a lower budworm DNA dilution (~200×), without any inhibition being observed.
The MST presented here offers several advantages over the conventional method. First, it does not require that host larvae be reared on artificial diet, thereby saving both the labor and costs associated with this step. Second, because field-collected larvae may instead be stored in the freezer, their processing for natural enemy detection and identification can be done at any time after field collection, resulting in greater operational flexibility. Third, given that some parasitoids retard the growth of their host and can take up to two months to complete their development (e.g., Tranosema [=Synetaeris] tenuifemur; [34]), the MST can provide a more rapid diagnostic of parasitism than the rearing-based method, insofar as the number of larvae to be analyzed does not exceed the capacity of the processing laboratory, both in terms of technical staff and equipment. Fourth, because species identification is done automatically as a product of the molecular sorting process, the MST does not require morphology-based taxonomic expertise by the personnel who conduct the analyses. Fifth, it follows that the MST will typically provide more accurate species identification than the conventional method, particularly for laboratories where expertise in insect taxonomy is limited. Sixth, unlike the rearing-based approach, the MST can detect cases of multiparasitism (see File S6), a feature that may prove very useful for monitoring the activity of specific parasitoid species. Finally, the MST enables the easy monitoring of three microsporidians, including the possibility of obtaining an indirect assessment of pathogen load based on Ct values. Thus, the MST should prove particularly useful in view of the substantial expertise required to detect and correctly identify microsporidian species through microscopy; in eastern Canada, the microsporidian component of the conventional diagnostic procedure is currently lacking because of a shortage in qualified personnel.
Because we had to limit the number of parasitoid species featured on the MST’s target list, it follows that several less common species (Table 1) cannot be identified by this tool. However, it must be pointed out that identification of rare species is also challenging for the technical personnel performing the conventional procedure, and whenever such identifications are deemed necessary, specimens must be shipped to specialists for formal species determination. In this context, the barcode sequence database that we developed (which comprises both frequent and less common species of spruce budworm parasitoids; see File S1) could be exploited for the identification of rare species in field-collected specimens. Indeed, the PCR amplicons generated by Module 1 for unidentified species can optionally be submitted to sequencing for species identification using a sequence comparison approach (with the present database as reference), if the skills required for this task are available in the diagnostic laboratory conducting the work. In any event, the proportion of cases falling in the “unidentified dipteran” and “unidentified hymenopteran” (following detection by Module 1) is expected to always be low.
It is important to note that libraries of public DNA sequences such as BOLD and GenBank contain the intra-specific variability (or lack thereof) upon which TaqMan assays such as the MST depend. The more thoroughly such sequence libraries capture the geographic range of the species of interest, the greater their utility and the more reliable the assays are. This dependence highlights the need for sustained contributions to public sequence and specimen libraries. Here, for parasitoids, we did as extensive a sampling as we could in Quebec and New Brunswick, but for some species, the geographic coverage was likely incomplete, because of either partial coverage in public databases or a limited capacity to acquire specimens to conduct additional marker sequencing. Therefore, when running Modules 2 and 3, false negatives could potentially occur as a consequence of regional sequence variation that was not captured in the design of our primers and probes. However, all parasitoids, irrespective of geographic origin, are expected to be detected by Module 1. Thus, as we continue processing samples from eastern Canada, as part of the present research effort, we are conducting marker sequencing for any sample that falls in the “Unidentified Diptera” (no Module 2 positive amplification) or “Unidentified Hymenoptera” (no module 3 positive amplification) categories; this will allow us to determine whether the assay conclusions are correct (i.e., the species detected by Module 1 is not a “frequent” budworm parasitoid) or incorrect (failed amplification or detection of a frequent species). Although the latter situation has not occurred yet, its rigorous monitoring could potentially lead to further refinements of the present MST. This type of monitoring could also help determine whether the MST can reliably be used for the identification of natural enemies in portions of the spruce budworm range outside Quebec and New Brunswick.
The experiment aimed at assessing the MST’s limit of detection clearly points to an adequate level of sensitivity under operational conditions (Table 6). Although T. rostrale DNA was not detected in hosts processed immediately after oviposition, it was detected 24 h later and on subsequent days. Given that spruce budworm larvae are typically removed from foliage only on the day after field collection, the MST is expected to detect 1-day old immature parasitoids (i.e., eggs) such as those of T. rostrale. It should be pointed out, here, that the few cases where no parasitoid was detected in host larvae on days 1, 2, and 5 (1 out of 8 on day 1, and 2 out of 8 on days 2 and 5; Table 6) are unlikely to represent failed detection, but rather failed oviposition events, as the observed stinging by a wasp does not always result in egg laying (M. Cusson, personal observation). Indeed, the more sensitive T. rostrale-specific assay of Module 3 (i.e., “4-plex 4D”; Table 2) also failed to detect T. rostrale DNA in larvae where no Module 1 detection was observed 1, 2, and 5 days post-oviposition, indicating these larvae had most likely not been parasitized (data not shown).
Although not intended to provide an exhaustive assessment of all assays built into the MST, the comparative analysis presented here, using field-collected budworm larvae (Figure 4; File S6), suggests that, for parasitoids, the tool performs at least as well, if not better, than the conventional rearing-based method. With respect to microsporidian detection and identification, the MST offers a level of diagnostic capability that certainly surpasses any standard microscopic examination of larval tissues. The only potential shortcoming of the MST revealed by this analysis is the possibility that ectoparasitoids such as Elachertus cacoeciae could accidentally become detached from their host as a result of the freezing/thawing process, thus failing to be detected by the tool if not properly recovered from the storage tube. Whether this is what happened with the samples we analyzed here is unclear, as this parasitoid may simply have been absent from the set of samples we used for molecular detection. Nonetheless, special care should be taken when recovering insect material from storage tubes to ensure full recovery and detection of ectoparasitoids by the MST. As we are now setting out to process thousands of additional field samples using this tool, we should soon be able to address the issue as to whether this precaution is indeed necessary.
With respect to costs, expenditures associated with DNA extraction and Module 1 are estimated to be less than $5 (CDN) per sample, assuming the thermocycling and other equipment required for processing samples are already available in the diagnostic laboratory conducting the work. Costs of processing Module 1-positive samples through the other modules, for species identification, compares favorably (~$6.5 per sample) with bidirectional sequencing of 28S rDNA amplicons (~$8 per sample). Initial investments of ~$9000 and ~$3000 (CDN) will be required for the purchase of probes and gBlocks DNAs, but actual costs per well will be less than a cent. In addition, our laboratory has sufficient reserves of gBlocks to provide complimentary aliquots to other laboratories wishing to use the tool on a routine basis. It is difficult to determine whether total expenditures associated with the MST will be lower than those associated with the rearing-based diagnostic procedure, but the outcome will likely vary as a function of the cost of labor and the number of samples to be processed.

5. Conclusions

We have developed a user-friendly molecular tool for the detection and identification of 20 common natural enemies of the spruce budworm. In addition to providing high sensitivity and both rapid and accurate species identification, the tool displays exceptional operational flexibility, a feature associated with its modular architecture and multiplex format. Depending on the goals of a given survey and the level of diagnostic precision required, the output of Module 1 may be deemed sufficient by some users, thereby eliminating the need to run positive samples through the other modules. Similarly, if an assessment of microsporidian infection is not considered essential for a given study, that specific assay can easily be taken out of Module 1. With respect to the dipteran and hymenopteran identification assays, users interested only in those species that are most abundant during the outbreak phase could choose to limit their analyses to the 3-plex 3 (in Module 2) and the 4-plex 4 (in Module 3) assays (see Table 2), further reducing the complexity and cost of running the MST. Importantly, because the primers and probes used in Module 1 were designed to detect any species within each of the three targeted taxa, this module (minus its spruce-budworm specific assay) is expected to be fully exportable to other host-natural enemy systems where surveys of the type reported here must be conducted.

Supplementary Materials

The following are available online at https://www.mdpi.com/1999-4907/11/6/621/s1, File S1: Marker database assembled for the development of the molecular sorting tool; File S2: Primer and probe sequences; File S3: gBlocks® sequences; File S4: Supporting data for the development of each individual assay; File S5: Results of assay discrimination tests; File S6: Full dataset used to create Figure 4.

Author Contributions

Conceptualization, A.N., D.S., and M.C.; methodology, A.N., D.S., A.D., and G.K.-P.; validation, A.N., D.S., and M.N.; formal analysis, A.N., D.S., and M.C.; investigation, A.N., D.S., M.N., P.H., S.T., S.K., G.K.-P.; resources, A.N., D.S., G.K.-P., V.M., R.C.J., E.E., S.K., and M.A.S.; data curation, A.N. and D.S.; writing—original draft preparation, M.C., A.N., and D.S.; writing—review and editing, all authors; supervision, M.C., A.N., M.A.S., and V.M.; project administration, M.C., M.A.S., and V.M.; funding acquisition, M.C., V.M., M.A.S., and G.K.-P. All authors have read and agreed to the published version of the manuscript.

Funding

This research was funded by the Atlantic Canada Opportunities Agency and Natural Resources Canada.

Acknowledgments

We thank G. Trudel, P. Therrien and M. Bouchard (Quebec Ministry of forests, fauna and parks) for their assistance in the processing of larvae (rearing-based method) for the work presented in Figure 4. We are indebted to D. Gauthier (Natural Resources Canada, Sault Ste. Marie) for her assistance with the microsporidia work. We also thank S. Bélanger, A. Labrecque, and L.-P. Gélinas (Natural Resources Canada, Quebec City) for their assistance in field work, and J. Régnière (Natural Resources Canada, Quebec City) for useful discussions on the abundance of different parasitoid species in Quebec. Finally, we thank three anonymous reviewers for insightful comments on an earlier version of the manuscript.

Conflicts of Interest

The authors declare no conflict of interest. The funders had no role in the design of the study; in the collection, analyses, or interpretation of data; in the writing of the manuscript, or in the decision to publish the results.

References

  1. Johns, R.C.; Bowden, J.J.; Carleton, D.R.; Cooke, B.J.; Edwards, S.; Emilson, E.J.S.; James, P.M.A.; Kneeshaw, D.; MacLean, D.A.; Martel, V.; et al. A conceptual framework for the spruce budworm early intervention strategy: Can outbreaks be stopped? Forests 2019, 10, 910. [Google Scholar] [CrossRef] [Green Version]
  2. Régnière, J.; Cooke, B.J.; Béchard, A.; Dupont, A.; Therrien, P. Dynamics and management of rising outbreak spruce budworm populations. Forests 2019, 10, 748. [Google Scholar] [CrossRef] [Green Version]
  3. Royama, T. Population dynamics of the spruce budworm, Choristoneura fumiferana. Ecol. Monogr. 1984, 54, 429–462. [Google Scholar] [CrossRef] [Green Version]
  4. Royama, T.; Eveleigh, E.S.; Morin, J.R.B.; Pollock, S.J.; McCarthy, P.C.; McDougall, G.A.; Lucarotti, C.J. Mechanisms underlying spruce budworm outbreak processes as elucidated by a 14-year study in New Brunswick, Canada. Ecol. Monogr. 2017, 87, 600–631. [Google Scholar] [CrossRef]
  5. Régnière, J.; Nealis, V.G. Ecological mechanisms of population change during outbreaks of the spruce budworm. Ecol. Entomol. 2007, 32, 461–477. [Google Scholar] [CrossRef]
  6. Eveleigh, E.S.; McCann, K.S.; McCarthy, P.C.; Pollock, S.J.; Lucarotti, C.J.; Morin, B.; McDougall, G.A.; Strongman, D.B.; Huber, J.T.; Umbanhowar, J.; et al. Fluctuations in density of an outbreak species drive diversity cascades in food webs. Proc. Natl. Acad. Sci. USA. 2007, 104, 16976–16981. [Google Scholar] [CrossRef] [Green Version]
  7. Bouchard, M.; Martel, V.; Régnière, J.; Therrien, P.; Pinto Correia, D.L. Do natural enemies explain fluctuations in low-density spruce budworm populations? Ecology 2018, 99, 2047–2057. [Google Scholar] [CrossRef]
  8. Fernández-Triana, J.L.; Huber, J. Braconid parasitoids (Hymenoptera: Braconidae) of nearctic Choristoneura species (Lepidoptera: Tortricidae), with a summary of other parasitoid families attacking Choristoneura. Can. Entomol. 2010, 142, 295–343. [Google Scholar] [CrossRef]
  9. Sullivan, D.J.; Völkl, W. Hyperparasitism: Multitrophic ecology and behavior. Annu. Rev. Entomol. 1999, 44, 291–315. [Google Scholar] [CrossRef]
  10. Lucarotti, C.J.; Eveleigh, E.S.; Royama, T.; Morin, B.; McCarthy, P.; Ebling, P.M.; Kaupp, W.J.; Guertin, C.; Arella, M. Prevalence of baculoviruses in spruce budworm (Lepidoptera: Tortricidae) populations in New Brunswick. Can. Entomol. 2004, 136, 255–264. [Google Scholar] [CrossRef]
  11. Seehausen, M.L.; Labrecque, M.; Martel, V.; Régnière, J.; Mansour, A.; Smith, S.M. Reproductive biology and behavior of Tranosema rostrale (Hymenoptera: Ichneumonidae), a parasitoid of low density spruce budworm (Lepidoptera: Tortricidae) populations. J. Insect Behav. 2016, 29, 500–514. [Google Scholar] [CrossRef]
  12. Pook, V.G.; Athey, K.J.; Chapman, E.G.; Clutts-Stoelb, S.A.; Sharkey, M.J. New PCR primers enhance investigation of host-parasitoid food webs. Ent. Exp. Appl. 2017, 162, 309–314. [Google Scholar] [CrossRef]
  13. Smith, M.A.; Eveleigh, E.S.; McCann, K.S.; Merilo, M.T.; McCarthy, P.C.; Van Rooyen, K.I. Barcoding a quantified food web: Crypsis, concepts, ecology and hypotheses. PLoS ONE 2011, 6, e14424. [Google Scholar] [CrossRef] [PubMed]
  14. Smith, M.A.; Fernández-Triana, J.L.; Eveleigh, E.; Gómez, J.; Guclu, C.; Hallwachs, W.; Hebert, P.D.; Hrcek, J.; Huber, J.T.; Janzen, D.; et al. DNA barcoding and the taxonomy of Microgastrinae wasps (Hymenoptera, Braconidae): Impacts after 8 years and nearly 20,000 sequences. Mol. Ecol. Res. 2013, 13, 168–176. [Google Scholar] [CrossRef]
  15. Kyei-Poku, G.; Gauthier, D.; van Frankenhuyzen, K. Molecular data and phylogeny of Nosema infecting lepidopteran forest defoliators in the genera Choristoneura and Malacosoma. J. Eukaryot. Microbiol. 2008, 55, 51–58. [Google Scholar] [CrossRef]
  16. Van Frankenhuyzen, K.; Ebling, P.; McCron, B.; Ladd, T.; Gauthier, D.; Vossbrinck, C. Occurrence of Cystosporogenes sp. (Protozoa, Microsporidia) in a multi-species insect production facility and its elimination from a colony of the eastern spruce budworm, Choristoneura fumiferana (Clem.) (Lepidoptera: Tortricidae). J. Invert. Pathol. 2004, 87, 16–28. [Google Scholar] [CrossRef]
  17. Stewart, D.; Zahiri, R.; Djoumad, A.; Freschi, L.; Lamarche, J.; Holden, D.; Cervantes, S.; Ojeda, D.I.; Potvin, A.; Nisole, A.; et al. A multi-species TaqMan PCR assay for the identification of Asian gypsy moths (Lymantria spp.) and other invasive lymantriines of biosecurity concern to North America. PLoS ONE 2016, 11, e0160878. [Google Scholar] [CrossRef]
  18. Stewart, D.; Nisole, A.; Djoumad, A.; Zahiri, R.; Lamarche, J.; Levesque, R.C.; Hamelin, R.C.; Cusson, M. A needle in a haystack: A multigene TaqMan assay for the detection of Asian gypsy moths in bulk pheromone trap samples. Biol. Invasions 2018, 21, 1843–1856. [Google Scholar] [CrossRef] [Green Version]
  19. Ratnasingham, S.; Hebert, P.D.N. BOLD: The Barcode of Life Data system (www.barcodinglife.org). Mol. Ecol. Notes 2007, 7, 355–364. [Google Scholar] [CrossRef] [Green Version]
  20. Huber, J.T.; Eveleigh, E.; Pollock, S.; McCarthy, P. The chalcidoid parasitoids and hyperparasitoids (Hymenoptera: Chalcidoidea) of Choristoneura species (Lepidoptera: Tortricidae) in America north of Mexico. Can. Entomol. 1996, 128, 1167–1220. [Google Scholar] [CrossRef]
  21. Wilson, G.G. Transmission of Nosema fumiferanae (Microsporida) to its host Choristoneura fumiferana (Clem.). Z. Parasitenkd 1982, 68, 47–51. [Google Scholar] [CrossRef]
  22. Wilson, G.G. The transmission and effects of Nosema fumiferanae and Pleistophora schubergi (Microsporida) on Choristoneura fumiferana (Lepidoptera: Tortricidae). Proc. Ent. Soc. Ont. 1984, 115, 71–75. [Google Scholar]
  23. Van Frankenhuyzen, K.; Nystrom, C.; Liu, Y. Vertical transmission of Nosema fumiferanae (Microsporidia: Nosematidae) and consequences for distribution, post-diapause emergence and dispersal of second-instar larvae of the spruce budworm, Choristoneura fumiferana (Clem.) (Lepidoptera: Tortricidae). J. Invert. Pathol. 2007, 96, 173–182. [Google Scholar] [CrossRef] [PubMed]
  24. Eveleigh, E.S.; Lucarotti, C.J.; McCarty, P.C.; Morin, B. Prevalence, transmission, and mortality associated with Nosema fumiferanae infections in field populations of spruce budworm Choristoneura fumiferana. Agr. For. Entomol. 2012, 14, 389–398. [Google Scholar] [CrossRef]
  25. Holland, P.M.; Abramson, R.D.; Watson, R.; Gelfand, D.H. Detection of specific polymerase chain reaction product by utilizing the 5′—3′ exonuclease activity of Thermus aquaticus DNA polymerase. Proc. Natl. Acad. Sci. USA 1991, 88, 7276–7280. [Google Scholar] [CrossRef] [PubMed] [Green Version]
  26. Cusson, M.; Laforge, M.; Miller, D.; Cloutier, C.; Stoltz, D. Functional significance of parasitism-induced suppression of juvenile hormone esterase activity in developmentally delayed Choristoneura fumiferana larvae. Gen. Comp. Endocrinol. 2000, 117, 343–354. [Google Scholar] [CrossRef]
  27. Doucet, D.; Cusson, M. Role of calyx fluid in alterations of immunity in Choristoneura fumiferana larvae parasitized by Tranosema rostrale. Comp. Biochem. Physiol. 1996, 114, 311–317. [Google Scholar] [CrossRef]
  28. Doucet, D.; Cusson, M. Alteration of developmental rate and growth of Choristoneura fumiferana parasitized by Tranosema rostrale: Role of the calyx fluid. Entomol. Exp. Appl. 1996, 81, 21–30. [Google Scholar] [CrossRef]
  29. Djoumad, A.; Dallaire, F.; Lucarotti, C.J.; Cusson, M. Characterization of the polydnaviral TrV gene family: TrV1 expression inhibits in vitro cell proliferation. J. Gen. Virol. 2013, 94, 1134–1144. [Google Scholar] [CrossRef]
  30. Rasoolizadeh, A.; Béliveau, C.; Stewart, D.; Cloutier, C.; Cusson, M. Tranosema rostrale ichnovirus repeat element genes display distinct transcriptional patterns in caterpillar and wasp hosts. J. Gen. Virol. 2009, 90, 1505–1514. [Google Scholar] [CrossRef]
  31. Seehausen, M.L.; Cusson, M.; Régnière, J.; Bory, M.; Stewart, D.; Djoumad, A.; Smith, S.M.; Martel, V. High temperature induces downregulation of polydnavirus gene transcription in lepidopteran host and enhances accumulation of host immunity gene transcripts. J. Insect Physiol. 2017, 98, 126–133. [Google Scholar] [CrossRef] [PubMed]
  32. Roe, A.D.; Demidovich, M.; Dedes, J. Origins and history of laboratory insect stocks in a multispecies insect production facility, with the proposal of standardized nomenclature and designation of formal standard names. J. Insect Sci. 2017, 18, 1. [Google Scholar] [CrossRef] [Green Version]
  33. McMorran, A. A synthetic diet for the spruce budworm Choristoneura fumiferana. Can. Entomol. 1965, 97, 58–62. [Google Scholar] [CrossRef]
  34. Miller, C.A.; Renault, T.R. Notes on the biology of Synetaeris tenuifemur Walley (Hymenoptera: Ichneumonidae). Can. Entomol. 1963, 95, 24–28. [Google Scholar] [CrossRef]
Figure 1. Example of how primers and probes were selected for the development of individual assays making up the molecular sorting tool. Here, the example is given for assay 4-plex 1B, which is aimed at detecting dipteran parasitoids in Module 1. 28S rDNA (region D2) sequences for eight different dipteran species are aligned with several hymenopteran orthologs as well as with the spruce budworm ortholog. Remarkable homogeneity is observed among the dipteran sequences in the regions selected for primer and probe design, while striking differences are seen in the corresponding regions of the hymenopteran and lepidopteran sequences, enabling efficient and selective qPCR amplification and detection of dipteran parasitoids. Alignments used to design primers and probes for the other assays may be found in File S4.
Forests 11 00621 g001
Figure 2. Architecture of the molecular sorting tool. DNA samples are first processed through Module 1 to determine whether the host was correctly identified and to detect the presence of dipteran, hymenopteran, and/or microsporidian DNA in the sample. For the purpose of illustrating the sorting strategy of our tool, the four assays included in Module 1 are here presented as sequentially processed steps; however, all four “questions” answered by this 4-plex assay are addressed simultaneously and can yield parallel positive amplifications (see Figure 3 for an example). Depending on the outcome of Module 1 analysis, the DNA sample can be further processed through Modules 2, 3, and/or 4 to identify the dipteran, hymenopteran, and/or microsporidian species detected, respectively. These modules comprise one (Module 4), two (Module 2), or three (Module 3) multiplex assays (Table 2), altogether enabling the identification of 20 natural enemies of the spruce budworm.
Forests 11 00621 g002
Figure 3. Examples of qPCR-TaqMan® amplification curves (two technical replicates) obtained when conducting analyses using the molecular sorting tool. The first example, on the left, is for a spruce budworm sample that yields positive amplifications for both hymenopteran and microsporidian DNA in Module 1 (and for the spruce budworm; top panel). Then, the DNA sample is further processed through Module 3 to identify the hymenoteran parasitoid (middle panel; Glypta fumiferanae; only the results of assay 4-plex 4 are shown here as assays 4-plex 5 and 3-plex 6 yielded no amplification) and through Module 4 to identify the microsporidian pathogen (bottom panel; Nosema fumiferanae). The second example, on the right, is for a spruce budworm sample that yields a positive amplification for dipteran DNA in Module 1 (top panel). Then, the DNA sample is further processed through Module 2 to identify the dipteran parasitoid (bottom panel; Lypha fumipennis; only the results of assay 3-plex 3 are shown here as assay 3-plex 2 yielded no amplification). The DNA samples used to generate the data presented here are from the field survey whose results are presented in Figure 4.
Forests 11 00621 g003
Figure 4. Results obtained for the detection and identification of spruce budworm natural enemies, comparing the molecular sorting tool with the conventional method, through the processing of two independent sets of samples collected in a fir stand located in the Charlevoix region of Quebec, in 2019. Inasmuch as they are independent, the two sets of samples were not expected to yield identical results, but to generate similar outcomes as they were from the same site/population. Two field collections were conducted during the L3/L4 and L6 stadia, resulting in two instar-specific datasets. Here, to simplify illustration of this comparative analysis, we combined the two instar-specific datasets; instar-specific results may be found in File S6. Please note that microscopic analysis of samples for microsporidian detection was not conducted in 2019. Sample sizes: Module 1, N = 241 (molecular), N = 235 (conventional); Module 2, N = 8 (molecular), N = 5 (conventional); Module 3, N = 55 (molecular), N = 40 (conventional); Module 4, N = 21 (molecular). “Unidentified-i”: unidentified ichneumonid; “Unidentified-b”: unidentified braconid. Only genus names are shown for identifications by Modules 2, 3, and 4; full species names are provided in Table 2 (note that all Apanteles specimens identified by Module 3 were A. fumiferanae).
Forests 11 00621 g004
Table 1. Source [GenBank or “New” (i.e., this work)] and number of 28S rDNA and COI barcode sequences (haplotypes) populating the parasitoid marker database that was used for developing the molecular sorting tool.
Parasitoid TaxonSource and Number of Marker Sequences Used 1
28S rDNACOI
GenBankNewGenBankNew
FrequentDiptera (Sarcophagidae)
Sarcophaga aldrichi6
Diptera (Tachinidae)
Eumea caesar88
Lypha fumipennis313
Phryxe pecosensis87
Smidtia (= Winthemia) fumiferanae77
Actia interrupta102102
Hymenoptera (Braconidae)
Apanteles fumiferanae2222
Meteorus trachynotus612
Hymenoptera (Eulophidae)
Elachertus cacoeciae131
Hymenoptera (Ichneumonidae)
Apechthis ontario2112
Glypta fumiferanae4152515
Itoplectis conquisitor22152
Dirophanes maculicornis151151
Tranosema rostrale272510
Tranosema tenuifemur78
Mesopolobus verditer11131
OccasionalDiptera (Sarcophagidae)
Pseudosarcophaga affinis161
Diptera (Tachinidae)
Madremya saundersii1212
Nemorilla pystes1
Hymenoptera (Braconidae)
Apanteles morrisi15
Apanteles petrovae13
Bassus binominata11
Charmon extensor41
Dolichogenidea absona2222
Macrocentrus fumiferanae64
Hymenoptera (Ichneumonidae)
Enytus montanus52
Exochus nigripalpis211
Less commonHymenoptera (Braconidae)
Apanteles milleri11
Hymenoptera (Ichneumonidae)
Acropimpla sp.11
Agrypon prismaticum22
Campoplex spp.11
Gelis spp.22202
Parania geniculata22
Phytodietus spp.252
Scambus sp.22
Stictopisthus flaviceps11
1 Actual barcodes and GenBank accession numbers are provided in File S1.
Table 2. List of individual assays built into the molecular sorting tool, including assay codes, targeted species, probe fluorophores, markers, and amplicon positions within markers. There are 24 assays run in 3-plex or 4-plex mode, in seven distinct tubes.
Target GroupFamilyAssay Code 1Assay NameFluorophorePosition 2
LepidopteraTortricidae4-plex 1ASBW COITexas Red273-400
DipteraNot applicable4-plex 1BDiptera GEN 28SCy5 Tao8-119
HymenopteraNot applicable4-plex 1CHymenoptera GEN 28SFAM LNA96-273
MicrosporidiaNot applicable4-plex 1DMicrosporidia SSU rDNAHEX Zen706-94
DipteraSarcophagidae3-plex 2ASarcophaga aldrichi COICy5 Tao432-560
DipteraTachinidae3-plex 2BPhryxe pecosensis COIFAM LNA295-380
DipteraTachinidae3-plex 2CEumea caesar 28SHEX LNA195-362
DipteraTachinidae3-plex 3ASmidtia fumiferanae COIHEX ZEN526-672
DipteraTachinidae3-plex 3BLypha fumipennis 28SFAM LNA107-285
DipteraTachnidae3-plex 3CActia interrupta COICy5 Tao344-489
HymenopteraBraconidae4-plex 4AApanteles sp. 28SHEX LNA143-303
HymenopteraBraconidae4-plex 4BApanteles fumiferanae COICy5 LNA242-364
HymenopteraIchneumonidae4-plex 4CGlypta fumiferanae 28STexas Red141-313
HymenopteraIchneumonidae4-plex 4DTranosema rostrale COIFAM Zen365-511
HymenopteraIchneumonidae4-plex 5AItoplectis conquisitor COITexas Red31-218
HymenopteraPteromalidae4-plex 5BMesopolobus verditer COICy5 Tao245-373
HymenopteraIchneumonidae4-plex 5CApechthis ontario COIHEX Zen381-561
HymenopteraIchneumonidae4-plex 5DTranosema tenuifemur 28SFAM LNA99-215
HymenopteraBraconidae3-plex 6AMeteorus trachynotus 28SCy5 Tao162-243
HymenopteraEulophidae3-plex 6BElachertus cacoeciae COIHEX Zen287-432
HymenopteraIchneumonidae3-plex 6CDirophanes hariolus COIFAM LNA463-552
MicrosporidiaNosematidae3-plex 7ANosema SSU rDNAFAM Zen805-940
MicrosporidiaNosematidae3-plex 7BVairimorpha SSU rDNACy5 Tao247-353
MicrosporidiaGlugeidae3-plex 7CCystosporogenes SSU rDNAHEX Zen78-201
1 Shading provided to help distinguish the 7 multiplex assays. 2 Nucleotide position of the amplified region within the marker.
Table 3. Ct values obtained for each of the 24 individual assays that make up the molecular sorting tool, using gBlocks® positive controls.
AssayAmplicon LengthCt Value @ 10 fgTest Species Used 1
SBW COI128bp20.10
Hymenoptera GEN 28S178bp20.86Apanteles fumiferanae
Diptera GEN 28S112bp22.66Lypha fumipennis
Microsporidia SSU rDNA89bp21.82Nosema fumiferanae
Sarcophaga aldrichi COI128bp21.48
Phryxe pecosensis COI110bp20.58
Eumea caesar 28S168bp20.23
Smidtia fumiferanae COI121bp20.42
Lypha fumipennis 28S177bp20.91
Actia interrupta COI146bp22.96
Apanteles sp 28S161bp20.56
Apanteles fumiferanae COI123bp23.41
Glypta fumiferanae 28S173bp20.58
Tranosema rostrale COI157bp22.35
Itoplectis conquisitor COI188bp21.66
Mesopolobus verditer COI129bp20.18
Apechthis ontario COI181bp21.03
Tranosema tenuifemur 28S106bp20.80
Meteorus trachynotus 28S78bp20.36
Elachertus cacoeciae COI146bp24.38
Dirophanes hariolus COI90bp20.12
Nosema SSU rDNA136bp20.58
Vairimorpha SSU rDNA107bp21.14
Cystosporogenes SSU rDNA124bp20.51
1 Species that were chosen for testing Module-1 supra-specific assays.
Table 4. Validation assays for Module 1 of the molecular sorting tool, using ca. 100 copies of the 28S rDNA gene (purified DNA or crude lysates), tested in 1-plex and 4-plex formats, as well as in 4-plex format spiked with spruce budworm (SBW) DNA (10 fg).
Target GroupSample SpeciesHym 28S
1-plex
Hym 28S
4-plex
Hym 28S
4-plex + SBW
Dipt 28S
1-plex
Dipt 28S
4-plex
Dipt 28S
4-plex + SBW
SBW COI
4-plex + SBW
Microspo
1-plex
Microspo
4-plex + SBW
DipteraSarcophaga aldrichi 1--------No Ct
DipteraPhryxe pecosensis-No CtNo Ct27.1226.7626.7620.52-No Ct
DipteraEumea caesar 2-No CtNo Ct28.3327.6027.7920.05-No Ct
DipteraSmidtia fumiferanae-No CtNo Ct27.5627.2827.2020.59-No Ct
DipteraLypha fumipennis-No CtNo Ct28.6428.2428.3520.58-No Ct
DipteraActia interrupta-No CtNo Ct27.1626.6826.6520.46-No Ct
DipteraAgria affinis 3--No Ct--27.8620.47-No Ct
DipteraMadremya saundersii--No Ct--28.9620.46-No Ct
HymenopteraApanteles fumiferanae228.4827.9128.24-No CtNo Ct20.51-No Ct
HymenopteraGlypta fumiferanae27.0926.4827.02-No CtNo Ct20.63-No Ct
HymenopteraTranosema rostrales28.5627.8728.41-No CtNo Ct20.43-No Ct
HymenopteraItoplectis conquisitor28.3427.6528.20-No CtNo Ct20.55-No Ct
HymenopteraMesopolobus verditer28.8728.1628.80-No CtNo Ct20.44-No Ct
HymenopteraApechthis ontario27.6326.9327.77-No CtNo Ct20.46-No Ct
HymenopteraTranosema tenuifemur 227.7627.4927.47-No CtNo Ct20.10-No Ct
HymenopteraMeteorus trachynotus26.8526.5426.80-No CtNo Ct20.54-No Ct
HymenopteraElachertus cacoeciae29.9528.8529.28-No CtNo Ct20.63-No Ct
HymenopteraDirophanes hariolus28.6927.9528.23-No CtNo Ct20.38-No Ct
HymenopteraAcropimpla sp.--27.56--No Ct20.30-No Ct
HymenopteraAgrypon sp.--30.12--No Ct20.54-No Ct
HymenopteraCampoplex sp.--29.06--No Ct20.53-No Ct
HymenopteraDolochogenidae absona--28.24--No Ct20.30-No Ct
HymenopteraEnytus montanus--28.07--No Ct20.38-No Ct
HymenopteraExochus nigripalpis--28.17--No Ct20.56-No Ct
HymenopteraParania geniculata--27.12--No Ct20.34-No Ct
HymenopteraPhytodietus sp.--29.40--No Ct20.45-No Ct
MicrosporidiaNosema fumiferanae4--No Ct--No Ct20.2327.5527.13
MicrosporidiaVairimorpha sp. 4--No Ct--No Ct20.0628.7328.49
MicrosporidiaCystosporogenes sp. 4--No Ct--No Ct20.3928.1927.99
LepidopteraChoristoneura fumiferana 2No CtNo CtNo CtNo CtNo CtNo Ct20.64No CtNo Ct
1 No purified DNA or crude lysate available; used gBlocks COI DNA instead, which will not give a positive amplification in the Dipteran 28S assay. 2 No purified DNA available; used crude lysates of SBW larvae for which parasitoid species had been identified beforehand, as required. 3 Species whose names are shown in red characters are not among the “frequent” parasitoid species targeted by the molecular sorting tool and were therefore only tested in 4-plex + SBW format. 4 Used plasmid constructs containing the targeted SSU rDNA regions for each species.
Table 5. Validation assays for Modules 2 to 4 of the molecular sorting tool, using purified DNA or crude lysates, tested in simplex and multiplex formats, as well as in multiplex format spiked with spruce budworm (SBW) DNA (10 fg). Prior to conducting these tests, ca. 100 copies of the 28S rDNA gene were processed through Module 1; the same quantity of DNA was used for processing in the other three modules.
ModuleAssayCt Value
Simplex
Ct Value
Multiplex
Ct Value
Multiplex + SBW
2Sarcophaga aldrichi COI 127.6827.9828.51
Phryxe pecosensis COI28.5628.5028.45
Eumea caesar 28S 226.1826.5626.44
Smidtia fumiferanae COI33.2533.6033.33
Lypha fumipennis 28S30.4730.1030.30
Actia interrupta COI29.0929.2129.15
3Apanteles sp. 28S 229.0228.6529.14
Apanteles fumiferanae COI 230.4531.3030.53
Glypta fumiferanae 28S29.0428.5628.01
Tranosema rostrale COI31.0531.3331.05
Itoplectis conquisitor COI32.6532.5231.92
Mesopolobus verditer COI31.6731.1532.10
Apechthis ontario COI32.3231.3831.13
Tranosema tenuifemur 28S 228.3328.2028.23
Meteorus trachynotus 28S28.6028.4628.53
Elachertus cacoeciae COI31.6531.7331.84
Dirophanes hariolus COI29.9030.1430.64
4Nosema SSU rDNA 326.4826.4326.81
Vairimorpha SSU rDNA 328.7828.6228.84
Cystosporogenes SSU rDNA 327.6627.7127.62
1 Used gBlocks COI DNA. 2 Used crude lysates of SBW larvae for which parasitoid species had been identified beforehand. 3 Used plasmid constructs containing the targeted SSU rDNA region for each species.
Table 6. Proportion of Tranosema rostrale eggs/larvae detected using the Module 1 assay, 0, 1, 2, and 5 days after oviposition into a Choristoneura fumiferana newly molted 4th instar larva.
Days After OvipositionProportion Detected
00/8
17/8
26/8
56/8

