National Set of MAES Indicators in Greece: Ecosystem Services and Management Implications

 ,
,  ,
,  , , and
Abstract
1. Introduction
2. Materials and Methods
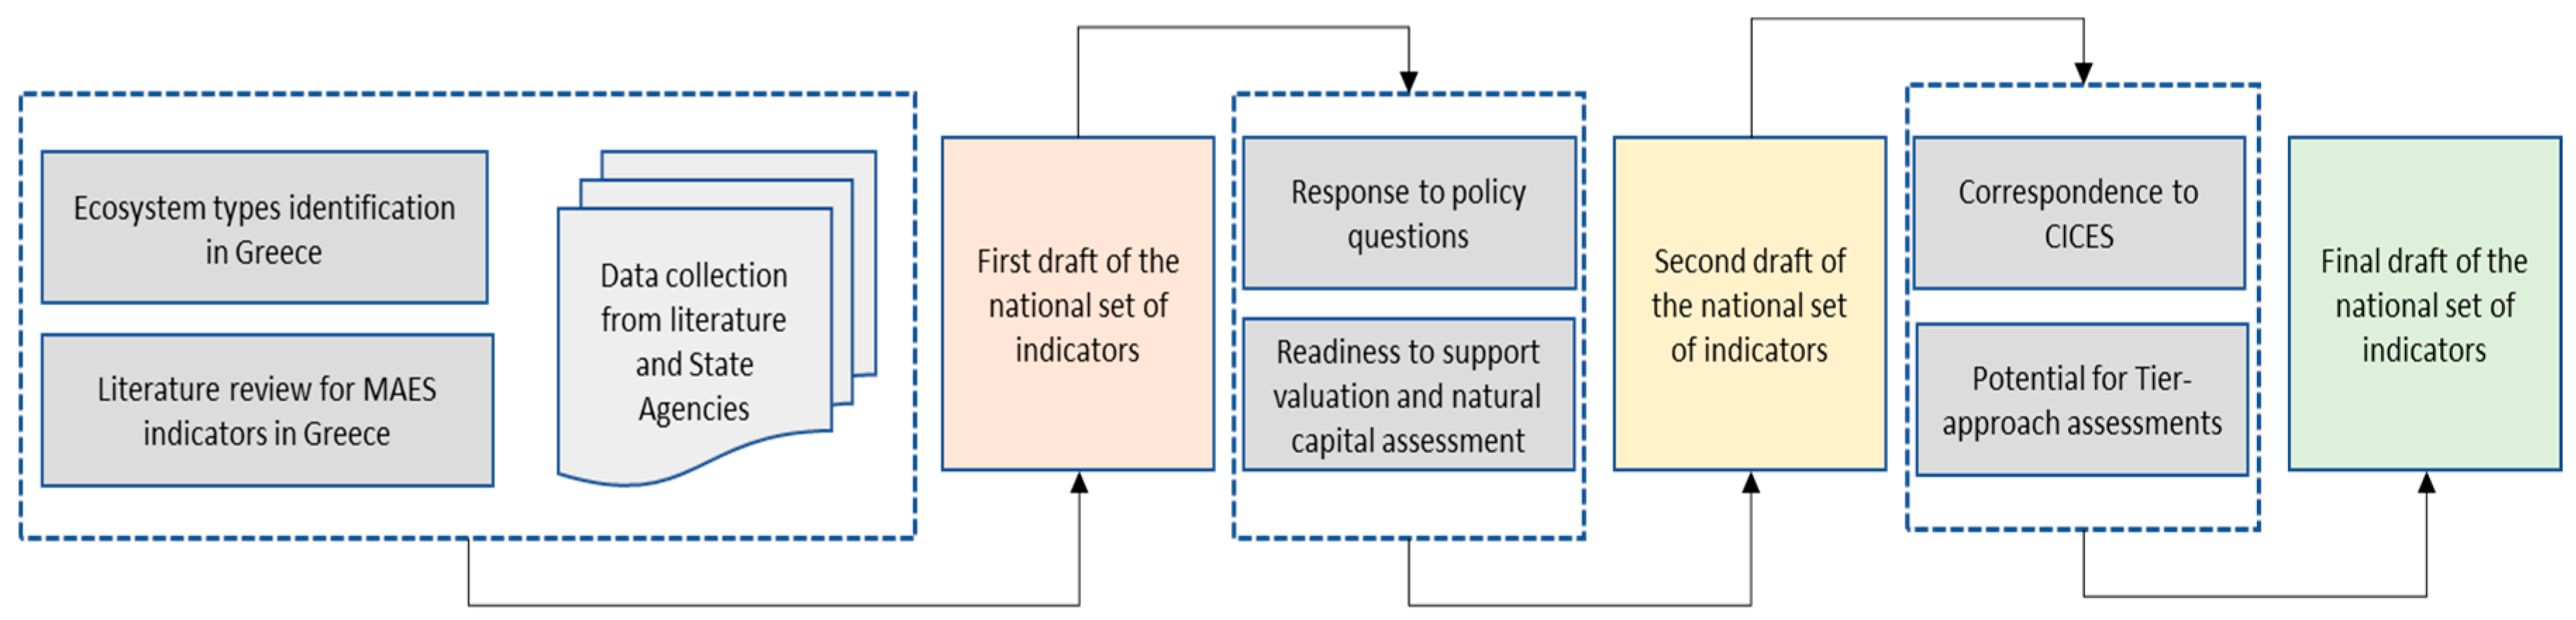
2.1. Preparatory Actions
- Identification of ecosystem types (terrestrial): using the Ecosystem type map of Europe [48], the Corine Land Cover dataset [49], the Natura 2000 Standard Data Forms and monitoring results [50,51] and spatial data for habitat types [52], and following the European Environment Agency (EEA) guidelines [53] and recent survey results [42,43], we have identified and classified the ecosystem types present in the Greek territory; a detailed ecosystem type mapping for Greece, i.e., MAES level 3 (sub-categories of MAES level 2 [2] ecosystem types in Greece) is an ongoing procedure of the LIFE-IP 4 NATURA project, summarized in Section 2.2.
- Literature review for ES indicators in Greece: we reviewed the provided list of primary and secondary ES indicators used for the site-level assessment of ES supply at mountainous Natura 2000 sites in Greece [42]. The overview on ecosystem condition indicators was based on the EU ecosystem condition assessment framework [38] and recent work for Greece [43].
- Exploration of data availability and quality: to identify and select possible indicators for (a) mapping and assessing ecosystem condition and ES, and (b) establishing a national set of indicators for future MAES studies, we revised and assessed (regarding their thematic detail and spatial scale) all available datasets for terrestrial ecosystems (based on the review by Dimopoulos et al. [34] and on datasets freely available by state authorities (Supplementary Table S1)), updated by the input of recent datasets and information from the relevant national and regional offices/authorities, after an official request by the Hellenic Ministry of Environment and Energy (leader of the LIFE-IP 4 Natura project).
- Response to policy needs: using the guidance provided by Maes et al. [2,38] and in combination with the targets of (a) the EU Green Deal [54], (b) the Greek Biodiversity Strategy [55], (c) the Forest Strategy, (d) the Regional Policy, (e) the Agricultural Policy, (f) the Climate Policy and (g) the Water Policy, each indicator was evaluated and assigned with a “1” (yes) or “0” (no) mark regarding its direct relation with the above-mentioned strategies and policies.
- Supporting valuation and NC assessments: using a simple scaling method, experts from the LIFE-IP 4 NATURA consortium rated each indicator’s dataset for its ability to support valuation and NC studies (i.e., 0—not relevant, 1—very low, 2—low, 3—medium, 4—high, 5—ready for use). This allowed the co-authors to decide on final indicators and to explore the uncertainty, data availability and applicability.
2.2. Drafting the National Set of Indicators
Development and Implementation of Indicators’ Protocols
- Development of the indicator protocol fields: (i) Indicator name (name of the index for national use), (ii) Definition (summary definition of the index), (iii) Description (summary description of the index), (iv) Application (for ES and/or EC assessments), (v) Use and interpretation (local, regional, national), (vi) Measurement units (e.g., m3/ha), (vii) Data source (e.g., Ministry of Environment and Energy), (viii) Calculation method (detailed description of the method used to calculate the index).
- Implementation of the indicator protocol fields: (i) Indicator name (name of the index for national use), (ii) Responsible, coordinating authority for the implementation (authority/organization, etc., and person responsible for indicator calculation and communication), (iii) Use and interpretation (includes: key questions to which the indicator responds, (iv) Users of the indicator, (v) Appropriate scale for the implementation, (vi) Potential for aggregation (interpretation of increasing or decreasing trends, possible causes for these trends), (vii) Impact of indicator alterations/change to management, (viii) Measurement unit, (ix) Data source, (x) Calculation method, (xi) Presentation of the index (maps, graphs, tables, etc., appropriate for communication purposes), (xii) Limitations of index utility and accuracy, (xiii) Update/revision of the index (frequency and procedure), (xiv) Relative indicators (report relevant indices if available), (xv) Additional information and comments (free text).
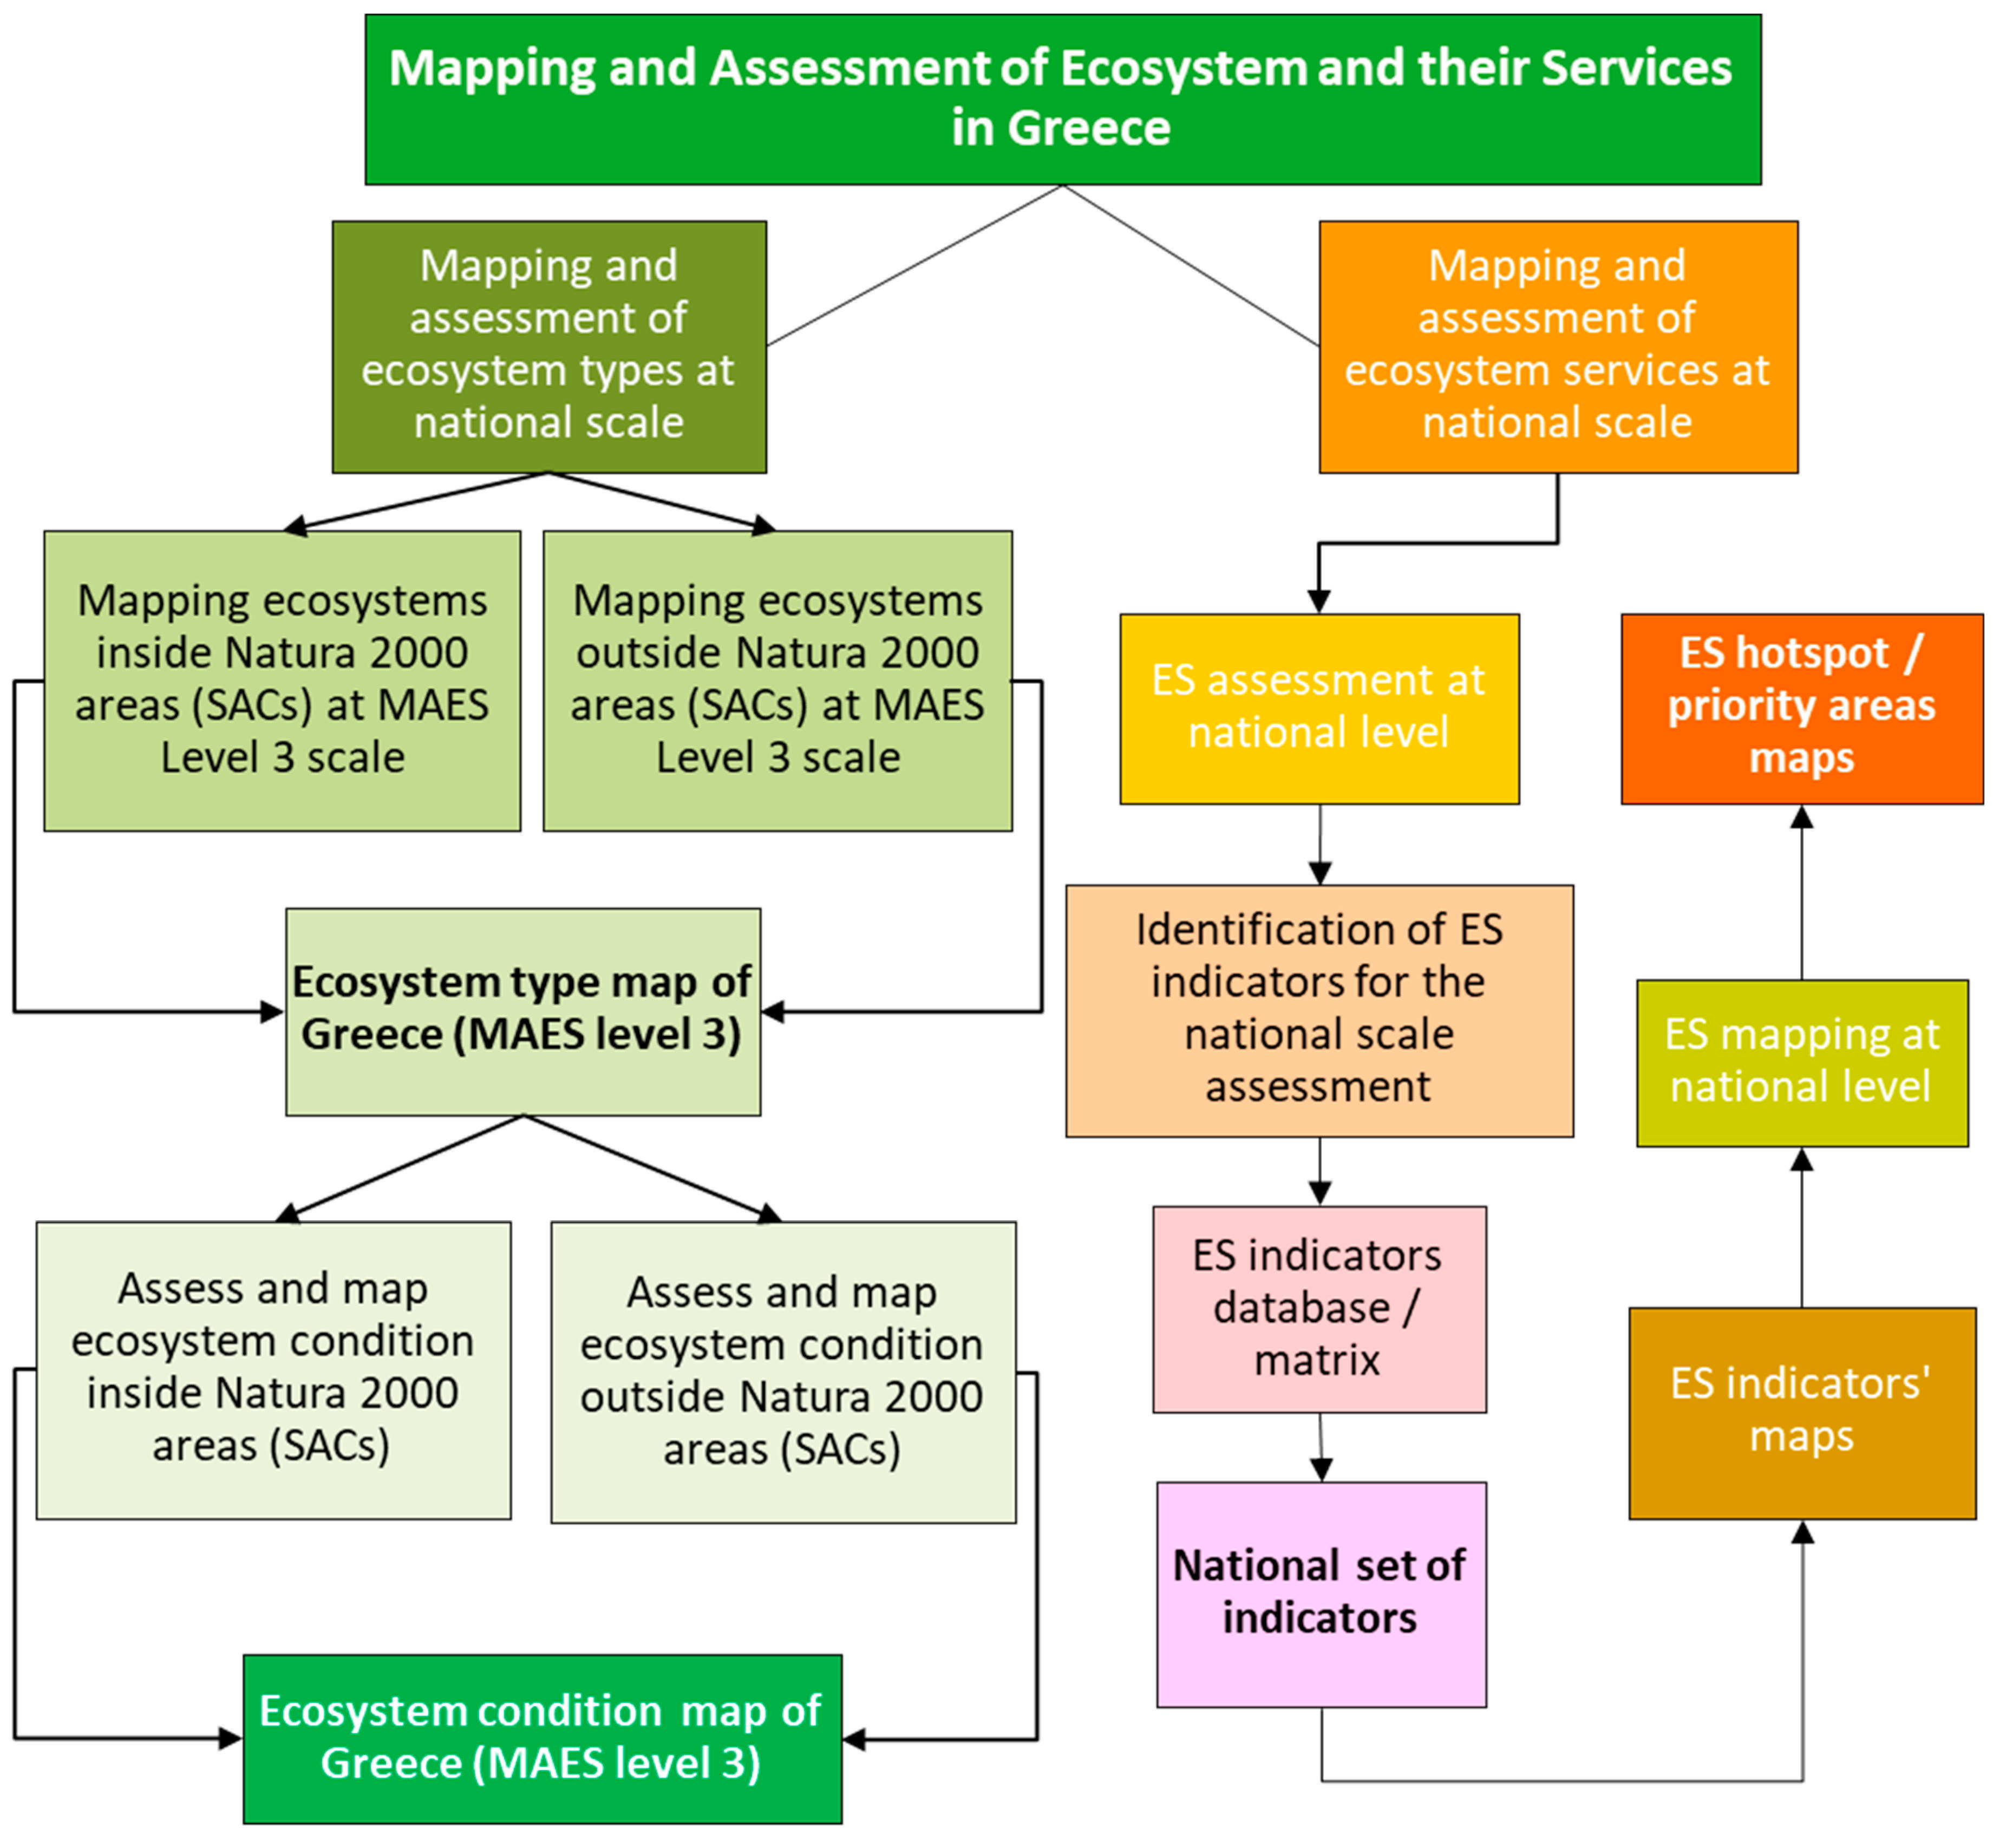
2.3. Thematic Maps
2.3.1. ES Indicators Bundles
2.3.2. ES Hotspots
2.3.3. Compliance with the MAES Indicator Framework
2.3.4. Data Gaps
2.3.5. Relevance to Policies
3. Results
3.1. Classification Scheme of Terrestrial Ecosystem Types in Greece
- Grassland: 13 habitat types in Natural grasslands.
- Woodland and forest: (i) seven habitat types in Temperate deciduous forests, (ii) seven habitat types in Mediterranean deciduous forests, (iii) five habitat types in Floodplain forests (Riparian forest/Fluvial forest), (iv) six habitat types in Temperate mountainous coniferous forests, (v) four habitat types in Mediterranean coniferous forests, (vi) four habitat types in Mediterranean sclerophyllous forests and (vii) one habitat type in Mixed Forest.
- Heathland and shrub: (i) five habitat types in Moors and heathland and (ii) 10 habitat types in Sclerophyllous vegetation.
- Sparsely vegetated land: (i) 11 habitat types in Sparsely vegetated areas and (ii) eight habitat types in Beaches, dunes, sands.
- Wetlands: (i) three habitat types in Inland freshwater marshes, (ii) six habitat types in Inland saline marshes, (iii) four habitat types in Peat bogs and (iv) eight habitat types in Marine wetlands.
- Rivers and lakes: (i) five habitat types in Rivers and (ii) four habitat types in Lakes.
3.2. Indicators for ES and EC Assessments
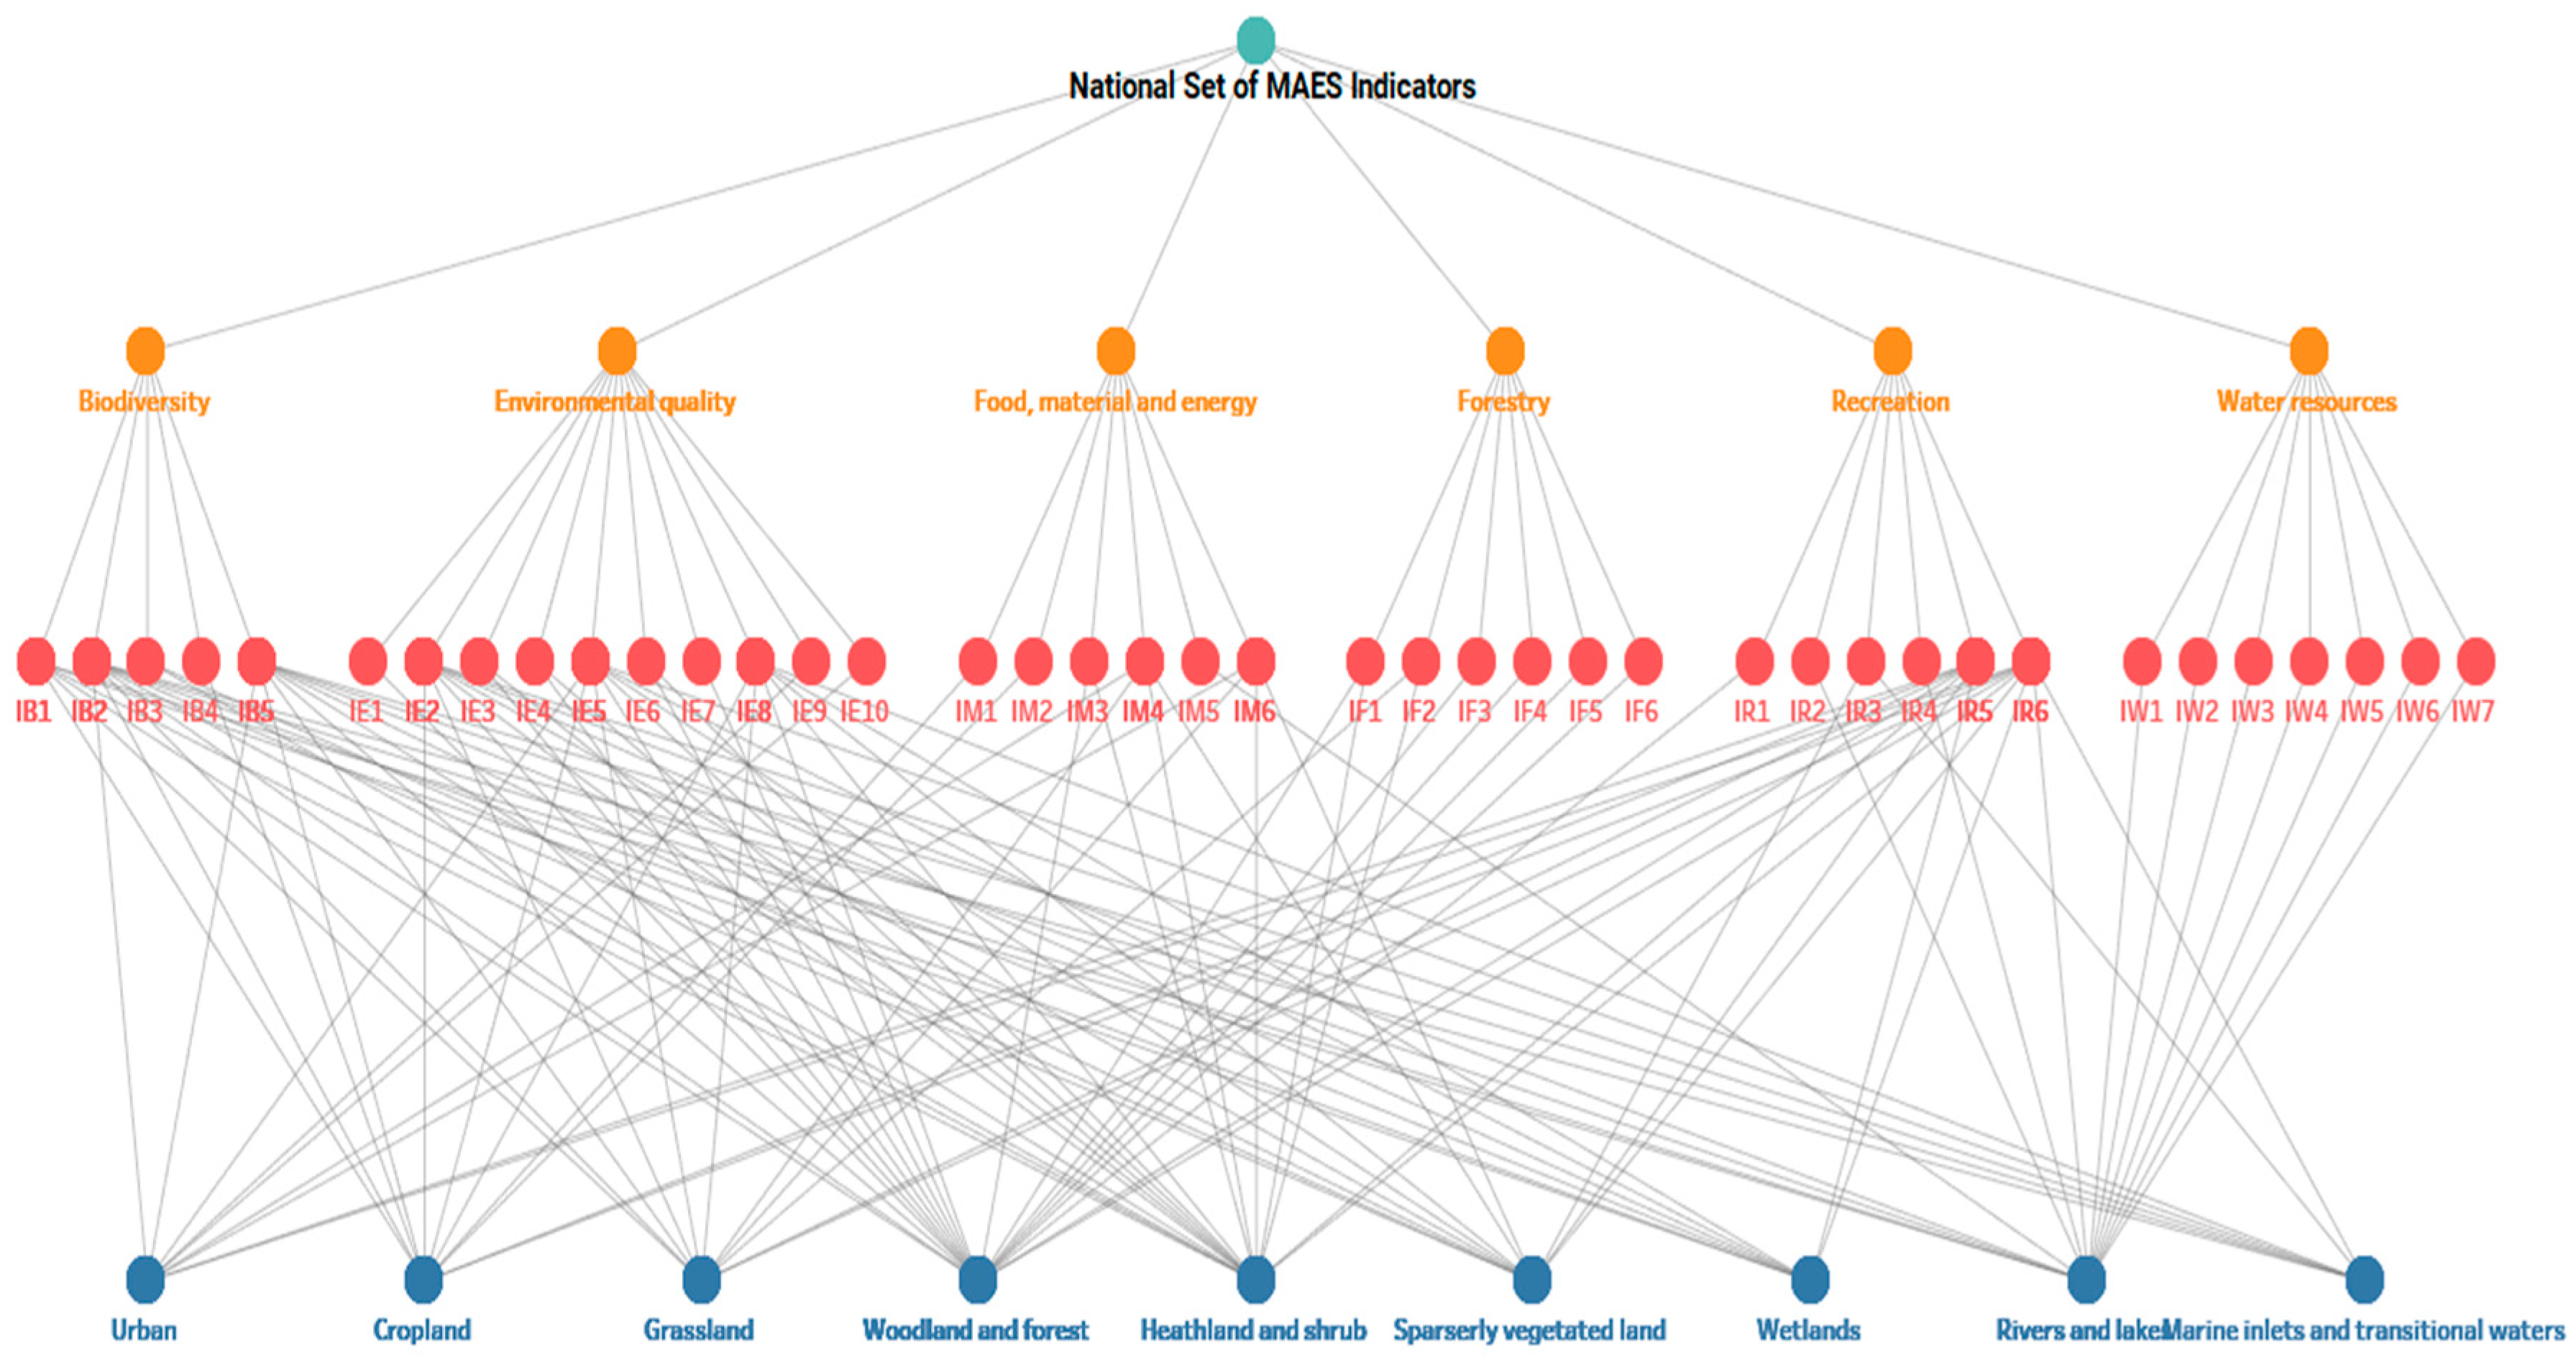
3.2.1. Selection of Indicators
- Provisioning services: 15 indicators, corresponding to 10 CICES codes.
- Regulating and maintenance services: 18 indicators, corresponding to 22 CICES codes.
- Cultural services: 6 indicators, corresponding to 3 CICES codes.
- Urban: 9 indicators (two from Biodiversity, three from Environmental quality, two from Food, material and energy and two from Recreation).
- Cropland: 11 indicators (four from Biodiversity, three from Environmental quality, two from Food, material and energy and two from Recreation).
- Grassland: 11 indicators (three from Biodiversity, three from Environmental quality, two from Food, material and energy, one from Forestry and two from Recreation).
- Woodland and forest: 20 indicators (three from Biodiversity, eight from Environmental quality, one from Food, material and energy, five from forestry and three from Recreation).
- Heathland and shrub: 17 indicators (four from Biodiversity, six from Environmental quality, three from Food, material and energy, two from forestry and two from Recreation).
- Sparsely vegetated land: 11 indicators (three from Biodiversity, three from Environmental quality, two from Food, material and energy, five from forestry and three from Recreation).
- Wetlands: 8 indicators (three from Biodiversity, three from Environmental quality and two from Recreation).
- Rivers and lakes: 15 indicators (three from Biodiversity, one from Environmental quality, one from Food, material and energy, three from Recreation and seven from Water resources).
- Marine inlets and transitional waters: 7 indicators (two from Biodiversity, three from Environmental quality and two from recreation).
3.2.2. Data Quality and Suitability for Tiers
3.2.3. Indicator Development and Implementation
3.3. Thematic Mapping
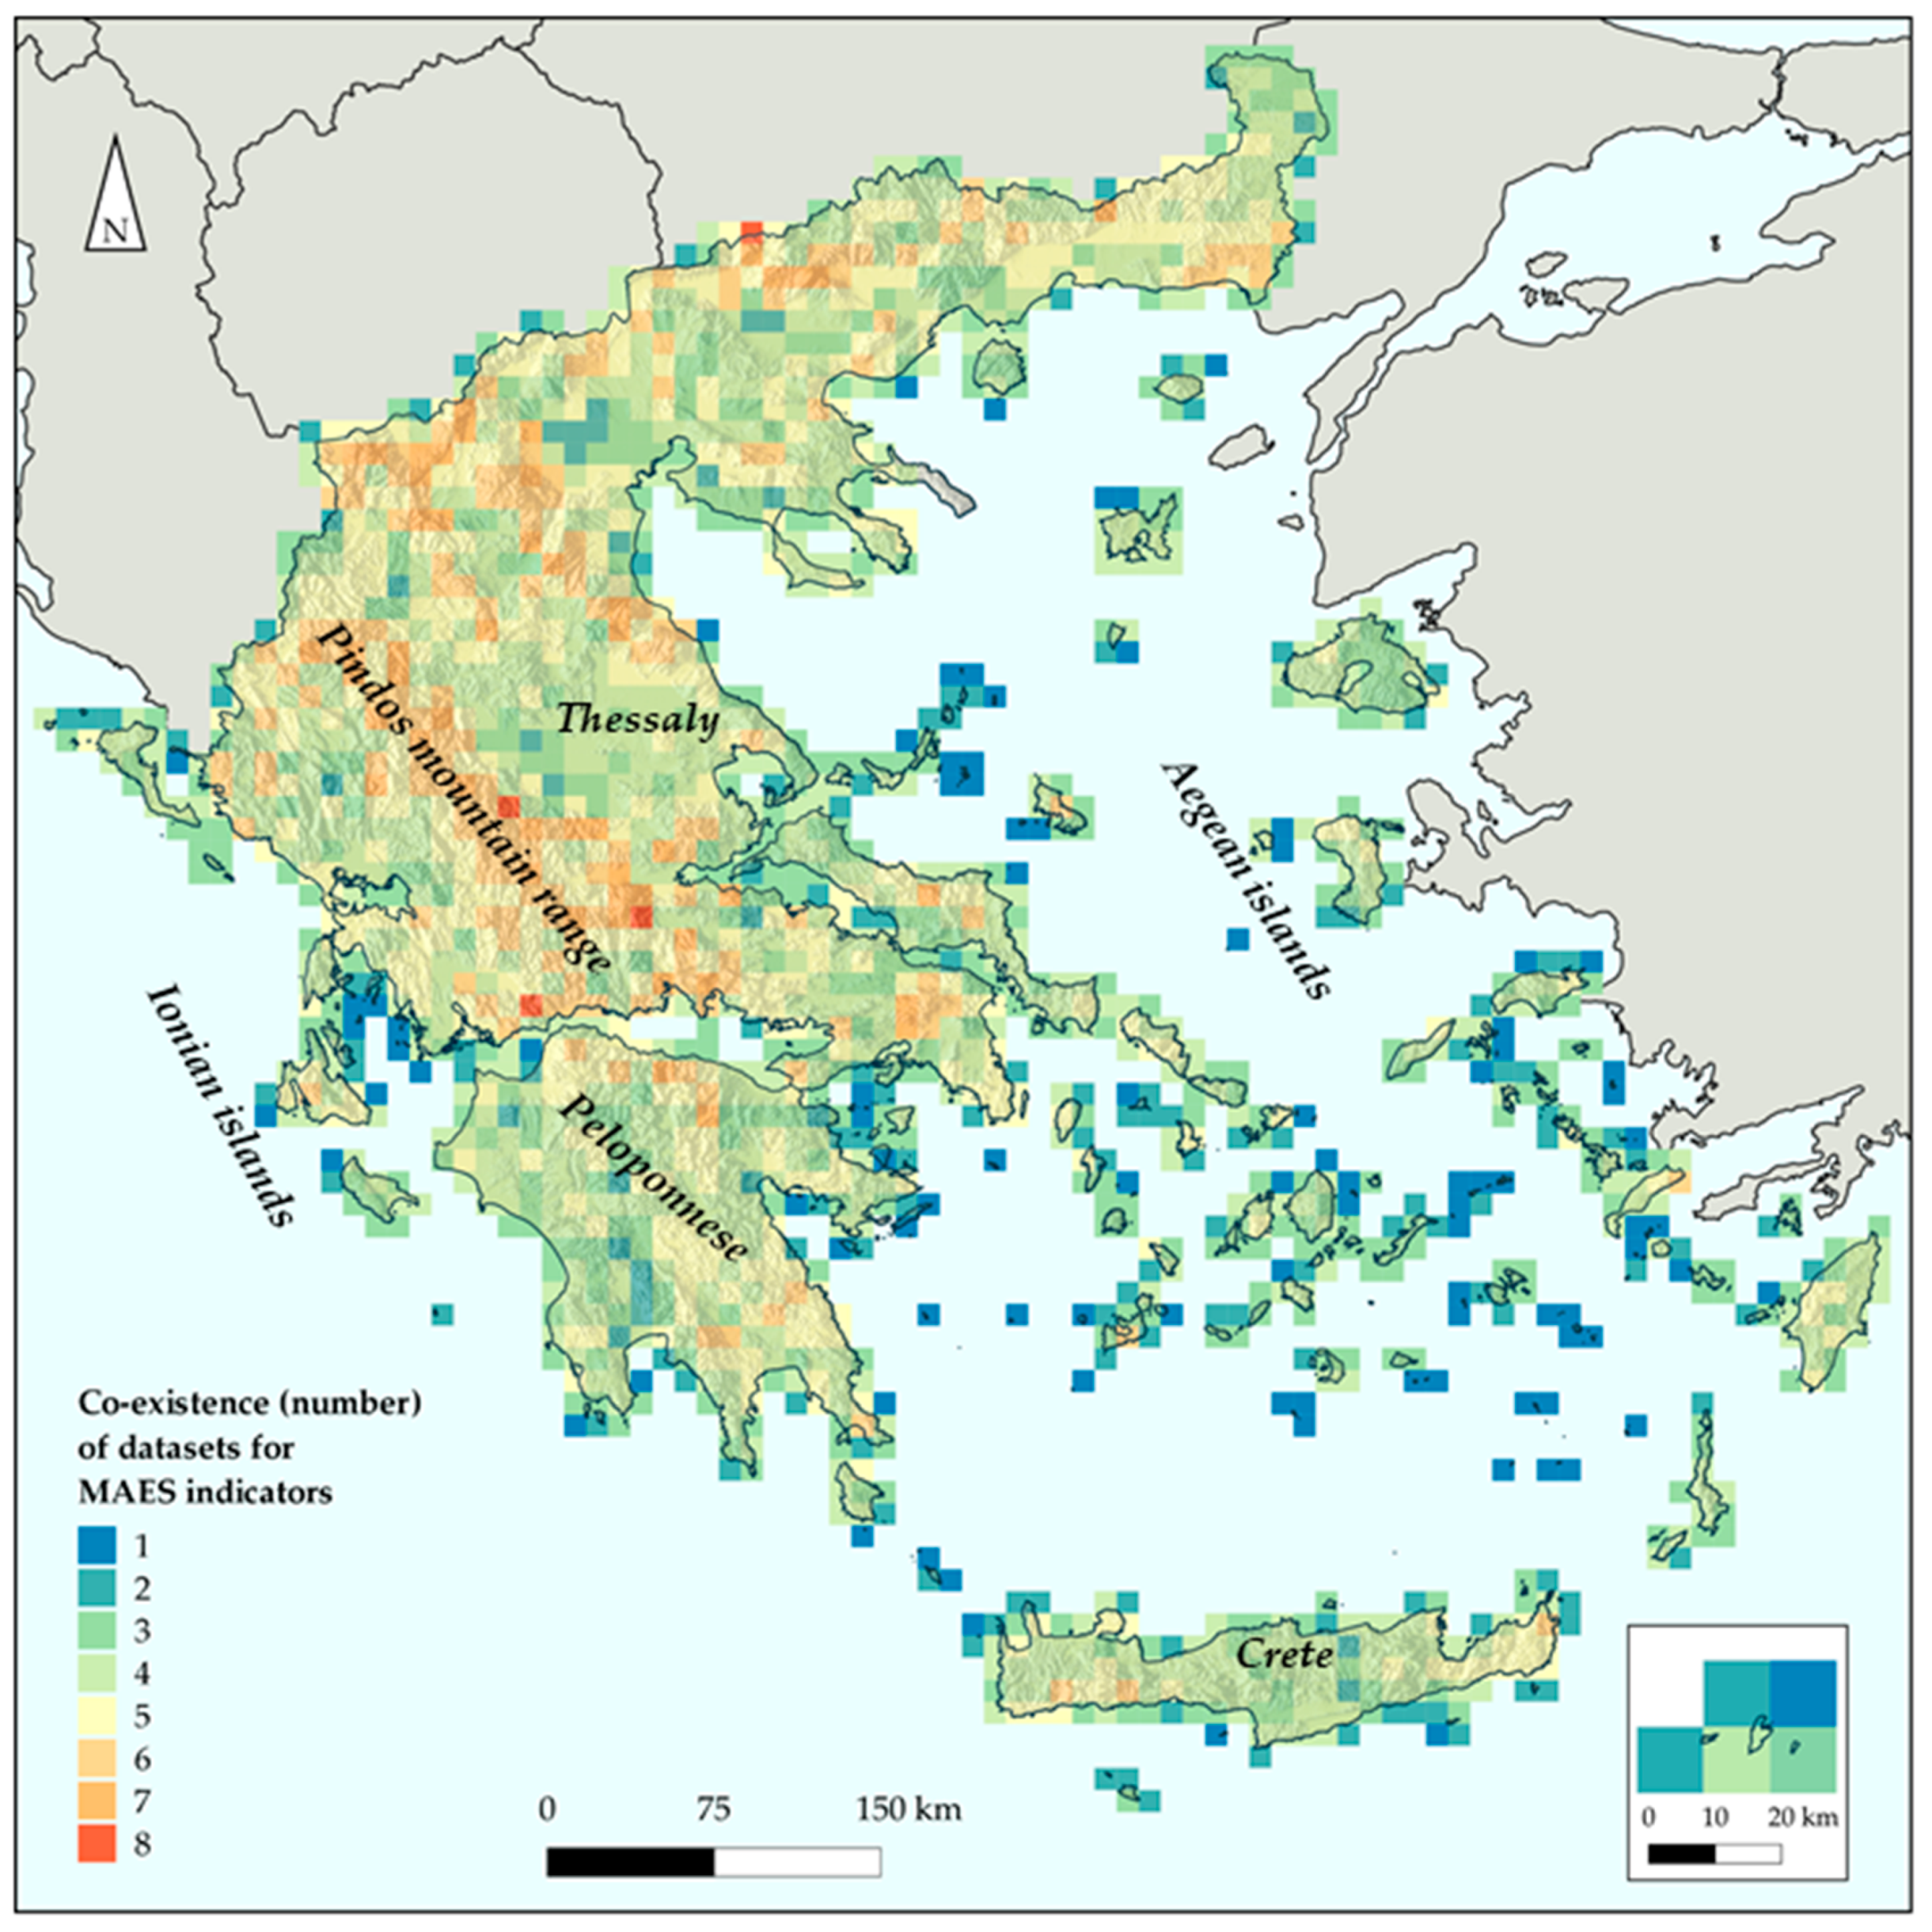
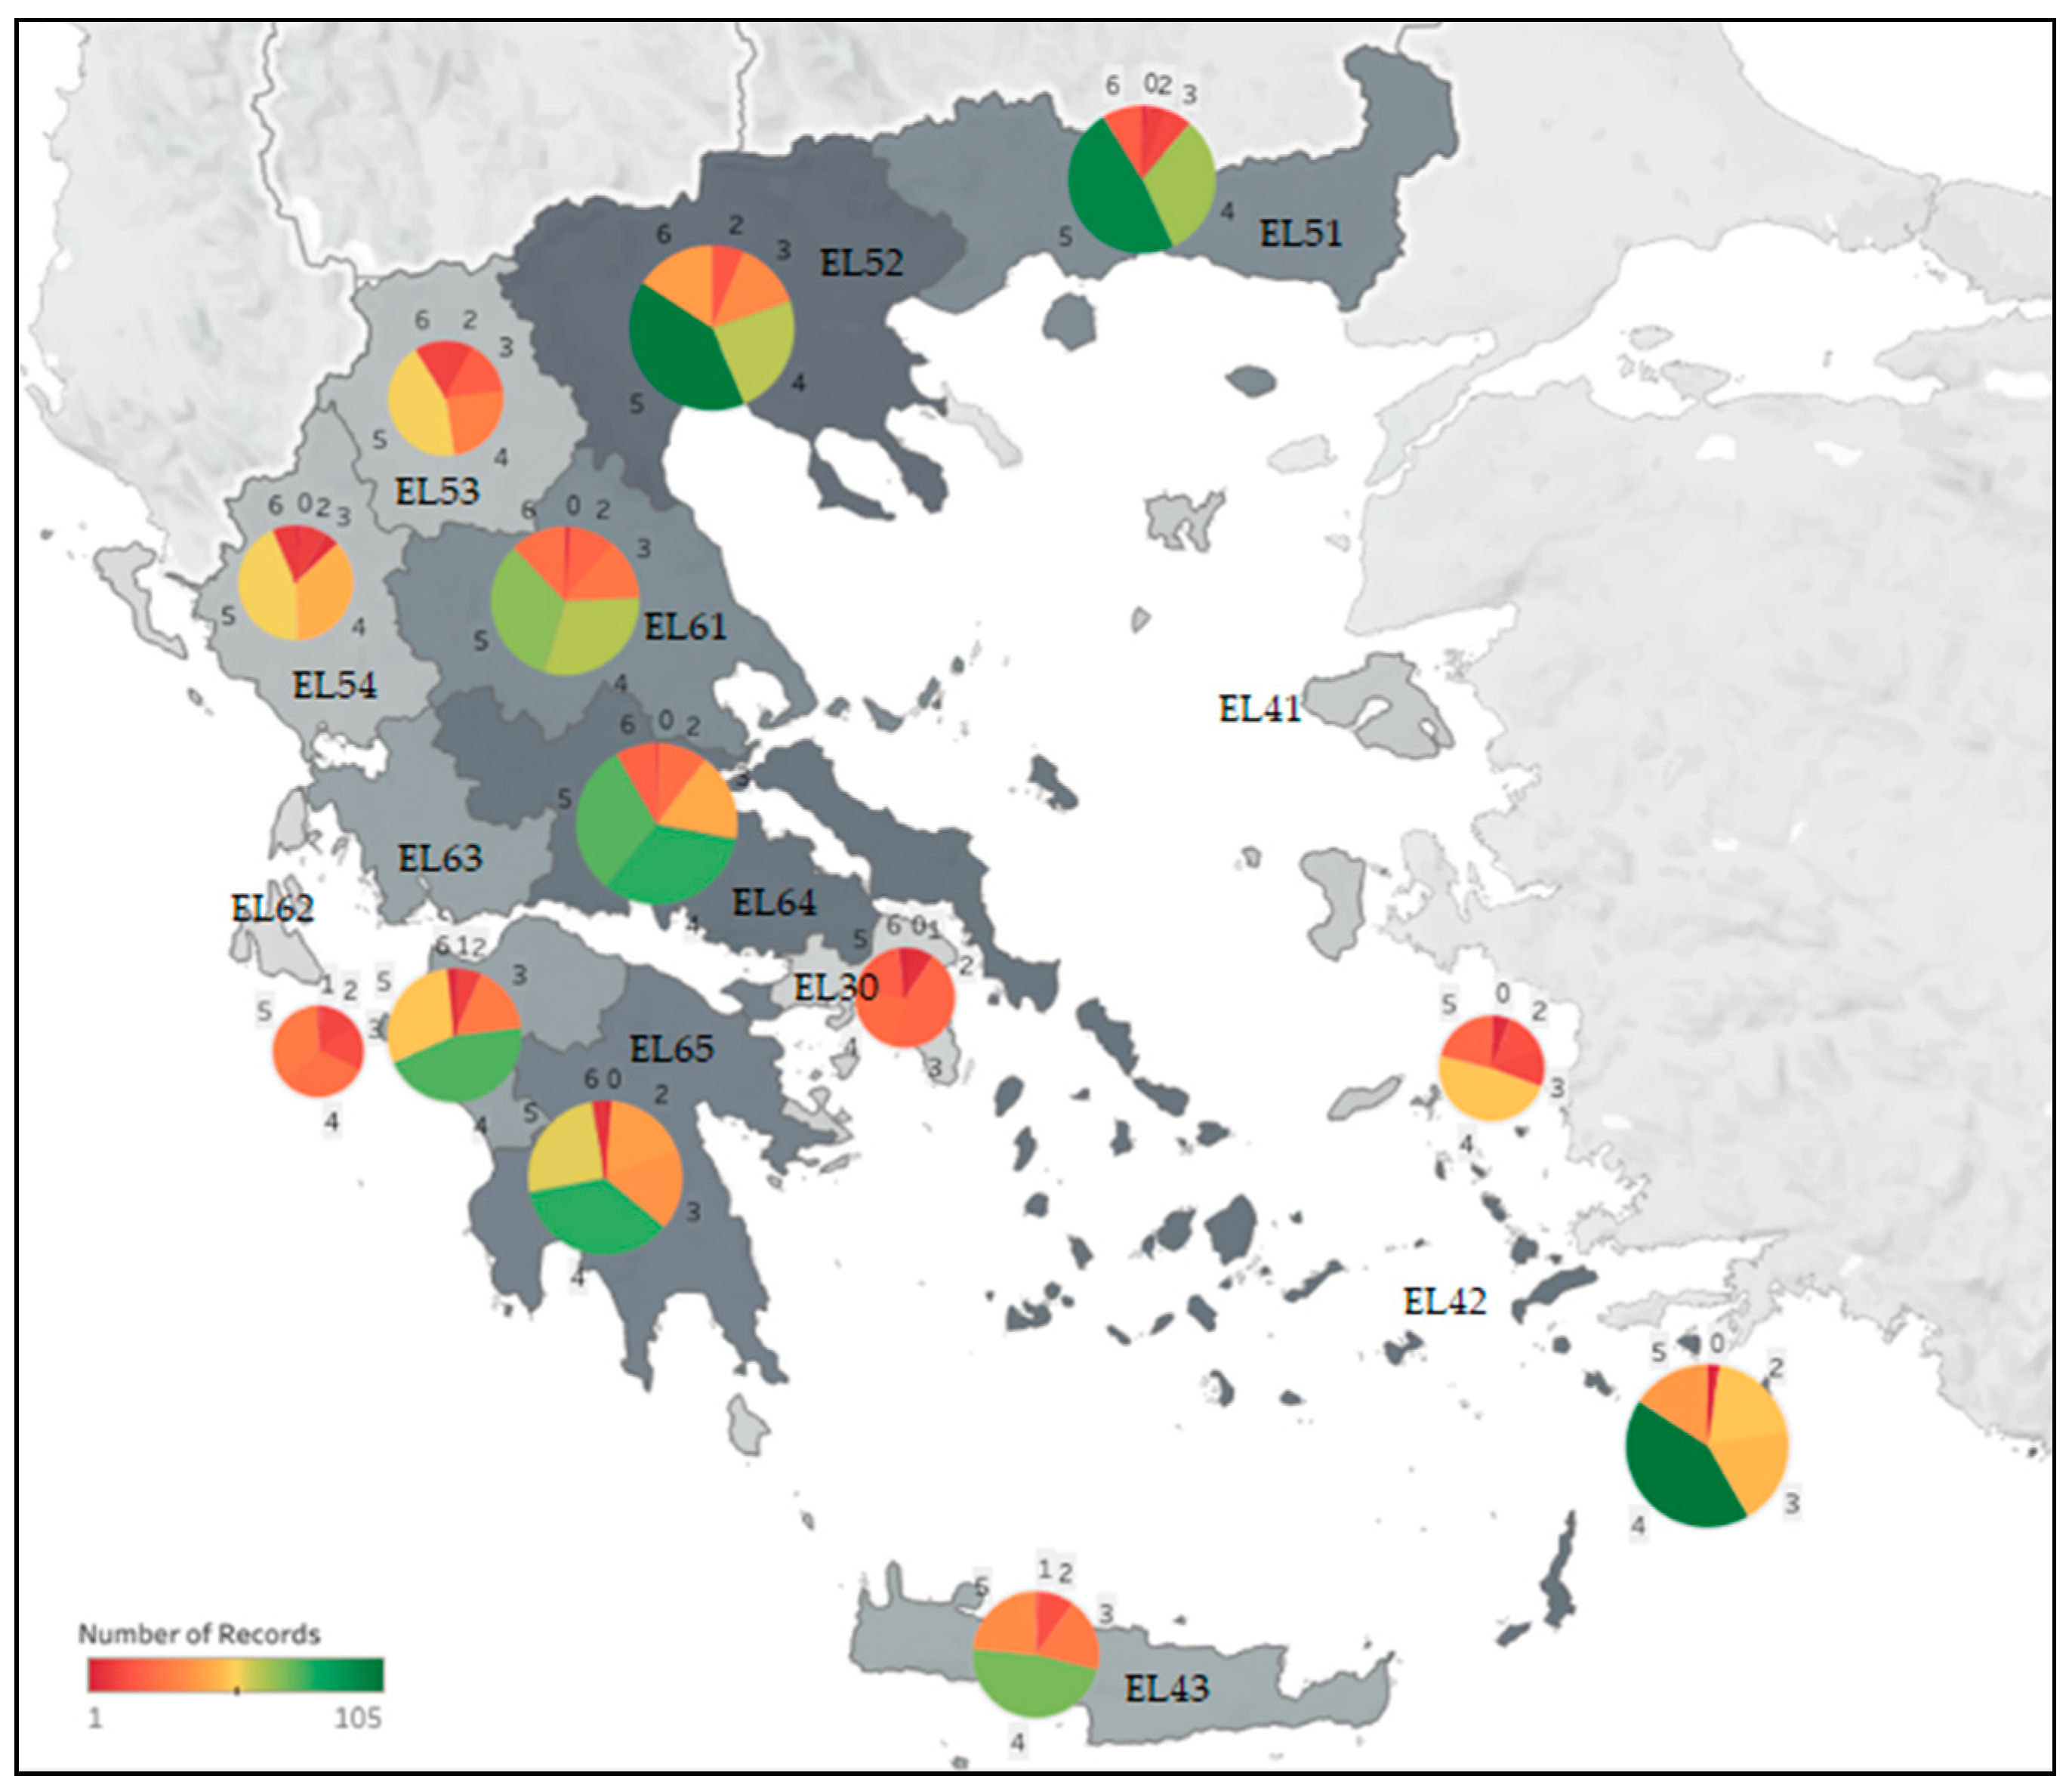
3.3.1. MAES-Related Dataset Availability and Potential ES Bundles and Hotspots
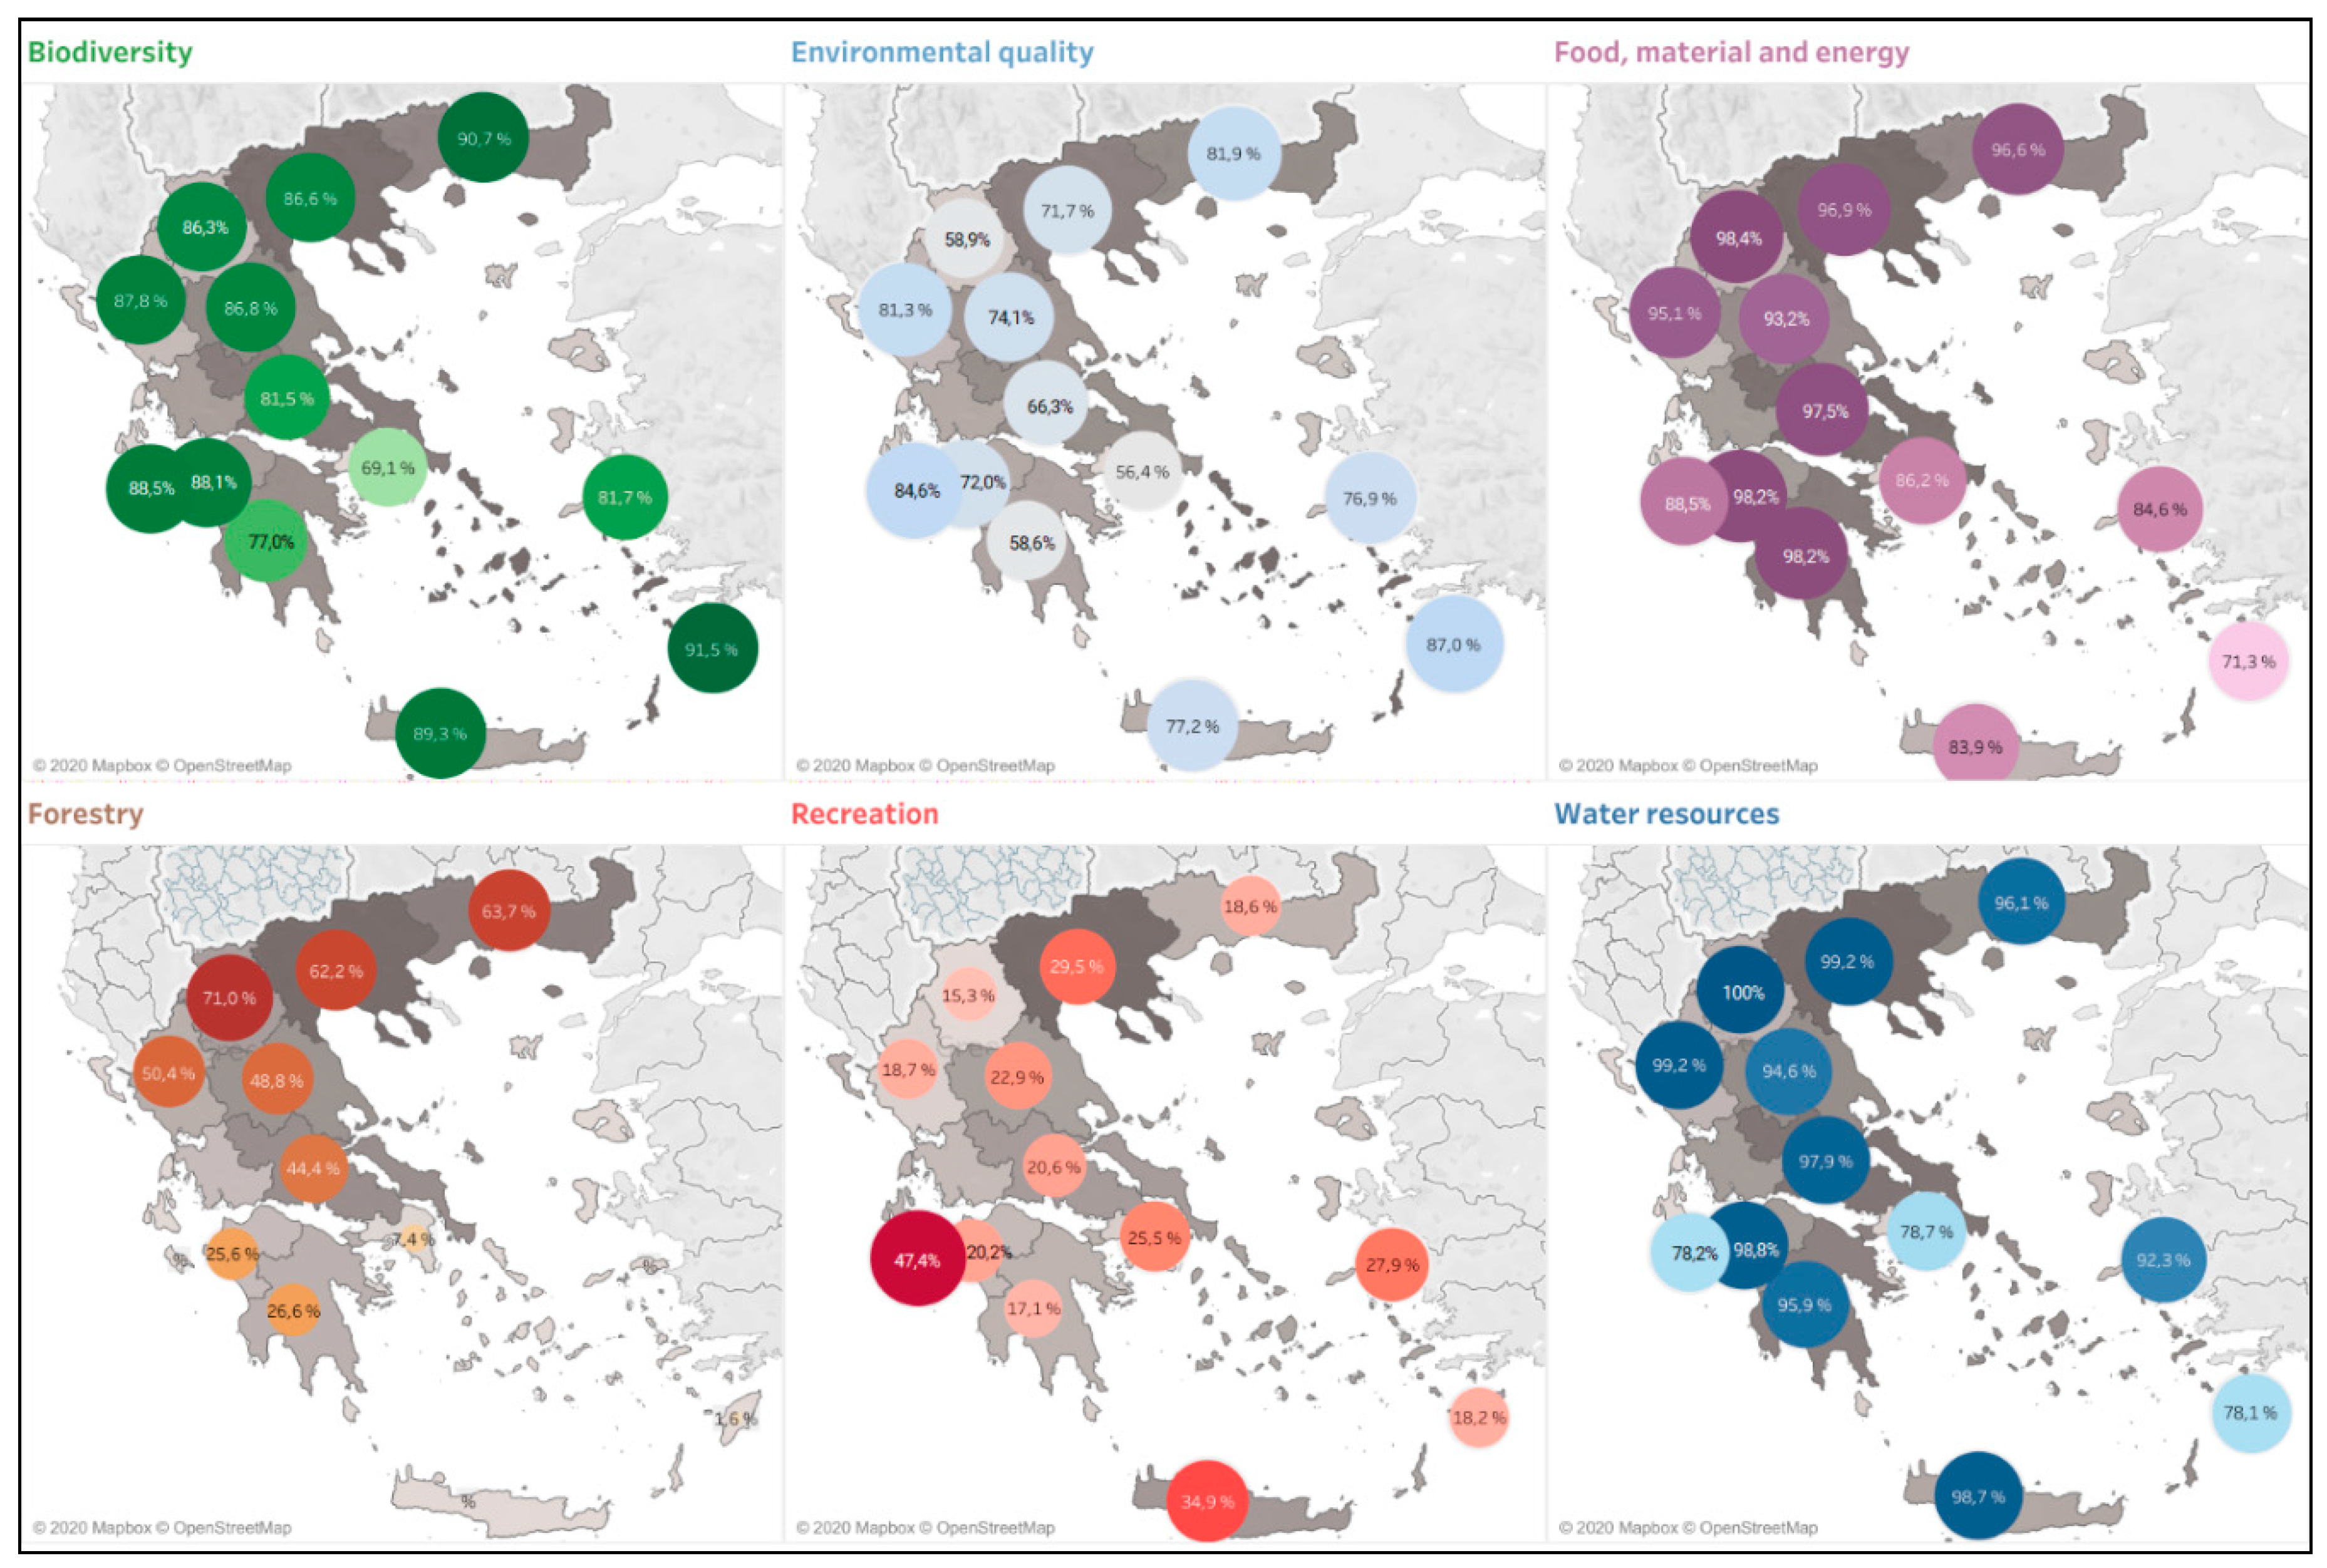
ES Bundles
- Biodiversity: most administrative regions are covered by an adequate number of biodiversity-related datasets (their majority is rated above 80%). The regions of South Aegean, East Macedonia and Thrace and Crete are covered at highest rates (91.5%, 90.7% and 89.3%, respectively). The region of Attica, hosting the metropolitan center and capital of Greece—Athens, is in the last position of the classification, with 69.1% of its area covered by biodiversity-related datasets. Overall, area-size differentiations are not of significant importance.
- Environmental quality: in most regions (nine out of thirteen), more than 70% of their surface is covered with data relevant to environmental quality. The region of Attica, including Athens, ranks in the last position of the list. Area-size differentiations are not of significant importance.
- Food, material and energy: all regions are considered to have adequate spatial coverage regarding the available datasets for food, material and energy. Area-size differentiations are not of significant importance.
- Forestry: regions of northern Greece, Western Macedonia, East Macedonia and Thrace and Central Macedonia are the first in the list with 71.0%, 63.7% and 62.2% cover of their surface, respectively. The Metropolitan region of Attica and island regions are placed last in the list: Attica 7.4%, South Aegean 1.6%, North Aegean and the Ionian Islands at 0%. Area size is considered important and follows the pattern of area covered by the datasets.
- Recreation: most areas covered by recreation-related data are present in the Ionian Islands (47.4%), Crete (34.9%) and Central Macedonia (29.5%). Regions’ area size is important; for example, for the Ionian Islands region, it is highlighted that 47.4% of the area cover is of high importance regarding the relatively small area of the region.
- Water resources: all regions are relatively well covered by water resources-related datasets and this is due mainly to the recent monitoring and assessment networks established for the EU Water Framework Directive. Although not apparent at this regional scale analysis, some local fine-scale data is still poorly compiled or surveyed, due to the country’s high geographical fragmentation (many small river basins and small isolated wetlands). Area-size differentiations among regions are not of significant importance.
ES Hotspots
- Provisioning services: (i) 39% of the terrestrial area is covered by agricultural areas, Thessaly, Western Greece, Central Macedonia, East Macedonia and Thrace and Crete can be considered as hotspots of agriculture-related provisioning services, (ii) approximately 15% of the country is under forest management control for timber and other forest products: Pindos, Rhodopi and Evros mountain ranges are considered as hotspots, (iii) most wind parks are developed in Central Greece, followed by Crete and East Macedonia and Thrace, and a local hotspot can be identified in Southern Evvoia (Central Greece), (iv) proposed and developed hydroelectric power plants from small dams hotspots are located throughout the mountain range of Pindos and continue southwards to the mountains of Northern Peloponnese: secondary hotspots are located lengthwise of north Greek borders, (v) a hotspot of solar energy production is identified at the surrounding area of Ptolemaida (Western Macedonia), while most solar energy units are developed in Thessaly and Central Greece.
- Regulating and maintenance services: Most high-altitude mountains of Greece, wetland areas, lakes and numerous coastal areas can be perceived as hotspots for regulating and maintenance services. Although some regions are characterized by relative higher proportional area coverage by Natura 2000 sites and wildlife refuges than others (e.g., East Macedonia and Thrace versus Attica, respectively), the spatial distribution pattern of these hotspot areas designates them as of equal importance for every region.
- Cultural services: Using the currently limited number of indicators the spatial pattern of the related information pinpoints Central Macedonia, Crete and the Ionian Islands as hotspot regions for cultural ecosystem services, hosting a dense concentration of high-quality mountain and coastal areas for recreational and spiritual activities/interactions (i.e., identified by a necessarily limited number of proxy indicators, being mountain shelters, “blue flag” beaches, thermal springs, fresh-water sports). This initial review shows that the restricted number of country-wide Cultural Ecosystem Services indicators should be increased and further developed.
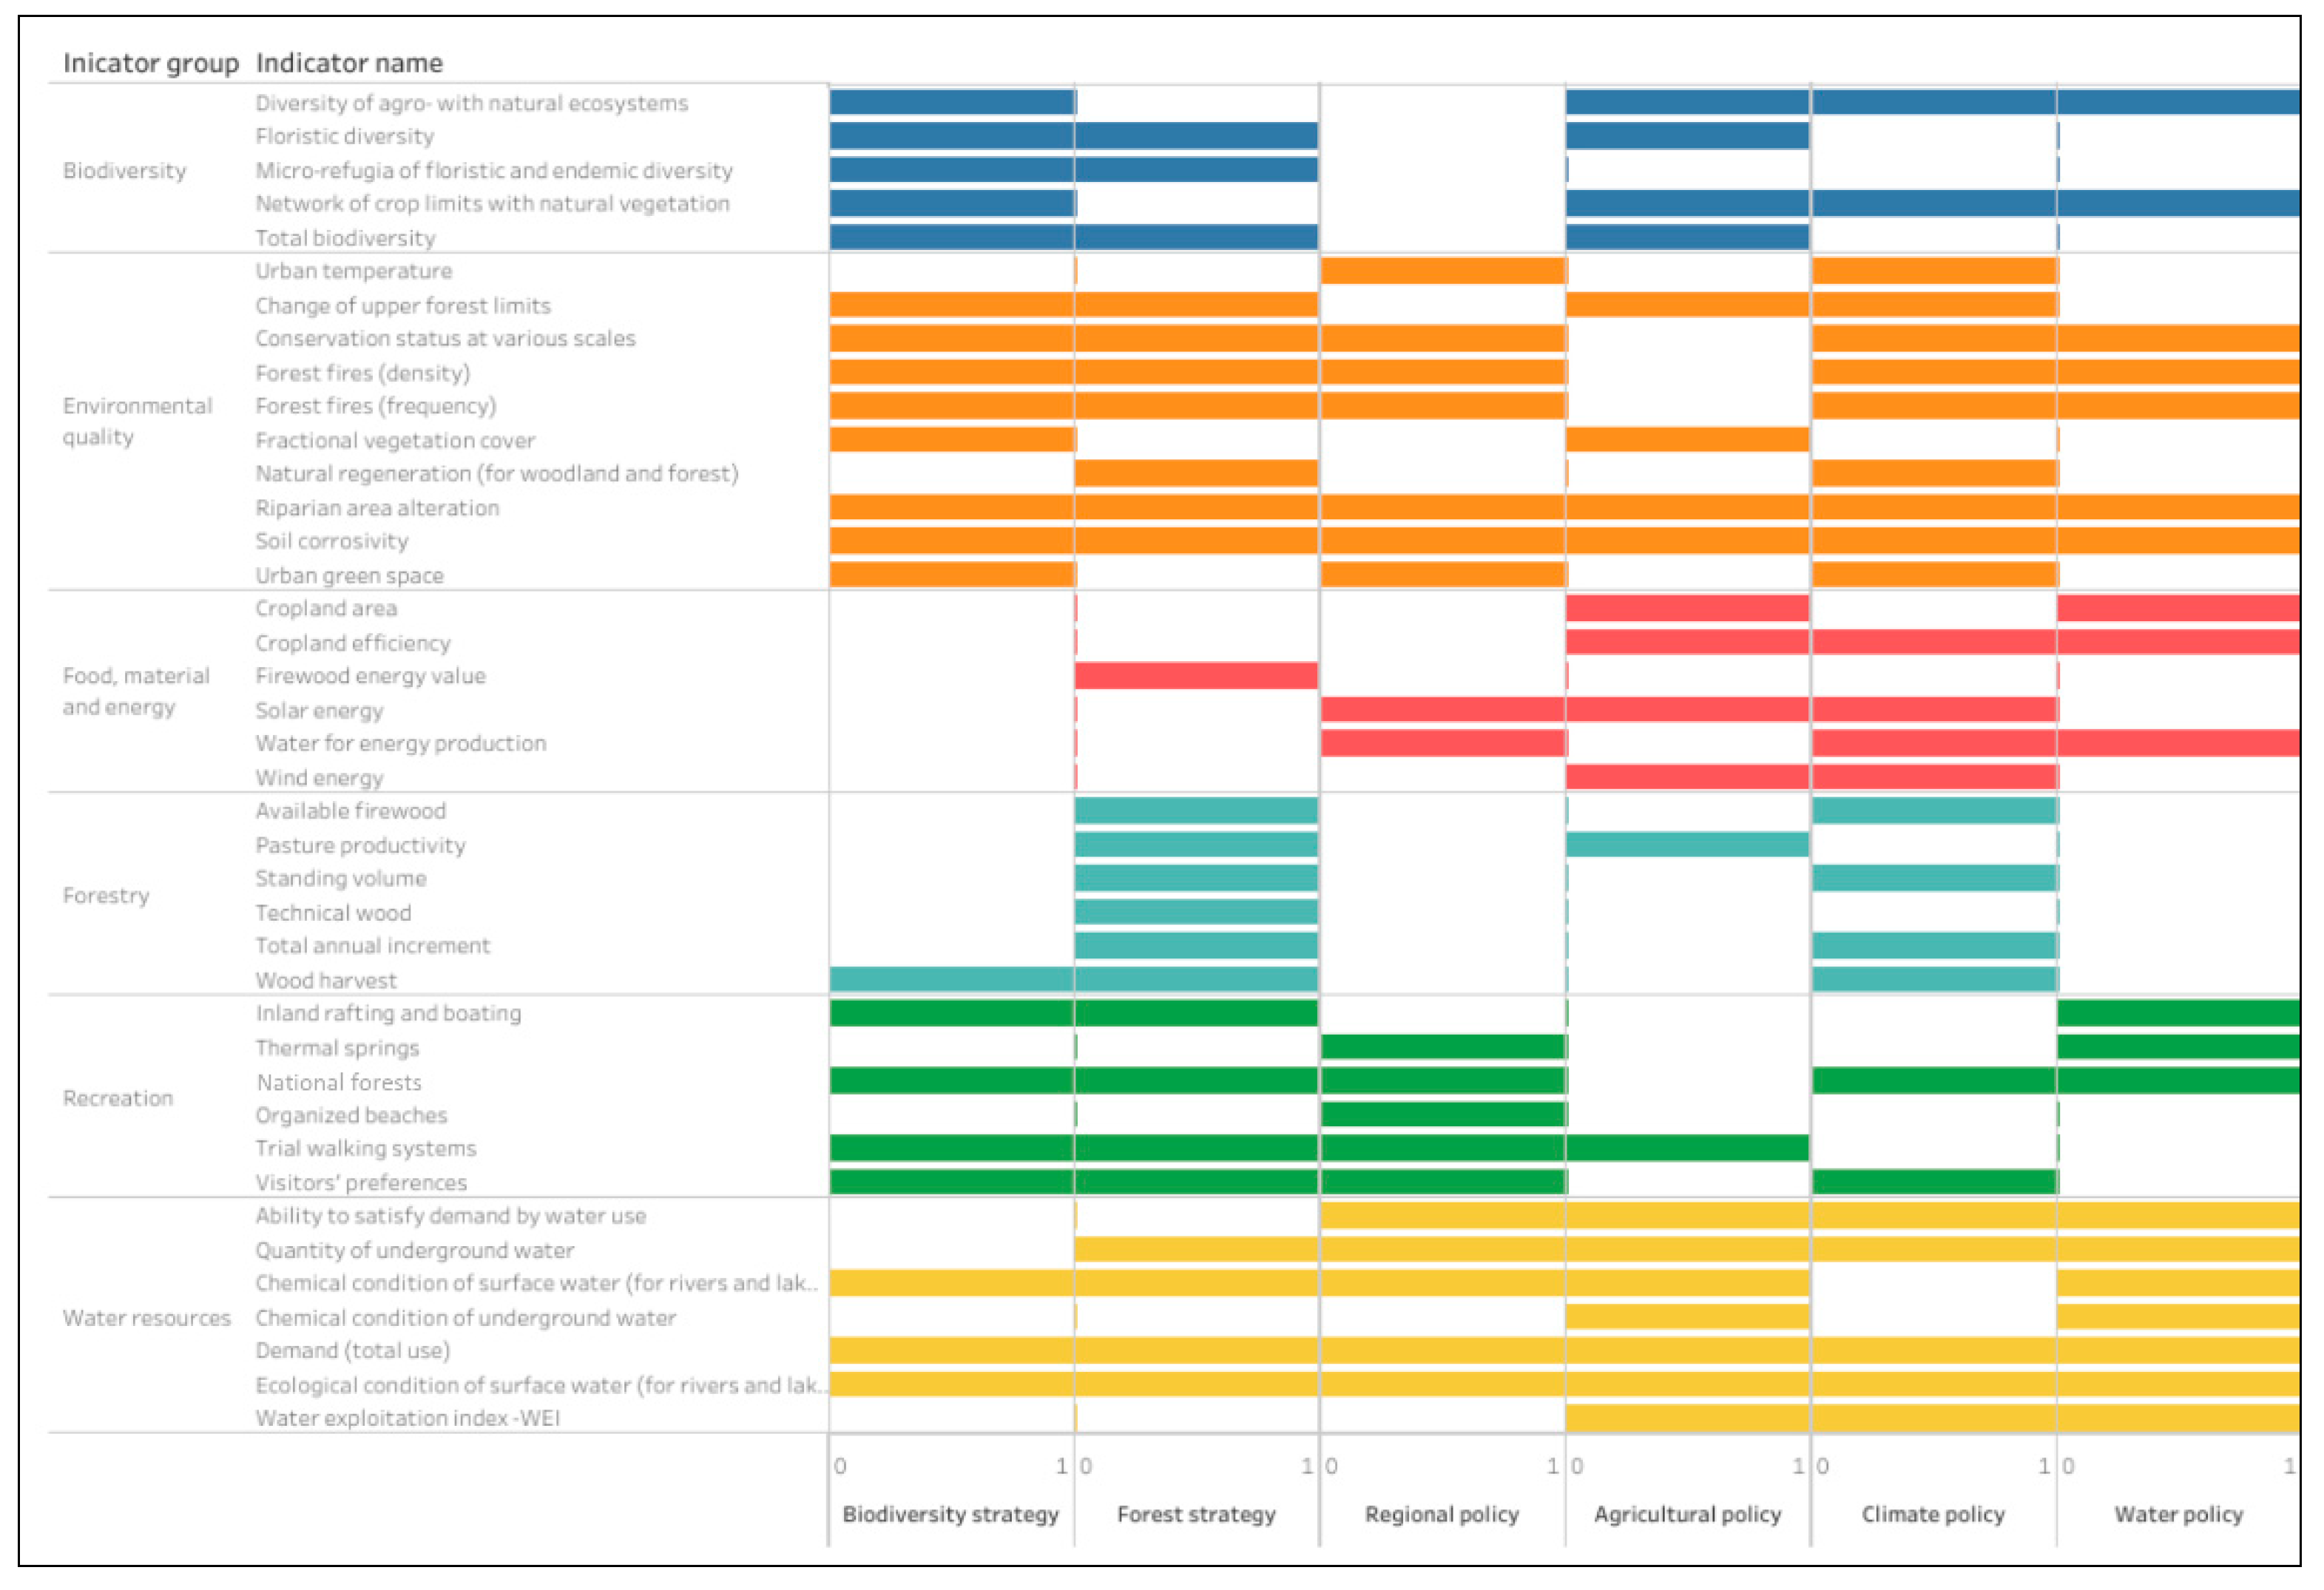
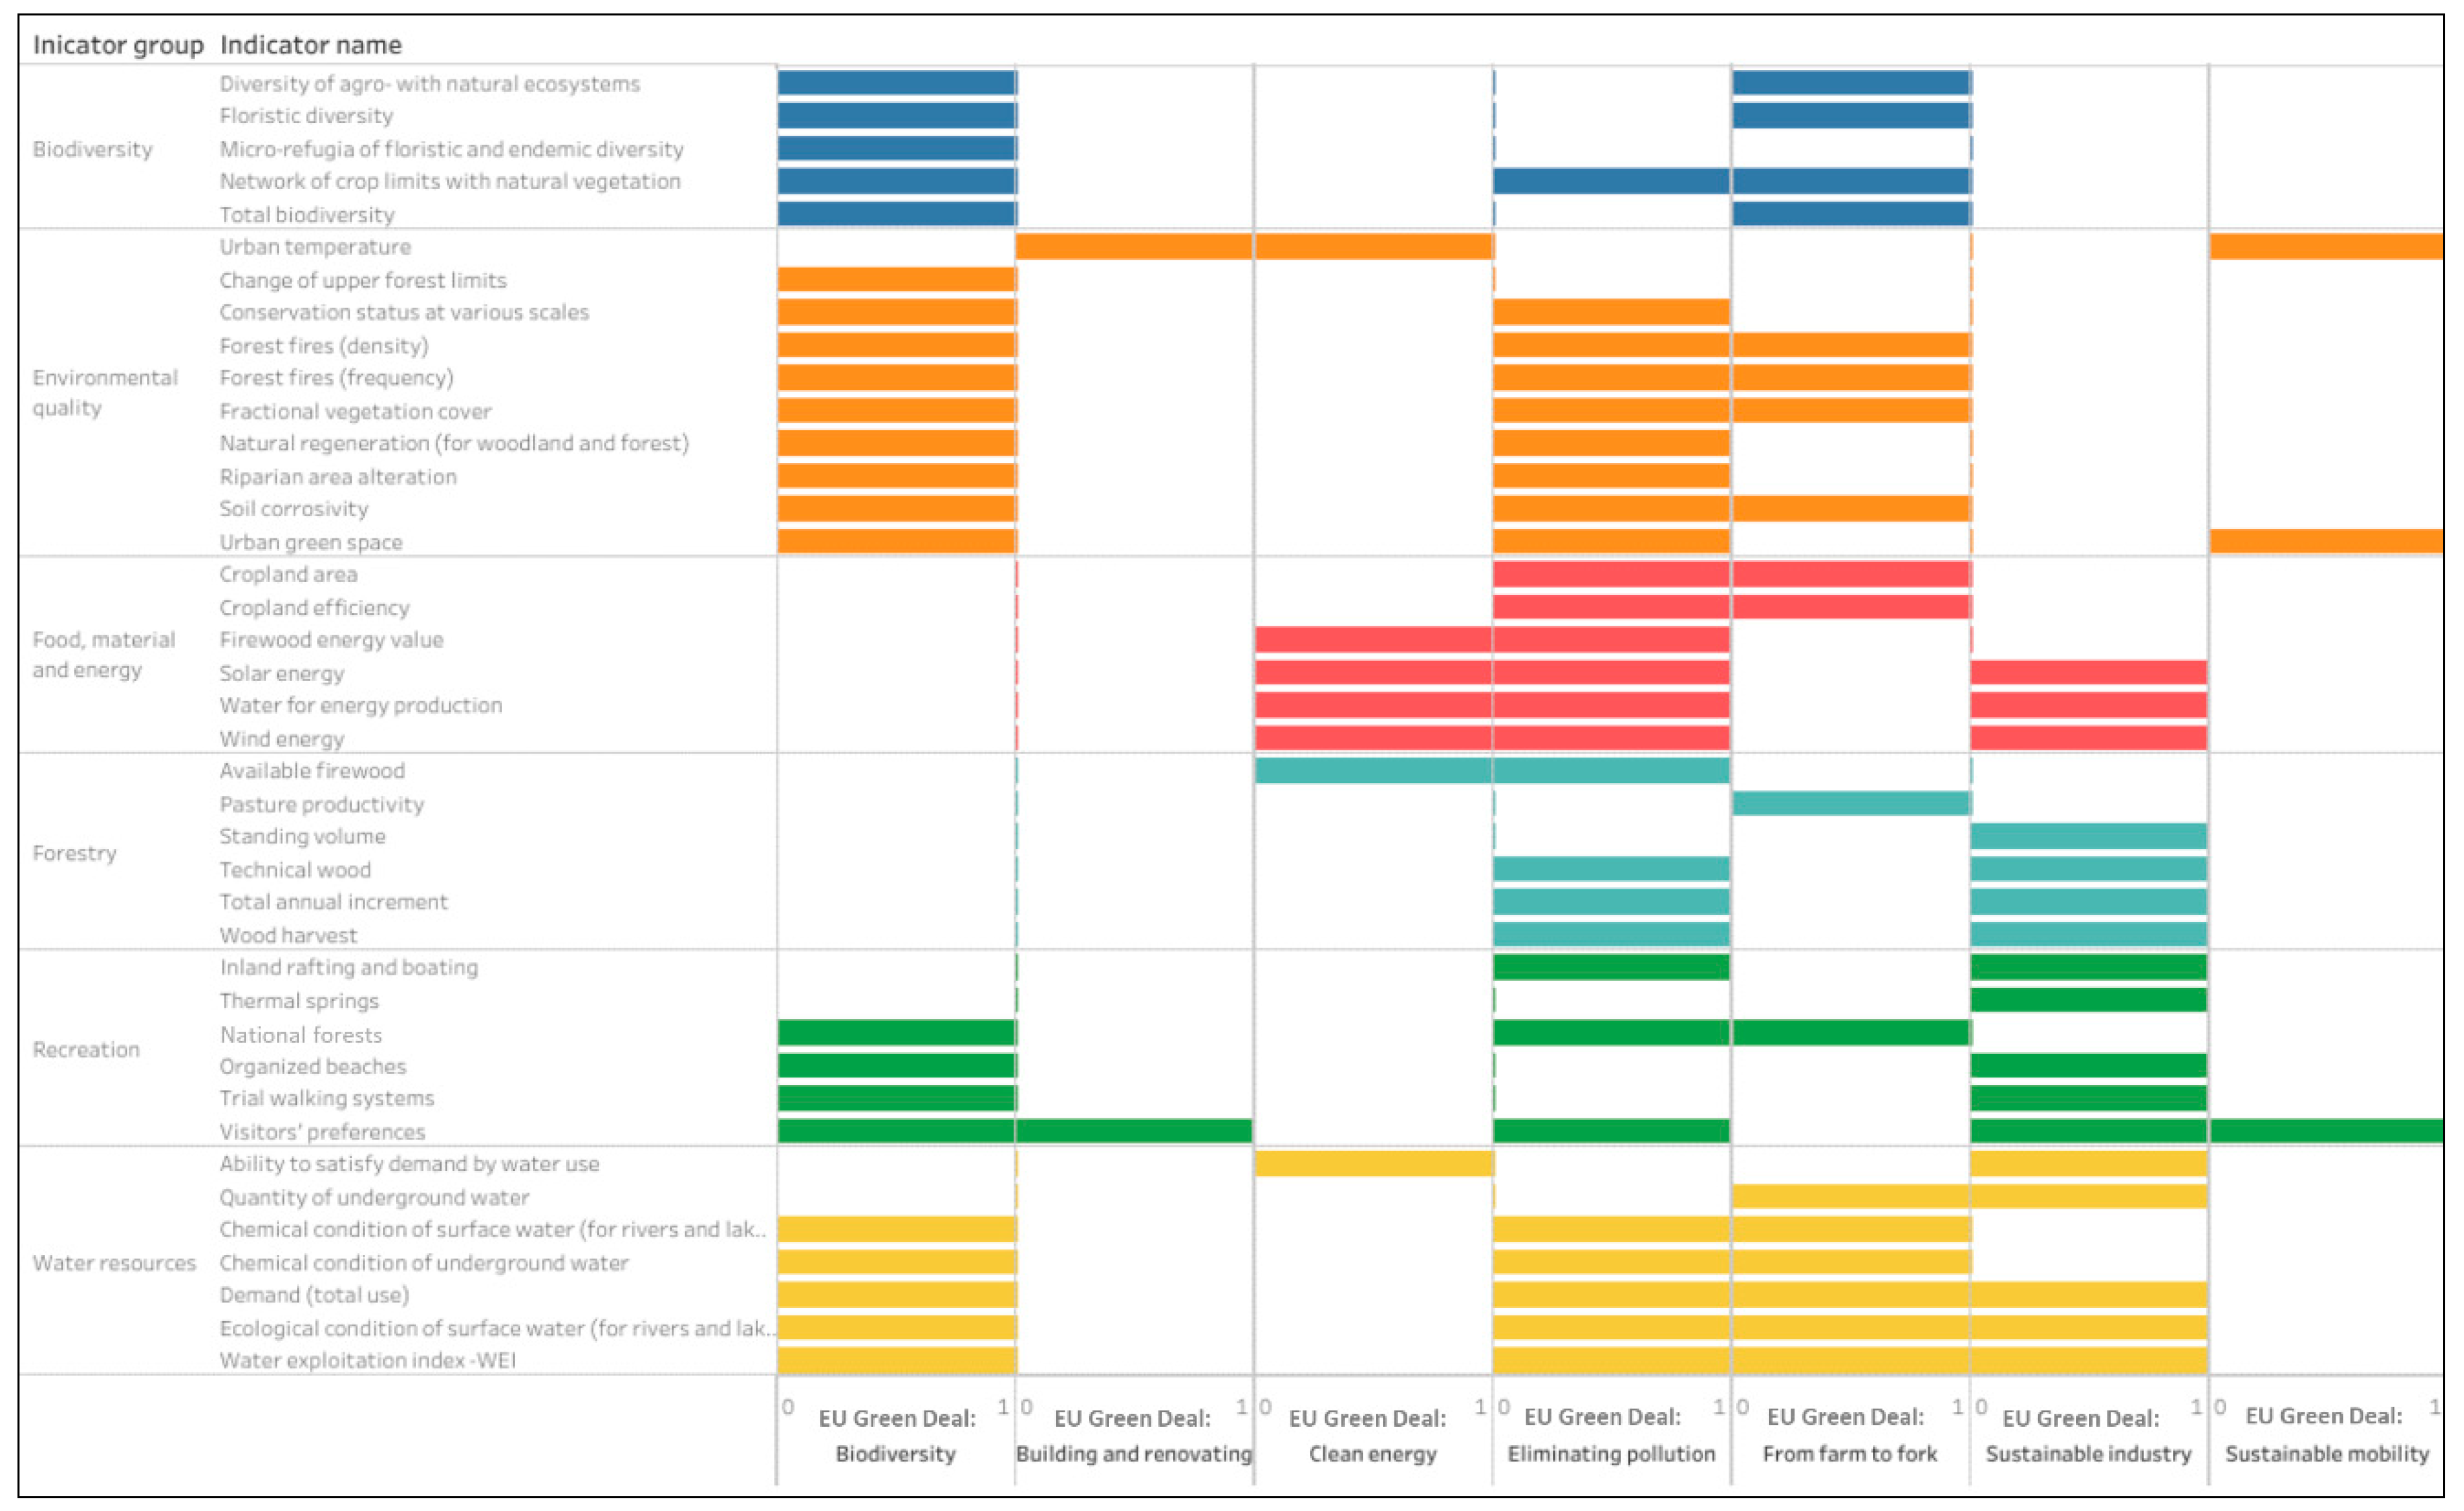
Relevance to Policies
- Biodiversity strategy: 21 relevant indicators, including 5 from Biodiversity, 8 from Environmental quality, 1 from Forestry, 4 from Recreation and 3 from Water resources groups.
- Forest strategy: 25 relevant indicators, including 3 from Biodiversity, 7 from Environmental quality, 1 from Food, material and energy, 6 from Forestry, 4 from Recreation and 4 from Water resources groups.
- Regional policy: 19 relevant indicators, including 7 from Environmental quality, 2 from Food, material and energy, 5 from Recreation and 5 from Water resources groups.
- Agricultural policy: 21 relevant indicators, including 4 from Biodiversity, 4 from Environmental quality, 4 from Food, material and energy, 1 from Forestry, 1 from Recreation and 7 from Water resources groups.
- Climate policy: 26 relevant indicators, including 2 from Biodiversity, 9 from Environmental quality, 4 from Food, material and energy, 4 from Forestry, 2 from Recreation and 5 from Water resources groups.
- EU Green Deal: All (40) proposed indicators are relevant to the EU Green Deal policy. However, specific relevance is present among indicators and the thematic targets of the EU Green Deals.
4. Discussion
5. Conclusions
Supplementary Materials
Author Contributions
Funding
Acknowledgments
Conflicts of Interest
References
- European Commission. Our Life Insurance, Our Natural Capital: An EU Biodiversity Strategy to Communication from the Commission to the European Parliament, the Council the Economic and Social Committee and the Committee of the Regions; Directorate-General for Environment: Brussels, Belgium, 2011. [Google Scholar]
- Maes, J.; Teller, A.; Erhard, M.; Liquete, C.; Braat, L.; Berry, P.; Egoh, B.; Puydarrieus, P.; Fiorina, C.; Santos, F.; et al. Mapping and Assessment of Ecosystem and Their Services. An Analytical Framework for Ecosystem Assessments under Action 5 of the EU Biodiversity Strategy to 2020; Publications Office of the European Union: Luxemburg, 2013; ISBN 9789279293696. [Google Scholar]
- Haines-Young, R.; Paterson, J.; Potschin, M.; Wilson, A.; Kass, G. The UK NEA Scenarios: Development of Storylines and Analysis of Outcomes; The UK National Ecosystem Assessment Technical Report; United Nations Environment Programme World Conservation Monitoring Centre (UNEP-WCMC): Cambridge, UK, 2011. [Google Scholar]
- Spanish National Ecosystem Assessment. Ecosystems and Biodiversity for Human Wellbeing: Synthesis of Key Findings; Ministerio de Agricultura, Alimentación y Medio Ambiente: Madrid, Spain, 2014.
- Bratanova-Doncheva, S.; Chipev, N.; Gocheva, K.; Stoyan, V.; Fikova, R. Methodological framework for assessment and mapping of ecosystem condition and ecosystem services in Bulgaria. In Conceptual Bases and Principles of Application; Digital Illusions: Clorindm, Argentina, 2017; ISBN 978-619-7379-21-1. [Google Scholar]
- Grunewald, K.; Herold, H.; Marzelli, S.; Meinel, G.; Richter, B.; Syrbe, R.-U.; Walz, U. Assessment of ecosystem services at the national level in Germany—Illustration of the concept and the development of indicators by way of the example wood provision. Ecol. Indic. 2016, 70, 181–195. [Google Scholar] [CrossRef]
- Grunewald, K.; Syrbe, R.U.; Walz, U.; Richter, B.; Meinel, G.; Herold, H.; Marzelli, S. Germany’s Ecosystem Services—State of the Indicator Development for a Nationwide Assessment and Monitoring. One Ecosyst. 2017, 2, e14021. [Google Scholar] [CrossRef]
- Henke, J.M.; Petropoulos, G.P. A GIS-based exploration of the relationships between human health, social deprivation and ecosystem services: The case of Wales, UK. Appl. Geogr. 2013, 45, 77–88. [Google Scholar] [CrossRef]
- Palomo, I.; Martín-López, B.; Zorrilla-Miras, P.; Del Amo, D.G.; Montes, C. Deliberative mapping of ecosystem services within and around Doñana National Park (SW Spain) in relation to land use change. Reg. Environ. Chang. 2013, 14, 237–251. [Google Scholar] [CrossRef]
- Cortinovis, C.; Geneletti, D. Ecosystem services in urban plans: What is there, and what is still needed for better decisions. Land Use Policy 2018, 70, 298–312. [Google Scholar] [CrossRef]
- Burkhard, B.; Maes, J.; Potschin-Young, M.; Santos-Martín, F.; Geneletti, D.; Stoev, P.; Kopperoinen, L.; Adamescu, C.; Esmail, B.A.; Arany, I.; et al. Mapping and assessing ecosystem services in the EU—Lessons learned from the ESMERALDA approach of integration. One Ecosyst. 2018, 3, e29153. [Google Scholar] [CrossRef]
- Burkhard, B.; Sapundzhieva, A.; Kuzmova, I.; Maes, J.; Geneletti, D.; Adem Esmail, B.; Potschin-Young, M.; Santos-Martin, F.; Mulders, S.; Kopperoinen, L.; et al. Action 5 Implementation Plan. Deliverable D1.7 EU Horizon 2020 ESMERALDA Project; Grant agreement No. 642007; Leipzig University: Hannover, Germany, 2018. [Google Scholar]
- Burkhard, B.; Maes, J. (Eds.) Mapping Ecosystem Services; Pensoft Publishers: Sofia, Bulgaria, 2017. [Google Scholar]
- ESMERALDA MAES Explorer. Available online: http://www.maes-explorer.eu (accessed on 12 April 2020).
- Santos-Martin, F.; Viinikka, A.; Mononen, L.; Brander, L.; Vihervaara, P.; Liekens, I.; Potschin-Young, M. Creating an operational database for Ecosystems Services Mapping and Assessment Methods. One Ecosyst. 2018, 3, e26719. [Google Scholar] [CrossRef]
- Burkhard, B.; Santos-Martín, F.; Nedkov, S.; Maes, J. An operational framework for integrated Mapping and Assessment of Ecosystems and their Services (MAES). One Ecosyst. 2018, 3, e22831. [Google Scholar] [CrossRef]
- Grêt-Regamey, A.; Weibel, B.; Kienast, F.; Rabe, S.-E.; Zulian, G. A tiered approach for mapping ecosystem services. Ecosyst. Serv. 2015, 13, 16–27. [Google Scholar] [CrossRef]
- Albert, C.; Bonn, A.; Burkhard, B.; Daube, S.; Dietrich, K.; Engels, B.; Frommer, J.; Götzl, M.; Grêt-Regamey, A.; Job-Hoben, B.; et al. Towards a national set of ecosystem service indicators: Insights from Germany. Ecol. Indic. 2016, 61, 38–48. [Google Scholar] [CrossRef]
- Maes, J.; Egoh, B.; Willemen, L.; Liquete, C.; Vihervaara, P.; Schägner, J.P.; Grizzetti, B.; Drakou, E.; La Notte, A.; Zulian, G.; et al. Mapping ecosystem services for policy support and decision making in the European Union. Ecosyst. Serv. 2012, 1, 31–39. [Google Scholar] [CrossRef]
- Mononen, L.; Auvinen, A.-P.; Ahokumpu, A.-L.; Rönkä, M.; Aarras, N.; Tolvanen, H.; Kamppinen, M.; Viirret, E.; Kumpula, T.; Vihervaara, P. National ecosystem service indicators: Measures of social–ecological sustainability. Ecol. Indic. 2016, 61, 27–37. [Google Scholar] [CrossRef]
- Tratalos, J.; Haines-Young, R.; Potschin, M.; Fish, R.; Church, A. Cultural ecosystem services in the UK: Lessons on designing indicators to inform management and policy. Ecol. Indic. 2016, 61, 63–73. [Google Scholar] [CrossRef]
- Albert, C.; Hauck, J.; Buhr, N.; Von Haaren, C. What ecosystem services information do users want? Investigating interests and requirements among landscape and regional planners in Germany. Landsc. Ecol. 2014, 29, 1301–1313. [Google Scholar] [CrossRef]
- Albert, C.; Galler, C.; Hermes, J.; Neuendorf, F.; Von Haaren, C.; Lovett, A. Applying ecosystem services indicators in landscape planning and management: The ES-in-Planning framework. Ecol. Indic. 2016, 61, 100–113. [Google Scholar] [CrossRef]
- Hauck, J.; Schweppe-Kraft, B.; Albert, C.; Görg, C.; Jensen, R.; Fürst, C.; Maes, J.; Ring, I.; Hönigová, I.; Burkhard, B.; et al. The Promise of the Ecosystem Services Concept for Planning and Decision-Making. GAIA Ecol. Perspect. Sci. Soc. 2013, 22, 232–236. [Google Scholar] [CrossRef]
- Hayek, U.W.; Teich, M.; Klein, T.; Grêt-Regamey, A. Bringing ecosystem services indicators into spatial planning practice: Lessons from collaborative development of a web-based visualization platform. Ecol. Indic. 2016, 61, 90–99. [Google Scholar] [CrossRef]
- Chee, Y.E. An ecological perspective on the valuation of ecosystem services. Biol. Conserv. 2004, 120, 549–565. [Google Scholar] [CrossRef]
- McCauley, D.J. Selling out on nature. Nature 2006, 443, 27–28. [Google Scholar] [CrossRef]
- Costanza, R.; De Groot, R.; Braat, L.; Kubiszewski, I.; Kubiszewski, I.; Sutton, P.; Farber, S.; Grasso, M. Twenty years of ecosystem services: How far have we come and how far do we still need to go? Ecosyst. Serv. 2017, 28, 1–16. [Google Scholar] [CrossRef]
- Russell-Smith, J.; Lindenmayer, D.; Kubiszewski, I.; Green, P.; Costanza, R.; Campbell, A. Moving beyond evidence-free environmental policy. Front. Ecol. Environ. 2015, 13, 441–448. [Google Scholar] [CrossRef]
- De Groot, R.; Fisher, B.; Christie, M.; Aronson, J.; Braat, L.; Gowdy, J.; Haines-Young, R.; Maltby, E.; Neuville, A.; Polasky, S.; et al. Integrating the ecological and economic dimensions in biodiversity and ecosystem service valuation. In The Economics of Ecosystems and Biodiversity: Ecological and Economic Foundations; Earthscan: London, UK; Washington, DC, USA, 2012; ISBN 9781849775489. [Google Scholar]
- Braat, L.C.; De Groot, R. The ecosystem services agenda: bridging the worlds of natural science and economics, conservation and development, and public and private policy. Ecosyst. Serv. 2012, 1, 4–15. [Google Scholar] [CrossRef]
- Maes, J.; Teller, A.; Erhard, M.; Liquete, C.; Braat, L.; Berry, P.; Egoh, B.; Puydarrieux, P.; Fiorina, C.; Santos, F. Mapping and Assessment of Ecosystems and Their Services. Indicators for Ecosystem Assessments under Action 5 of the EU Biodiversity Strategy to 2020; Publications office of the European Union: Luxemburg, 2014; ISBN 9789279361616. [Google Scholar]
- Heink, U.; Hauck, J.; Jax, K.; Sukopp, U. Requirements for the selection of ecosystem service indicators – The case of MAES indicators. Ecol. Indic. 2016, 61, 18–26. [Google Scholar] [CrossRef]
- Dimopoulos, P.; Drakou, E.; Kokkoris, I.; Katsanevakis, S.; Kallimanis, A.; Tsiafouli, M.; Bormpoudakis, D.; Kormas, K.; Arends, J. The need for the implementation of an Ecosystem Services assessment in Greece: Drafting the national agenda. One Ecosyst. 2017, 2, e13714. [Google Scholar] [CrossRef]
- Smart, J.J.C.; Hempel, C.G. Foundations of the Unity of Science. Volume II, no. 7: Fundamentals of Concept Formation in Empirical Science. Philos. Rev. 1953, 62, 473. [Google Scholar] [CrossRef]
- Williams, D.G.; Babbie, E.R. The Practice of Social Research. Contemp. Sociol. A J. Rev. 1976, 5, 163. [Google Scholar] [CrossRef]
- Heink, U.; Kowarik, I. What criteria should be used to select biodiversity indicators? Biodivers. Conserv. 2010, 19, 3769–3797. [Google Scholar] [CrossRef]
- Maes, J.; Teller, A.; Erhard, M.; Grizzetti, B.; Barredo, J.I.; Paracchini, M.L.; Condé, S.; Somma, F.; Orgiazzi, A.; Jones, A.; et al. Mapping and Assessment of Ecosystems and their Services: An Analytical Framework for Ecosystem Condition; Publications office of the European Union: Luxemburg, 2018; ISBN 978-92-79-74288-0. [Google Scholar]
- Kokkoris, I.P.; Bekri, E.S.; Skuras, D.; Vlami, V.; Zogaris, S.; Maroulis, G.; Dimopoulos, D.; Dimopoulos, P. Integrating MAES implementation into protected area management under climate change: A fine-scale application in Greece. Sci. Total. Environ. 2019, 695, 133530. [Google Scholar] [CrossRef]
- Hatziiordanou, L.; Fitoka, E.; Hadjicharalampous, E.; Votsi, N.; Palaskas, D.; Malak, D. Indicators for mapping and assessment of ecosystem condition and of the ecosystem service habitat maintenance in support of the EU Biodiversity Strategy to 2020. One Ecosyst. 2019, 4, e32704. [Google Scholar] [CrossRef]
- Vlami, V.; Kokkoris, I.P.; Zogaris, S.; Cartalis, C.; Kehayias, G.; Dimopoulos, P. Cultural landscapes and attributes of “culturalness” in protected areas: An exploratory assessment in Greece. Sci. Total. Environ. 2017, 595, 229–243. [Google Scholar] [CrossRef]
- Kokkoris, I.P.; Drakou, E.; Maes, J.; Dimopoulos, P. Ecosystem services supply in protected mountains of Greece: Setting the baseline for conservation management. Int. J. Biodivers. Sci. Ecosyst. Serv. Manag. 2017, 14, 45–59. [Google Scholar] [CrossRef]
- Kokkoris, I.; Dimopoulos, P.; Xystrakis, F.; Tsiripidis, I. National scale ecosystem condition assessment with emphasis on forest types in Greece. One Ecosyst. 2018, 3, e25434. [Google Scholar] [CrossRef]
- Nikolaidou, C.; Votsi, N.-E.; Sgardelis, S.; Halley, J.; Pantis, J.; Tsiafouli, M. Ecosystem Service capacity is higher in areas of multiple designation types. One Ecosyst. 2017, 2, e13718. [Google Scholar] [CrossRef]
- Hellenic Ecosystem Services Partnership (HESP). Available online: https://www.es-partnership.org/community/regional-chapters/south-east-europe/greece-hesp/ (accessed on 12 April 2020).
- LIFE-IP 4 NATURA. Available online: https://edozoume.gr/en/ (accessed on 12 April 2020).
- United Nations. European Commission; Food and Agricultural Organization of the United Nations; Organization for Economic Co-operation and Development. In World Bank System of Environmental-Economic Accounting 2012: Experimental Ecosystem Accounting; United Nations: New York, NY, USA, 2014; ISBN 9789210559263. [Google Scholar]
- Ecosystem Types of Europe. Available online: https://www.eea.europa.eu/data-and-maps/data/ecosystem-types-of-europe-1 (accessed on 12 April 2020).
- CORINE Land Cover. Available online: https://land.copernicus.eu/pan-european/corine-land-cover (accessed on 12 April 2020).
- Interpretation Manual of European Union Habitats–EUR28; European Commission, DG Environment: Brussels, Belgium, 2013; ISBN HAB 96/2 FINAL—EN Version EUR 15.
- Dimopoulos, P.; Bergmeier, E.; Theodoropoulos, K.; Fischer, P.; Tsiafouli, M. Monitoring Guide for Habitat types and Plant Taxa in Natura 2000 Sites with Management Bodies; University of Ioannina, Ministry of the Environment: Agrinio, Greece, 2005; ISBN 960-233-168-2. [Google Scholar]
- Development of Large Scale (1:5000) Spatial Data Infrastructure for Terrestrial Areas Protected under the «Νatura 2000» Network at a National Scale 2016. Available online: http://www.ypeka.gr/LinkClick.aspx?fileticket=txXACYhOLPI%3d&tabid=37&language=el-GR (accessed on 10 April 2018).
- Linkages of Species and Habitat Types to MAES Ecosystems. Available online: https://www.eea.europa.eu/data-and-maps/data/linkages-of-species-and-habitat#tab-metadata (accessed on 12 April 2020).
- The European Green Deal. Communication from the Commission to the European Parliament, the European Council, the Council, the European Economic and Social Committee and the Committee of the Regions. Brussels. 2019. Available online: https://ec.europa.eu/info/sites/info/files/european-green-deal-communication_en.pdf (accessed on 12 April 2020).
- National Biodiversity Strategy and Action Plan; Hellenic Ministry of Environment and Climate Change: Athens, Greece, 2014; ISBN 978-960-7284-33-4.
- Smith, A.; Harrison, P.; Soba, M.P.; Archaux, F.; Blicharska, M.; Egoh, B.; Erős, T.; Domenech, N.F.; György, Á.I.; Haines-Young, R.; et al. How natural capital delivers ecosystem services: A typology derived from a systematic review. Ecosyst. Serv. 2017, 26, 111–126. [Google Scholar] [CrossRef]
- Pouso, S.; Uyarra, M.C.; Borja, A. Recreational fishers’ perceptions and behaviour towards cultural ecosystem services in response to the Nerbioi estuary ecosystem restoration. Estuarine, Coast. Shelf Sci. 2018, 208, 96–106. [Google Scholar] [CrossRef]
- Grizzetti, B.; Liquete, C.; Pistocchi, A.; Vigiak, O.; Zulian, G.; Bouraoui, F.; De Roo, A.; Cardoso, A. Relationship between ecological condition and ecosystem services in European rivers, lakes and coastal waters. Sci. Total. Environ. 2019, 671, 452–465. [Google Scholar] [CrossRef]
- Haines-Young, R.; Potschin, M. CICES Towards a Common Classification of Ecosystem Services. Available online: https://cices.eu/ (accessed on 12 April 2020).
- Kettunen, M.; Ministers, N.C.O.; Vihervaara, P.; Kinnunen, S.; D’Amato, D.; Badura, T.; Argimon, M.; Brink, P.T. Socio-economic importance of ecosystem services in the Nordic Countries. In Socio-Economic Importance of Ecosystem Services in the Nordic Countries; Nordic Council of Ministers: Copenhagen, Denmark, 2012. [Google Scholar]
- Ferrari, M.; Geneletti, D. Mapping and assessing multiple ecosystem services in an alpine region: A study in Trentino, Italy. Ann. Bot. 2014, 4, 65–71. [Google Scholar]
- Nedkov, S.; Borisova, B.; Koulov, B.; Zhiyanski, M.; Bratanova-Doncheva, S.; Nikolova, M.; Kroumova, J. Towards integrated mapping and assessment of ecosystems and their services in Bulgaria: The Central Balkan case study. One Ecosyst. 2018, 3, e25428. [Google Scholar] [CrossRef]
- EEA Reference Grid. Available online: https://www.eea.europa.eu/data-and-maps/data/eea-reference-grids-2 (accessed on 12 April 2020).
- Tableau Online 2020.1. Available online: https://www.tableau.com/products/cloud-bi (accessed on 12 April 2020).
- Egoh, B.; Reyers, B.; Rouget, M.; Richardson, D.M.; Le Maitre, D.C.; Van Jaarsveld, A.S. Mapping ecosystem services for planning and management. Agric. Ecosyst. Environ. 2008, 127, 135–140. [Google Scholar] [CrossRef]
- Czúcz, B.; Arany, I.; Potschin-Young, M.; Bereczki, K.; Kertész, M.; Kiss, M.; Aszalós, R.; Haines-Young, R. Where concepts meet the real world: A systematic review of ecosystem service indicators and their classification using CICES. Ecosyst. Serv. 2018, 29, 145–157. [Google Scholar] [CrossRef]
- Feld, C.; Sousa, J.P.; Da Silva, P.M.; Dawson, T. Indicators for biodiversity and ecosystem services: Towards an improved framework for ecosystems assessment. Biodivers. Conserv. 2010, 19, 2895–2919. [Google Scholar] [CrossRef]
- Müller, F.; Burkhard, B. The indicator side of ecosystem services. Ecosyst. Serv. 2012, 1, 26–30. [Google Scholar] [CrossRef]
- Van Oudenhoven, A.P.E.; Schröter, M.; Drakou, E.; Geijzendorffer, I.R.; Jacobs, S.; Van Bodegom, P.; Chazee, L.; Czúcz, B.; Grunewald, K.; Lillebø, A.; et al. Key criteria for developing ecosystem service indicators to inform decision making. Ecol. Indic. 2018, 95, 417–426. [Google Scholar] [CrossRef]
- Van Reeth, W. Ecosystem Service Indicators in Flanders: Are We Measuring What We Want to Manage? Instituut voor Natuuren Bosonderzoek: Brussel, Belgium, 2014. [Google Scholar]
- Zogaris, S.; Economou, A.N. The biogeographic characteristics of the river basins of Greece. In The Rivers of Greece: Evolution, Current Status and Perspectives; Skoulikidis, N., Karaouzas, I., Dimitriou, E., Eds.; Springer-Verlag: Berlin/Heidelberg Germany, 2017; pp. 53–95. [Google Scholar]
- Tsianou, M.A.; Mazaris, A.D.; Kallimanis, A.S.; Deligioridi, P.-S.K.; Apostolopoulou, E.; Pantis, J.D. Identifying the criteria underlying the political decision for the prioritization of the Greek Natura 2000 conservation network. Biol. Conserv. 2013, 166, 103–110. [Google Scholar] [CrossRef]
- Katsanevakis, S.; Sini, M.; Dailianis, T.; Gerovasileiou, V.; Koukourouvli, N.; Topouzelis, K.; Ragkousis, M. Identifying where vulnerable species occur in a data-poor context: Combining satellite imaging and underwater occupancy surveys. Mar. Ecol. Prog. Ser. 2017, 577, 17–32. [Google Scholar] [CrossRef]
- Börger, T.; Beaumont, N.J.; Pendleton, L.; Boyle, K.J.; Cooper, P.; Fletcher, S.; Haab, T.; Hanemann, M.; Hooper, T.L.; Hussain, S.S.; et al. Incorporating ecosystem services in marine planning: The role of valuation. Mar. Policy 2014, 46, 161–170. [Google Scholar] [CrossRef]
- Rodrigues, J.G.; Conides, A.; Rodriguez, S.R.; Raicevich, S.; Pita, P.; Kleisner, K.; Pita, C.; Lopes, P.; Roldán, V.A.; Ramos, S.; et al. Marine and Coastal Cultural Ecosystem Services: Knowledge gaps and research priorities. One Ecosyst. 2017, 2. [Google Scholar] [CrossRef]
- Salomidi, M.; Katsanevakis, S.; Borja, A.; Braeckman, U.; Damalas, D.; Galparsoro, I.; Mifsud, R.; Mirto, S.; Pascual, M.; Pipitone, C.; et al. Assessment of goods and services, vulnerability, and conservation status of European seabed biotopes: A stepping stone towards ecosystem-based marine spatial management. Mediterr. Mar. Sci. 2012, 13, 49–88. [Google Scholar] [CrossRef]
- Balzan, M.V.; Pinheiro, A.M.; Mascarenhas, A.; Morán-Ordóñez, A.; Ruiz-Frau, A.; Carvalho-Santos, C.; Vogiatzakis, I.; Arends, J.; Santana-Garcon, J.; Roces-Díaz, J.V.; et al. Improving ecosystem assessments in Mediterranean social-ecological systems: A DPSIR analysis. Ecosyst. People 2019, 15, 136–155. [Google Scholar] [CrossRef]
- Satz, D.; Gould, R.K.; Chan, K.M.A.; Guerry, A.; Norton, B.; Satterfield, T.; Halpern, B.S.; Levine, J.; Woodside, U.; Hannahs, N.; et al. The Challenges of Incorporating Cultural Ecosystem Services into Environmental Assessment. Ambio 2013, 42, 675–684. [Google Scholar] [CrossRef]
- Jaligot, R.; Hasler, S.; Chenal, J. National assessment of cultural ecosystem services: Participatory mapping in Switzerland. Ambio 2019, 48, 1219–1233. [Google Scholar] [CrossRef] [PubMed]
- Raum, S. A framework for integrating systematic stakeholder analysis in ecosystem services research: Stakeholder mapping for forest ecosystem services in the UK. Ecosyst. Serv. 2018, 29, 170–184. [Google Scholar] [CrossRef]
- Vlami, V.; Danek, J.; Zogaris, S.; Gallou, E.; Kokkoris, I.P.; Kehayias, G.; Dimopoulos, P. Residents’ Views on Landscape and Ecosystem Services during a Wind Farm Proposal in an Island Protected Area. Sustainability 2020, 12, 2442. [Google Scholar] [CrossRef]
- Tengberg, A.; Fredholm, S.; Eliasson, I.; Knez, I.; Saltzman, K.; Wetterberg, O. Cultural ecosystem services provided by landscapes: Assessment of heritage values and identity. Ecosyst. Serv. 2012, 2, 14–26. [Google Scholar] [CrossRef]
- Schaubroeck, T. The Concept of Cultural Ecosystem Services Should Not Be Abandoned. BioScienece 2019, 69, 585. [Google Scholar] [CrossRef]
- Schaich, H.; Bieling, C.; Plieninger, T. Linking Ecosystem Services with Cultural Landscape Research. GAIA Ecol. Perspect. Sci. Soc. 2010, 19, 269–277. [Google Scholar] [CrossRef]
- Ungaro, F.; Hafner, K.; Zasada, I.; Piorr, A. Mapping cultural ecosystem services: Connecting visual landscape quality to cost estimations for enhanced services provision. Land Use Policy 2016, 54, 399–412. [Google Scholar] [CrossRef]
- Vlami, V.; Zogaris, S.; Djuma, H.; Kokkoris, I.P.; Kehayias, G.; Dimopoulos, P. A Field Method for Landscape Conservation Surveying: The Landscape Assessment Protocol (LAP). Sustainability 2019, 11, 2019. [Google Scholar] [CrossRef]
- Lorilla, R.S.; Kalogirou, S.; Poirazidis, K.; Kefalas, G. Identifying spatial mismatches between the supply and demand of ecosystem services to achieve a sustainable management regime in the Ionian Islands (Western Greece). Land Use Policy 2019, 88, 104171. [Google Scholar] [CrossRef]
- Lorilla, R.S.; Poirazidis, K.; Detsis, V.; Kalogirou, S.; Chalkias, C. Socio-ecological determinants of multiple ecosystem services on the Mediterranean landscapes of the Ionian Islands (Greece). Ecol. Model. 2020, 422, 108994. [Google Scholar] [CrossRef]
- LIFE IP 4Natura—Integrated Actions for the Conservation and Management of Natura 2000 Sites, Species, Habitats and Ecosystems in Greece (LIFE16 IPE/GR/000002). Available online: https://ec.europa.eu/environment/life/project/Projects/index.cfm?fuseaction=search.dspPage&n_proj_id=6520 (accessed on 12 April 2020).
- Economou, A.N.; Zogaris, S.; Vardakas, L.; Koutsikos, N.; Chatzinikolaou, Y.; Kommatas, D.; Kapakos, Y.; Giakoumi, S.; Oikonomou, E.; Tachos, V. Developing policy-relevant river fish monitoring in Greece: Insights from a nation-wide survey. Mediterr. Mar. Sci. 2016, 17, 302. [Google Scholar] [CrossRef]
- Mentzafou, A.; Panagopoulos, Y.; Dimitriou, E. Designing the National Network for Automatic Monitoring of Water Quality Parameters in Greece. Water 2019, 11, 1310. [Google Scholar] [CrossRef]
- MAES GR Tool: Mapping and Assessment of Ecosystems and their Services: A Dynamic Tool for Ecosystem Services. Available online: https://83.212.170.27:8085/login (accessed on 12 April 2020).


| Requirements | Description | Code |
|---|---|---|
| Scientifically sound | Indicators should be based on the best available knowledge while giving a good representation of the ecosystem characteristics addressed. | 1 |
| Supporting environmental legislation | Indicators should support the implementation of environmental legislation in the European Union (EU). | 2 |
| Policy-relevant | Indicators should be policy-relevant: they have multiple policy uses and can support a policy narrative which links pressures, ecosystem condition, ecosystem services and policy objectives. | 3 |
| Include habitat and species conservation status | The conservation status of habitats and species (and in particular the parameters “area” and “structure and function”) reported under Art.17 of the EU Habitats Directive should constitute a major indicator for assessing ecosystem condition. | 4 |
| Include soil-related information | Terrestrial ecosystems are not in good condition if their soils are not in good condition. Specific indicators which assess the condition of soils should therefore be included. | 5 |
| Applicable for natural capital accounts | The indicator framework should support the development and testing of ecosystem extent and condition accounts. | 6 |
| Spatially explicit | Ecosystem condition is not equal across space. Different spatial gradients of pressures and differences in the response of ecosystems to pressures result in spatial variance of ecosystem condition, which needs to be acknowledged in the indicator selection. | 7 |
| Baseline | Indicators should be measurable relative to a baseline year (e.g., 2010). | 8 |
| Sensitive to change | Indicators should be able to detect change over time. | 9 |
| MAES Ecosystem Category (Level 1) | Ecosystem Type for Mapping and Assessment (Level 2) | Ecosystem Type for Mapping and Assessment in Greece (Level 3) | Habitat Type Codes |
|---|---|---|---|
| Terrestrial | Urban | Dense to medium dense Urban Fabric (IM.D. 30%–100% + industrial, commercial, public, military and private units) | - |
| Low-density Urban Fabric (IM.D. 0%–30%) | - | ||
| Other/Transport | - | ||
| Cropland | Arable land | - | |
| Permanent crops | - | ||
| Heterogeneous agricultural areas | - | ||
| Grassland | Managed grassland | - | |
| Natural grasslands prevailingly without trees and scrubs (T.C.D. < 30%) | 6110 *, 6170, 6220 *, 6230 *, 6290, 62A0, 62D0, 6420, 6430, 6510, 651A, G628, G645 | ||
| Natural grasslands with trees and scrubs (T.C.D. > 30%) | 6110 *, 6170, 6220 *, 6230 *, 6290, 62A0, 62D0, 6420, 6430, 6510, 651A, G628, G645 | ||
| Woodland and forest | Temperate deciduous forests | 9110, 9130, 9140, 9150, 9180, G91K, G91L | |
| Mediterranean deciduous forests | 91M0, 9280, 9250, 9310, 9350, 9260, 925A | ||
| Floodplain forests (Riparian forest/Fluvial forest) | 92A0, 92C0, 92D0, 91E0 *, 91F0 | ||
| Temperate mountainous coniferous forests | 9530 *, 951B, 91ΒA, 91CA, 9410, 95A0 | ||
| Mediterranean coniferous forests | 2270, 9540, 9560, 9290 | ||
| Mediterranean sclerophyllous forests | 9340, 934A, 9320, 9370 | ||
| Mixed Forest | 9270 | ||
| Heathland and shrub | Moors and heathland | 4060, 4090, 5360, 5420, 5430 | |
| Sclerophyllous vegetation | 2250 *, 5110, 5150, 5160, 5210, 5230, 5310, 5330, 5340, 5350 | ||
| Sparsely vegetated land | Sparsely vegetated areas | 8130, 8140, 8210, 8220, 8230, 8310, 8320, 8330, 2240, 2260, 9620 | |
| Beaches, dunes, sands | 1210, 1240, 1410, 2110, 2120, 2220, 2230, 2210 | ||
| Bare rock | - | ||
| Burnt areas | - | ||
| Glaciers and perpetual snow | - | ||
| Mines, dumps, land without current use | - | ||
| Wetlands | Inland freshwater marshes | 72A0, 72Β0, 2190 | |
| Inland saline marshes | 1310, 1410, 1420, 1430, 1510, 1440 | ||
| Peat bogs | 7140, 7210, 7220, 7230 | ||
| Marine wetlands | 1110, 1120, 1130, 1150, 1160, 1170, 1180, 1310 | ||
| Freshwater | Rivers and lakes | Rivers | 3240, 3250, 3260, 3280, 3290 |
| Lakes | 3130, 3140, 3150, 3170 * |
| Indicator Group | Indicator Name | CICES Section | CICES Code | ES Indicator | EC Indicator | MAES Framework Requirements (See Table 1) |
|---|---|---|---|---|---|---|
| Biodiversity | Diversity of agro-ecosystems with natural ecosystems (IB1) | Regulating and Maintenance | 2.2.2.1, 2.2.2.3, 5.1.2.1, 5.2.2.1 | Yes | Yes | 1, 3, 8, 9 |
| Floristic diversity (IB2) | 2.2.2.3 | Yes | Yes | 1, 2, 3, 4, 6, 7, 8, 9 | ||
| Micro-refugia of floristic and endemic diversity (IB3) | 2.2.2.3 | Yes | Yes | 1, 2, 3, 7, 8, 9 | ||
| Network of crop limits with natural vegetation (IB4) | 2.1.2.3, 2.2.2.1, 2.2.2.3, 5.1.2.1 | Yes | Yes | 1, 3, 8, 9 | ||
| Total biodiversity (IB5) | 2.2.2.3 | Yes | Yes | 1, 2, 3, 4, 5, 6, 7, 8, 9 | ||
| Environmental quality | Change of upper forest limits (IE1) | Regulating and Maintenance | - | No | Yes | 1, 2, 3, 5, 7, 8, 9 |
| Conservation status at various scales (IE2) | - | No | Yes | 1, 2, 3, 4, 5, 7, 8, 9 | ||
| Forest fires (density) (IE3) | - | No | Yes | 1, 3, 5, 7, 8, 9 | ||
| Forest fires (frequency) (IE4) | - | No | Yes | 1, 3, 5, 7, 8, 9 | ||
| Fractional vegetation cover (IE5) | Yes | 1, 2, 3, 5, 7, 8, 9 | ||||
| Natural regeneration (for woodland and forest) (IE6) | 2.2.2.3, 2.2.6.1, 5.1.2.1, 5.2.2.1 | Yes | Yes | 1, 2, 3, 4, 6, 7, 8, 9 | ||
| Riparian area alteration (IE7) | 2.2.1.3, 2.2.1.5, 2.2.2.3, 5.1.2.1, 5.2.1.2, 5.2.2.1 | Yes | Yes | 1, 2, 3, 4, 5, 6, 7, 8, 9 | ||
| Soil corrosivity (IE8) | 2.2.1.1, 2.2.1.2, 2.2.4.1, 2.2.4.2, 5.2.1.1 | Yes | Yes | 1, 2, 3, 5, 7, 8, 9 | ||
| Urban green space (IE9) | 2.1.2.2, 2.1.2.3, 2.2.1.4, 2.2.2.2, 2.2.2.3, 2.2.6.2, 5.2.1.3, 5.2.2.1 | Yes | Yes | 1, 3, 6, 7, 8, 9 | ||
| Urban temperature (IE10) | 5.2.2.1 | Yes | Yes | 1, 3, 7, 8, 9 | ||
| Food, material and energy | Cropland area (IM1) | Provisioning | 1.1.1.1 | Yes | No | 1, 3, 6, 7, 8, 9 |
| Cropland efficiency (IM2) | 1.1.1.1 | Yes | Yes | 1, 3, 6, 7, 8, 9 | ||
| Firewood energy value (IM3) | 1.1.6.3 | Yes | No | 1, 3, 6, 7, 8, 9 | ||
| Solar energy (IM4) | 4.3.2.4 | Yes | No | 1, 2, 3, 6, 7, 8, 9 | ||
| Water for energy production (IM5) | 4.2.1.3 | Yes | No | 1, 2, 3, 6, 7, 8, 9 | ||
| Wind energy (IM6) | 4.3.2.3 | Yes | No | 1, 2, 3, 6, 7, 8, 9 | ||
| Forestry | Available firewood (IF1) | Provisioning | 1.1.5.3 | Yes | Yes | 1, 3, 6, 7, 8, 9 |
| Pasture productivity (IF2) | 1.1.5.1 | Yes | Yes | 1, 3, 6, 7, 8, 9 | ||
| Standing volume (IF3) | 1.1.5.2 | Yes | Yes | 1, 3, 6, 7, 8, 9 | ||
| Technical wood (IF4) | 1.1.5.2 | Yes | Yes | 1, 3, 6, 7, 8, 9 | ||
| Total annual increment (IF5) | 1.1.5.2 | Yes | Yes | 1, 3, 6, 7, 8, 9 | ||
| Wood harvest (IF6) | 1.1.5.2 | Yes | Yes | 1, 3, 6, 7, 8, 9 | ||
| Recreation | National forests (IR1) | Cultural | 6.2.2.1 | Yes | No | 1, 2, 3, 6, 7, 8, 9 |
| Inland waters rafting and boating (IR2) | 6.1.1.1 | Yes | No | 1, 3, 6, 7, 8 | ||
| Organized beaches (IR3) | 6.1.2.1 | Yes | Yes | 1, 3, 6, 7, 8 | ||
| Thermal springs (IR4) | 6.1.2.1 | Yes | No | 1, 3, 6, 7, 8 | ||
| Trial walking systems (IR5) | 6.1.1.1 | Yes | No | 1, 3, 6, 7, 8 | ||
| Visitors’ preferences (IR6) | 6.1.2.1 | Yes | Yes | 1, 3, 6, 7, 8 | ||
| Water resources | Ability to satisfy demand by water use (IW1) | Provisioning | 4.2.1.1, 4.2.1.2 | Yes | Yes | 1, 3, 6, 7, 8 |
| Chemical condition of surface water (for rivers and lakes) (IW2) | Regulating and Maintenance | 2.2.5.1, 5.2.2.1 | Yes | Yes | 1, 2, 3, 4, 5, 6, 7, 8, 9 | |
| Chemical condition of underground water (IW3) | Regulating and Maintenance | 2.2.5.1, 5.2.2.1 | Yes | Yes | 1, 2, 3, 4, 5, 6, 7, 8, 9 | |
| Demand (total use) (IW4) | Provisioning | 4.2.1.1, 4.2.1.2 | Yes | Yes | 1, 3, 6, 7, 8 | |
| Ecological condition of surface water (for rivers and lakes) (IW5) | Regulating and Maintenance | 4.2.2.4_W1 | Yes | Yes | 1, 2, 3, 4, 5, 6, 7, 8, 9 | |
| Quantity of underground water (IW6) | Provisioning | 4.2.2.4_W2 | Yes | Yes | 1, 3, 6, 7, 8, 9 | |
| Water exploitation index—WEI (IW7) | Provisioning | 4.2.2.4_W3 | Yes | Yes | 1, 3, 6, 7, 8 |
| Number of MAES-Related Datasets | Number of Corresponding Cells | % of Total Cell Number |
|---|---|---|
| 0 | 14 | 0.63 |
| 1 | 98 | 4.42 |
| 2 | 166 | 7.49 |
| 3 | 474 | 21.41 |
| 4 | 712 | 32.14 |
| 5 | 482 | 21.76 |
| 6 | 195 | 8.80 |
| 7 | 69 | 3.12 |
| 8 | 5 | 0.23 |
| Total | 2215 | 100 |
© 2020 by the authors. Licensee MDPI, Basel, Switzerland. This article is an open access article distributed under the terms and conditions of the Creative Commons Attribution (CC BY) license (http://creativecommons.org/licenses/by/4.0/).
Share and Cite
Kokkoris, I.P.; Mallinis, G.; Bekri, E.S.; Vlami, V.; Zogaris, S.; Chrysafis, I.; Mitsopoulos, I.; Dimopoulos, P. National Set of MAES Indicators in Greece: Ecosystem Services and Management Implications. Forests 2020, 11, 595. https://doi.org/10.3390/f11050595
Kokkoris IP, Mallinis G, Bekri ES, Vlami V, Zogaris S, Chrysafis I, Mitsopoulos I, Dimopoulos P. National Set of MAES Indicators in Greece: Ecosystem Services and Management Implications. Forests. 2020; 11(5):595. https://doi.org/10.3390/f11050595
Chicago/Turabian StyleKokkoris, Ioannis P., Georgios Mallinis, Eleni S. Bekri, Vassiliki Vlami, Stamatis Zogaris, Irene Chrysafis, Ioannis Mitsopoulos, and Panayotis Dimopoulos. 2020. "National Set of MAES Indicators in Greece: Ecosystem Services and Management Implications" Forests 11, no. 5: 595. https://doi.org/10.3390/f11050595
APA StyleKokkoris, I. P., Mallinis, G., Bekri, E. S., Vlami, V., Zogaris, S., Chrysafis, I., Mitsopoulos, I., & Dimopoulos, P. (2020). National Set of MAES Indicators in Greece: Ecosystem Services and Management Implications. Forests, 11(5), 595. https://doi.org/10.3390/f11050595