Commentary

Mortality in Forested Ecosystems: Suggested Conceptual Advances

1
Department of Forest Ecosystems and Society, Oregon State University, Corvallis, OR 97331, USA
2
United States Department of Agriculture, Forest Service Pacific Northwest Research Station, Corvallis, OR 97331, USA
*
Author to whom correspondence should be addressed.
Forests 2020, 11(5), 572; https://doi.org/10.3390/f11050572
Submission received: 24 April 2020 / Revised: 13 May 2020 / Accepted: 19 May 2020 / Published: 20 May 2020
(This article belongs to the Section Forest Ecology and Management)

Abstract

:
Mortality of trees is an important ecological process altering forest structure and function as well as influencing forest management decisions. Recent observations suggest that the overall rate of tree mortality is increasing at local to global scales. While more data on mortality is needed to document these changes, key concepts are also needed to guide the collection, interpretation, and use of this information. Mortality can be considered as a general process that includes all forms of tree-related death ranging from parts of trees to large-scale disturbances. Viewing mortality as a continuum allows one to examine how the lifespan of trees and their parts (e.g., branches), as well as multiple disturbances, influence ecosystem structure and function. Statistically, mortality does not follow the law of large numbers because, regardless of the scale analyzed, consequential, infrequent episodes can occur. This causes mortality to occur in irregular pulses. While the causes of mortality are indeed complex, this stems from the fact many processes, each with its own set of controls, can lead to mortality. By analyzing and predicting mortality using a chain of events influenced by specific mechanisms, a clearer understanding of this process should develop, leading to a more science-based and less reactive forest management.

1. Introduction

Mortality of trees is an important ecological process, altering forest structure to create habitats and changing carbon and nutrient dynamics, as well as influencing soil formation and hydrological yield of forests [1]. In terms of forest management, mortality is often viewed as creating a potentially wasted resource, leading to thinning before [2,3] and salvage after it occurs [4]. More recently there has been concern about an overall increase in tree mortality at the global level from various causes, including, for example, increased temperature and drought [5,6,7,8,9,10,11,12,13,14], outbreaks of insects [15,16,17,18] and diseases [19,20,21], increased fire [22,23], and wind [24].
Given its importance and potential for increase, there is a growing need to quantify and understand the mortality process at scales ranging from individual trees to continents to the globe [25,26]. Since mortality is a highly heterogeneous process, we believe that the collection of a great deal more mortality data is certainly warranted; however, we also feel that some concepts are needed to guide the collection, interpretation, and use of these data. In the following commentary, we, therefore, consider the general nature of mortality, viewing it as a multi-level continuum: how its statistical properties differ from other ecological variables, how causal factors are related, and how this process is modeled. Our intent is neither to conduct an extensive review nor to synthesize the vast amount of data that already exists. Instead, we use examples and simple models to illustrate these concepts.

2. The Nature of Mortality

In considering the nature of mortality, we start with what mortality represents: the general process by which biological entities move from the living state to the “dead” state. We placed dead in quotes because, for some biological entities (e.g., tree stems), mortality may ultimately lead to just as many (or more) living cells (e.g., wood decay fungi) present as in the live state; hence dead trees are not actually dead—they are biologically alive [1,27].
Although most frequently used at the population level (i.e., multiple, interbreeding individuals), we have generalized the term mortality to include all biological entities from the cell upwards. Hence, cells, tissues, parts, individuals, and populations all can undergo mortality. Moreover, mortality at a lower level need not lead to complete mortality at a higher level; for example, the death of a tree need not lead to the death of a stand of trees. For the purposes of our subsequent sections, which centers on ecosystems, we will exclude the mortality of cells and tissues, focusing on tree parts and entire trees.
Mortality can be quantified in terms of numbers or proportional numbers (i.e., fraction dying) as well the mass or proportional mass of biological entities dying. The former indices are relevant to the cell to population perspectives, whereas the latter, the ecosystem to biospheric ones.
Perhaps because of our own finite lifespan, humans tend to view mortality as an unusual and unfortunate event. While that may be the case, there are many instances in which mortality is quite usual, in some cases “planned” and leading to “fortunate” results. The formation of heartwood in trees is a “planned” and active process within trees [28]. Additionally, mortality may have beneficial effects. The shedding of plant parts such as leaves is a biologically deliberate process that can help individuals tolerate either dry or cold periods and improve net carbon balance, as well as to limit the effects of damage caused by pathogens and herbivores [29,30,31,32]. Pruning of branches can increase the effectiveness of a tree’s capturing resources [33,34]. Even at the level of populations, mortality can be viewed as a necessary process in the sense that natural selection cannot occur without it. Changes in species composition over time, the process of succession, are due in part to mortality [35]. Adjustments to climatic change (natural or otherwise) can be limited by the lack of mortality [36]. Finally, given that resources such as nutrients are limited, one could argue that the mortality process, along with decomposition, is also necessary for these limited resources to be recycled to new biological entities [37]. These points suggest that considering mortality as something forest management must always reactively fix is not warranted.

3. Mortality as a Continuum

Examining the literature of mortality in forests, one can gain the distinct impression that mortality either occurs or is usual at some scales of time and space but not at others. Hence one can find a reference to litterfall and turnover versus regular (or normal or background) mortality versus disturbances throughout the literature. While we understand the separation of these processes (and we have used this scheme), we also believe that these divisions can hide the true nature of the mortality process: it occurs over a continuum, including multiple organizational biological levels and multiple scales of space and time. In the temporal dimension, mortality occurs as quickly as cell- or plant-part lifespan dictates and has gone on as long as life has existed on Earth. In the case of woody plants, the key community element of forests, that lifespan would be for ≈370 million years [38]. Spatially, forest-related mortality occurs within a fraction of milliliter at the level of cells in tissues to millions of square kilometers on the level of the globe. The latter would include all the “regular” mortality going on within the Earth, but also major mortality events caused by impact collisions with Earth. It should be noted that although large (>5 km diameter) asteroid/comet collisions with the Earth are infrequent, one estimate indicates there have been about 60 since the dawn of trees (i.e., once every 6 million years) [39].
In considering the impact of mortality, it is important to recognize that the perceived impact, much like the perception of disturbance [40], is dependent on the scale of observation. At very small spatial extents and short periods of time, the mortality of leaves can have an important impact on many physiological to ecosystem structures and functions. However, viewed over the course of many years and a larger extent, such as a stand of trees, the same process appears to be the regular and normal process called litterfall. The same is true for tree death with scattered individuals dying in a forest stand viewed as regular and normal, whereas an entire stand dying is viewed as irregular and abnormal to the degree it is often described as a catastrophic disturbance. However, viewed from a larger extent of space (i.e., landscape or region) and time (i.e., centuries), these catastrophic disturbances are frequent enough to be considered regular and normal [41]. This suggests that terminology that describes the particular mortality process would be more useful than those suggesting regularity and normality.
Ways need to be devised to integrate the various processes of mortality, with the aim of understanding how they contribute to this continuum of mortality. A preliminary example is provided in Figure 1 in which a simulation model (see Appendix A for details and Supplementary Material for access to model) was used to examine the total amount of mortality and the fraction contributed by different processes, including turnover of tree parts (i.e., litterfall), death of individual trees (i.e., “regular” mortality), and disturbances leading to the simultaneous death of multiple trees. At the level of a stand, disturbance-related mortality causes an occasional, unusual spike, whereas, for a landscape comprised of multiple stands, disturbance-related mortality pulses appear more frequently and cause less of a deviation from what might be considered “normal” or “regular” mortality (Figure 1a). Moreover, over the very long-term and broad spatial scale, disturbance-related mortality would theoretically represent a constant input (16% in this example (Figure 1b)). Examining the proportion contributed by “regular” versus disturbance-related mortality indicated that at the stand level, for the majority of the time, “regular” mortality was the only contributor with occasional events in which disturbance becomes the main contributor. Across a landscape of multiple stands, disturbance contributes to mortality in most years and occasionally accounts for the majority of tree mortality (25 out of 500 years). While hypothetical, this example illustrates how the perception of the importance of different mortality mechanisms changes with scale.
One can also use models to examine how these contributions might change with disturbance regime and the lifespan of woody parts (i.e., branches, coarse roots, and stems; Figure 2). This particular model indicated that as the frequency of disturbance decreased, as indicated by the increasing mean interval between disturbances, the proportion of mortality contributed by disturbance decreased. Additionally, as the disturbance severity increased, the proportion contributed by disturbances increased. Interestingly the mixed disturbance regime used to create Figure 1 had a higher proportion contributed by disturbances, indicating the effect of disturbances was largely an additive one. Given that forests are subject to multiple disturbances (e.g., pathogen and insect outbreaks, fire, wind), the contribution of disturbance to overall mortality in this example is likely underestimated.
Altering the maximum lifespan of branches, coarse roots, and stems also influence the proportion contributed by disturbance: increasing the maximum lifespan of these woody parts increases the contribution via disturbances. This response is likely due to the fact that increasing the maximum lifespan of woody parts also increases the size of the store that can be influenced by disturbance. In contrast, the absolute amount contributed via “regular” mortality is highly correlated with NPP (net primary production), and this does not change much with maximum woody part lifespan. Specifically, halving the woody part maximum lifespan results in a 10% increase in “regular” mortality of woody parts, but leads to a 45% decline in the fraction contributed by disturbance. Conversely, doubling the maximum lifespan of woody parts leads to a 33% decline in woody part mortality, but leads to a 60% increase in the fraction contributed by disturbance. While these conclusions are preliminary, they do provide a glimpse of the insights one could gain by viewing mortality as a continuum versus a process that only occurs at one level and scale.

4. Describing Mortality Statistically

To statistically model many biological processes, it is often sufficient to quantify the mean and some index of variability (e.g., standard error of the mean). The early literature on forest mortality noted that the variability of tree mortality was exceedingly high, and unusual events (e.g., the death of a single, large tree) in a plot could strongly influence the mean biomass mortality loss estimate to the degree that high values were often excluded from the analysis as “outliers”. This observation led toward efforts to determine tree mortality over longer periods of time (i.e., decades) and over larger spatial extents (i.e., multiple hectares) to derive better estimates of the mean and variability [1].
For many ecological variables, better quantification of the mean is the primary consideration and variation is secondary (in the sense it is used as an indicator of how well the mean is estimated). In the case of mortality, at least of trees, it has become apparent that to understand spatial and temporal patterns, the variation needs to be the primary consideration, and the mean is a secondary by-product of the variation. Stated another way, the central feature of mortality is the variation because the mean is not particularly useful for prediction on its own.
A statistical feature of tree mortality is that its mean and variation is highly dependent on the scale of observation. While many ecological variables follow this pattern, mortality always seems to come in pulses regardless of the scale examined. This stems from the fact that mortality at the level of individual tree death to regions is fundamentally an on or off (discrete) process. This is best illustrated by contrasting mortality to another ecosystem variable NPP by using an individual tree-based model and examining temporal variation at different levels (Figure 3; see Appendix A and Supplementary Material). At the level of individual trees, all trees grow at least part of a year, but only a few individuals die in a given year. This causes individual tree mortality to spike upwards periodically, but most years to have zero mortality. In addition, while mortality causes NPP to decline quickly, it gradually increases as a new tree regenerates in place of the one that died. Hence, NPP has a more continuous response than mortality. At the level of stands (in this case, comprised of 100 trees), mortality caused by disturbances can kill a large share of the trees resulting in upward spikes in mortality that rise above a lower background amount. As with individual tree death, stand-level disturbance causes NPP to suddenly decline, but tree regeneration allows it to return to pre-disturbance levels relatively quickly. At the level of landscapes, disturbances that involved a substantial fraction of the stands (in this case, 25%–50%) caused mortality to spike upward from the background level caused by individual tree- and stand-level disturbance. Similar to the lower levels, NPP was reduced by landscape-level disturbances, but the effect was dampened by the many stands not affected and the relatively rapid recovery of NPP.
This analysis suggests that to statistically model mortality at different levels, it is important to consider how mortality events introduced at each level are represented. For example, at the level of trees, there is an average annual probability of tree death, but it expresses itself as a discrete function with long intervals in which there is no mortality. At the level of stands, one can use an average probability to model individual tree death, but stand-level disturbances (i.e., in which multiple trees die simultaneously) need to be modeled as discrete events, again with potentially long intervals with no disturbance mortality. At the landscape level, individual tree mortality and that of within stand disturbances can be treated as average probabilities, but landscape level disturbances simultaneously involving multiple stands need to be modeled as discrete events. This approach contrasts with predictions from the law of large numbers: as one goes from trees to stands to landscapes, the variation in mortality should cancel out because the frequency of mortality events increases. However, this cancellation of variation does not necessarily occur because, while some mortality processes become substantially more frequent as one increases in scale, others do not.

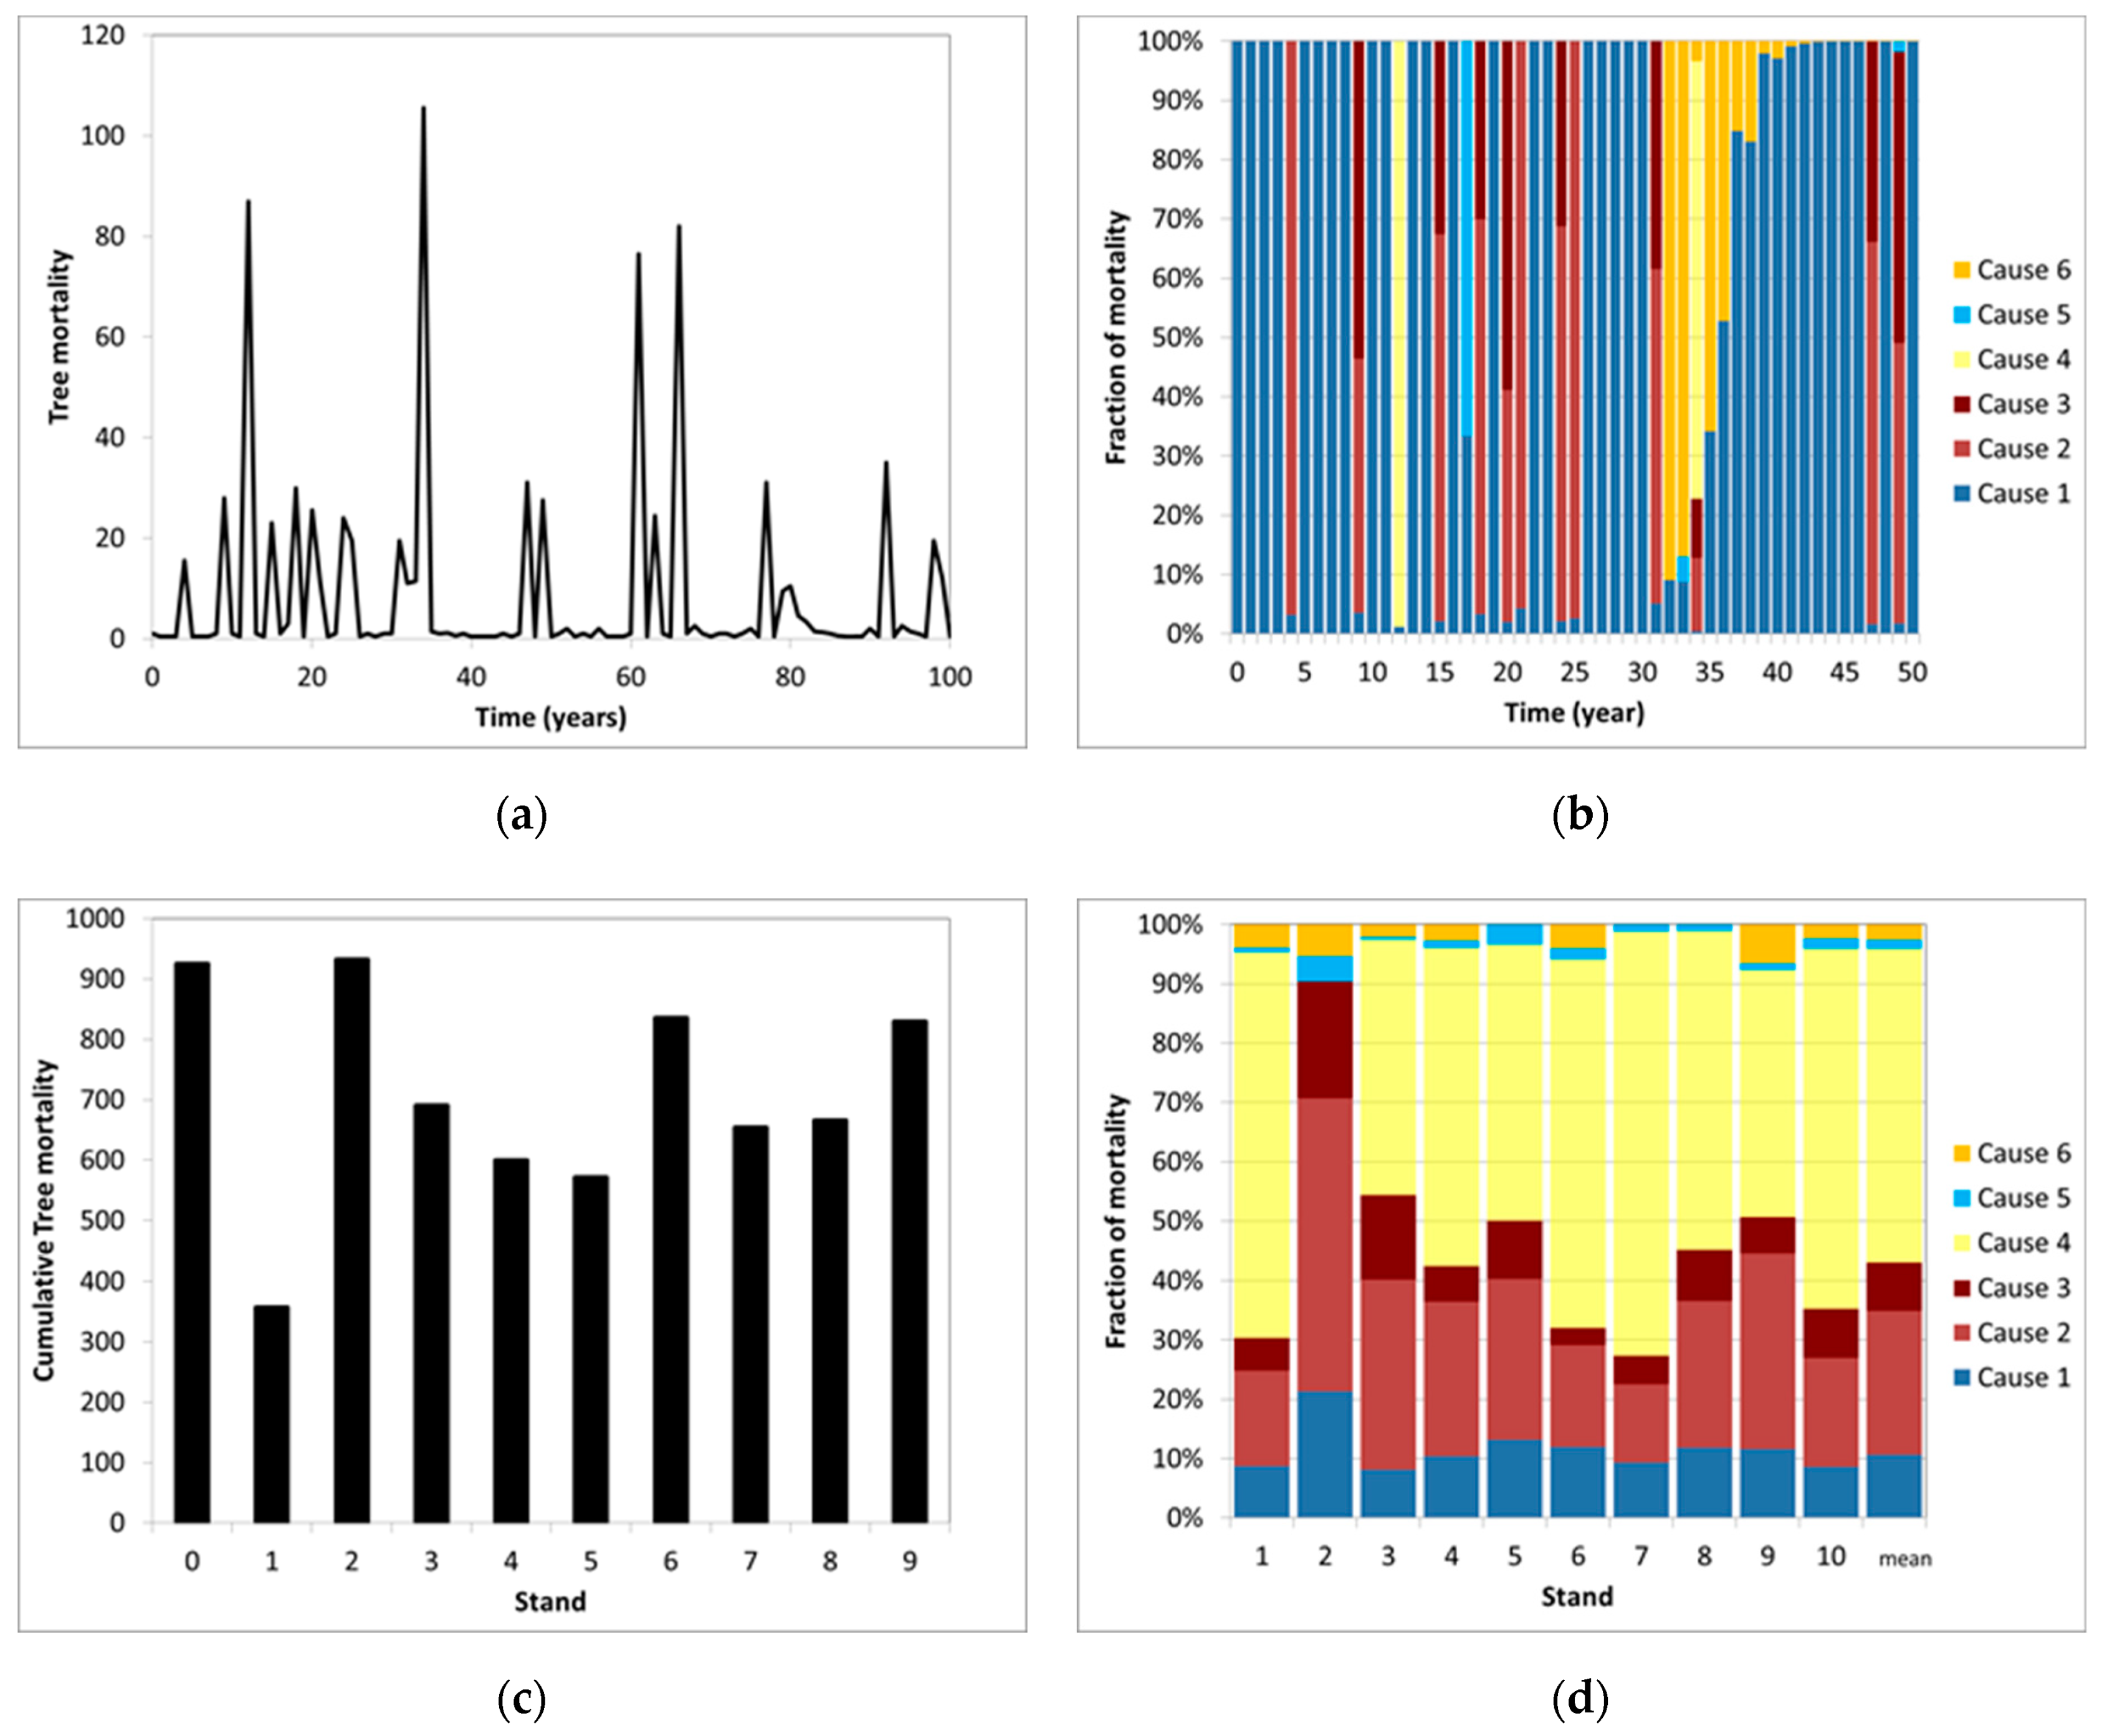
5. Causes of Mortality

While mortality is certainly a process, one must bear in mind that it encompasses a wide range of processes with different mechanisms, all leading to the same change in state (i.e., moving from alive to “dead”). These processes are assigned causes which may primarily originate within the forest (i.e., endogenous/autogenic) or from the outside (i.e., exogenous/allogenic), but all involve interactions of biotic and abiotic factors, and though human-related causes such as cutting and harvesting are often excluded, they certainly result in tree mortality. Hence the approach of “eliminating” (anticipated mortality by increasing harvesting) could lead to the same rate of tree death (albeit we readily acknowledge that it would change the amount utilized by humans). Although some causes are often thought of as relevant to certain stages of succession or management systems, it is probably more useful to recognize that many causes influence all forests. For example, although suppression/self-thinning is important in younger forests, other causes can also be important [42]. Certain causes of mortality are taken as a given (e.g., suppression), but as the time scale expands, other causes become more apparent. For example, asteroid impact mortality is rarely considered, but the 1908 Tunguska event, estimated to occur once every 250 years [39], killed ≈80 million trees over a 2150 km2 area [43]. Likewise, for many forested regions, mortality from volcanic eruptions can be quite consequential over long periods. The notable example of the 1980 Mt. St. Helens eruption killed, depending on the tree density assumed, 20–28 million trees over a 550 km2 area [44]. Over many thousands of years, it is likely that a considerable number of trees are killed by these processes.
While mortality has a large stochastic element at each scale it is examined, part of its apparent chaotic nature is due to the fact that multiple processes are involved. Each of these causes has different properties (Table 1), leading to very different spatial and temporal signatures. In Figure 4, six hypothetical mortality causes are predicted from relatively simple models involving different frequencies, severities, target sizes, and dependencies on previous disturbance (see Appendix A and Supplementary Material). Over time at the stand level, the amount of total mortality and the relative contribution from each cause was highly variable (Figure 4). Even when multiple stands were examined over a long period (e.g., 100 years), the amount and relative contribution of causes were potentially highly variable despite the fact they all represent the same system. This suggests that while one can report the amount and relative contributions for a particular time period or large area, to fully comprehend the potential mortality patterns that could occur, one will also need to more completely understand the features of more specific mortality mechanisms. It should be noted that while our “cause” model is highly theoretical, the results match those found in long-term observation systems (see [45] for one example).
In assigning causes, it is important to recognize that multiple steps or sub-processes may be involved. This has been represented by the conceptual model of either a decline or mortality spiral [1,46]. Mathematically this might be more aptly represented by a Markov chain with each step having a probability that when combined gives the overall probability of mortality. How this might impact mortality can be illustrated by the effect of a bark beetle outbreak, as this chain of events is well known [47]. The first step would be a triggering event, such as lightning strikes, blowdown, ice damage, or fires that creates a location (i.e., a weakened or recently dead tree) where the bark beetles can begin to multiply in their host tree species. As the next generation of bark beetles emerges, suitable host trees need to be available not only in terms of species but also size (i.e., these insects require a certain thickness of inner bark). Stressed trees are also important, because if trees can create sufficient pitch, then the beetles would be unable to reach the inner bark layer to reproduce. Once inside the tree, the formation of galleries can damage the inner bark to the degree roots receive less photosynthate, but this does not always lead to rapid death. Instead, it is the introduction of blue-stain fungi by the beetle that has that effect. If these fungi spread rapidly, the sapwood becomes blocked, greatly reducing the transpiration stream leading leaves to overheat and die. Leaf death then stops photosynthesis, and the rest of the tree gradually starves to death. The fact that so many steps are involved implies there are many points at which the process of bark beetle-related mortality can breakdown. For example: during the recent outbreaks in the Rocky Mountains, lodgepole pines (Pinus contorta) of small-diameter trees were generally not attacked [48]; bark beetle attacks of Sitka (Picea sitchensis) and Lutz (Picea × lutzii) spruce on the Kenai Peninsula do not necessarily lead to tree death because some species of fungus are not as pathogenic as others [49].
While our example is restricted to one cause, there is evidence it applies to others. For example, wind-related mortality is really a set of steps set off by wind damage that can extend for many years past the wind event, and in some cases, the death might occur so removed from the event that it might not be considered wind-related [45]. Another example is drought-related mortality, which is best viewed as the number of events and processes leading to death [50].
Given that mortality is the end of a series of events, it does not necessarily make sense to only list the ultimate cause of mortality as has been done traditionally. Rather, one needs to document the symptoms, conditions, factors that are associated with a particular cause of tree mortality. There are tangible benefits to the latter approach. For example, a major cause of mortality in large Douglas-fir (Pseudotsuga menziesii) is related to stem breakage at the base. Traditionally this was assigned the cause of wind-snap. However, by further describing the condition of these trees, it was discovered that most had an associated butt rot (Phaeolis schweinitzii) that had likely weakened the base of the tree to the degree it collapsed [1]. In fact, high wind speeds were not required for this to happen (one can hear these trees falling during still wind periods). Despite the need for this level of documentation, there are challenges: (1) not all the symptoms and conditions are obvious, (2) those that are present might be misleading as they represent post-mortality processes; (3) the multi-year intervals at which mortality is assessed can obscure many symptoms, especially when signs of a given agent are either fleeting or only present before death; (4) providing sufficient training to identify biotic causes such as pathogens is difficult to achieve.

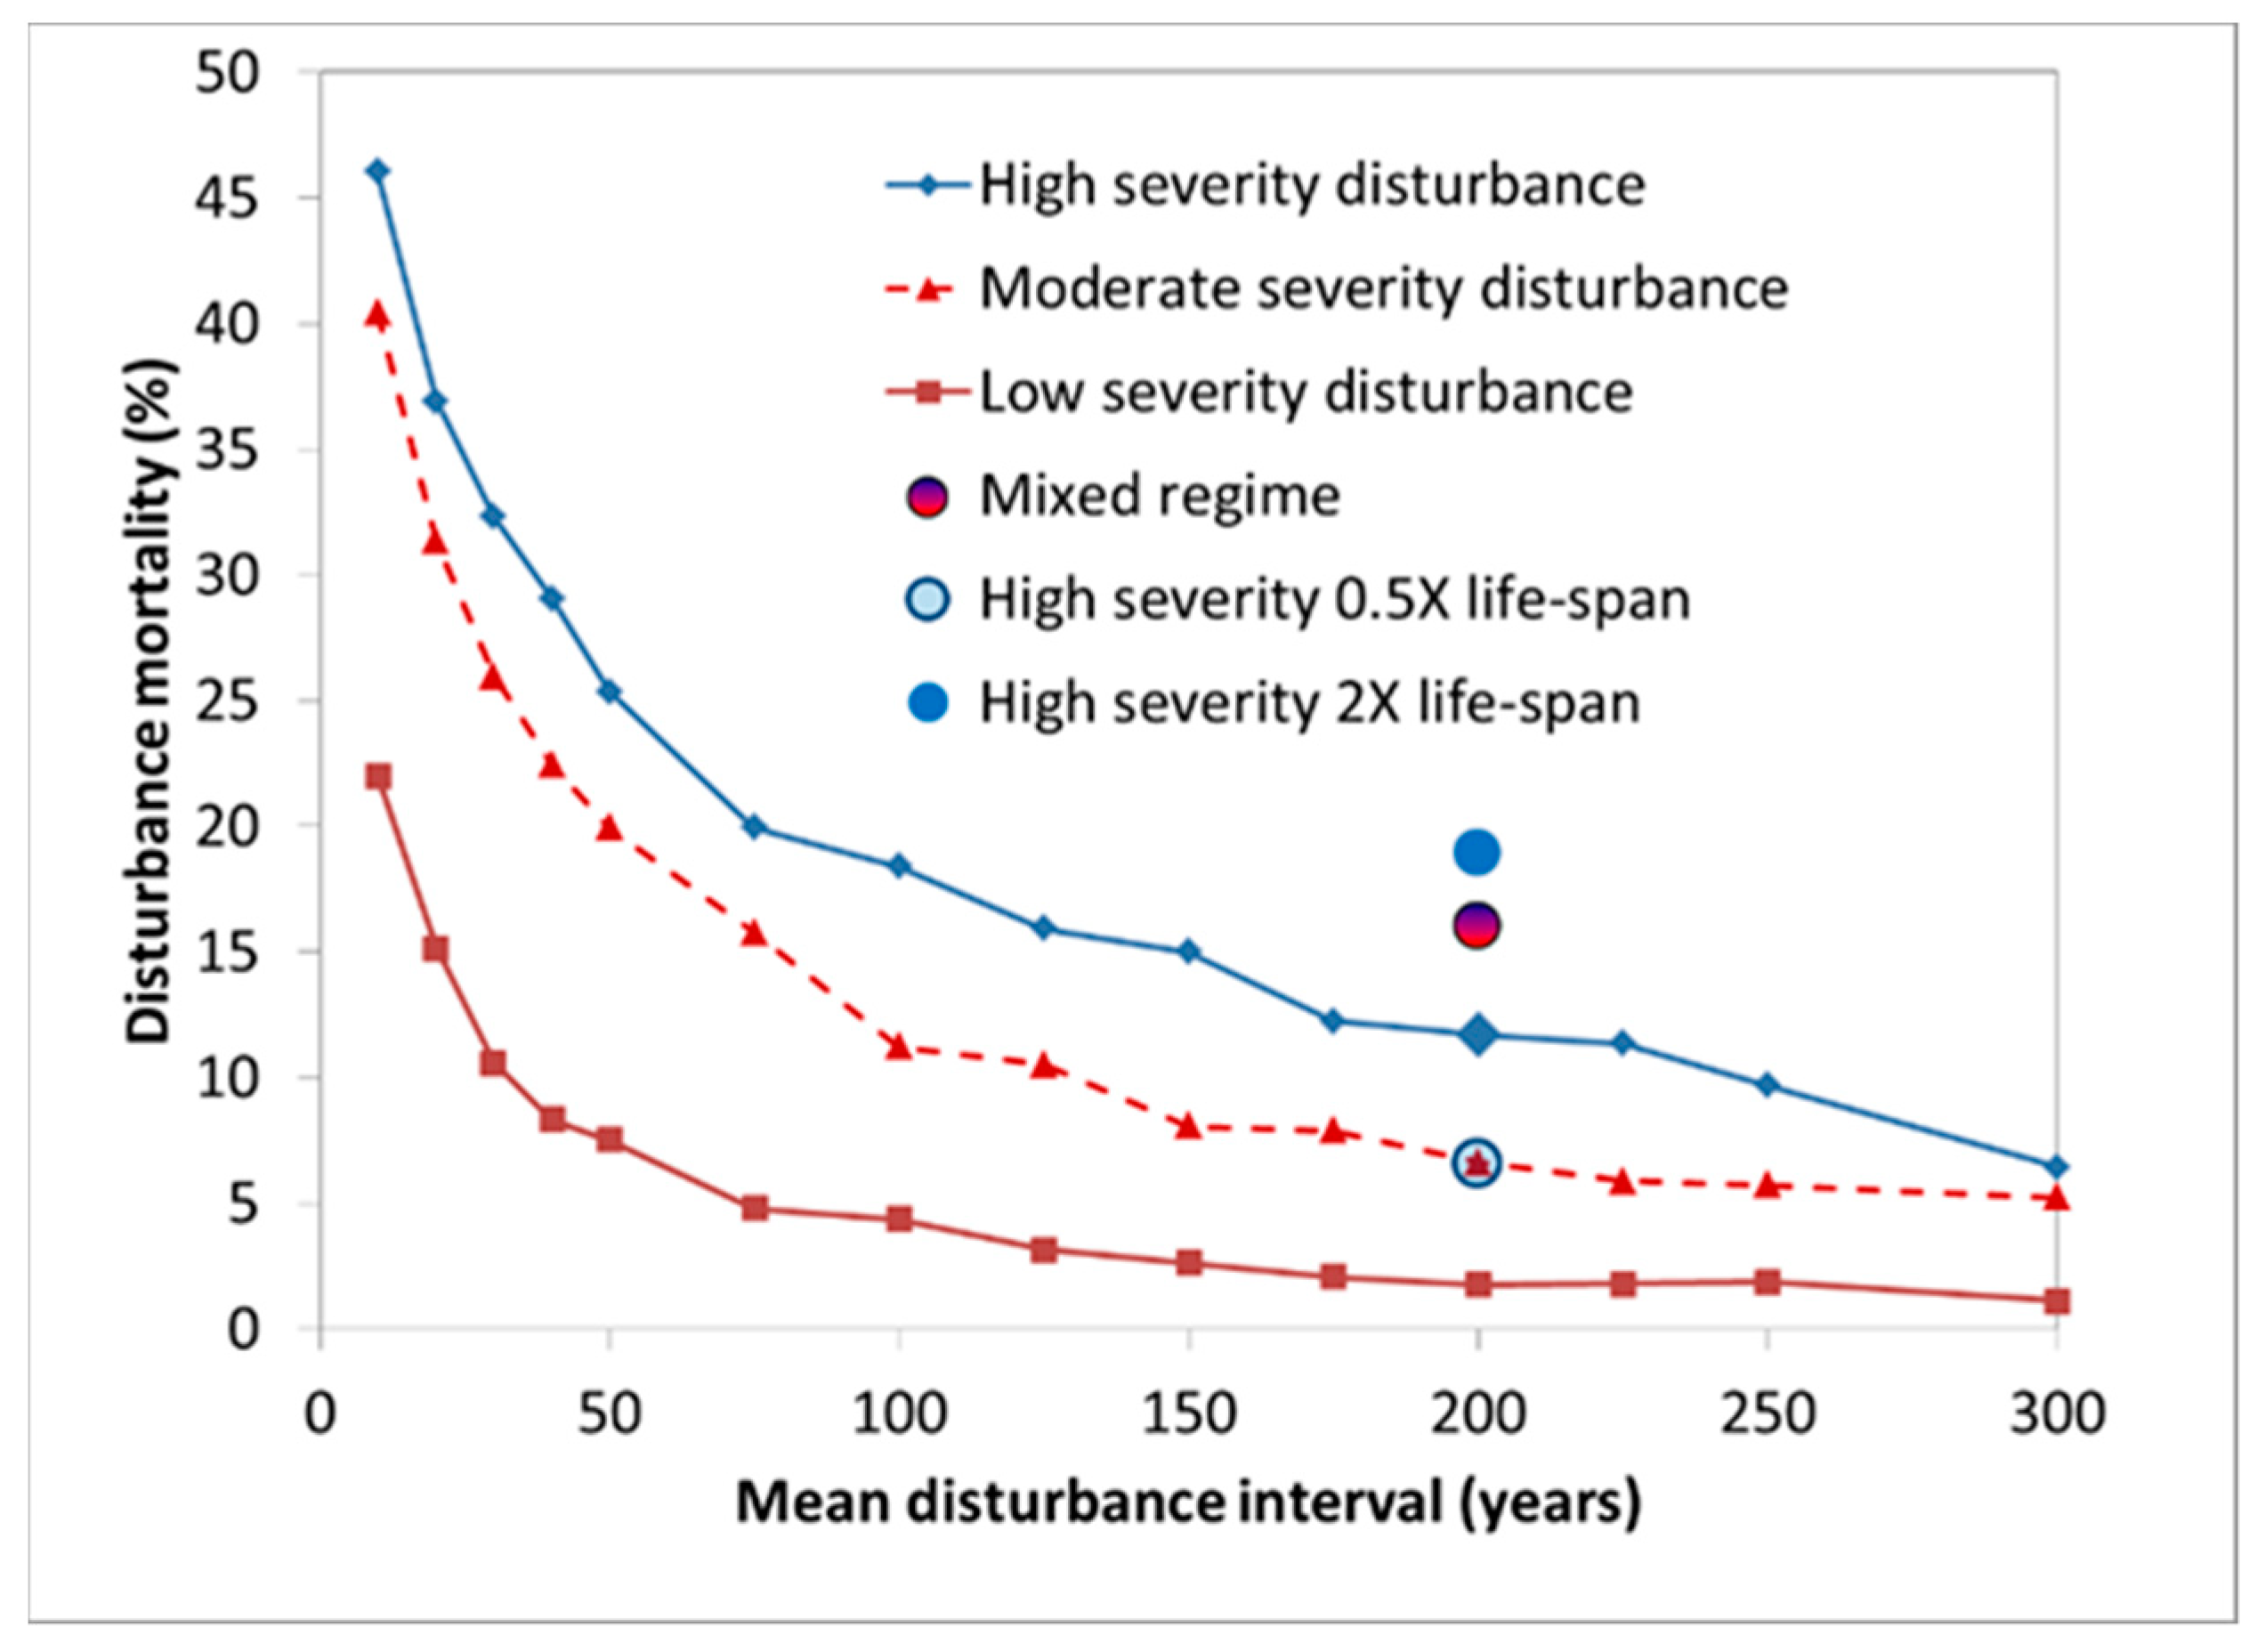
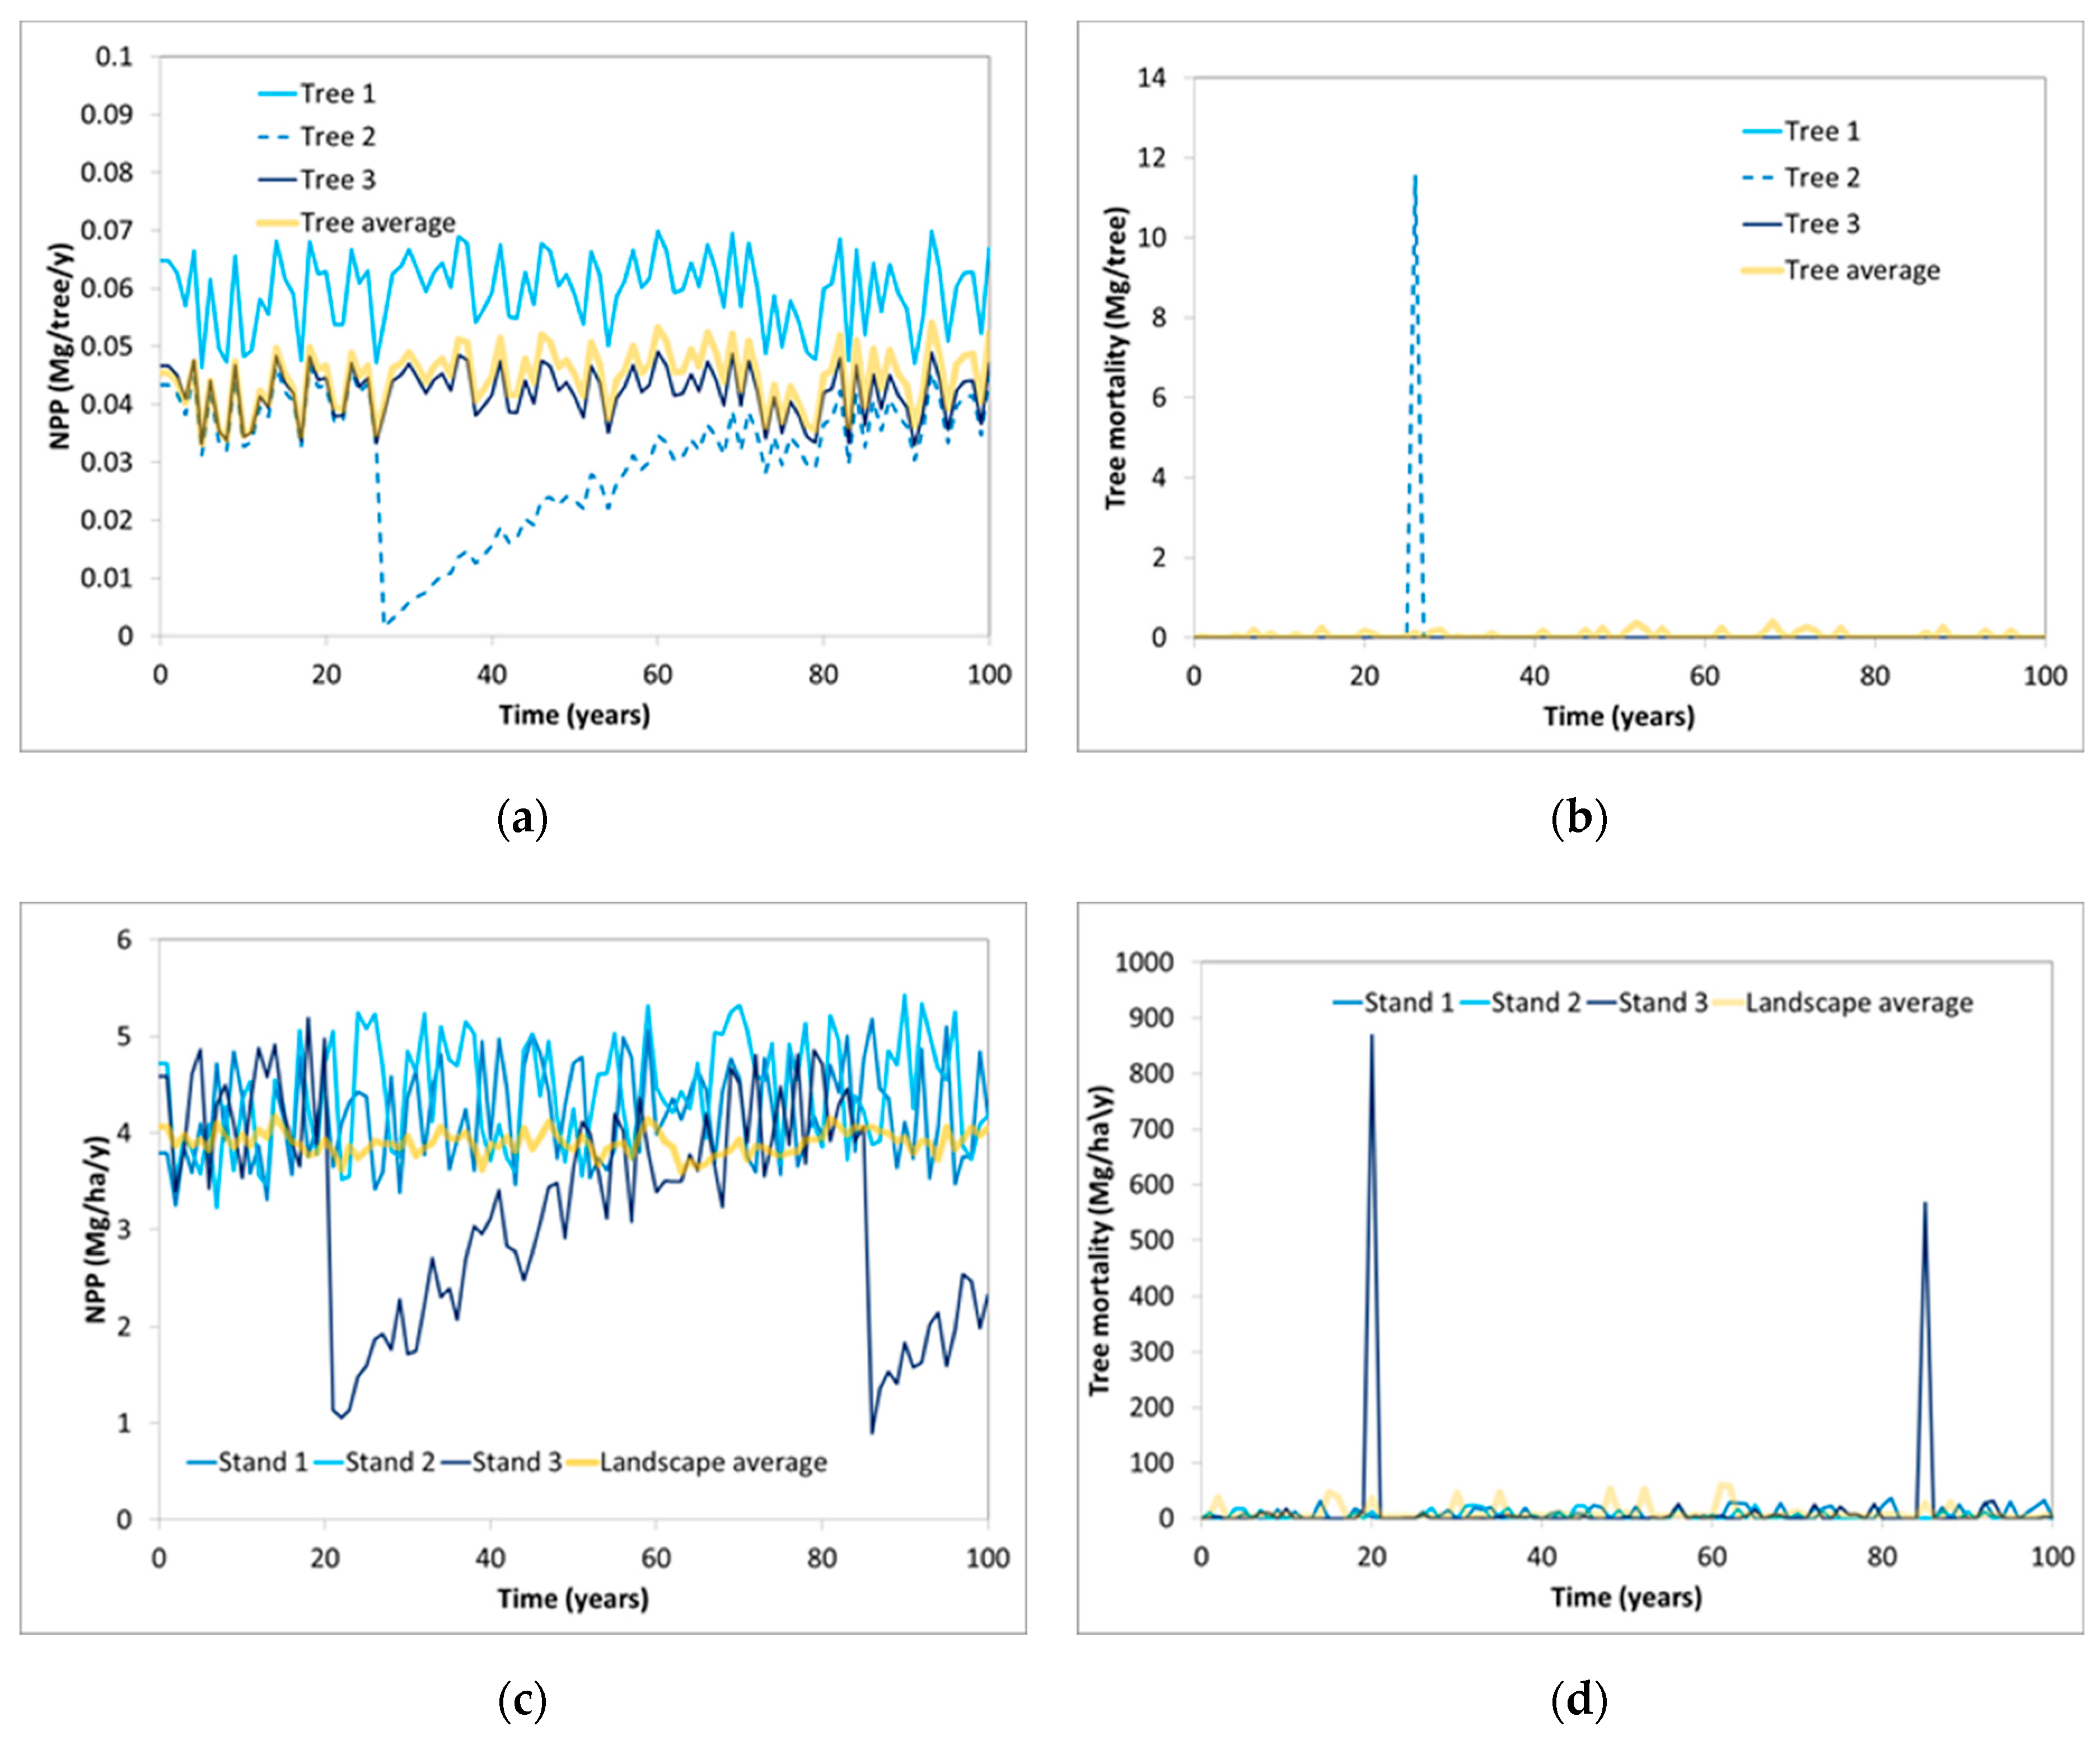
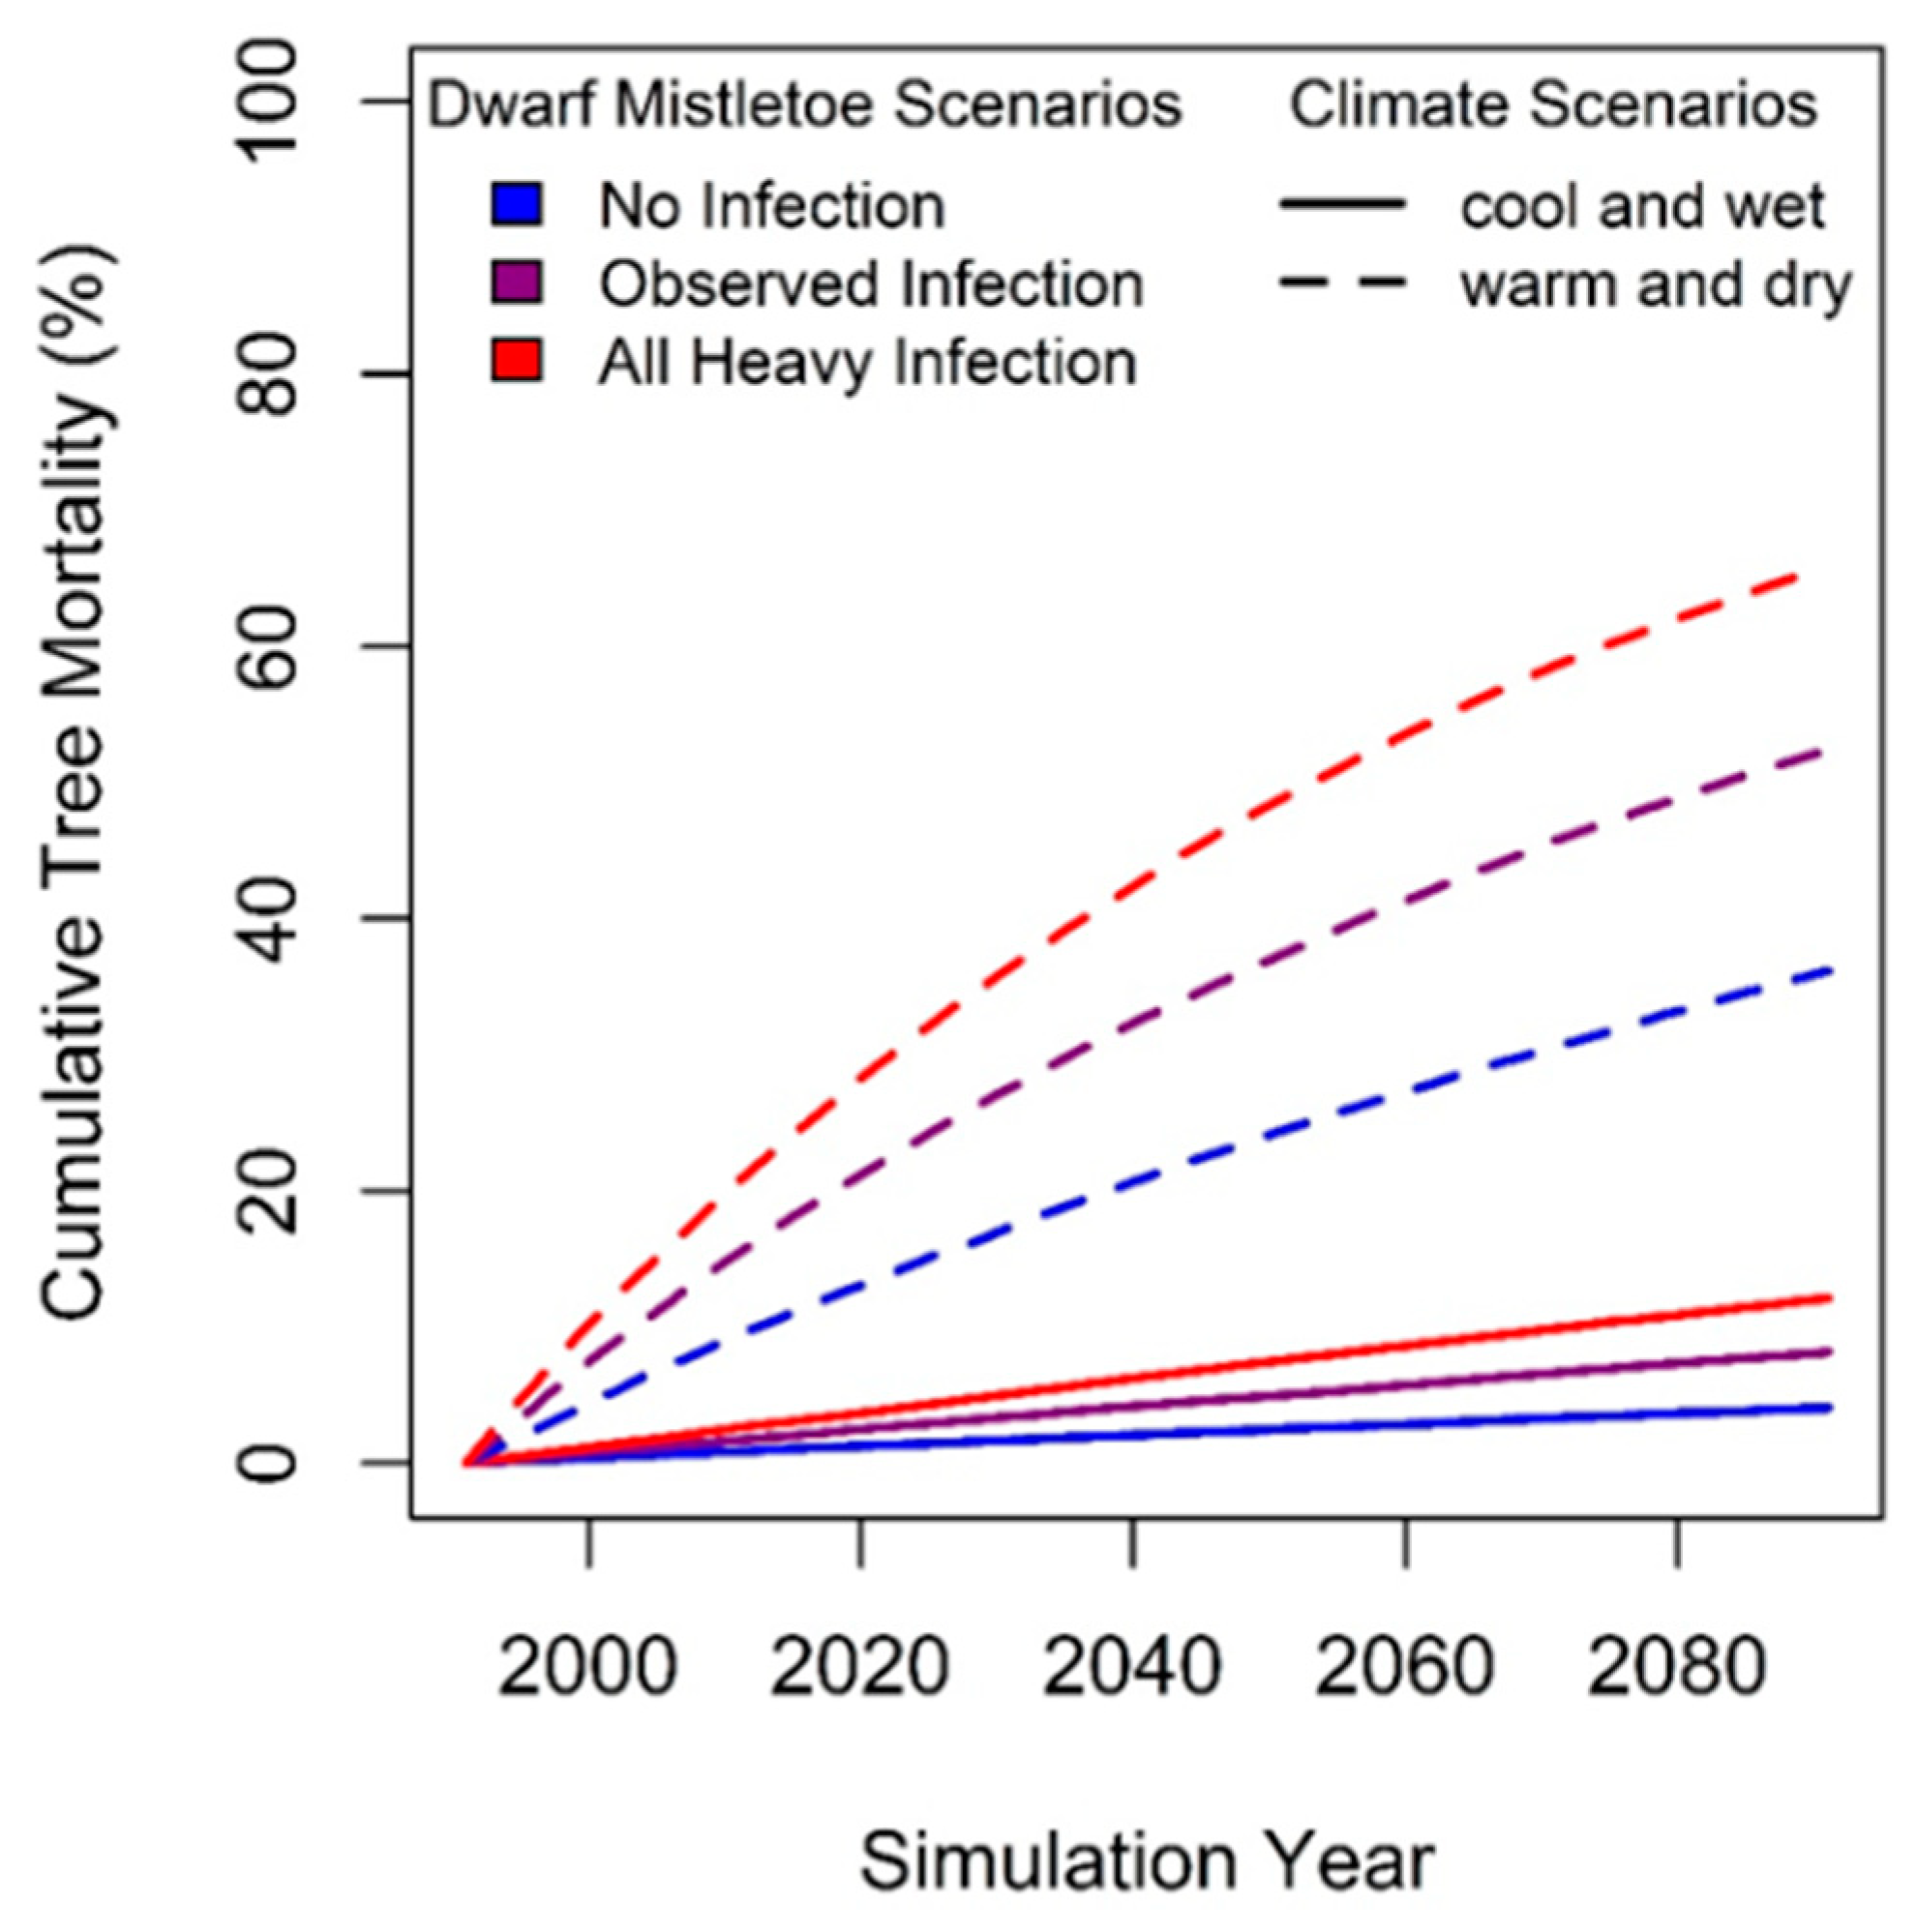
6. Modelling Mortality

The development of long-term observations over larger spatial extents has increased forest ecologists’ capacity to explain and model the variability of tree mortality as a function of tree growth and size (e.g., [51]) as well as environmental drivers (e.g., [52]). Still, variability in tree mortality patterns remains difficult to fully explain, and the resulting uncertainty remains a key challenge in forest ecology at several organizational levels. Although our intent is not to exhaustively review existing mortality models, we acknowledge that many such models have existed for a considerable time (e.g., [53,54]). Below we consider the merits of general types of approaches.
The simplest way to model mortality is as a fixed probability or fraction dying in a period. Specifically, the fraction of parts, probability of tree death, and probability of disturbance as determined from observations or life-history (i.e., maximum lifespan). The characteristics described in Table 1 can add realism to the simulation of temporal and spatial patterns, but this is essentially a static approach in that it cannot respond to changing situations. As such, it is not particularly useful to project future possible trends except those related to sensitivity analyses. Even when this approach is based on extensive data, it is very dependent on the particular combination of conditions encountered and hence challenging to apply to novel conditions [55,56].
To change over time, the mortality model must respond to the condition of the forest state or changes in external driving variables. An example of the former would be the use of tree size [57,58,59], growth rate [53,56], or both [51] to predict mortality. An example of the latter would be the use of the presence of drought to predict mortality [50]. In the case of fire, both can be used (presence of drought, state of the fuel, and tree properties) to determine the likelihood of mortality. As the different mortality causes are controlled by different factors, a series of mortality models need to be developed. Thus, although smaller trees are more likely to die from suppression [60] and fire [61], they are less likely to die from wind damage [62] and bark beetle attacks [48]. For example, joint modeling of disease infection and tree mortality in quaking aspen in the southwestern USA revealed differing influences of tree size, competitive environment, and climate on disease-related mortality of trees [63]. Hence, even though tree size may be useful in predicting mortality, it will express its effect differently for each cause.
Ideally, one would model the mortality of each class of causes as a set of processes that may or may not lead to mortality (e.g., [50]). Given the probabilistic nature of mortality, this set of processes might be best represented by some variant of a Markov chain. This is the most mechanistic approach but requires detailed data from observations and experiments whenever possible. However, having this level of detail might enable one to predict the timing and location of mortality events. Such approaches take advantage of information about predisposing factors, an idea that conceptually underpins the use of tree growth rates as predictors for tree mortality as it is assumed that growth rates integrate the diverse set of stressors of trees (e.g., [64]).
The use of information relevant to specific agents in tree mortality modeling can provide novel insights on how multiple agents may act synergistically. For example, the availability of repeated tree measurements spanning several decades (1991–2014) and assessment of infection severity by the parasitic plant dwarf mistletoe (Arceuthobium tsugense) on western hemlock (Tsuga heterophylla) trees in western Washington offer an opportunity to examine how both biotic agents and climatic stress can influence tree mortality [65]. Individual western hemlocks that were moderate-to-severely infected by dwarf mistletoe exhibited greater mortality under warm and dry conditions. Statistical models in that study quantified tree growth responses to dwarf mistletoe infection severity and tree mortality responses to tree growth in each of four different measurement intervals, ranging from cool and wet to warm and dry climate conditions. Based on those statistical models, we simulated tree growth and mortality for >1000 individual western hemlocks for 100 years under differing dwarf mistletoe and climate scenarios (Figure 5; see Appendix A). Both warm and dry conditions, as well as heavier dwarf mistletoe infections, resulted in greater cumulative mortality during these simulations. Because dwarf mistletoe effect magnitudes were often greatest during warm and dry measurement intervals [65], climate and dwarf mistletoe interactions appear to result in amplified cumulative effects on tree mortality. These results support the assertion that one tends to underestimate future tree mortality when one does not properly account for how future, hotter droughts will interact with existing stress agents [13]. It also implies that statistical modeling of tree mortality should not only strive to address differing mortality agents separately but also account for how multiple agents interact when possible.

7. Conclusions

Mortality in forest ecosystems has proven a challenging topic because of the lack of data as well as its inherent variability and apparent complexity. However, given the potential outcomes of a changing climate and other human-related changes (e.g., the movement of pathogens and insects), it is a topic that we clearly need to understand better in the future. In addition to gathering more data and conducting more experiments, we believe it is important to develop a better conceptual basis to interpret and analyze these findings. Key concepts include: (1) considering mortality as a general process that includes all forms of tree-related death ranging from parts of trees to large-scale disturbances; (2) viewing mortality along a continuum of scales and biological levels; (3) recognizing that mortality does not follow the law of large numbers because, regardless of the scale analyzed, consequential, infrequent episodes can occur; (4) many processes, each with its own set of controls, lead to complex mortality responses in forests; (5) analyzing and predicting mortality using a chain of events influenced by specific mechanisms. Together, these concepts should lead to a clearer understanding of mortality as well as the development of forest management that is more firmly based on science.

8. Patents

There are no patents resulting from the work reported in this manuscript.

Supplementary Materials

The following are available online at https://www.mdpi.com/1999-4907/11/5/572/s1.

Author Contributions

Conceptualization, M.E.H. and D.M.B.; methodology, M.E.H. and D.M.B.; software, M.E.H. and D.M.B.; writing—original draft preparation, M.E.H. and D.M.B.; writing—review and editing, M.E.H. and D.M.B.; visualization, M.E.H. and D.M.B. All authors have read and agreed to the published version of the manuscript.

Funding

This research was funded in part by funding from the United States Department of Agriculture Forest Service (19-JV-11261959-103), and the National Science Foundation Long-term Ecological Studies (DEB-1440409) and OPUS (DEB-1353159) Programs.

Acknowledgments

We wish to thank the three reviewers for their helpful comments.

Conflicts of Interest

The authors declare no conflict of interest.

Appendix A

Appendix A.1. Input Model

The model used to examine the impact of lifespan and disturbance on mortality inputs was programmed in Excel. It tracks NPP (net primary production), the allocation into, and mortality losses from three pools: leaves and fine roots, branches and coarse roots, and stems (i.e., boles).
NPP was a function of leaf and fine root stores, given that these parts control the acquisition of resources needed for photosynthesis. NPP increased as a function of leaf and fine root mass using the natural growth function. This allowed NPP to decrease because of disturbances but also allowed it to recover after disturbance. NPP was allocated to the different parts: in these simulations, it was assumed that leaves and fine roots received 50% of the allocation, whereas branches and coarse roots received 25% as did the stems.
Mortality was contributed by “regular” and disturbance processes, which were tracked separately. Regular mortality was controlled by the maximum lifespan of a pool. For woody parts, the rate of regular mortality was allowed to vary from year to year. For example, in the case of tree stems, regular mortality was allowed to vary 100%, which meant that in some years, no trees died, and in others, twice the average rate died. Disturbances occurred in some years and not others, with the frequency of disturbance determined by the mean interval of disturbance. The severity of disturbances was limited to a range, and for a specific year, a uniform distribution of random numbers was used to determine specific severity to be used (defined as the proportion of live stores dying. Disturbance mortality influenced the mass of all three pools—that is, the death of tree stems implied the death of leaves, fine roots, branches, and coarse roots.
The mass of each pool was determined by adding the input via NPP and subtracting the mass dying via different processes to the preceding mass of a pool.
To determine the fraction contributed by “regular” versus disturbance mortality for any given year, the amount for a process was divided by the total mortality in that year. To determine the contributions for a given simulation, “regular” disturbance, and total mortality was summed for the entire 500-year simulation period.
Given that the model contained a stochastic element for most forms of mortality, multiple simulations were averaged to determine a result, with 25–35 replications. The latter was used for infrequent disturbance regimes relative to the 500-year simulation period (i.e., >150 years).
The mixed disturbance regime used to generate Figure 1 combined a low severity (1%–25% dying) disturbance regime with a mean return interval of 100 years, and a high severity disturbance (75%–100% dying) regime with a mean return interval of 200 years.

Appendix A.2. Scaling Model

The model used to examine how mortality behaves at different levels of organization (trees, stands, landscapes, and regions) was programmed in Excel and was based on individual tree growing areas, somewhat akin to that used in a gap model. Each growing area was occupied by a tree, the size of which depended on the time since the last tree mortality event. That is, the model was set up so that a tree always occupied each growing area. One hundred tree growing areas were simulated for each stand, 25 stands were used to comprise each landscape, and three landscapes were used to comprise a region. Although our model had this structure, there is no reason that more involved ones, such as variable numbers of trees, stands, and landscapes, cannot be employed.
The mass of each tree in a growing area was tracked over time. This mass depended on the previous mass, the rate of input (NPP), and the loss via mortality. The input of trees was parameterized so that the total NPP would equal 5 Mg/ha/year. This resulted in a mean tree-level NPP of 0.05 Mg/tree/year. The NPP for a tree was dependent on the growing spot, the particular year, and the mass of the tree. It was assumed that tree to tree variation in NPP would be 20% (i.e., 80%–120% of the mean. This would reflect different growing conditions within the stand that persisted over time. A similar level of variation was assumed among years to account for the fact that some years would be more favorable for NPP than others. The dependence of input on tree mass reflected that larger trees tend to have a higher NPP (or growth) than smaller trees. This dependence was modeled by having NPP follow a natural growth function driven by the mass of the tree. It was assumed that when trees reached a mass of 10 Mg that NPP became constant.
As one preceded from individuals to stands to landscapes, a new set of mortality processes was introduced. At the level of individual trees, mortality was assumed to be complete and independent, generally occurring one tree at a time, although for some years, several trees could die at once by chance. This rate of mortality was determined by tree lifespan, which for these simulations was assumed to be 300 years. At the level of a stand, mortality events that involved more than one tree occurred in some years as defined by the mean interval between these small-scale disturbances (assumed to be 200 years in these simulations). These mortality events were independent among the 25 stands in a landscape, although, as in tree mortality by chance, there could be years in which more than one stand had this sort of mortality event. The fraction of trees subjected to simultaneous death in a stand was determined by the disturbance severity. In the simulations used for Figure 3, it was assumed that between 75–100 trees died in each stand-level disturbance. At the level of landscapes, multiple stands were programmed to have a stand-level disturbance in the same year. For one of the landscapes, it was assumed that 25% of the stands experienced this disturbance, in another 50%, and the other, these multi-stand disturbances did not occur at all except by chance.
Results were presented on a mass basis and not as a number of individuals. Stand level results were the sum of all trees in the stand; those at the landscape and regional levels were averages of the stands or landscapes within them, respectively. The mean tree values represented the average value for the 100 trees simulated in a stand.

Appendix A.3. Cause Model

The model used to examine how the causes of mortality influence the mass input to dead pools was programmed in Excel. It only considered the trees that died and not the trees that remained. At each time, six causes of mortality could kill variable numbers (or masses) of trees. Each of the causes of mortality had an average frequency of occurrence, a severity defined by the number of trees involved, a size adjustment that accounted for differences in whether it influenced small versus large individuals, and a dependence term. The dependence could be on either another disturbance occurring or the presence of disturbance in one year could lead to its presence in subsequent years.
The six causes of mortality represent different combinations of these terms:
Cause 1 occurs each year but has a low severity (1–2 trees) and influences the smaller trees. It would be most similar to suppression or self-thinning.
Cause 2 occurs on average once every 10 years, with moderate severity (10–20 trees), and involves trees of all sizes. This might represent a disturbance such as wind damage.
Cause 3 is triggered by Cause 2 but has a 50% chance of following Cause 2. It has half the severity of Cause 2 and kills trees larger than average. This might represent a cause such as a bark beetle outbreak, which requires trees to die to get started but requires conditions that are stressful to trees to kill additional trees. These conditions might not be present each year.
Cause 4 is a moderately frequent (every 20 years on average), severe disturbance that kills 75–100 trees of all sizes. This might be similar to a moderately severity fire or blowdown.
Cause 5 is similar to Cause 2 in terms of frequency but kills fewer trees (1–4) of all sizes.
Cause 6 is very infrequent (once every 100 years), but once established, it lasts 5 years, killing 5–10 trees of all sizes.
The occurrence of all causes except Cause 3 was determined randomly based on the frequency of occurrence. If a cause occurred, a random number of trees was selected within the severity range, and this was multiplied by the size adjustment that accounted for the fact that not all the trees dying would be the same size.
Each simulation involved 100 years. To represent different stands, separate runs were made.

Appendix A.4. Multi-Agent Hemlock Mortality Model

The simulation for western hemlock tree mortality was developed in R based on hierarchical Bayesian statistical models for tree growth and mortality fit to observations from Wind River Experimental Forest on the Gifford Pinchot National Forest in Washington state, USA [65]. For each individual tree in an observed population of 1395 large (>45.7 cm) western hemlock (Tsuga heterophylla), growth and mortality were simulated for each of 100 years starting in 1991—the year that dwarf mistletoe infection severity (dwarf mistletoe rating, or DMR) was measured. At the beginning of the simulation, all trees were alive.
During each year, the diameter growth of live tree i in plot j (yij) was simulated as a random draw from a normal distribution:
y i j ~ N ( β + i = 1 6 α k I ( D M R i j = k ) + γ j , σ 2 ) ,
where β was the intercept parameter, αk was the effect of DMR = k for tree ij on growth, I(•) was an indicator function, γj was a plot-level random effect, and σ2 was the variance. Plot-level random effects were generated at the beginning of the simulation and retained throughout all years so that differences among plots in terms of mean growth associated with other factors (soils, topography) were constant in time. Mortality for that tree in that year was modeled as a random draw from a Bernoulli distribution:
z i j ~ B e r n o u l l i ( θ i j ) ,
l o g i t ( θ i j ) = δ 0 + δ 1 y i j ,
where δ0 and δ1 are logistic regression parameters. Thus, dwarf mistletoe infection’s influence on mortality was mediated through tree growth, which included plot-level random effects and random error. When a tree died (zij = 1), that tree was removed from the simulation. When a tree did not die, growth was added to the tree’s previous diameter.
Simulations included three dwarf mistletoe infection scenarios and two climate scenarios. Dwarf mistletoe scenarios included (1) all trees uninfected by dwarf mistletoe (DMR = 0), (2) trees have observed dwarf mistletoe infection, and (3) all trees have a heavy infection by dwarf mistletoe (over 50% of branches infected in each of three equal portions of the tree crown; DMR = 6). Climate change scenarios were wet and cool vs. warm and dry and were represented by regression parameters from model fitting based on different measurement intervals. Wet and cool parameters for growth and mortality models were based on tree observations from 1991–1998 and 1998–2004, respectively. Warm and dry parameters for growth and mortality models were based on tree observations from 2004–2009 and 2009–2014, respectively. Simulations for each combination of dwarf mistletoe and climate scenarios were executed 40 times, with cumulative mortality rates averaged across simulations. Plot-level random effects were allowed to vary across simulations.

References

  1. Franklin, J.F.; Shugart, H.H.; Harmon, M.E. Tree death as an ecological process. Bioscience 1987, 37, 550–556. [Google Scholar] [CrossRef]
  2. Lancaster, K.F.; Leak, W.B. A Silvicultural Guide for White Pine in the Northeast; General Technical Report 41; Department of Agriculture, Forest Service, Northeastern Forest Experiment Station: Broomall, PA, USA, 1978; pp. 1–13.
  3. Kerr, G.; Haufe, J. Thinning Practice: A Silvicultural Guide; Forestry Commission: Bristol, UK, 2011; pp. 1–54.
  4. Prestemon, J.P.; Wear, D.N.; Stewart, F.J.; Holmes, T.P. Wildfire, timber salvage, and the economics of expediency. For. Policy. Econ. 2006, 8, 312–322. [Google Scholar] [CrossRef]
  5. Breshears, D.D.; Cobb, N.S.; Rich, P.M.; Price, K.P.; Allen, C.D.; Balice, R.G.; Romme, W.H.; Kastens, J.H.; Floyd, M.L.; Belnap, J.; et al. Regional vegetation die-off in response to global-change-type drought. Proc. Natl. Acad. Sci. USA 2005, 102, 15144–15148. [Google Scholar] [CrossRef] [PubMed] [Green Version]
  6. Hogg, E.H.; Brandt, J.P.; Michaelian, M. Impacts of a regional drought on the productivity, dieback, and biomass of western Canadian aspen forests. Can. J. For. Res. 2008, 38, 1373–1384. [Google Scholar] [CrossRef] [Green Version]
  7. Van Mantgem, P.J.; Stephenson, N.L.; Byrne, J.C.; Daniels, L.D.; Franklin, J.F.; Fulé, P.Z.; Harmon, M.E.; Larson, A.J.; Smith, J.M.; Taylor, A.H.; et al. Widespread increase of tree mortality rates in the western United States. Science 2009, 323, 521–524. [Google Scholar] [CrossRef] [Green Version]
  8. Allen, C.D.; Macalady, A.K.; Chenchouni, H.; Bachelet, D.; McDowell, N.; Vennetier, M.; Kitzberger, T.; Rigling, A.; Breshears, D.D.; Hogg, E.T.; et al. A global overview of drought and heat-induced tree mortality reveals emerging climate change risks for forests. For. Ecol. Manag. 2010, 259, 660–684. [Google Scholar] [CrossRef] [Green Version]
  9. Carnicer, J.; Coll, M.; Ninyerola, M.; Pons, X.; Sanchez, G.; Penuelas, J. Widespread crown condition decline, food web disruption, and amplified tree mortality with increased climate change-type drought. Proc. Natl. Acad. Sci. USA 2011, 108, 1474–1478. [Google Scholar] [CrossRef] [Green Version]
  10. Michaelian, M.; Hogg, E.H.; Hall, R.J.; Arsenault, E. Massive mortality of aspen following severe drought along the southern edge of the Canadian boreal forest. Glob. Chang. Boil. 2010, 17, 2084–2094. [Google Scholar] [CrossRef] [Green Version]
  11. Peng, C.; Ma, Z.; Lei, X.; Zhu, Q.; Chen, H.; Wang, W.; Liu, S.; Li, W.; Fang, X.; Zhou, X. A drought-induced pervasive increase in tree mortality across Canada’s boreal forests. Nat. Clim. Chang. 2011, 1, 467–471. [Google Scholar] [CrossRef]
  12. Williams, A.P.; Allen, C.D.; Macalady, A.K.; Griffin, D.; Woodhouse, C.A.; Meko, D.M.; Swetnam, T.W.; Rauscher, S.A.; Seager, R.; Grissino-Mayer, H.D.; et al. Temperature as a potent driver of regional forest drought stress and tree mortality. Nat. Clim. Chang. 2012, 3, 292–297. [Google Scholar] [CrossRef]
  13. Allen, C.D.; Breshears, D.D.; McDowell, N.G. On underestimation of global vulnerability to tree mortality and forest die-off from hotter drought in the Anthropocene. Ecosphere 2015, 6, 1–55. [Google Scholar] [CrossRef]
  14. Cohen, W.B.; Yang, Z.; Stehman, S.V.; Schroeder, T.A.; Bell, D.M.; Masek, J.G.; Huang, C.; Meigs, G.W. Forest disturbance in the conterminous United States from 1985–2012, The emerging dominance of forest decline. For. Ecol. Manag. 2016, 360, 242–252. [Google Scholar] [CrossRef]
  15. Orwig, D.A.; Foster, D.R.; Mausel, D.L. Landscape patterns of hemlock decline in New England due to the introduced hemlock woolly adelgid. J. Biogeogr. 2002, 29, 1475–1487. [Google Scholar] [CrossRef] [Green Version]
  16. Meddens, A.J.; Hicke, J.A.; Ferguson, C.A. Spatiotemporal patterns of observed bark beetle-caused tree mortality in British Columbia and the western United States. Ecol. Appl. 2012, 22, 1876–1891. [Google Scholar] [CrossRef]
  17. Herms, D.A.; McCullough, D.G. Emerald ash borer invasion of North America, history, biology, ecology, impacts, and management. Annu. Rev. Èntomol. 2014, 59, 13–30. [Google Scholar] [CrossRef] [PubMed] [Green Version]
  18. Perry, K.; Herms, D.; Klooster, W.; Smith, A.; Hartzler, D.; Coyle, D.; Gandhi, K. Downed coarse woody debris dynamics in ash (Fraxinus spp.) stands invaded by emerald ash borer (Agrilus planipennis Fairmaire). Forests 2018, 9, 191. [Google Scholar] [CrossRef] [Green Version]
  19. Meentemeyer, R.K.; Rank, N.E.; Shoemaker, D.A.; Oneal, C.B.; Wickland, A.C.; Frangioso, K.M.; Rizzo, D.M. Impact of sudden oak death on tree mortality in the Big Sur ecoregion of California. Boil. Invasions 2007, 10, 1243–1255. [Google Scholar] [CrossRef]
  20. Schlarbaum, S.E.; Hebard, F.; Spaine, P.C.; Kamalay, J.C. Three American tragedies, chestnut blight, butternut canker, and Dutch elm disease. In Exotic Pests of Eastern Forests Conference Proceedings1997 April 8–10; Britton, K.O., Ed.; US Forest Service and Tennessee Exotic Pest Plant Council: Nashville, TN, USA, 1998; pp. 45–54. [Google Scholar]
  21. La Porta, N.; Capretti, P.; Thomsen, I.M.; Kasanen, R.; Hietala, A.M.; Von Weissenberg, K. Forest pathogens with higher damage potential due to climate change in Europe. Can. J. Plant Pathol. 2008, 30, 177–195. [Google Scholar] [CrossRef]
  22. Westerling, A.L.; Hidalgo, H.G.; Cayan, D.R.; Swetnam, T.W. Warming and earlier spring increase western US forest wildfire activity. Science 2006, 313, 940–943. [Google Scholar] [CrossRef] [Green Version]
  23. Brando, P.M.; Balch, J.K.; Nepstad, D.C.; Morton, D.C.; Putz, F.E.; Coe, M.T.; Silvério, D.; Macedo, M.N.; Davidson, E.A.; Nóbrega, C.C.; et al. Abrupt increases in Amazonian tree mortality due to drought–fire interactions. Proc. Natl. Acad. Sci. USA 2014, 111, 6347–6352. [Google Scholar] [CrossRef] [Green Version]
  24. Negrón-Juárez, R.; Baker, D.B.; Zeng, H.; Henkel, T.K.; Chambers, J.Q. Assessing hurricane-induced tree mortality in US Gulf Coast forest ecosystems. J. Geophys. Res. Space Phys. 2010, 115. [Google Scholar] [CrossRef] [Green Version]
  25. Masek, J.G.; Huang, C.; Wolfe, R.; Cohen, W.; Hall, F.; Kutler, J.; Nelson, P. North American forest disturbance mapped from a decadal Landsat record. Remote. Sens. Environ. 2008, 112, 2914–2926. [Google Scholar] [CrossRef]
  26. Hartmann, H.; Schuldt, B.; Sanders, T.G.; Macinnis-Ng, C.; Boehmer, H.J.; Allen, C.D.; Bolte, A.; Crowther, T.W.; Hansen, M.C.; Medlyn, B.E.; et al. Monitoring global tree mortality patterns and trends. Report from the VW symposium ‘Crossing scales and disciplines to identify global trends of tree mortality as indicators of forest health’. New Phytol. 2018, 217, 984–987. [Google Scholar] [CrossRef] [PubMed] [Green Version]
  27. Harmon, M.E.; Franklin, J.F.; Swanson, F.J.; Sollins, P.; Lattin, J.D.; Anderson, N.H.; Gregory, S.V.; Cline, S.P.; Aumen, N.G.; Sedell, J.R.; et al. The ecology of coarse woody debris in temperate ecosystems. Adv. Ecol. Res. 1986, 15, 133–302. [Google Scholar]
  28. Bamber, R.K. Heartwood, its function and formation. Wood Sci. Technol. 1976, 10, 1–8. [Google Scholar] [CrossRef]
  29. Sobrado, M.A. Cost-benefit relationships in deciduous and evergreen leaves of tropical dry forest species. Funct. Ecol. 1991, 5, 608. [Google Scholar] [CrossRef]
  30. Eamus, D.; Myers, B.; Duff, G.; Williams, R. A cost-benefit analysis of leaves of eight Australian savanna tree species of differing leaf life-span. Photosynthetica 2000, 36, 575–586. [Google Scholar] [CrossRef]
  31. Villar, R.; Merino, J. Comparison of leaf construction costs in woody species with differing leaf life-spans in contrasting ecosystems. New Phytol. 2001, 151, 213–226. [Google Scholar] [CrossRef]
  32. Marchin, R.; Zeng, H.; Hoffmann, W. Drought-deciduous behavior reduces nutrient losses from temperate deciduous trees under severe drought. Oecologia 2010, 163, 845–854. [Google Scholar] [CrossRef]
  33. Mäkinen, H. Growth, suppression, death, and self-pruning of branches of Scots pine in southern and central Finland. Can. J. For. Res. 1999, 29, 585–594. [Google Scholar] [CrossRef]
  34. Kint, V.; Hein, S.; Campioli, M.; Muys, B. Modelling self-pruning and branch attributes for young Quercus robur L. and Fagus sylvatica L. trees. For. Ecol. Manag. 2010, 260, 2023–2034. [Google Scholar] [CrossRef]
  35. Shugart, H.H. A Theory of Forest Dynamics, the Ecological Implications of Forest Succession Models; Springer: New York, NY, USA; Berlin/Heidelberg, Germany; Tokyo, Japan, 1984; Volume 278, pp. 1–278. [Google Scholar]
  36. Zhu, K.; Woodall, C.W.; Ghosh, S.; Gelfand, A.E.; Clark, J.S. Dual impacts of climate change, forest migration and turnover through life history. Glob. Chang. Boil. 2013, 20, 251–264. [Google Scholar] [CrossRef]
  37. Duvigneaud, P.; Denaeyer-De Smet, S. Biological cycling of minerals in temperate deciduous forests. In Analysis of Temperate Forest Ecosystems; Reichle, D.E., Ed.; Springer: Berlin/Heidelberg, Germany, 1973; Volume 1, pp. 199–225. [Google Scholar]
  38. Beck, C.B. The appearance of gymnospermous structure. Boil. Rev. 1970, 45, 379–399. [Google Scholar] [CrossRef]
  39. Chapman, C.R.; Morrison, D. Impacts on the Earth by asteroids and comets, assessing the hazard. Nature 1994, 367, 33–40. [Google Scholar] [CrossRef]
  40. Pickett, S.T.; White, P.S. The Ecology of Natural Disturbance and Patch Dynamics; Academic Orlando: Orlando, FL, USA, 1985; pp. 1–472. [Google Scholar]
  41. Bormann, F.H.; Likens, G.E. Catastrophic disturbance and the steady state in northern hardwood forests, A new look at the role of disturbance in the development of forest ecosystems suggests important implications for land-use policies. Am. Sci. 1979, 67, 660–669. [Google Scholar]
  42. Lutz, J.A.; Halpern, C.B. Tree mortality during early forest development, a long-term study of rates, causes, and consequences. Ecol. Monogr. 2006, 76, 257–275. [Google Scholar] [CrossRef]
  43. Farinella, P.; Foschini, L.; Froeschlé, C.; Gonczi, R.; Jopek, T.J.; Longo, G.; Michel, P. Probable asteroidal origin of the Tunguska Cosmic Body. Astron. Astrophys. 2001, 377, 1081–1097. [Google Scholar] [CrossRef]
  44. Collins, B.D.; Dunne, T. Effects of forest land management on erosion and revegetation after the eruption of Mount St. Helens. Earth Surf. Process. Landforms 1988, 13, 193–205. [Google Scholar] [CrossRef]
  45. Harmon, M.E.; Pabst, R.J. The Long-Term Effects of Wind Disturbance on a Sitka Spruce-Western Hemlock Forest. Forests 2019, 10, 119. [Google Scholar] [CrossRef] [Green Version]
  46. Manion, P.D. Tree Disease Concepts; Prentice-Hall, Inc.: Englewood Cliffs, NJ, USA, 1981; pp. 1–399. [Google Scholar]
  47. Lieutier, F. Mechanisms of resistance in conifers and bark beetle attack strategies. In Mechanisms and Deployment of Resistance in Trees to Insects; Wagner, M.R., Clancy, K.M., Lieutier, F., Paine, T.D., Eds.; Springer: Dordrecht, The Netherlands, 2002; pp. 31–77. [Google Scholar]
  48. Shore, T.L.; Safranyik, L.; Hawkes, B.C.; Taylor, S.W. Effects of the mountain pine beetle on lodgepole pine stand structure and dynamics. In The Mountain Pine Beetle, a Synthesis of Biology, Management and Impacts on Lodgepole Pine; Safranyik, L., Wilson, B., Eds.; Canadian Forest Service: Victoria, BC, Canada, 2006; pp. 94–114. [Google Scholar]
  49. Solheim, H.; Safranyik, L. Pathogenicity to Sitka spruce of Ceratocystis rufipenni and Leptographium abietinum blue-stain fungi associated with the spruce beetle. Can. J. For. Res. 1997, 27, 1336–1341. [Google Scholar] [CrossRef]
  50. Anderegg, L.D.; Anderegg, W.R.; Berry, J.A. Not all droughts are created equal, translating meteorological drought into woody plant mortality. Tree Physiol. 2013, 33, 672–683. [Google Scholar] [CrossRef] [PubMed] [Green Version]
  51. Metcalf, C.J.E.; McMahon, S.E.; Clark, J.S. Overcoming data sparseness and parametric constraints in modeling of tree mortality, a new nonparametric Bayesian model. Can. J. For. Res. 2009, 39, 1677–1687. [Google Scholar] [CrossRef]
  52. Clark, J.S.; Bell, D.M.; Hersh, M.H.; Nichols, L. Climate change vulnerability of forest biodiversity, climate and resource tracking of demographic rates. Glob. Chang. Boil. 2011, 17, 1834–1849. [Google Scholar] [CrossRef]
  53. Monserud, R.A. Simulation of forest tree mortality. For. Sci. 1976, 22, 438–444. [Google Scholar]
  54. Lines, E.R.; Coomes, D.A.; Purves, D.W. Influences of forest structure, climate and species composition on tree mortality across the eastern US. PLoS ONE 2010, 5, e13212. [Google Scholar] [CrossRef]
  55. Hamilton, D.A., Jr. Extending the range of applicability of an individual tree mortality model. Can. J. For. Res. 1990, 20, 1212–1218. [Google Scholar] [CrossRef]
  56. Woodall, C.W.; Grambsch, P.L.; Thomas, W. Applying survival analysis to a large-scale forest inventory for assessment of tree mortality in Minnesota. Ecol. Model. 2005, 189, 199–208. [Google Scholar] [CrossRef]
  57. Monserud, R.A.; Sterba, H. Modeling individual tree mortality for Austrian forest species. For. Ecol. Manag. 1999, 113, 109–123. [Google Scholar] [CrossRef]
  58. Wyckoff, P.H.; Clark, J.S. Predicting tree mortality from diameter growth, a comparison of maximum likelihood and Bayesian approaches. Can. J. Forest. Res. 2000, 30, 156–167. [Google Scholar] [CrossRef]
  59. Temesgen, H.; Mitchell, S.J. An individual-tree mortality model for complex stands of southeastern British Columbia. West. J. Appl. For. 2005, 20, 101–109. [Google Scholar] [CrossRef] [Green Version]
  60. Eid, T.; Tuhus, E. Models for individual tree mortality in Norway. For. Ecol. Manag. 2001, 154, 69–84. [Google Scholar] [CrossRef]
  61. Reinhardt, E.D.; Keane, R.E.; Brown, J.K. Modeling fire effects. Int. J. Wildland Fire 2001, 10, 373. [Google Scholar] [CrossRef]
  62. Rich, R.L.; Frelich, L.E.; Reich, P.B. Wind-throw mortality in the southern boreal forest, Effects of species, diameter and stand age. J. Ecol. 2007, 95, 1261–1273. [Google Scholar] [CrossRef]
  63. Bell, D.M.; Bradford, J.B.; Lauenroth, W.K. Scale dependence of disease impacts on quaking aspen (Populus tremuloides) mortality in the southwestern United States. Ecology 2015, 96, 1835–1845. [Google Scholar] [CrossRef] [PubMed]
  64. van Mantgem, P.J.; Falk, D.A.; Williams, E.C.; Das, A.J.; Stephensen, N.L. The influence of pre-fire growth patterns on post-fire tree mortality for common conifers in western US parks. Int. J. Wildland Fire 2020. [Google Scholar] [CrossRef]
  65. Bell, D.M.; Pabst, R.J.; Shaw, D. Tree growth declines and mortality were associated with a parasitic plant during warm and dry climatic conditions in a temperate coniferous forest ecosystem. Glob. Chang. Boil. 2019, 26, 1714–1724. [Google Scholar] [CrossRef]
Figure 1. Example of viewing mortality as a continuum of multiple processes at three different scales: (a) Total mortality as the result of “regular” processes (leaf and fine root turnover, branch and coarse root pruning, and individual tree mortality) and disturbance. (b) The fraction of total mortality contributed by regular mortality processes. The model included two disturbance regimes: a low severity (1%–25% mortality) one with an average frequency of 100 years and a high severity (75%–100% mortality) one with an average frequency of 200 years. See Appendix A for more details about the model used.
Forests 11 00572 g001
Figure 2. The fraction of total mortality contributed by disturbances as a function of the mean disturbance interval and the severity of mortality. The low and high severity regimes are as for Figure 1; moderate severity disturbance had a mortality rate of 37.5%–62.5%. Each data point was the average of 25–35 simulations. The mixed regime is the one used in Figure 1. For those data points indicating 0.5× and 2× lifespans, the maximum lifespan of branches, coarse roots, and stems was either halved or doubled, respectively.
Forests 11 00572 g002
Figure 3. Hypothetical temporal variation in NPP (net primary productivity) versus mortality at three different levels of forest ecosystems: trees, stands, and landscapes: (a) NPP at level of individual trees, (b) mortality at level of individual trees, (c) NPP at level of stands, (d) mortality at level of stands, (e) NPP at level of landscapes and region, and (f) mortality at level of landscapes and region.
Forests 11 00572 g003aForests 11 00572 g003b
Figure 4. Hypothetical effect of combining various mortality causes that differ in terms of frequency, severity, size profile, and interdependence on total mortality mass input and a cause’s relative contribution. (a) Stand-level mortality input for each of 100 years, (b) relative contribution of a mortality cause each of the first 50 years, (c) cumulative stand-level input over 100 years for 10 stands, and (d) relative contribution of causes over a 100-year period for 10 stands. Cause 1 occurred each year but had a low severity (1–2 trees); Cause 2 occurred on average once every 10 years with a moderate severity (10–20 trees); Cause 3 was triggered by Cause 2, but had a 50% chance of following Cause 2; Cause 4 was a moderately frequent, severe disturbance (75–100 trees); Cause 5 was similar to Cause 2 in terms of frequency but killed fewer trees (1–4); Cause 6 was very infrequent (once every 100 years), but once established, lasted 5 years, killing 5–10 trees each year it was active.
Forests 11 00572 g004
Figure 5. Simulation results indicate that both dwarf mistletoe infection and warm and dry climates synergistically increase cumulative western hemlock tree mortality over 100 years. We present the mean cumulative percent tree mortality by year for 40 simulations of each dwarf mistletoe and climate scenario using the statistical models developed in [65].
Forests 11 00572 g005
Table 1. Key parameters needed to describe different mortality causes.
ParameterDescription
FrequencyNumber of events in a period of time defined by mean and variation
RegularityNature of the period between events (i.e., regular versus random versus aggregated)
ExtentArea impacted by the event, best represented by a frequency distribution
AggregationDegree events are spatially aggregated, independent, or regularly spaced
SeverityProportion of either population or mass impacted by mortality agent
Species selectivityDegree mortality agent is species-specific versus non-specific
Target sizeDegree mortality agent impacts different tree sizes (height, diameter)
InterdependenceDegree mortality agent depends on previous mortality event by either same or different agents.

