Article

Applying LiDAR to Quantify the Plant Area Index Along a Successional Gradient in a Tropical Forest of Thailand

by
Siriruk Pimmasarn
1,*,
Nitin Kumar Tripathi
1,
Sarawut Ninsawat
1 and
Nophea Sasaki
2
1
Department of Information & Communication Technologies, School of Engineering and Technology (SET), Asian Institute of Technology, Pathum Thani 12120, Thailand
2
Department of Development and Sustainability, School of Environment, Resources and Development (SERD), Asian Institute of Technology, Pathum Thani 12120, Thailand
*
Author to whom correspondence should be addressed.
Forests 2020, 11(5), 520; https://doi.org/10.3390/f11050520
Submission received: 31 March 2020 / Revised: 26 April 2020 / Accepted: 28 April 2020 / Published: 6 May 2020

Abstract

:
Long-term monitoring of vegetation is critical for understanding the dynamics of forest ecosystems, especially in Southeast Asia’s tropical forests, which play a significant role in the global carbon cycle and have continually been converted into various stages of secondary forests. In Thailand, long-term monitoring of forest dynamics during the successional process is limited to plot scales assuming from the distinct structure of successional stages. Our study highlights the potential of coupling airborne light detection and ranging (LiDAR) technology and stand age data derived from Landsat time-series to track back forest succession, and infer patterns in the plant area index (PAI) recovery. Here, using LIDAR data, we estimated the PAI of the 510 sample plots of a seasonal evergreen forest dispersed over the study area in Khao Yai National Park, Thailand, capturing a successional gradient of tropical secondary forests. The sample plots age was derived from the available Landsat time-series dataset (1972–2017). We developed a PAI recovery model during the first 42 years of the succession process. We investigated the relationship between the model residuals and PAI values with topographic factors, such as elevation, slope, and topographic wetness index. The results show that the PAI increased non-linearly (pseudo-R2 of 0.56) during the first 42 years of forest succession, and all three topographic factors have less influence on PAI variability. These results provide valuable information of the spatio-temporal PAI patterns during the successional process and help understand the dynamics of tropical secondary forests in Khao Yai National Park, Thailand. Such information is essential for forest management and local, regional, and global PAI synthesis. Moreover, our results provide significant information for ground-based spatial sampling strategies to enable more accurate PAI measurements.

1. Introduction

Among the world’s tropical forests, specifically Southeast Asia’s tropical forests are considered to contribute significantly to carbon storage and climate mitigation, but they also belong to the major deforestation areas [1,2]. After deforestation, these forests feature patches of deforested areas and various stages of recovered forest through succession [3,4], where each stage has different forest structural attributes, species diversity, species composition, and capability in the forest ecosystem [3,5].
Currently, collecting spatiotemporal data, data on patterns, and data on the rate of forest recovery still represent a challenge, especially in tropical forests, while it is required for a better understanding of the functionality and dynamics of forest ecosystems. For decades, many studies have attempted to explore the recovery of forests after disturbance [3,6,7]. Among the forest attributes, the leaf area index (LAI), defined as the one-sided leaf area per unit ground surface area [8,9], is one of the most significant biophysical variables [10] that is required for quantitative analysis of physical and biological processes related to vegetation dynamics and the modelling of ecosystem processes at local, regional, and global scales [11,12]. Therefore, long-term LAI monitoring following stand regrowth would further enhance our understanding of the dynamic changes in tropical forests and the climate impacts on tropical forest ecosystems.
Data on directly measured LAI in the field, especially in tropical forests, are very rare [13] due to the labor intensive work that is limited in time and space [14,15]. With the advancement of technology, indirect methods are now widely used, mainly through optical sensors such as the LI-COR LAI-2000 Plant Canopy Analyzer (which produced by LI-COR Inc., Lincoln, NE, USA) and digital hemispherical photography (DHP) [15,16]. However, the use of these methods is still limited in inaccessible sites, due to their spatial scale, and they often involve large uncertainties, especially related to the dense, tall, and heterogeneous canopies in tropical forests [14,15]. At regional and global scales, remotely sensed data meet the requirement for spatial and temporal estimates of LAI over large landscape areas. Most of the estimated LAIs via passive remote sensing data rely on the empirical relationships between field-based measured LAIs and spectral information [9,17,18]. Although passive satellite-based approaches are highly suitable for a wide range of observations, they suffer from several factors, such as weather conditions, the signal saturation of spectral reflectance in dense tropical forests, and an inability to capture the vertical LAI [10,19].
The light detection and ranging (LiDAR) technology collects the three-dimensional (3D) forest structure and helps to overcome many shortcomings of passive optical sensors. LiDAR has, hence, attracted much attention because of the advantage of monitoring forest structure and secondary succession of many different types [20,21,22]. Currently, LiDAR data is being widely and successfully used to derive LAIs [23,24,25]. In previous efforts, some studies estimated LAI from LiDAR data based on the empirical relationship between the ground-based measured LAI and LiDAR-derived metrics, such as mean height, maximum height, percentile height, and canopy density metrics [23,24,25]. Including the leaf, stems, twigs, and fine branches, the plant area index (PAI) is usually measured through the use of optical sensors and the value of PAI is comparable to the LAI value because leaf area is generally much larger than branch area, and the majority of branches are shaded by leaves [26]. With the advent of such voxel-based approaches, the term PAI instead of LAI was used. Due to a lack of recent literature on PAI, LAI will also be used for comparison where possible throughout the paper. Recently, voxel-based approaches have been developed to improve the estimation of PAI in tropical forests. With this approach, LiDAR data are reconstructed in the form of a 3D voxelized space of the forest structure and converted into PAIs by applying the Beer-Lambert law [27]. These approaches now become a promising method to obtain the PAI with high accuracy because they are not influenced by the orientation of the sun, or the spatial distribution, size, or shape of canopy components. Such methods can, thus, overcome the problem of the leaf clumping effect and signal saturation.
Although LiDAR data can be used effectively to retrieve the vertical PAI with high accuracy in tropical forests, they are limited in areas intended for long-term monitoring, as this technology is relatively costly. To investigate long-term PAI dynamics in successional gradients, data with a high temporal and spatial resolution is required. There are many studies that investigated the combination of high temporal resolution satellite images (e.g., Landsat) and high spatial resolution LiDAR data for estimating the dynamics of aboveground forest [28,29]. Recently, this approach has also been successfully applied to the assessment of forest aboveground biomass and its resilience in Thailand [30]. Until recently, however, there have not been any studies examining the long-term vertical PAI in successional gradients of tropical forests. Therefore, combining Landsat time-series datasets with high spatial resolution LiDAR data may be a promising way to achieve highly accurate PAI values for the past years along secondary forest successions.
The main aim of this study was to estimate the PAI and model the PAI recovery using LiDAR data combined with a Landsat time-series dataset in the secondary forest site in Khao Yai National Park, Thailand. Here, the landscape contains a mosaic of secondary forest with different ages surrounded by old-growth forest. The effects of topographic factors, including elevation, slope, and topographic wetness index (TWI) on the model residuals were also investigated. These factors are well known to influence forest growth and LAI, especially TWIs, which are widely used as topography-based indicator of soil-moisture. This is the first attempt to study the PAI and its recovery modeling in Thailand and Southeast Asian using LiDAR data in successional gradients.

2. Materials and Methods

2.1. Study Area

The study area is located in Khao Yai National Park in central Thailand (Figure 1). It covers an area of approximately 64 km2, with an elevation ranging from 700 to 800 m above mean sea level [7,31]. At this altitude, the forest is seasonal evergreen with a dry season from November to April. The average annual precipitation is ca. 2100 mm, and the annual temperature ranges between 19 to 28 °C [7]. This area has been strongly affected by anthropogenic activities since the end of the 19th century to the establishment of the park in 1962, mostly through low-intensity agriculture. Since 1962, some areas have been maintained through the practice of open fires (for space opening to accelerate the growth of natural grasses) by the park managers. Therefore, the study area is a landscape mosaic consisting of forest patches of different ages, even if old-growth or relatively mature forest dominates the landscape [32].

2.2. Field Datasets

Two forest inventory datasets with different successional stages were used in this study to estimate PAI change patterns with forest age. The first dataset included six inventory of 60 m × 80 m (0.48 ha) size, established from March to May 2013 [32]. These plots were located across the study area in different successional stages, including three plots in the stand initiation stage (SIS) and three plots in the stand exclusion stage (SES). The second dataset comprised a 30-ha Mo Singto plot, which is defined as old growth stage (OGS). The Mo Singto plot is a permanent plot established in 1996 in the Mo Singto area located in a large area of old-growth forest in the central part of Khao Yai National Park. This permanent plot is part of the global network of large forest plots of the Center for Tropical Forest Science (CTFS) of the Smithsonian Tropical Research Institute (STRI). The plot age was estimated by Chanthorn et al. [32], based on Landsat imagery and interviewing the old rangers, as 15–20 years for the SIS stage, 35–40 years for the SES stage, and more than ~200 years for the OGS stage. To homogenize its scale, the Mo Singto plot was subdivided into subplots of 0.5 ha, resulting in 60 plots with 50 m × 100 m.

2.3. Forest Age Datasets

The age of secondary forest pixels in the study area was obtained from Jha et al. [30], whose study was based on LiDAR and a Landsat time-series dataset (LTS). Jha et al. [30] employed a random forest algorithm to classify the Landsat time-series (1972 to 2017) dataset using training pixels derived from the mean height of the Canopy height Model (CHM) from LiDAR (2017) at a 60-m resolution. In total, 34 images from Landsat 1-3 MSS (1972–1983), Landsat 4-5 TM (1984–2011), and Landsat 8 OLI and TIRS (2013–2017) (http://glovis.usgs.gov) were classified into forest and non-forest areas with over 90% accuracy. Using 34 classified Landsat time-series images and applying the quality filters, Jha et al. [30] further selected 550 secondary forest pixels with various recovery ages, in which pixels experienced a shift from non-forest to forest areas. Methodological details on the classification and selection of secondary pixels with respect to age are given in Jha et al. [30].
Based on Jha et al. [30], and after excluding pixels that were not located in our footprint of 1 m LiDAR-derived CHM, we obtained 444 secondary forest pixels (LTS pixels) for use in this study.

2.4. LiDAR Data Acquisition

Airborne discrete return LiDAR (ALS) data was collected by Asian Aerospace Services Limited of Bangkok on 10 April 2017 over an area of 64 km2 (Figure 1c). LiDAR data was acquired using a RIEGL LMS Q680i full-waveform laser scanner (RIEGL Laser Measurement Systems GmbH, Horn, Austria), installed into a Diamond Aircraft “Airborne Sensors” DA-42 fixed-wing plane (Asian Aerospace Services, Bangkok, Thailand). The flight altitude was approximately 500–600 m above the ground level with a 60° field of view. The pulse repetition frequency was 400 kHz. The average point density was 22 pts m2. Post processing of LiDAR data, including point cloud classification into ground, non-ground, and noise removal were done by AAS engineering (Aerospace Services Limited) using TerraScan, Terrasolid Version 14 (Terrasolid Ltd., Helsinki, Finland).

2.5. Overall Methodology

Firstly, all the sample plot coordinates were used to extract the point clouds for estimating the PAI. Secondly, all sample plot point clouds were used to estimate the PAI using the Amapvox software [27] and R programming software (which created by Ihaka, R. and Gentleman, R., University of Auckland, New Zealand). Then, the PAI was used to generate a recovery model by plotting against stand age. Simultaneously, the point clouds were also used to generate the digital surface model (DSM), digital terrain model (DTM), and canopy height model (CHM). The topographic factors were extracted from the DTM using the RSAGA package in R (which developed by Alexander Brenning, Jena, Germany). Finally, the topographic factors were used to assess their impact on the variability of the PAI recovery model, while PAI data were used to assess the correlation with the CHM. The overall methodology is illustrated in Figure 2; details of the methodology are explained in the next sections.

2.5.1. LiDAR Data and Topographic Factors Extraction

The point clouds classified as ground were interpolated to generate a DTM at 1 m resolution. The point clouds classified as non-ground points were used to generated a DSM with the same spatial resolution. A 1 m resolution CHM was then computed by subtracting the DTM from the DSM. Finally, we used the CHM to extract the canopy height at the plot level for assessing the correlation between forest canopy height and PAI data.
For creating topographic factors, the elevation was derived directly from the DTM, while both slope and TWI were computed from the DTM as the primary attribute using the RSAGA package in R. The slope was defined at each point in the DTM as a function of a gradient in the X and Y direction [33]:
Slope = arctan ( fx ) 2 + ( fy ) 2
TWI was calculated by combining the slope angle and specific catchment area (SCA), where SCA is considered as the factor that describes the tendency of the area to receive water [34]. The equation for TWI is computed as follows:
TWI = l n ( SCA tan φ )
where ln is the natural algorithm, SCA is the specific catchment area, and φ is the slope angle.

2.5.2. Estimation of LiDAR-Based Plant Area Index

We estimated the PAI of 510 sample plots, including 444 60 × 60 m pixels for which a forest starting recovery date was available, six 80 × 60 m successional sample plots, and 60 old-growth plots with an area of 50 × 100 m. For each plot, we first extracted all ALS points whose projected coordinates fell within the pixels using R Second, each plot containing point clouds was contructed in a form of a 3D voxelized space (m3). Then, a local vegetation transmittance of each voxel was computed as the ratio of the sum of existing energy and the sum of entering energy normalized by the mean optical path length in each voxel, which was implemented in AMAPvox (version 1.3.5) [27], available at http://amap-dev.cirad.fr/projects/amapvox/files?sort=filename%2Csize. The equation for estimating transmittance P of an individual voxel is:
P = [ i n P F O u t i × S i × l i i n P F E n t i × S i × l i ] 1 1 n i n l i
where P is the transmittance, P F E n t i is the incoming fraction of pulse I, PFOuti is the exiting fraction of pulse i, li is the length of pulse i optical path, and Si is the cross section of a pulse at the voxel center.
To control the uncertainty in plant area density (PAD) estimation, which is related to low sampling intensity, the transmittance of each voxel was then refined using a hierarchical linear mixed model in R. Individual voxels, which were nested in a 5 × 5 × 5 m neighborhood, were treated as “random” effects, while the neighborhood was treated as a “fixed” effect. Subsequently, the PAD was computed for each voxel from the transmittance values by applying Beer-Lambert’s turbid medium approximation, assuming isotropic transmittance as shown in Equation (4) [27]:
P ( θ ) = e G ( θ ) . PAD . l
where P ( θ ) is the gap probability for inclination θ (view angle/shooting angle), G ( θ ) is the ratio of foliage area projected in direction θ to actual, and l is the optical path length.
Finally, the PAI values were obtained from the vertical integration of the PAD profiles (Figure 3).

2.5.3. Statistical Analyses

Nonlinear regression analyses were used to explore the change in PAI along the forest chronosequence. The PAI recovery model was, thus, of the form:
PAI = a + b ( T c ) + ε
where PAI is the Plant Area Index,   a , b , c are model parameters to be inferred, T is the forest age, and ε represents the model residuals.
For the statistical test, pseudo-R2 was used to assess the fitted non-linear model. To evaluate the effects of topographic factors (elevation, slope, and TWI) on the variation of the PAI (in terms of PAI residuals and PAI values) over 42 years and the correlation between PAI and CHM, correlation through stepwise multiple regression analysis were performed. PAI residual values of the PAI recovery model were individually regressed through ordinary least square regressions. All of the statistical analyses were performed using the statistical program R version 3.6.2.

3. Results

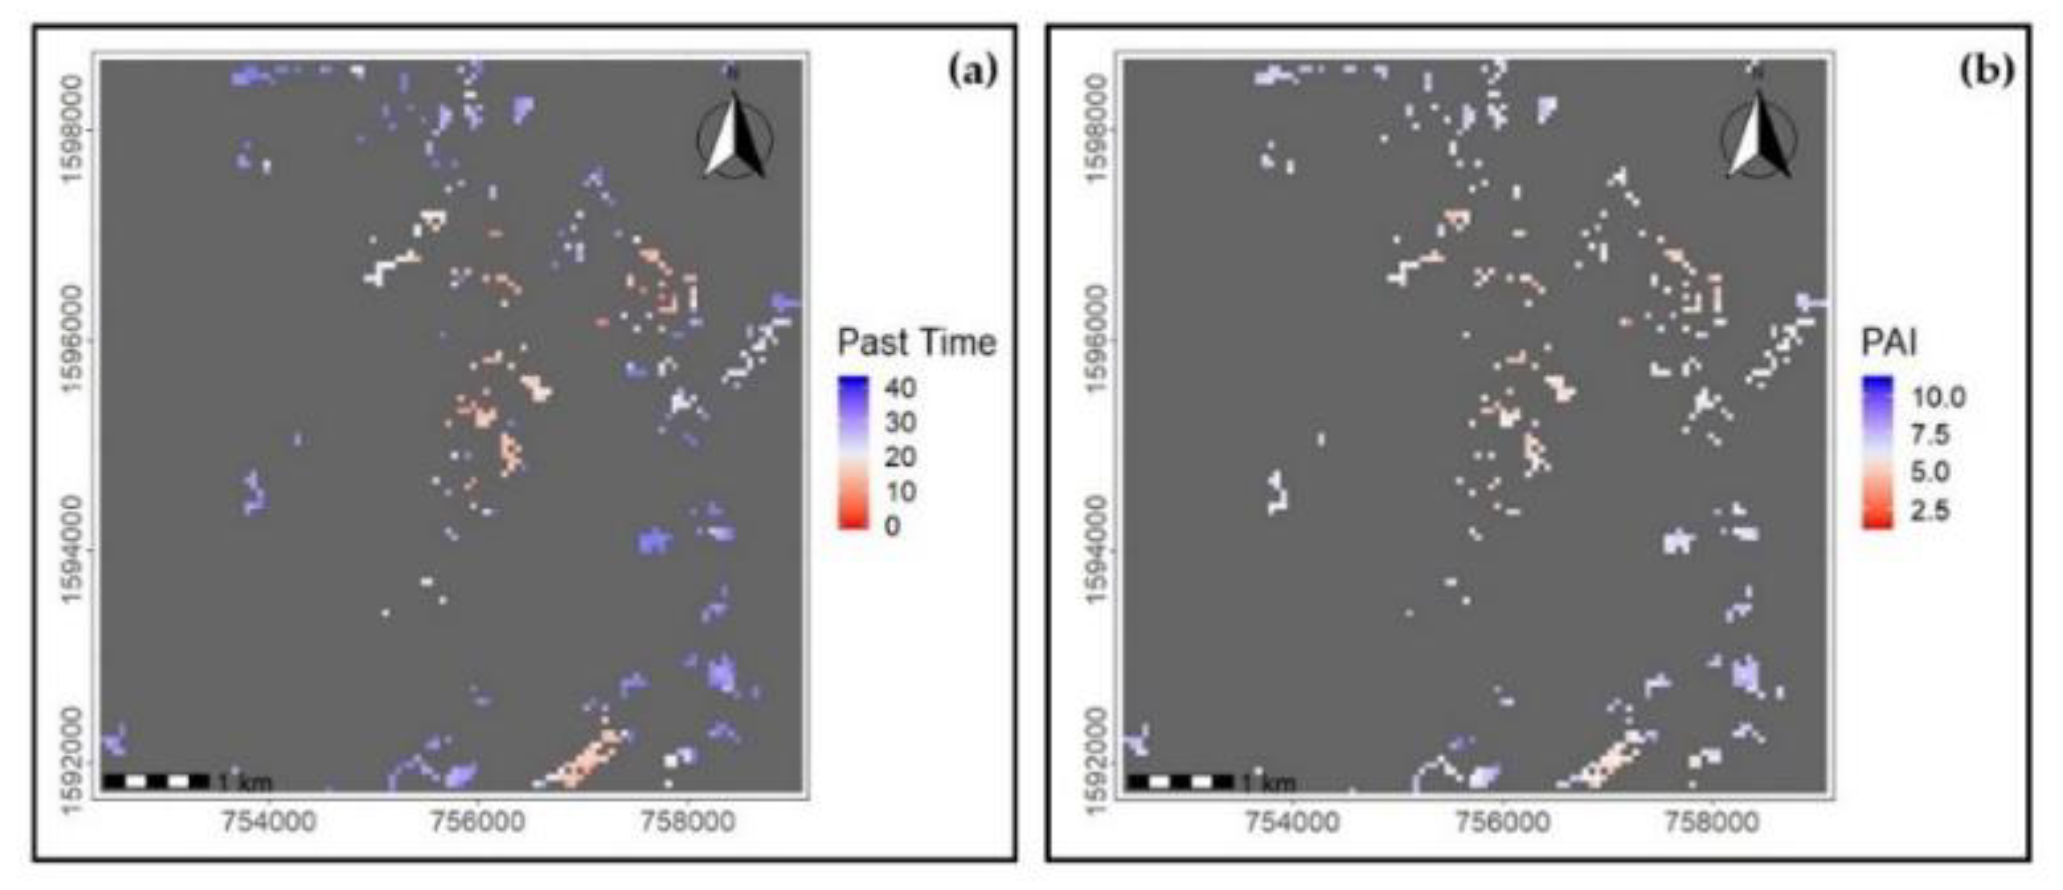
3.1. Forest Successional Structure and Spatial PAI Variability

An example of the three successional stand characteristics with the LiDAR-derived CHM and the frequency of canopy height per plot is shown in Figure 4. The LiDAR-derived CHM characteristics are clearly differed in each of the successional sample plots. The crown canopy size and tree height increased from the initiation to the old-growth stage following regeneration, while the canopy was dense in the exclusion stage only but sparse in the initiation and old-growth stages due to disturbed areas and gap formation. In addition, the canopy indicates the characteristics of forest succession by the vertical stratification along with its height. Both initiation and old-growth stages had a heterogeneous upper canopy surface due to canopy gaps and variations in height, while the exclusion stage showed a smooth upper canopy surface, with a lack of understory.
Table 1 shows the characteristics of the successional sample plots, including mean PAI, mean canopy height, and stand age. We found that the PAI values varied with forest successional stage, canopy height, and age. The PAI values were lowest in the initiation stage plots and higher in the stem exclusion and old-growth stage plots, respectively. Moreover, the tree canopy height indicated that the stand height increased following the stand development stage. This result indicates that PAI values increase when the tree height increases. For all sample plots (secondary successional plots, Mo Singto sample plots, and LTS plots), the values of the secondary successional plots and those of OGS plots seem to fit into the trend of the LTS sample plots (R2 0.75, p < 0.001; Figure 5). The mean PAI was 7.07 m2 m−2 and ranged from 2.69 to 11.02 m2 m−2 (s.d. =1.85 m2 m−2), while the mean canopy height was 16.57 m and ranged from 5.34 to 28.41 m (s.d. = 5.56 m).

3.2. PAI Recovery Analysis

The LiDAR-derived PAI recovery along the successional gradient is illustrated in Figure 6. The LiDAR-derived PAI of the plots ranged from 1.36 to 11.02 m2 m−2, with a mean of 6.81 m2 m−2. We found that the PAI accumulation increased non-linearly through time during the 42 years. The relationship between PAI and age was best modeled with a non-linear power model and an exponent higher than 1. However, as shown in Figure 6, the exponent value indicated a close to linear relationship with a pseudo-R2 of 0.56, indicating an increase in the PAI with recovery time during the 42 first years of the succession. Note that the model predicted a non-null PAI in year zero because we defined forests as areas with a mean top canopy height greater than 5 m, following the Food and Agriculture Organization of the United Nations (FAO) [35] definition of forests. After 20 years, the PAI was predicted to be 6.30 m2 m−2, and 7.58 m2 m−2 after 40 years. For the neighboring old-growth forest in which the forest age was more than 200 years, the median of the estimated PAI was 8.87 m2 m−2 and ranged from 8.05 to 10.63 m2 m−2 (Figure 6).
Topographic factors showed mixed effects on both the PAI values and residual values. As shown in Figure 7 and Table 2, a weak trend was observed in the relationship between both the PAI values and residual values, and topographic factors such as TWI, slope, and elevation. Results from the stepwise multiple regression analysis are shown in Table 2 and an interpretation is described below Table 2.
By the backward stepwise elimination method, the variable TWI was dropped from the PAI model, suggesting that TWI did not significantly influence PAI value. On the contrary, the slope had a significant and positive linear effect on the PAI value. When the slope increases by one unit, PAI is predicted to increase by 0.1016 unit on average, while controlling elevation.
Elevation had a significant quadratic effect on PAI (Table 2), where the effect of elevation on PAI varies by the level of elevation. Using differential calculus, the effect of elevation on PAI was expressed by the following equation:
Marginal effect of elevation on PAI = 2 × 0.0001977 × Elevation − 0.3090521
This implies that at elevation = 700, the effect of elevation was −0.0323, indicating that when elevation increases from 700 to 701, PAI is expected to decrease by 0.0323 on average, while controlling for slope. Likewise, we obtained the effect of elevation as −0.0125 at elevation = 750, 0.0073 at elevation = 800, 0.0270 at elevation = 850, and 0.0468 at elevation = 900. As elevation increases from 700, the effect on PAI is initially negative, but increases and reaches zero when elevation is between 780 and 790. Thereafter, the effect turns positive and continues increasing. In other words, the PAI value took its minimum when elevation was between 780 and 790.
Likewise, the backward stepwise elimination method was used to analyze the PAI residuals after the time variable was accounted for. In this analysis, the slope variable was dropped, suggesting that slope did not significantly influence PAI residual. This also implies that time and slope were correlated.
TWI had a significant and negative linear effect on PAI residual. When TWI increases by one unit, PAI residual is predicted to decrease by 0.1104 unit on average, while controlling elevation. Elevation was not statistically significant at 5% significance level. This can mean that elevation had no significant effect on PAI residual. If we consider a 10% significance level, then quadratic effects were identified, where the effect of elevation on PAI residual varies by the level of evelation. Using differential calculus, the effect of elavation on PAI residual was expressed by the following equation:
Marginal effect of elevation on PAI = 2 × (−0.0001096) × Elevation + 0.1583402
This implies that at elevation = 700, the effect of elevation was 0.0049, indicating that when elevation increases from 700 to 701, PAI residual is expected to decrease by 0.0049 on average, while controlling for TWI. Likewise, we obtained the effect of elevation as -0.0061 at elevation = 750, −0.0170 at elevation = 800, −0.0280 at elevation = 850, and −0.0389 at elevation = 900. As elevation increases from 700, the effect on PAI residual is initially positive, but decreases and reaches zero when elevation is between 720 and 730. Thereafter, the effect turns negative and continues increasing. In other words, PAI residual took its maximum when elevation was between 720 and 730.

4. Discussion

4.1. Spatial PAI Variability

The spatial variability in the PAI was derived from the LiDAR-derived PAI for all sample plots. For successional sample plots, we found that the PAI values differed greatly among the three successional stages, which related to canopy height and stand age. The PAI values were higher in old-growth plot than in stem exclusion and stand initiation stage plots (Table 1). The old-growth stage included a larger number of tall trees with random gaps, while the stem exclusion stage included trees with a smaller crown size and lower height, and the stand initiation stage included the smallest and lowest number of trees (Figure 4). This result indicates that differences in forest structure have a strong impact on the PAI value. For the LTS plots, the results also showed that the older areas had higher PAI values (Figure 8a,b). For all 510 plots, the PAI varied from 2.69 to 11.02 m2 m−2 (mean = 7.07). The coefficient of variation was 26.12%, indicating a high spatial variability of the PAI at the investigated sites. Compared to other studies, our PAI values were in the range (2.66–12.94) reported by Clark et al. [36], who conducted the first direct measurements in the heterogeneous landscape of the tropical forest, and Vincent et al. [27] and Tang et al. [22], who both obtained PAI via LiDAR technology. With respect to the tree height, the relationships between the PAI and CHM were significant (R2 = 0.75, p-value = 0.001) (Figure 5), indicating that the stand height is a key variable in understanding the spatial distribution and variability of the PAI over large areas.

4.2. Long-Term PAI Accumulation Through Succession

The LAI is considered to be one of the most valuable determinants of forest growth and productivity. At the same time, long-term monitoring during the succession of the LAI in tropical forests is very scarce. We demonstrated that the combination of LiDAR and data of the classified forest age obtained from time-series Landsat data can quantify the long-term PAI accumulation over 42 years of succession in a tropical moist forest in Khao Yai National Park, Thailand. As a result, our analyses showed that a non-linear power model with an exponent greater than 1 was the best fit to our data, indicating an increase in the PAI during the first stage over the 42 years of succession (Figure 6). In agreement with the model, the estimated PAI of the successional field plots, which were used for validating our model, also showed that the PAI increment following the succession stages and their values were close to our predicted PAI (Figure 6). In addition, our study showed that the PAI increased gradually in the first 20 years and continued to increase twofold after 40 years. Compared to the PAI estimated for adjacent old-growth forests (mean = 8.92 m2 m−2, more than 200 years), the average PAI (mean = 8.07 m2 m−2) after 42 years of succession decreased by 0.85 m2 m−2. These differences were very small when compared to the deviation in forest age. Accordingly, our results suggest that the PAI would increase rapidly during the first 42 years of forest succession, while it would only slightly increase thereafter and remain constant afterwards. In tropical forests, LAI predictions along successional gradients, assuming the distinct structure of successional stages or ages, are limited and were only reported on the plot scale (mostly ~0.5–1 ha). Chanthorn et al. [7] reported that the estimated LAI differed considerably between successional stages, i.e., 3.83, 5.47, and 3.81–5.74 m2 m−2 for very young forests, smooth young forests, and old-growth forest, respectively. Although we conducted our study in the same study area, the LAI is very different due to the different methodology and sensor used. Tang et al. [22] reported that LAI values were estimated to be 1.74, 5.20, and 5.62 m2 m−2 for open pasture, secondary forest, and old-growth forests, respectively. These studies showed a similar pattern when compared to our study, i.e., the LAI increased rapidly during successional stand development, and, then, the increase weakened during the transformation of secondary to mature forests. However, the estimated LAI values of these studies differs greatly from that of our study (Table 1), and the rate of recovery remains unclear because the LAI values were estimated with a different methodology, successional stage definition, and in a different study site.

4.3. Topographic Factors Influence the Variation in the PAI Increase

Topographic factors were found to be critical factors in determining the variation in the PAI across the landscape in several previous studies [37]. In those studies, topographic factors were proposed to be the most important factors contributing to tree growth and LAI variation in tropical forests. Moser et al. [38] found that the LAI decreased by 40%–60% in the elevation range of 1000–300 m. Unger et al. [39] reported that the LAI significantly decreased in the elevation range of 500–2000 m by about 1.1 per 1000 m. Liu et al. [40] reported a positive correlation between the LAI and soil moisture. However, this positive correlation was only found in clay-rich soil, which indicates that soil texture is one of the relevant factors determining the soil moisture-LAI relationship [41]. At our site, all three topographic factors, TWI, slope, and elevation showed week relationship with the PAI residual values and PAI values, indicating that the variability in the PAI in this study area was less influenced by these factors (Figure 7, Table 2). It has been hypothesized that the variability in the PAI is due to the variation in soil nutrients and properties during succession. In addition, our study site is a special case in that it is a natural ecosystem, affected by anthropogenic activities, such as agriculture, before the establishment of the park, and maintained as pasture land by fire. The study area comprises a mosaic of secondary forest patches, with different age and surrounded with old growth forest. Therefore, some of the sample plots are in the transition zone and/or large trees were partly left in the secondary forests, which probably affected the PAI variability in the recovery model.

5. Conclusions

Study on PAI patterns in the successional forests after disturbance is rare in the tropics. This study demonstrated the combined use of LiDAR data and stand age data derived from Landsat time-series to determine PAI patterns in a forest succession in Khao Yai National Park, Thailand. The PAI values non-linearly increased following forest successional stages with a rapid increase during the first 20 years, twofold increase during the first 40 years or, so but a constant slow increase after 200 years onward. Effects of the topographic factors on PAI values and residuals are less significant or weak in our study.
These findings provide an information of the long-term PAI recovery patterns during successional processes and the spatial variation in the PAI in heterogeneous tropical moist forests following disturbance. This information is very important for understanding the vegetation regrowth and the rate of change in a disturbed area as the large areas of tropical forests have experienced overexploitation, forest fires, and forest degradation. Our study findings can also provide the information on PAI values in tropical forests in Southeast Asia, where such values are still limited. The information on the spatial variation of the PAI in in the successional forests as a consequence of forest disturbance is critically needed for the development of ecological surveys and ground-based sampling strategies for ecological research and conservation. Further study on the effects of soil conditions and seasonal variations of vegetation on the PAI values could improve our understanding of the PAI patterns under various environmental and topographic factors.

Author Contributions

Conceptualization, S.P. and N.K.T.; methodology, S.P.; validation, S.P., N.K.T., S.N. and N.S.; formal analysis, S.P. and N.S.; investigation, S.P., N.K.T., S.N. and N.S.; resources, S.P. and N.K.T.; data curation, S.P. and N.K.T.; writing—original draft preparation, S.P.; writing—review and editing, S.P., N.K.T., S.N. and N.S.; visualization, S.P.; supervision, N.K.T.; project administration, S.P. All authors have read and agreed to the published version of the manuscript.

Funding

This research received no external funding.

Acknowledgments

The authors gratefully thank the support of the National Science and Technology Development Agency (Thailand), Kasetsart University, the Department of National Parks, Wildlife and Plant Conservation (DNP), and the Institute of Research for Development (IRD). Takuji W. Tsusaka of the Natural Resource Management program at the Asian Institute of Technology is acknowledged for helping with the statistical analysis.

Conflicts of Interest

The authors declare no conflict of interest.

References

  1. Estoque, R.C.; Ooba, M.; Avitabile, V.; Hijioka, Y.; Dasgupta, R.; Togawa, T.; Murayama, Y. The future of Southeast Asia’s forests. Nat. Commun. 2019, 10, 1829. [Google Scholar] [CrossRef] [PubMed] [Green Version]
  2. Stibig, H.-J.; Achard, F.; Carboni, S.; Raši, R.; Miettinen, J. Change in tropical forest cover of Southeast Asia from 1990 to 2010. Biogeosciences 2014, 11, 247–258. [Google Scholar] [CrossRef] [Green Version]
  3. Chazdon, R.L. Change and determinism in tropical forest succession. In Tropical Forest Community Ecology; Wiley-Blackwell: Oxford, UK, 2008; pp. 384–408. [Google Scholar]
  4. Lu, D.; Mausel, P.; Brondízio, E.; Moran, E.F. Classification of successional forest stages in the Brazilian Amazon basin. For. Ecol. Manag. 2003, 181, 301–312. [Google Scholar] [CrossRef]
  5. Pena-Claros, M. Changes in Forest Structure and Species Composition during Secondary Forest Succession in the Bolivian Amazon. BIOTROPICA 2003, 35, 450–461. [Google Scholar] [CrossRef]
  6. Brown, S.; Lugo, A.E. Tropical secondary forests. J. Trop. Ecol. 1990, 6, 1–32. [Google Scholar] [CrossRef]
  7. Chanthorn, W.; Ratanapongsai, Y.; Brockelman, W.Y.; Allen, M.A.; Favier, C.; Dubois, M.A. Viewing tropical forest succession as a three-dimensional dynamical system. Theor. Ecol. 2015, 9, 163–172. [Google Scholar] [CrossRef]
  8. Asner, G.P.; Scurlock, J.M.O.; Hicke, J.A. Global synthesis of leaf area index observations: Implications for ecological and remote sensing studies. Glob. Ecol. Biogeogr. 2003, 12, 191–205. [Google Scholar] [CrossRef] [Green Version]
  9. Chen, J.M.; Cihlar, J. Retrieving Leaf Area Index of boreal conifer forests using Landsat TM images. Remote Sens. Environ. 1996, 55, 153–162. [Google Scholar] [CrossRef]
  10. Zheng, G.; Moskal, L.M. Retrieving Leaf Area Index (LAI) Using Remote Sensing: Theories, Methods and Sensors. Sensors 2009, 9, 2719–2745. [Google Scholar] [CrossRef] [Green Version]
  11. Gupta, R.; Sharma, L.K. The process-based forest growth model 3-PG for use in forest management: A review. Ecol. Model. 2019, 397, 55–73. [Google Scholar] [CrossRef]
  12. Zheng, D.; Wang, Y.; Shao, Y.; Wang, L. The Vegetation Dynamics and Climate Change Responses by Leaf Area Index in the Mu Us Desert. Sustainability 2019, 11, 3151. [Google Scholar] [CrossRef] [Green Version]
  13. Olivas, P.C.; Oberbauer, S.F.; Clark, D.B.; Clark, D.; Ryan, M.G.; O’Brien, J.J.; Ordoñez, H. Comparison of direct and indirect methods for assessing leaf area index across a tropical rain forest landscape. Agric. For. Meteorol. 2013, 177, 110–116. [Google Scholar] [CrossRef]
  14. Bréda, N. Ground-based measurements of leaf area index: A review of methods, instruments and current controversies. J. Exp. Bot. 2003, 54, 2403–2417. [Google Scholar] [CrossRef]
  15. Jonckheere, I.; Fleck, S.; Nackaerts, K.; Muys, B.; Coppin, P.; Weiss, M. Review of methods for in situ leaf area index determination Part I. Theories, sensors and hemispherical photography. Agric. For. Meteorol. 2004, 121, 19–35. [Google Scholar] [CrossRef]
  16. Zhu, X.; Skidmore, A.K.; Wang, T.; Liu, J.; Darvishzadeh, R.; Shi, Y.; Premier, J.; Heurich, M. Improving leaf area index (LAI) estimation by correcting for clumping and woody effects using terrestrial laser scanning. Agric. For. Meteorol. 2018, 263, 276–286. [Google Scholar] [CrossRef]
  17. Blinn, C.E.; House, M.N.; Wynne, R.; Thomas, V.; Fox, T.R.; Sumnall, M.J. Landsat 8 Based Leaf Area Index Estimation in Loblolly Pine Plantations. Forests 2019, 10, 222. [Google Scholar] [CrossRef] [Green Version]
  18. Davi, H.; Soudani, K.; Deckx, T.; Dufrene, E.; Le Dantec, V.; François, C. Estimation of forest leaf area index from SPOT imagery using NDVI distribution over forest stands. Int. J. Remote Sens. 2006, 27, 885–902. [Google Scholar] [CrossRef]
  19. She-Zhou, L.; Wang, C.; Gui-Bin, Z.; Xiao-Huan, X.; Gui-Cai, L. Forest Leaf Area Index (LAI) Estimation Using Airborne Discrete-Return Lidar Data. Chin. J. Geophys. 2013, 56, 233–242. [Google Scholar] [CrossRef]
  20. Van Ewijk, K.Y.; Treitz, P.; Scott, N.A. Characterizing Forest Succession in Central Ontario using Lidar-derived Indices. Photogramm. Eng. Remote Sens. 2011, 77, 261–269. [Google Scholar] [CrossRef]
  21. Falkowski, M.J.; Evans, J.; Martinuzzi, S.; Gessler, P.E.; Hudak, A.T. Characterizing forest succession with lidar data: An evaluation for the Inland Northwest, USA. Remote Sens. Environ. 2009, 113, 946–956. [Google Scholar] [CrossRef] [Green Version]
  22. Tang, H.; Dubayah, R.; Swantaran, A.; Hofton, M.A.; Sheldon, S.; Clark, D.B.; Blair, B. Retrieval of vertical LAI profiles over tropical rain forests using waveform lidar at La Selva, Costa Rica. Remote Sens. Environ. 2012, 124, 242–250. [Google Scholar] [CrossRef]
  23. Jensen, J.L.; Humes, K.S.; Vierling, L.A.; Hudak, A.T. Discrete return lidar-based prediction of leaf area index in two conifer forests. Remote Sens. Environ. 2008, 112, 3947–3957. [Google Scholar] [CrossRef] [Green Version]
  24. Morsdorf, F.; Kötz, B.; Meier, E.; Itten, K.; Allgöwer, B. Estimation of LAI and fractional cover from small footprint airborne laser scanning data based on gap fraction. Remote Sens. Environ. 2006, 104, 50–61. [Google Scholar] [CrossRef]
  25. Solberg, S.; Brunner, A.; Hanssen, K.H.; Lange, H.; Næsset, E.; Rautiainen, M.; Stenberg, P. Mapping LAI in a Norway spruce forest using airborne laser scanning. Remote Sens. Environ. 2009, 113, 2317–2327. [Google Scholar] [CrossRef]
  26. Kucharik, C.J.; Norman, J.M.; Gower, S.T. Measurements of branch area and adjusting leaf area index indirect measurements. Agric. For. Meteorol. 1998, 91, 69–88. [Google Scholar] [CrossRef]
  27. Vincent, G.; Antin, C.; Laurans, M.; Heurtebize, J.; Durrieu, S.; LaValley, C.; Dauzat, J. Mapping plant area index of tropical evergreen forest by airborne laser scanning. A cross-validation study using LAI2200 optical sensor. Remote Sens. Environ. 2017, 198, 254–266. [Google Scholar] [CrossRef]
  28. Badreldin, N.; Sánchez-Azofeifa, G.A. Estimating Forest Biomass Dynamics by Integrating Multi-Temporal Landsat Satellite Images with Ground and Airborne LiDAR Data in the Coal Valley Mine, Alberta, Canada. Remote Sens. 2015, 7, 2832–2849. [Google Scholar] [CrossRef] [Green Version]
  29. Deo, R.K.; Russell, M.B.; Domke, G.M.; Woodall, C.; Falkowski, M.J.; Cohen, W.B. Using Landsat Time-series and LiDAR to Inform Aboveground Forest Biomass Baselines in Northern Minnesota, USA. Can. J. Remote Sens. 2016, 43, 28–47. [Google Scholar] [CrossRef]
  30. Jha, N.; Tripathi, N.K.; Chanthorn, W.; Brockelman, W.; Nathalang, A.; Pélissier, R.; Pimmasarn, S.; Ploton, P.; Sasaki, N.; Virdis, S.G.P.; et al. Forest aboveground biomass stock and resilience in a tropical landscape of Thailand. Biogeosciences 2020, 17, 121–134. [Google Scholar] [CrossRef] [Green Version]
  31. Brockelman, W.Y.; Nathalang, A.; Gale, G.A. The Mo Singto forest dynamics plot, Khao Yai National Park, Thailand. Nat. Hist. Bull. Siam Soc. 2011, 57, 35–55. [Google Scholar]
  32. Chanthorn, W.; Hartig, F.; Brockelman, W.Y. Structure and community composition in a tropical forest suggest a change of ecological processes during stand development. For. Ecol. Manag. 2017, 404, 100–107. [Google Scholar] [CrossRef]
  33. Tang, J.; Pilesjö, P. Estimating slope from raster data: A test of eight different algorithms in flat, undulating and steep terrain. River Basin Manag. VI 2011, 146, 143–154. [Google Scholar] [CrossRef] [Green Version]
  34. Mattivi, P.; Franci, F.; Lambertini, A.; Bitelli, G. TWI computation: A comparison of different open source GISs. Open Geospat. Data Softw. Stand. 2019, 4. [Google Scholar] [CrossRef]
  35. FAO. The State of Food and Agriculture 2012; FAO publications: Rome, Italy, 2012. [Google Scholar]
  36. Clark, D.B.; Olivas, P.C.; Oberbauer, S.F.; Clark, D.; Ryan, M.G. First direct landscape-scale measurement of tropical rain forest Leaf Area Index, a key driver of global primary productivity. Ecol. Lett. 2007, 11, 163–172. [Google Scholar] [CrossRef] [PubMed]
  37. Aragão, L.E.O.; Shimabukuro, Y.E.; Espirito-Santo, F.; Williams, M. Landscape pattern and spatial variability of leaf area index in Eastern Amazonia. For. Ecol. Manag. 2005, 211, 240–256. [Google Scholar] [CrossRef]
  38. Moser, G.; Hertel, D.; Leuschner, C. Altitudinal Change in LAI and Stand Leaf Biomass in Tropical Montane Forests: A Transect Study in Ecuador and a Pan-Tropical Meta-Analysis. Ecosystems 2007, 10, 924–935. [Google Scholar] [CrossRef]
  39. Unger, M.; Homeier, J.; Leuschner, C. Relationships among leaf area index, below-canopy light availability and tree diversity along a transect from tropical lowland to montane forests in NE Ecuador. Trop. Ecol. 2013, 54, 33–45. [Google Scholar]
  40. Liu, L.; Zhang, R.; Zuo, Z. The Relationship between Soil Moisture and LAI in Different Types of Soil in Central Eastern China. J. Hydrometeorol. 2016, 17, 2733–2742. [Google Scholar] [CrossRef]
  41. Zhang, W.; Hu, B.; Woods, M.; Brown, G. Characterizing Forest Succession Stages for Wildlife Habitat Assessment Using Multispectral Airborne Imagery. Forests 2017, 8, 234. [Google Scholar] [CrossRef] [Green Version]
Figure 1. Location of the study site in Thailand (a) and in the Khao Yai area (b). The map (c) represents the canopy height in the study site with three stand initiation stage plots (SIS; red dots), three stem exclusion stage plots (SES; blue square), Mo Singto or permanent old growth stage plot (OGS; red rectangle), and 444 Landsat time-series plots (LTS; black squares).
Forests 11 00520 g001
Figure 2. Overall methodology.
Forests 11 00520 g002
Figure 3. Example of PAD voxelization of LiDAR data point clouds applying AMAPVOX software.
Forests 11 00520 g003
Figure 4. Example of the characteristics of the three forest successional stages. Each row represents the Canopy height Model (CHM), three-dimensional (3D) point clouds, and canopy height distribution of each stage, respectively. (ac) represent the characteristics of SIS. (df) represent the characteristics of SES. (gi) represent the characteristics of OGS.
Forests 11 00520 g004
Figure 5. Relationship between PAI and canopy height model for all datasets. The regression model is illustrated by the black line. Red dots represent the PAI in SIS from the successional sample plots, blue dots represent the PAI in SES from successional sample plots, green dots represent PAI in OGS from Mo Singto sample plots, and black dots represent the PAI from LTS sample plots.
Forests 11 00520 g005
Figure 6. Relationship between the PAI estimated from the LiDAR and past time after disturbance (grey dots). The red line represents the fitted power model. Red dots represent the PAI of SIS in successional sample plots. Blue dots represent PAI of SES in successional sample plots. The box plots represent the PAI values of the OGS in Mo Singto plots with a forest age of ~ 200 years. The box edges indicate the 25th and 75th percentiles, the solid line indicates the median.
Forests 11 00520 g006
Figure 7. The left colmn showed the relationship between PAI residuals and (a) topographic wetness index (TWI), (c) elevation, and (e) slope. The right colmn showed the relationship between the PAI values and (b) TWI, (d) elevation, and (f) slope. The color grediants represent the the past time after disturbance.
Forests 11 00520 g007
Figure 8. (a) Map showing the past time after disturbance of LTS sample plots. (b) Map showing the PAI values of LTS sample plots.
Forests 11 00520 g008
Table 1. Means and standard deviations of the PAI, the canopy height, and the age.
MeanPAI (m2 m−2)MeanCHM (m)Age (Years)Number of Sample Plots
Stand initiation stage plots (SIS)4.19 ± 0.39.25 ± 0.38–203
Stem exclusion stage plots (SES)6.63 ± 0.320.22 ± 1.835–413
Old-growth stage plots (OGS) 8.92 ± 0.6521.87 ± 2.71>20060
Table 2. Effects of topographic factors on PAI values and residual values using stepwise multiple regression analysis.
DescriptionCoefficientsp-ValueS.E.t Stat
Depedent PAI value
Slope0.10156 **0.0000.020964.85
Elevation−0.30905 *0.0170.12877−2.40
Elevation20.00020 *0.0200.000082.33
Intercept126.02670 *0.01048.829042.58
Dependent PAI residual value
Slope−0.11043 *0.0160.04588−2.41
Elevation0.158340.0700.087281.81
Elevation2−0.000110.0570.00006−1.91
Intercept−56.768720.08833.20418−1.71
Note: * Significant coefficients at the 95% confidence level; ** Significant coefficients at the 99% confidence level. S.E. = Standard error.

